Alaska Native vs U.S. Virgin Islander Female Disability
COMPARE
Alaska Native
U.S. Virgin Islander
Female Disability
Female Disability Comparison
Alaska Natives
U.S. Virgin Islanders
12.8%
FEMALE DISABILITY
0.6/ 100
METRIC RATING
264th/ 347
METRIC RANK
13.1%
FEMALE DISABILITY
0.1/ 100
METRIC RATING
281st/ 347
METRIC RANK
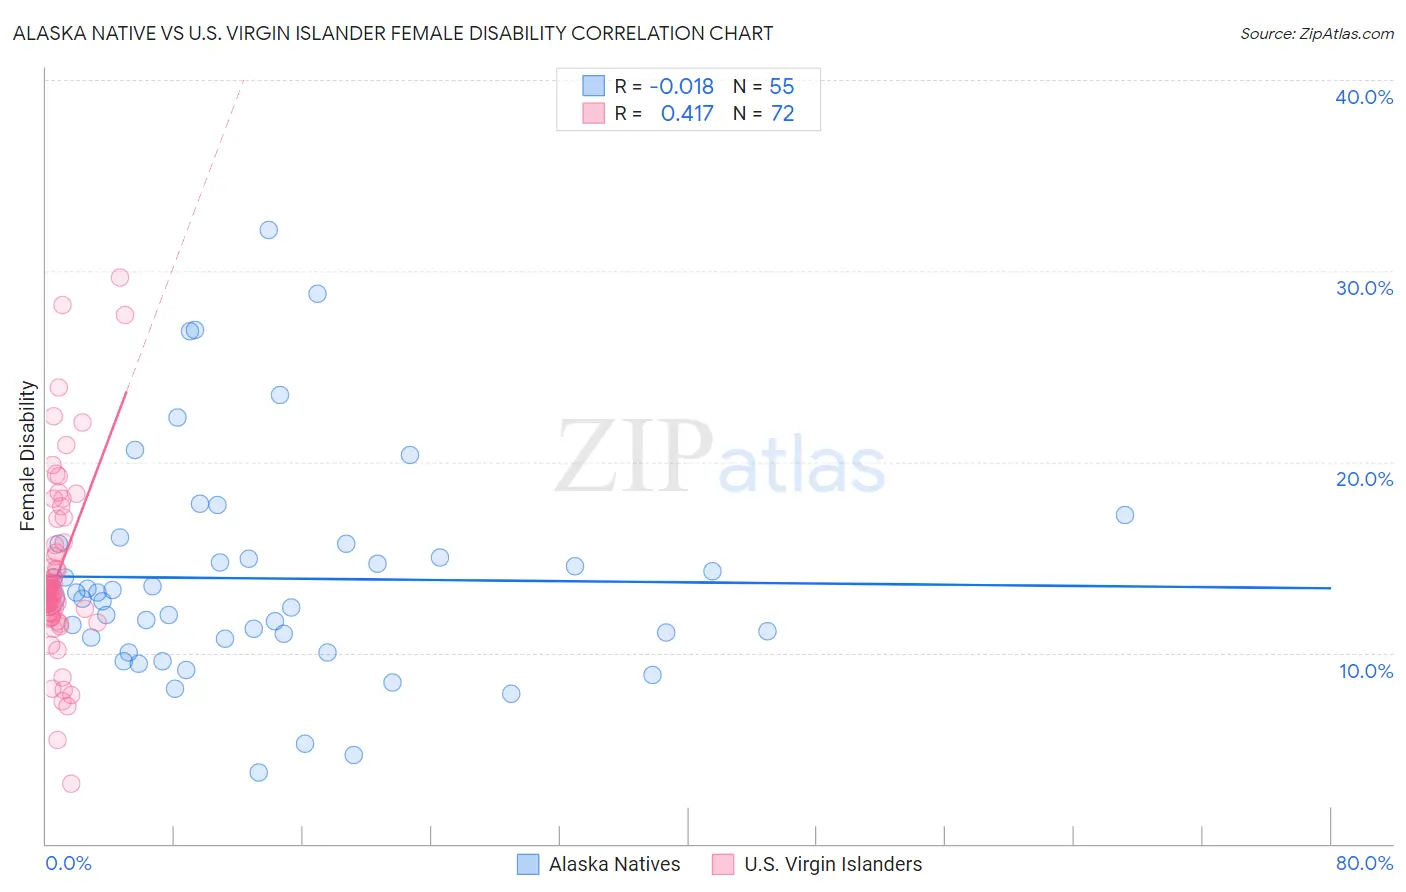
Alaska Native vs U.S. Virgin Islander Female Disability Correlation Chart
The statistical analysis conducted on geographies consisting of 76,769,198 people shows no correlation between the proportion of Alaska Natives and percentage of females with a disability in the United States with a correlation coefficient (R) of -0.018 and weighted average of 12.8%. Similarly, the statistical analysis conducted on geographies consisting of 87,518,599 people shows a moderate positive correlation between the proportion of U.S. Virgin Islanders and percentage of females with a disability in the United States with a correlation coefficient (R) of 0.417 and weighted average of 13.1%, a difference of 2.2%.
Female Disability Correlation Summary
| Measurement | Alaska Native | U.S. Virgin Islander |
| Minimum | 3.8% | 3.2% |
| Maximum | 32.1% | 29.7% |
| Range | 28.4% | 26.5% |
| Mean | 13.9% | 14.2% |
| Median | 12.9% | 13.3% |
| Interquartile 25% (IQ1) | 10.7% | 12.0% |
| Interquartile 75% (IQ3) | 15.7% | 15.7% |
| Interquartile Range (IQR) | 5.0% | 3.8% |
| Standard Deviation (Sample) | 5.7% | 4.8% |
| Standard Deviation (Population) | 5.7% | 4.8% |
Demographics Similar to Alaska Natives and U.S. Virgin Islanders by Female Disability
In terms of female disability, the demographic groups most similar to Alaska Natives are Spaniard (12.8%, a difference of 0.12%), West Indian (12.8%, a difference of 0.19%), Finnish (12.8%, a difference of 0.31%), Senegalese (12.8%, a difference of 0.32%), and Czechoslovakian (12.7%, a difference of 0.35%). Similarly, the demographic groups most similar to U.S. Virgin Islanders are Irish (13.1%, a difference of 0.030%), Welsh (13.1%, a difference of 0.080%), Arapaho (13.0%, a difference of 0.12%), Scottish (13.0%, a difference of 0.36%), and Spanish (13.0%, a difference of 0.45%).
| Demographics | Rating | Rank | Female Disability |
| Czechoslovakians | 0.9 /100 | #262 | Tragic 12.7% |
| Spaniards | 0.7 /100 | #263 | Tragic 12.8% |
| Alaska Natives | 0.6 /100 | #264 | Tragic 12.8% |
| West Indians | 0.5 /100 | #265 | Tragic 12.8% |
| Finns | 0.4 /100 | #266 | Tragic 12.8% |
| Senegalese | 0.4 /100 | #267 | Tragic 12.8% |
| Immigrants | Laos | 0.4 /100 | #268 | Tragic 12.8% |
| Indonesians | 0.4 /100 | #269 | Tragic 12.8% |
| Immigrants | Liberia | 0.3 /100 | #270 | Tragic 12.9% |
| Dutch | 0.2 /100 | #271 | Tragic 12.9% |
| Germans | 0.1 /100 | #272 | Tragic 12.9% |
| Sioux | 0.1 /100 | #273 | Tragic 12.9% |
| Portuguese | 0.1 /100 | #274 | Tragic 13.0% |
| Cheyenne | 0.1 /100 | #275 | Tragic 13.0% |
| Immigrants | Dominica | 0.1 /100 | #276 | Tragic 13.0% |
| Spanish | 0.1 /100 | #277 | Tragic 13.0% |
| Scottish | 0.1 /100 | #278 | Tragic 13.0% |
| Arapaho | 0.1 /100 | #279 | Tragic 13.0% |
| Irish | 0.1 /100 | #280 | Tragic 13.1% |
| U.S. Virgin Islanders | 0.1 /100 | #281 | Tragic 13.1% |
| Welsh | 0.0 /100 | #282 | Tragic 13.1% |