Alaska Native vs Immigrants from Belgium Female Disability
COMPARE
Alaska Native
Immigrants from Belgium
Female Disability
Female Disability Comparison
Alaska Natives
Immigrants from Belgium
12.8%
FEMALE DISABILITY
0.6/ 100
METRIC RATING
264th/ 347
METRIC RANK
11.3%
FEMALE DISABILITY
100.0/ 100
METRIC RATING
51st/ 347
METRIC RANK
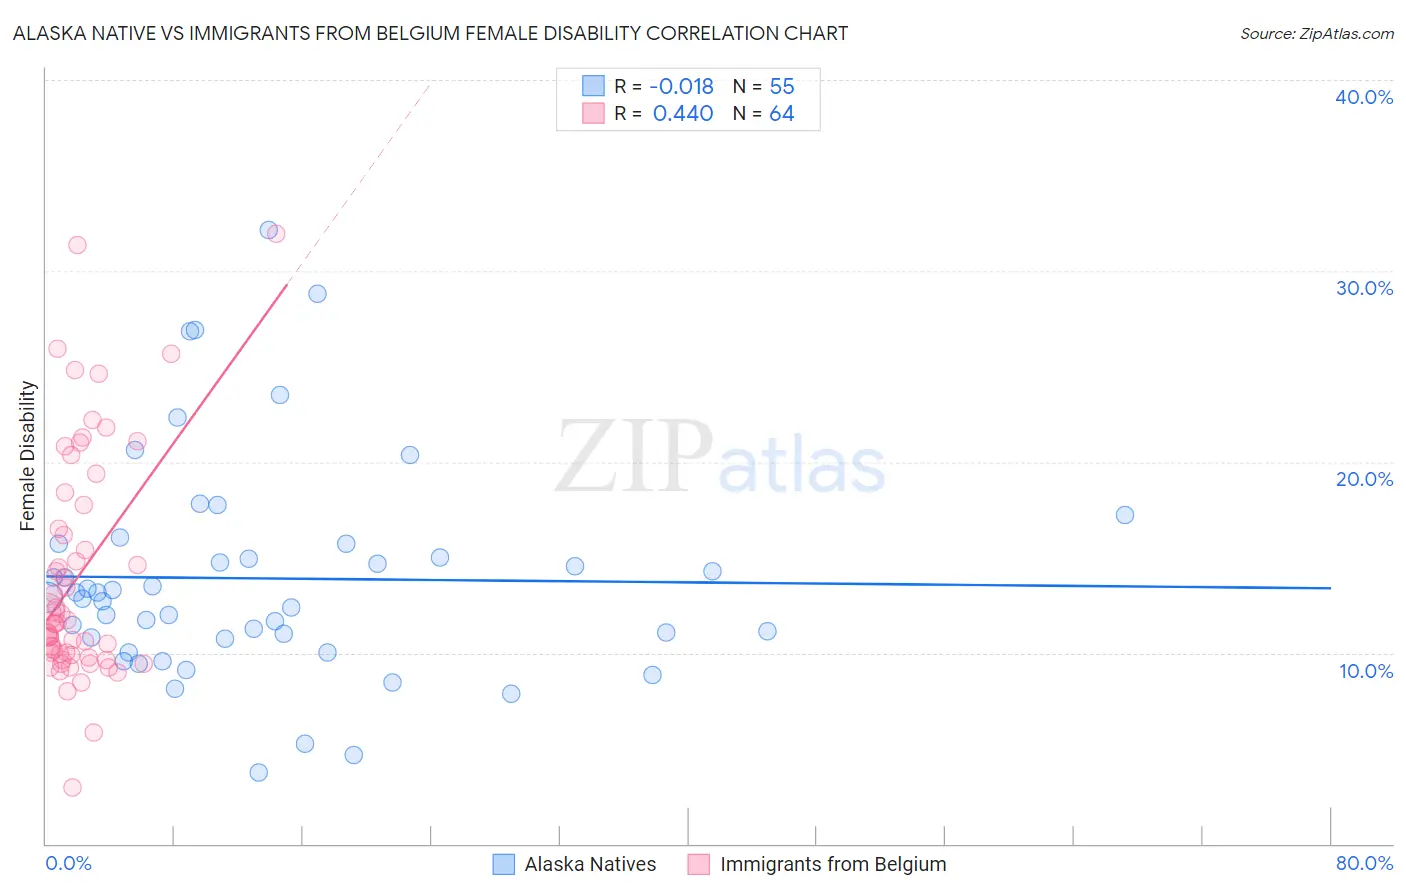
Alaska Native vs Immigrants from Belgium Female Disability Correlation Chart
The statistical analysis conducted on geographies consisting of 76,769,198 people shows no correlation between the proportion of Alaska Natives and percentage of females with a disability in the United States with a correlation coefficient (R) of -0.018 and weighted average of 12.8%. Similarly, the statistical analysis conducted on geographies consisting of 146,716,941 people shows a moderate positive correlation between the proportion of Immigrants from Belgium and percentage of females with a disability in the United States with a correlation coefficient (R) of 0.440 and weighted average of 11.3%, a difference of 13.0%.
Female Disability Correlation Summary
| Measurement | Alaska Native | Immigrants from Belgium |
| Minimum | 3.8% | 2.9% |
| Maximum | 32.1% | 31.9% |
| Range | 28.4% | 29.0% |
| Mean | 13.9% | 14.0% |
| Median | 12.9% | 11.5% |
| Interquartile 25% (IQ1) | 10.7% | 9.9% |
| Interquartile 75% (IQ3) | 15.7% | 17.1% |
| Interquartile Range (IQR) | 5.0% | 7.2% |
| Standard Deviation (Sample) | 5.7% | 6.0% |
| Standard Deviation (Population) | 5.7% | 6.0% |
Similar Demographics by Female Disability
Demographics Similar to Alaska Natives by Female Disability
In terms of female disability, the demographic groups most similar to Alaska Natives are Spaniard (12.8%, a difference of 0.12%), West Indian (12.8%, a difference of 0.19%), Finnish (12.8%, a difference of 0.31%), Senegalese (12.8%, a difference of 0.32%), and Czechoslovakian (12.7%, a difference of 0.35%).
| Demographics | Rating | Rank | Female Disability |
| Liberians | 1.1 /100 | #257 | Tragic 12.7% |
| Aleuts | 1.1 /100 | #258 | Tragic 12.7% |
| Immigrants | Armenia | 1.0 /100 | #259 | Tragic 12.7% |
| Sub-Saharan Africans | 1.0 /100 | #260 | Tragic 12.7% |
| Bermudans | 1.0 /100 | #261 | Tragic 12.7% |
| Czechoslovakians | 0.9 /100 | #262 | Tragic 12.7% |
| Spaniards | 0.7 /100 | #263 | Tragic 12.8% |
| Alaska Natives | 0.6 /100 | #264 | Tragic 12.8% |
| West Indians | 0.5 /100 | #265 | Tragic 12.8% |
| Finns | 0.4 /100 | #266 | Tragic 12.8% |
| Senegalese | 0.4 /100 | #267 | Tragic 12.8% |
| Immigrants | Laos | 0.4 /100 | #268 | Tragic 12.8% |
| Indonesians | 0.4 /100 | #269 | Tragic 12.8% |
| Immigrants | Liberia | 0.3 /100 | #270 | Tragic 12.9% |
| Dutch | 0.2 /100 | #271 | Tragic 12.9% |
Demographics Similar to Immigrants from Belgium by Female Disability
In terms of female disability, the demographic groups most similar to Immigrants from Belgium are Inupiat (11.3%, a difference of 0.080%), Immigrants from Peru (11.3%, a difference of 0.12%), Immigrants from Saudi Arabia (11.3%, a difference of 0.16%), Peruvian (11.3%, a difference of 0.22%), and Bulgarian (11.3%, a difference of 0.24%).
| Demographics | Rating | Rank | Female Disability |
| Cambodians | 100.0 /100 | #44 | Exceptional 11.3% |
| Immigrants | Sweden | 100.0 /100 | #45 | Exceptional 11.3% |
| Immigrants | Nepal | 100.0 /100 | #46 | Exceptional 11.3% |
| Jordanians | 100.0 /100 | #47 | Exceptional 11.3% |
| Zimbabweans | 100.0 /100 | #48 | Exceptional 11.3% |
| Tongans | 100.0 /100 | #49 | Exceptional 11.3% |
| Inupiat | 100.0 /100 | #50 | Exceptional 11.3% |
| Immigrants | Belgium | 100.0 /100 | #51 | Exceptional 11.3% |
| Immigrants | Peru | 99.9 /100 | #52 | Exceptional 11.3% |
| Immigrants | Saudi Arabia | 99.9 /100 | #53 | Exceptional 11.3% |
| Peruvians | 99.9 /100 | #54 | Exceptional 11.3% |
| Bulgarians | 99.9 /100 | #55 | Exceptional 11.3% |
| Taiwanese | 99.9 /100 | #56 | Exceptional 11.4% |
| South Americans | 99.9 /100 | #57 | Exceptional 11.4% |
| Laotians | 99.9 /100 | #58 | Exceptional 11.4% |