Immigrants from Bulgaria vs U.S. Virgin Islander Female Disability
COMPARE
Immigrants from Bulgaria
U.S. Virgin Islander
Female Disability
Female Disability Comparison
Immigrants from Bulgaria
U.S. Virgin Islanders
11.4%
FEMALE DISABILITY
99.9/ 100
METRIC RATING
60th/ 347
METRIC RANK
13.1%
FEMALE DISABILITY
0.1/ 100
METRIC RATING
281st/ 347
METRIC RANK
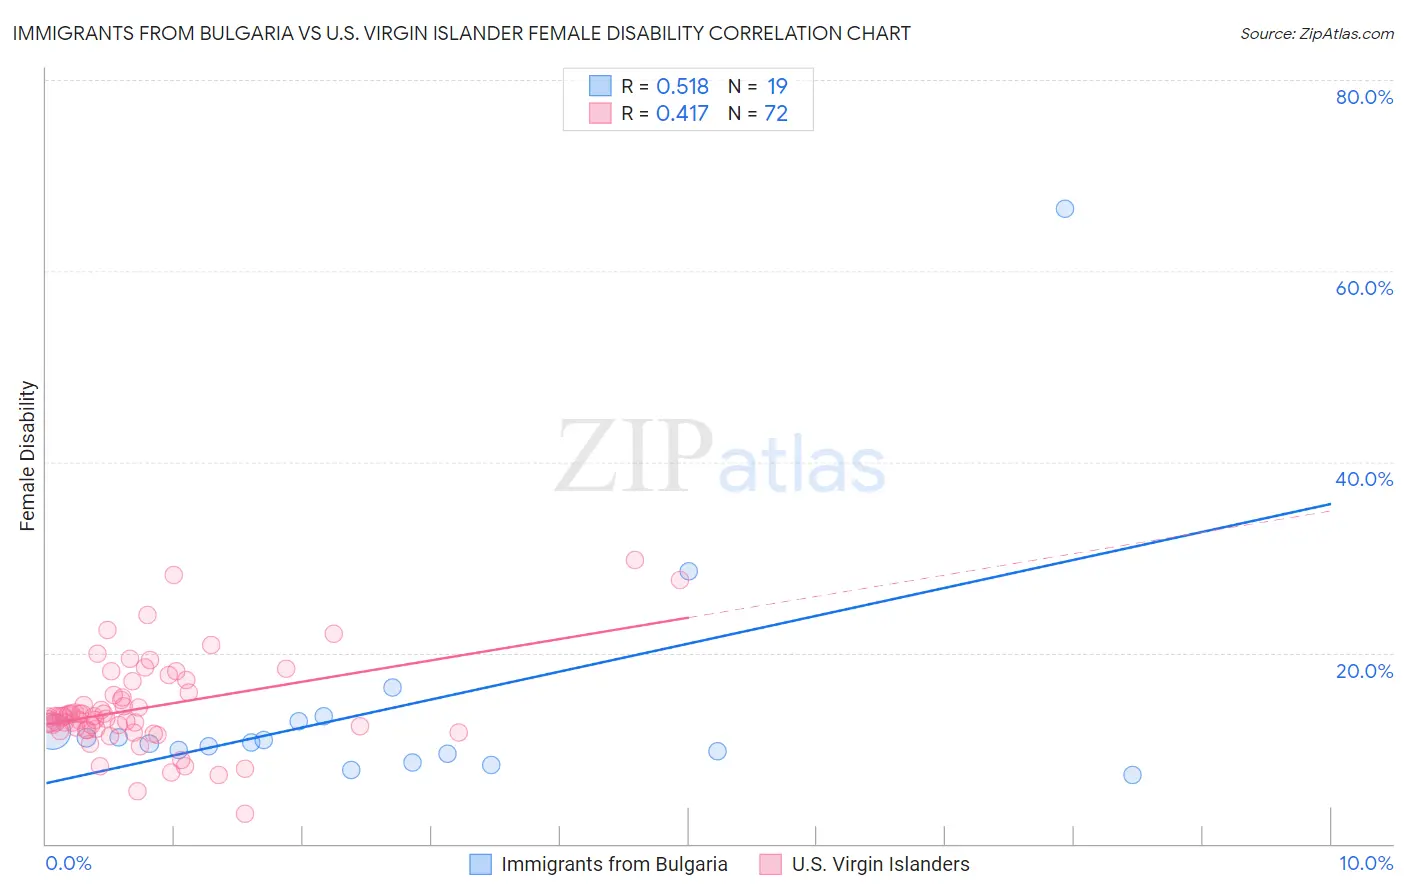
Immigrants from Bulgaria vs U.S. Virgin Islander Female Disability Correlation Chart
The statistical analysis conducted on geographies consisting of 172,548,429 people shows a substantial positive correlation between the proportion of Immigrants from Bulgaria and percentage of females with a disability in the United States with a correlation coefficient (R) of 0.518 and weighted average of 11.4%. Similarly, the statistical analysis conducted on geographies consisting of 87,518,599 people shows a moderate positive correlation between the proportion of U.S. Virgin Islanders and percentage of females with a disability in the United States with a correlation coefficient (R) of 0.417 and weighted average of 13.1%, a difference of 14.6%.
Female Disability Correlation Summary
| Measurement | Immigrants from Bulgaria | U.S. Virgin Islander |
| Minimum | 7.2% | 3.2% |
| Maximum | 66.5% | 29.7% |
| Range | 59.3% | 26.5% |
| Mean | 14.4% | 14.2% |
| Median | 10.7% | 13.3% |
| Interquartile 25% (IQ1) | 9.4% | 12.0% |
| Interquartile 75% (IQ3) | 12.9% | 15.7% |
| Interquartile Range (IQR) | 3.5% | 3.8% |
| Standard Deviation (Sample) | 13.4% | 4.8% |
| Standard Deviation (Population) | 13.1% | 4.8% |
Similar Demographics by Female Disability
Demographics Similar to Immigrants from Bulgaria by Female Disability
In terms of female disability, the demographic groups most similar to Immigrants from Bulgaria are Immigrants from France (11.4%, a difference of 0.060%), Immigrants from Spain (11.4%, a difference of 0.11%), Sri Lankan (11.4%, a difference of 0.15%), Laotian (11.4%, a difference of 0.25%), and Immigrants from Colombia (11.4%, a difference of 0.26%).
| Demographics | Rating | Rank | Female Disability |
| Immigrants | Saudi Arabia | 99.9 /100 | #53 | Exceptional 11.3% |
| Peruvians | 99.9 /100 | #54 | Exceptional 11.3% |
| Bulgarians | 99.9 /100 | #55 | Exceptional 11.3% |
| Taiwanese | 99.9 /100 | #56 | Exceptional 11.4% |
| South Americans | 99.9 /100 | #57 | Exceptional 11.4% |
| Laotians | 99.9 /100 | #58 | Exceptional 11.4% |
| Immigrants | Spain | 99.9 /100 | #59 | Exceptional 11.4% |
| Immigrants | Bulgaria | 99.9 /100 | #60 | Exceptional 11.4% |
| Immigrants | France | 99.9 /100 | #61 | Exceptional 11.4% |
| Sri Lankans | 99.9 /100 | #62 | Exceptional 11.4% |
| Immigrants | Colombia | 99.9 /100 | #63 | Exceptional 11.4% |
| Immigrants | El Salvador | 99.9 /100 | #64 | Exceptional 11.4% |
| Immigrants | South America | 99.9 /100 | #65 | Exceptional 11.4% |
| Salvadorans | 99.8 /100 | #66 | Exceptional 11.5% |
| Immigrants | Vietnam | 99.8 /100 | #67 | Exceptional 11.5% |
Demographics Similar to U.S. Virgin Islanders by Female Disability
In terms of female disability, the demographic groups most similar to U.S. Virgin Islanders are Irish (13.1%, a difference of 0.030%), Welsh (13.1%, a difference of 0.080%), English (13.1%, a difference of 0.080%), Arapaho (13.0%, a difference of 0.12%), and Hmong (13.1%, a difference of 0.22%).
| Demographics | Rating | Rank | Female Disability |
| Portuguese | 0.1 /100 | #274 | Tragic 13.0% |
| Cheyenne | 0.1 /100 | #275 | Tragic 13.0% |
| Immigrants | Dominica | 0.1 /100 | #276 | Tragic 13.0% |
| Spanish | 0.1 /100 | #277 | Tragic 13.0% |
| Scottish | 0.1 /100 | #278 | Tragic 13.0% |
| Arapaho | 0.1 /100 | #279 | Tragic 13.0% |
| Irish | 0.1 /100 | #280 | Tragic 13.1% |
| U.S. Virgin Islanders | 0.1 /100 | #281 | Tragic 13.1% |
| Welsh | 0.0 /100 | #282 | Tragic 13.1% |
| English | 0.0 /100 | #283 | Tragic 13.1% |
| Hmong | 0.0 /100 | #284 | Tragic 13.1% |
| Bangladeshis | 0.0 /100 | #285 | Tragic 13.1% |
| Fijians | 0.0 /100 | #286 | Tragic 13.1% |
| Yaqui | 0.0 /100 | #287 | Tragic 13.2% |
| Whites/Caucasians | 0.0 /100 | #288 | Tragic 13.2% |