Alaska Native vs Slavic Female Disability
COMPARE
Alaska Native
Slavic
Female Disability
Female Disability Comparison
Alaska Natives
Slavs
12.8%
FEMALE DISABILITY
0.6/ 100
METRIC RATING
264th/ 347
METRIC RANK
12.6%
FEMALE DISABILITY
3.8/ 100
METRIC RATING
237th/ 347
METRIC RANK
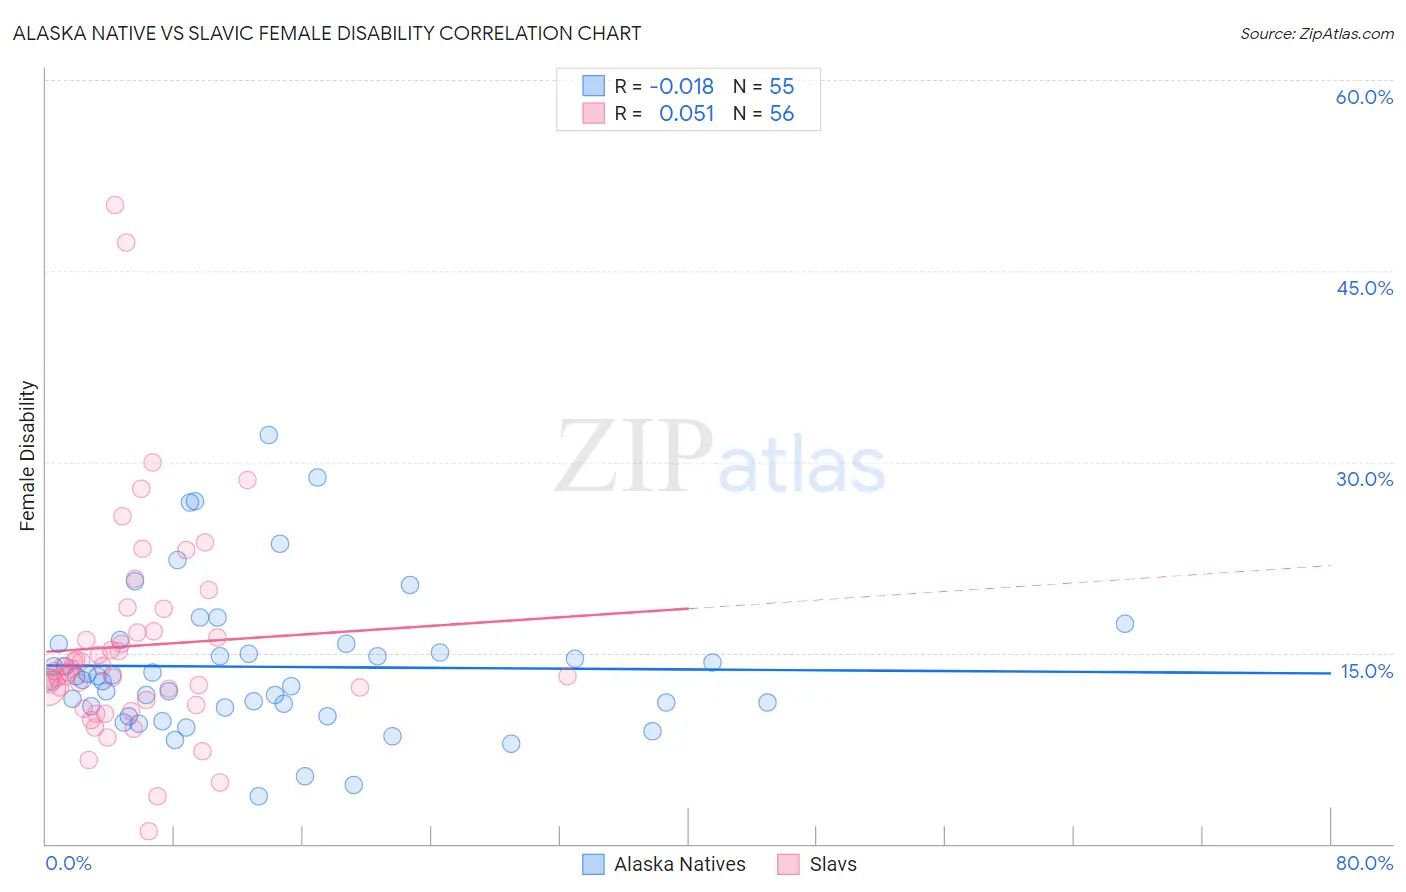
Alaska Native vs Slavic Female Disability Correlation Chart
The statistical analysis conducted on geographies consisting of 76,769,198 people shows no correlation between the proportion of Alaska Natives and percentage of females with a disability in the United States with a correlation coefficient (R) of -0.018 and weighted average of 12.8%. Similarly, the statistical analysis conducted on geographies consisting of 270,849,330 people shows a slight positive correlation between the proportion of Slavs and percentage of females with a disability in the United States with a correlation coefficient (R) of 0.051 and weighted average of 12.6%, a difference of 1.7%.
Female Disability Correlation Summary
| Measurement | Alaska Native | Slavic |
| Minimum | 3.8% | 1.0% |
| Maximum | 32.1% | 50.2% |
| Range | 28.4% | 49.2% |
| Mean | 13.9% | 15.5% |
| Median | 12.9% | 13.5% |
| Interquartile 25% (IQ1) | 10.7% | 11.1% |
| Interquartile 75% (IQ3) | 15.7% | 16.6% |
| Interquartile Range (IQR) | 5.0% | 5.6% |
| Standard Deviation (Sample) | 5.7% | 8.7% |
| Standard Deviation (Population) | 5.7% | 8.6% |
Similar Demographics by Female Disability
Demographics Similar to Alaska Natives by Female Disability
In terms of female disability, the demographic groups most similar to Alaska Natives are Spaniard (12.8%, a difference of 0.12%), West Indian (12.8%, a difference of 0.19%), Finnish (12.8%, a difference of 0.31%), Senegalese (12.8%, a difference of 0.32%), and Czechoslovakian (12.7%, a difference of 0.35%).
| Demographics | Rating | Rank | Female Disability |
| Liberians | 1.1 /100 | #257 | Tragic 12.7% |
| Aleuts | 1.1 /100 | #258 | Tragic 12.7% |
| Immigrants | Armenia | 1.0 /100 | #259 | Tragic 12.7% |
| Sub-Saharan Africans | 1.0 /100 | #260 | Tragic 12.7% |
| Bermudans | 1.0 /100 | #261 | Tragic 12.7% |
| Czechoslovakians | 0.9 /100 | #262 | Tragic 12.7% |
| Spaniards | 0.7 /100 | #263 | Tragic 12.8% |
| Alaska Natives | 0.6 /100 | #264 | Tragic 12.8% |
| West Indians | 0.5 /100 | #265 | Tragic 12.8% |
| Finns | 0.4 /100 | #266 | Tragic 12.8% |
| Senegalese | 0.4 /100 | #267 | Tragic 12.8% |
| Immigrants | Laos | 0.4 /100 | #268 | Tragic 12.8% |
| Indonesians | 0.4 /100 | #269 | Tragic 12.8% |
| Immigrants | Liberia | 0.3 /100 | #270 | Tragic 12.9% |
| Dutch | 0.2 /100 | #271 | Tragic 12.9% |
Demographics Similar to Slavs by Female Disability
In terms of female disability, the demographic groups most similar to Slavs are Yugoslavian (12.6%, a difference of 0.030%), Barbadian (12.6%, a difference of 0.060%), Immigrants from West Indies (12.6%, a difference of 0.13%), German Russian (12.6%, a difference of 0.15%), and Malaysian (12.5%, a difference of 0.26%).
| Demographics | Rating | Rank | Female Disability |
| Immigrants | Belize | 7.0 /100 | #230 | Tragic 12.5% |
| Belgians | 6.5 /100 | #231 | Tragic 12.5% |
| Immigrants | Somalia | 5.9 /100 | #232 | Tragic 12.5% |
| Immigrants | Iraq | 5.3 /100 | #233 | Tragic 12.5% |
| Scandinavians | 5.3 /100 | #234 | Tragic 12.5% |
| Malaysians | 5.0 /100 | #235 | Tragic 12.5% |
| Immigrants | West Indies | 4.4 /100 | #236 | Tragic 12.6% |
| Slavs | 3.8 /100 | #237 | Tragic 12.6% |
| Yugoslavians | 3.7 /100 | #238 | Tragic 12.6% |
| Barbadians | 3.6 /100 | #239 | Tragic 12.6% |
| German Russians | 3.2 /100 | #240 | Tragic 12.6% |
| Japanese | 2.7 /100 | #241 | Tragic 12.6% |
| Canadians | 2.6 /100 | #242 | Tragic 12.6% |
| Immigrants | Senegal | 2.5 /100 | #243 | Tragic 12.6% |
| Alsatians | 2.5 /100 | #244 | Tragic 12.6% |