Alaska Native vs U.S. Virgin Islander No Schooling Completed
COMPARE
Alaska Native
U.S. Virgin Islander
No Schooling Completed
No Schooling Completed Comparison
Alaska Natives
U.S. Virgin Islanders
1.5%
NO SCHOOLING COMPLETED
100.0/ 100
METRIC RATING
22nd/ 347
METRIC RANK
2.3%
NO SCHOOLING COMPLETED
3.7/ 100
METRIC RATING
228th/ 347
METRIC RANK
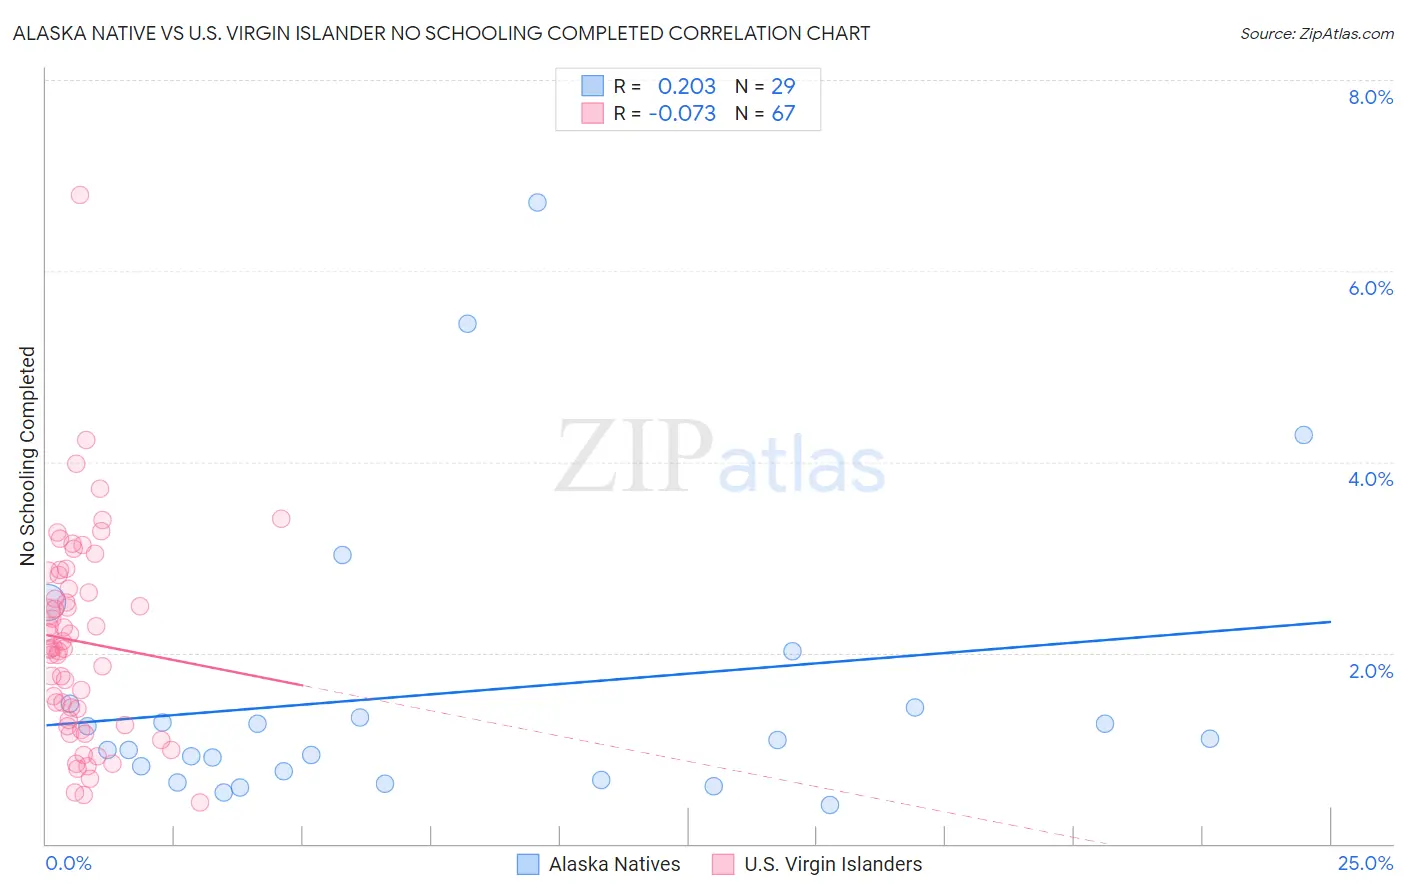
Alaska Native vs U.S. Virgin Islander No Schooling Completed Correlation Chart
The statistical analysis conducted on geographies consisting of 76,332,603 people shows a weak positive correlation between the proportion of Alaska Natives and percentage of population with no schooling in the United States with a correlation coefficient (R) of 0.203 and weighted average of 1.5%. Similarly, the statistical analysis conducted on geographies consisting of 87,394,001 people shows a slight negative correlation between the proportion of U.S. Virgin Islanders and percentage of population with no schooling in the United States with a correlation coefficient (R) of -0.073 and weighted average of 2.3%, a difference of 57.4%.
No Schooling Completed Correlation Summary
| Measurement | Alaska Native | U.S. Virgin Islander |
| Minimum | 0.40% | 0.43% |
| Maximum | 6.7% | 6.8% |
| Range | 6.3% | 6.4% |
| Mean | 1.6% | 2.1% |
| Median | 1.1% | 2.0% |
| Interquartile 25% (IQ1) | 0.71% | 1.2% |
| Interquartile 75% (IQ3) | 1.4% | 2.8% |
| Interquartile Range (IQR) | 0.74% | 1.6% |
| Standard Deviation (Sample) | 1.5% | 1.1% |
| Standard Deviation (Population) | 1.5% | 1.1% |
Similar Demographics by No Schooling Completed
Demographics Similar to Alaska Natives by No Schooling Completed
In terms of no schooling completed, the demographic groups most similar to Alaska Natives are Chinese (1.5%, a difference of 0.090%), European (1.5%, a difference of 0.25%), Welsh (1.5%, a difference of 0.46%), Alaskan Athabascan (1.5%, a difference of 0.58%), and Pennsylvania German (1.5%, a difference of 0.61%).
| Demographics | Rating | Rank | No Schooling Completed |
| Tlingit-Haida | 100.0 /100 | #15 | Exceptional 1.5% |
| Finns | 100.0 /100 | #16 | Exceptional 1.5% |
| Croatians | 100.0 /100 | #17 | Exceptional 1.5% |
| Danes | 100.0 /100 | #18 | Exceptional 1.5% |
| Alaskan Athabascans | 100.0 /100 | #19 | Exceptional 1.5% |
| Welsh | 100.0 /100 | #20 | Exceptional 1.5% |
| Chinese | 100.0 /100 | #21 | Exceptional 1.5% |
| Alaska Natives | 100.0 /100 | #22 | Exceptional 1.5% |
| Europeans | 100.0 /100 | #23 | Exceptional 1.5% |
| Pennsylvania Germans | 100.0 /100 | #24 | Exceptional 1.5% |
| French | 100.0 /100 | #25 | Exceptional 1.5% |
| Czechs | 100.0 /100 | #26 | Exceptional 1.5% |
| Scandinavians | 100.0 /100 | #27 | Exceptional 1.5% |
| French Canadians | 100.0 /100 | #28 | Exceptional 1.5% |
| Lumbee | 100.0 /100 | #29 | Exceptional 1.5% |
Demographics Similar to U.S. Virgin Islanders by No Schooling Completed
In terms of no schooling completed, the demographic groups most similar to U.S. Virgin Islanders are Immigrants from Pakistan (2.3%, a difference of 0.080%), Puerto Rican (2.3%, a difference of 0.22%), Immigrants from Uruguay (2.3%, a difference of 0.24%), Immigrants from Uganda (2.3%, a difference of 0.29%), and Sierra Leonean (2.3%, a difference of 0.34%).
| Demographics | Rating | Rank | No Schooling Completed |
| Immigrants | Sudan | 5.0 /100 | #221 | Tragic 2.3% |
| Sub-Saharan Africans | 4.7 /100 | #222 | Tragic 2.3% |
| Immigrants | Lebanon | 4.5 /100 | #223 | Tragic 2.3% |
| Tohono O'odham | 4.1 /100 | #224 | Tragic 2.3% |
| Sudanese | 4.1 /100 | #225 | Tragic 2.3% |
| Sierra Leoneans | 4.1 /100 | #226 | Tragic 2.3% |
| Immigrants | Uganda | 4.0 /100 | #227 | Tragic 2.3% |
| U.S. Virgin Islanders | 3.7 /100 | #228 | Tragic 2.3% |
| Immigrants | Pakistan | 3.6 /100 | #229 | Tragic 2.3% |
| Puerto Ricans | 3.4 /100 | #230 | Tragic 2.3% |
| Immigrants | Uruguay | 3.4 /100 | #231 | Tragic 2.3% |
| Colombians | 3.2 /100 | #232 | Tragic 2.3% |
| Immigrants | Malaysia | 2.8 /100 | #233 | Tragic 2.3% |
| Nigerians | 2.6 /100 | #234 | Tragic 2.3% |
| Immigrants | Western Asia | 2.6 /100 | #235 | Tragic 2.3% |