Alaska Native vs U.S. Virgin Islander In Labor Force | Age 45-54
COMPARE
Alaska Native
U.S. Virgin Islander
In Labor Force | Age 45-54
In Labor Force | Age 45-54 Comparison
Alaska Natives
U.S. Virgin Islanders
81.8%
IN LABOR FORCE | AGE 45-54
0.4/ 100
METRIC RATING
245th/ 347
METRIC RANK
81.2%
IN LABOR FORCE | AGE 45-54
0.0/ 100
METRIC RATING
276th/ 347
METRIC RANK
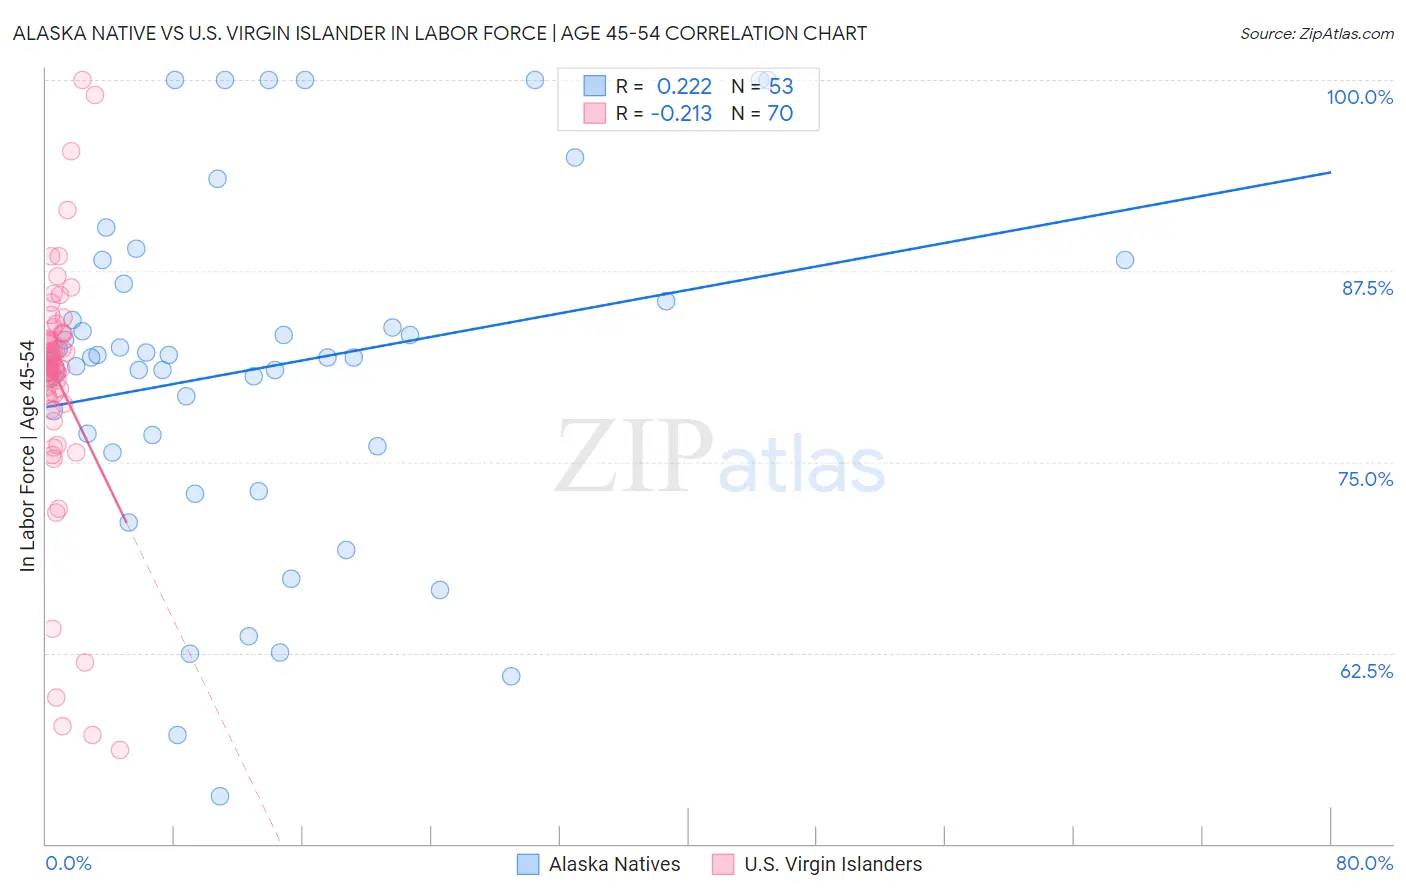
Alaska Native vs U.S. Virgin Islander In Labor Force | Age 45-54 Correlation Chart
The statistical analysis conducted on geographies consisting of 76,757,853 people shows a weak positive correlation between the proportion of Alaska Natives and labor force participation rate among population between the ages 45 and 54 in the United States with a correlation coefficient (R) of 0.222 and weighted average of 81.8%. Similarly, the statistical analysis conducted on geographies consisting of 87,510,116 people shows a weak negative correlation between the proportion of U.S. Virgin Islanders and labor force participation rate among population between the ages 45 and 54 in the United States with a correlation coefficient (R) of -0.213 and weighted average of 81.2%, a difference of 0.70%.
In Labor Force | Age 45-54 Correlation Summary
| Measurement | Alaska Native | U.S. Virgin Islander |
| Minimum | 53.1% | 56.1% |
| Maximum | 100.0% | 100.0% |
| Range | 46.9% | 43.9% |
| Mean | 81.2% | 80.3% |
| Median | 81.8% | 81.2% |
| Interquartile 25% (IQ1) | 75.8% | 79.4% |
| Interquartile 75% (IQ3) | 87.4% | 83.4% |
| Interquartile Range (IQR) | 11.6% | 4.0% |
| Standard Deviation (Sample) | 11.5% | 8.1% |
| Standard Deviation (Population) | 11.4% | 8.0% |
Similar Demographics by In Labor Force | Age 45-54
Demographics Similar to Alaska Natives by In Labor Force | Age 45-54
In terms of in labor force | age 45-54, the demographic groups most similar to Alaska Natives are Celtic (81.8%, a difference of 0.010%), Alaskan Athabascan (81.8%, a difference of 0.010%), Central American (81.7%, a difference of 0.020%), Puget Sound Salish (81.7%, a difference of 0.050%), and Hmong (81.7%, a difference of 0.070%).
| Demographics | Rating | Rank | In Labor Force | Age 45-54 |
| Trinidadians and Tobagonians | 1.1 /100 | #238 | Tragic 81.9% |
| Immigrants | Thailand | 1.0 /100 | #239 | Tragic 81.9% |
| Immigrants | El Salvador | 1.0 /100 | #240 | Tragic 81.9% |
| Immigrants | Cambodia | 0.8 /100 | #241 | Tragic 81.9% |
| Whites/Caucasians | 0.7 /100 | #242 | Tragic 81.9% |
| Samoans | 0.6 /100 | #243 | Tragic 81.8% |
| Celtics | 0.4 /100 | #244 | Tragic 81.8% |
| Alaska Natives | 0.4 /100 | #245 | Tragic 81.8% |
| Alaskan Athabascans | 0.4 /100 | #246 | Tragic 81.8% |
| Central Americans | 0.4 /100 | #247 | Tragic 81.7% |
| Puget Sound Salish | 0.3 /100 | #248 | Tragic 81.7% |
| Hmong | 0.3 /100 | #249 | Tragic 81.7% |
| Immigrants | Armenia | 0.2 /100 | #250 | Tragic 81.7% |
| Guamanians/Chamorros | 0.2 /100 | #251 | Tragic 81.6% |
| Pennsylvania Germans | 0.2 /100 | #252 | Tragic 81.6% |
Demographics Similar to U.S. Virgin Islanders by In Labor Force | Age 45-54
In terms of in labor force | age 45-54, the demographic groups most similar to U.S. Virgin Islanders are Guatemalan (81.2%, a difference of 0.020%), Nonimmigrants (81.2%, a difference of 0.040%), British West Indian (81.2%, a difference of 0.050%), Chippewa (81.3%, a difference of 0.090%), and Immigrants from Guatemala (81.1%, a difference of 0.10%).
| Demographics | Rating | Rank | In Labor Force | Age 45-54 |
| Alsatians | 0.0 /100 | #269 | Tragic 81.3% |
| Bangladeshis | 0.0 /100 | #270 | Tragic 81.3% |
| Immigrants | Barbados | 0.0 /100 | #271 | Tragic 81.3% |
| Spanish | 0.0 /100 | #272 | Tragic 81.3% |
| Chippewa | 0.0 /100 | #273 | Tragic 81.3% |
| British West Indians | 0.0 /100 | #274 | Tragic 81.2% |
| Immigrants | Nonimmigrants | 0.0 /100 | #275 | Tragic 81.2% |
| U.S. Virgin Islanders | 0.0 /100 | #276 | Tragic 81.2% |
| Guatemalans | 0.0 /100 | #277 | Tragic 81.2% |
| Immigrants | Guatemala | 0.0 /100 | #278 | Tragic 81.1% |
| Immigrants | Micronesia | 0.0 /100 | #279 | Tragic 81.1% |
| Immigrants | Latin America | 0.0 /100 | #280 | Tragic 81.0% |
| Immigrants | Grenada | 0.0 /100 | #281 | Tragic 81.0% |
| Aleuts | 0.0 /100 | #282 | Tragic 81.0% |
| French American Indians | 0.0 /100 | #283 | Tragic 80.8% |