Alaska Native vs Sioux Female Disability
COMPARE
Alaska Native
Sioux
Female Disability
Female Disability Comparison
Alaska Natives
Sioux
12.8%
FEMALE DISABILITY
0.6/ 100
METRIC RATING
264th/ 347
METRIC RANK
12.9%
FEMALE DISABILITY
0.1/ 100
METRIC RATING
273rd/ 347
METRIC RANK
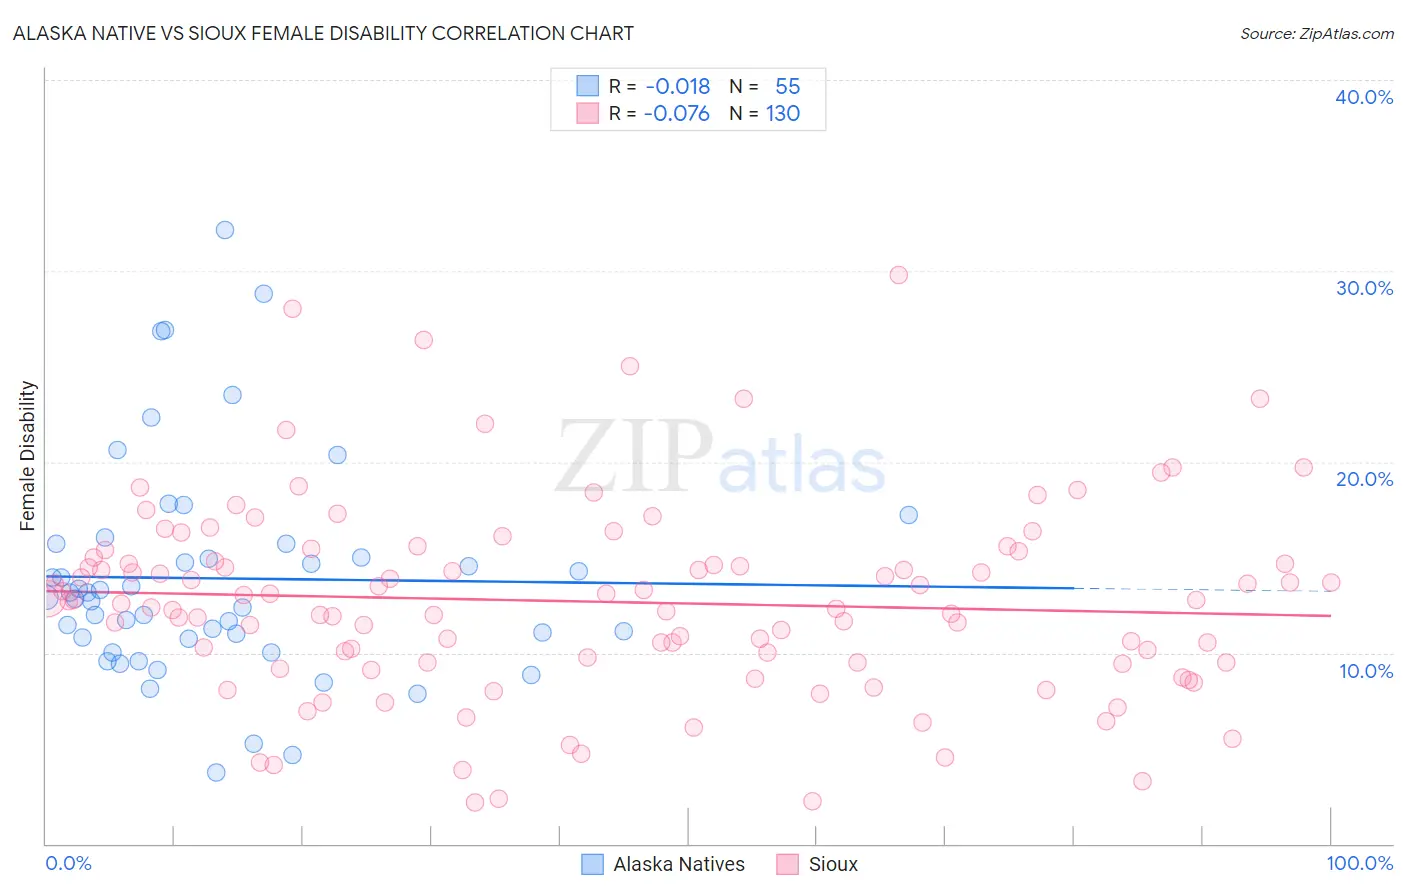
Alaska Native vs Sioux Female Disability Correlation Chart
The statistical analysis conducted on geographies consisting of 76,769,198 people shows no correlation between the proportion of Alaska Natives and percentage of females with a disability in the United States with a correlation coefficient (R) of -0.018 and weighted average of 12.8%. Similarly, the statistical analysis conducted on geographies consisting of 234,143,610 people shows a slight negative correlation between the proportion of Sioux and percentage of females with a disability in the United States with a correlation coefficient (R) of -0.076 and weighted average of 12.9%, a difference of 1.3%.
Female Disability Correlation Summary
| Measurement | Alaska Native | Sioux |
| Minimum | 3.8% | 2.2% |
| Maximum | 32.1% | 29.8% |
| Range | 28.4% | 27.6% |
| Mean | 13.9% | 12.7% |
| Median | 12.9% | 12.7% |
| Interquartile 25% (IQ1) | 10.7% | 9.5% |
| Interquartile 75% (IQ3) | 15.7% | 15.0% |
| Interquartile Range (IQR) | 5.0% | 5.5% |
| Standard Deviation (Sample) | 5.7% | 5.1% |
| Standard Deviation (Population) | 5.7% | 5.1% |
Demographics Similar to Alaska Natives and Sioux by Female Disability
In terms of female disability, the demographic groups most similar to Alaska Natives are Spaniard (12.8%, a difference of 0.12%), West Indian (12.8%, a difference of 0.19%), Finnish (12.8%, a difference of 0.31%), Senegalese (12.8%, a difference of 0.32%), and Czechoslovakian (12.7%, a difference of 0.35%). Similarly, the demographic groups most similar to Sioux are German (12.9%, a difference of 0.020%), Portuguese (13.0%, a difference of 0.12%), Cheyenne (13.0%, a difference of 0.17%), Immigrants from Dominica (13.0%, a difference of 0.22%), and Dutch (12.9%, a difference of 0.23%).
| Demographics | Rating | Rank | Female Disability |
| Aleuts | 1.1 /100 | #258 | Tragic 12.7% |
| Immigrants | Armenia | 1.0 /100 | #259 | Tragic 12.7% |
| Sub-Saharan Africans | 1.0 /100 | #260 | Tragic 12.7% |
| Bermudans | 1.0 /100 | #261 | Tragic 12.7% |
| Czechoslovakians | 0.9 /100 | #262 | Tragic 12.7% |
| Spaniards | 0.7 /100 | #263 | Tragic 12.8% |
| Alaska Natives | 0.6 /100 | #264 | Tragic 12.8% |
| West Indians | 0.5 /100 | #265 | Tragic 12.8% |
| Finns | 0.4 /100 | #266 | Tragic 12.8% |
| Senegalese | 0.4 /100 | #267 | Tragic 12.8% |
| Immigrants | Laos | 0.4 /100 | #268 | Tragic 12.8% |
| Indonesians | 0.4 /100 | #269 | Tragic 12.8% |
| Immigrants | Liberia | 0.3 /100 | #270 | Tragic 12.9% |
| Dutch | 0.2 /100 | #271 | Tragic 12.9% |
| Germans | 0.1 /100 | #272 | Tragic 12.9% |
| Sioux | 0.1 /100 | #273 | Tragic 12.9% |
| Portuguese | 0.1 /100 | #274 | Tragic 13.0% |
| Cheyenne | 0.1 /100 | #275 | Tragic 13.0% |
| Immigrants | Dominica | 0.1 /100 | #276 | Tragic 13.0% |
| Spanish | 0.1 /100 | #277 | Tragic 13.0% |
| Scottish | 0.1 /100 | #278 | Tragic 13.0% |