Basque vs U.S. Virgin Islander Female Disability
COMPARE
Basque
U.S. Virgin Islander
Female Disability
Female Disability Comparison
Basques
U.S. Virgin Islanders
12.4%
FEMALE DISABILITY
17.5/ 100
METRIC RATING
208th/ 347
METRIC RANK
13.1%
FEMALE DISABILITY
0.1/ 100
METRIC RATING
281st/ 347
METRIC RANK
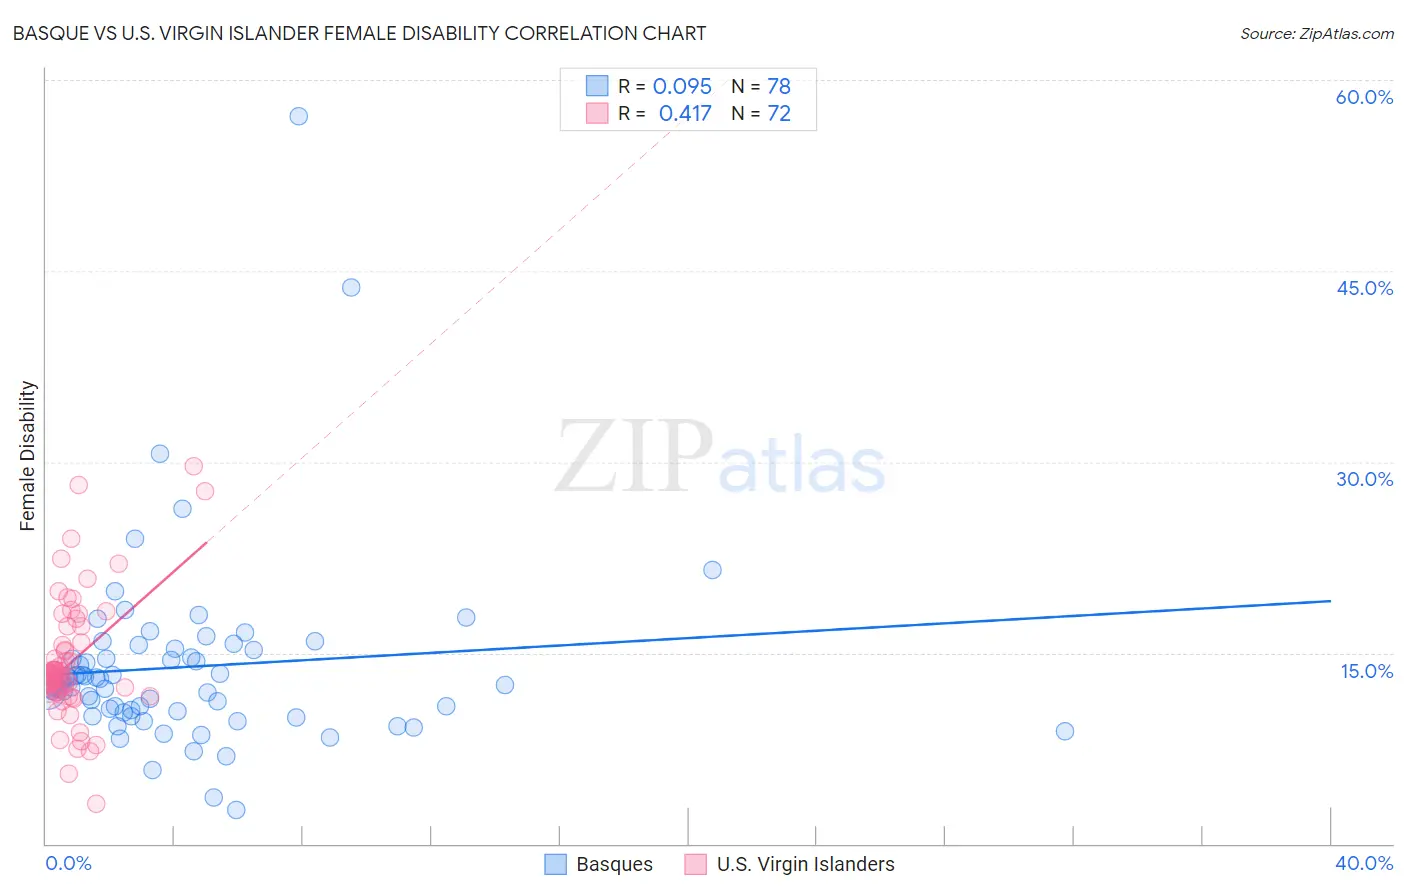
Basque vs U.S. Virgin Islander Female Disability Correlation Chart
The statistical analysis conducted on geographies consisting of 165,775,709 people shows a slight positive correlation between the proportion of Basques and percentage of females with a disability in the United States with a correlation coefficient (R) of 0.095 and weighted average of 12.4%. Similarly, the statistical analysis conducted on geographies consisting of 87,518,599 people shows a moderate positive correlation between the proportion of U.S. Virgin Islanders and percentage of females with a disability in the United States with a correlation coefficient (R) of 0.417 and weighted average of 13.1%, a difference of 5.6%.
Female Disability Correlation Summary
| Measurement | Basque | U.S. Virgin Islander |
| Minimum | 2.6% | 3.2% |
| Maximum | 57.1% | 29.7% |
| Range | 54.5% | 26.5% |
| Mean | 13.9% | 14.2% |
| Median | 12.6% | 13.3% |
| Interquartile 25% (IQ1) | 10.4% | 12.0% |
| Interquartile 75% (IQ3) | 15.2% | 15.7% |
| Interquartile Range (IQR) | 4.8% | 3.8% |
| Standard Deviation (Sample) | 7.5% | 4.8% |
| Standard Deviation (Population) | 7.4% | 4.8% |
Similar Demographics by Female Disability
Demographics Similar to Basques by Female Disability
In terms of female disability, the demographic groups most similar to Basques are Mexican (12.4%, a difference of 0.12%), Immigrants from Cuba (12.4%, a difference of 0.16%), Croatian (12.4%, a difference of 0.16%), Immigrants from Grenada (12.4%, a difference of 0.18%), and Swiss (12.4%, a difference of 0.18%).
| Demographics | Rating | Rank | Female Disability |
| Chinese | 22.1 /100 | #201 | Fair 12.3% |
| Somalis | 21.5 /100 | #202 | Fair 12.3% |
| Immigrants | Barbados | 21.1 /100 | #203 | Fair 12.3% |
| Immigrants | Zaire | 20.9 /100 | #204 | Fair 12.3% |
| Immigrants | Grenada | 20.5 /100 | #205 | Fair 12.4% |
| Immigrants | Cuba | 20.2 /100 | #206 | Fair 12.4% |
| Croatians | 20.2 /100 | #207 | Fair 12.4% |
| Basques | 17.5 /100 | #208 | Poor 12.4% |
| Mexicans | 15.7 /100 | #209 | Poor 12.4% |
| Swiss | 14.9 /100 | #210 | Poor 12.4% |
| Immigrants | Bosnia and Herzegovina | 14.8 /100 | #211 | Poor 12.4% |
| Ute | 14.7 /100 | #212 | Poor 12.4% |
| Immigrants | Thailand | 14.5 /100 | #213 | Poor 12.4% |
| Panamanians | 13.5 /100 | #214 | Poor 12.4% |
| Samoans | 13.4 /100 | #215 | Poor 12.4% |
Demographics Similar to U.S. Virgin Islanders by Female Disability
In terms of female disability, the demographic groups most similar to U.S. Virgin Islanders are Irish (13.1%, a difference of 0.030%), Welsh (13.1%, a difference of 0.080%), English (13.1%, a difference of 0.080%), Arapaho (13.0%, a difference of 0.12%), and Hmong (13.1%, a difference of 0.22%).
| Demographics | Rating | Rank | Female Disability |
| Portuguese | 0.1 /100 | #274 | Tragic 13.0% |
| Cheyenne | 0.1 /100 | #275 | Tragic 13.0% |
| Immigrants | Dominica | 0.1 /100 | #276 | Tragic 13.0% |
| Spanish | 0.1 /100 | #277 | Tragic 13.0% |
| Scottish | 0.1 /100 | #278 | Tragic 13.0% |
| Arapaho | 0.1 /100 | #279 | Tragic 13.0% |
| Irish | 0.1 /100 | #280 | Tragic 13.1% |
| U.S. Virgin Islanders | 0.1 /100 | #281 | Tragic 13.1% |
| Welsh | 0.0 /100 | #282 | Tragic 13.1% |
| English | 0.0 /100 | #283 | Tragic 13.1% |
| Hmong | 0.0 /100 | #284 | Tragic 13.1% |
| Bangladeshis | 0.0 /100 | #285 | Tragic 13.1% |
| Fijians | 0.0 /100 | #286 | Tragic 13.1% |
| Yaqui | 0.0 /100 | #287 | Tragic 13.2% |
| Whites/Caucasians | 0.0 /100 | #288 | Tragic 13.2% |