Alaska Native vs White/Caucasian Female Disability
COMPARE
Alaska Native
White/Caucasian
Female Disability
Female Disability Comparison
Alaska Natives
Whites/Caucasians
12.8%
FEMALE DISABILITY
0.6/ 100
METRIC RATING
264th/ 347
METRIC RANK
13.2%
FEMALE DISABILITY
0.0/ 100
METRIC RATING
288th/ 347
METRIC RANK
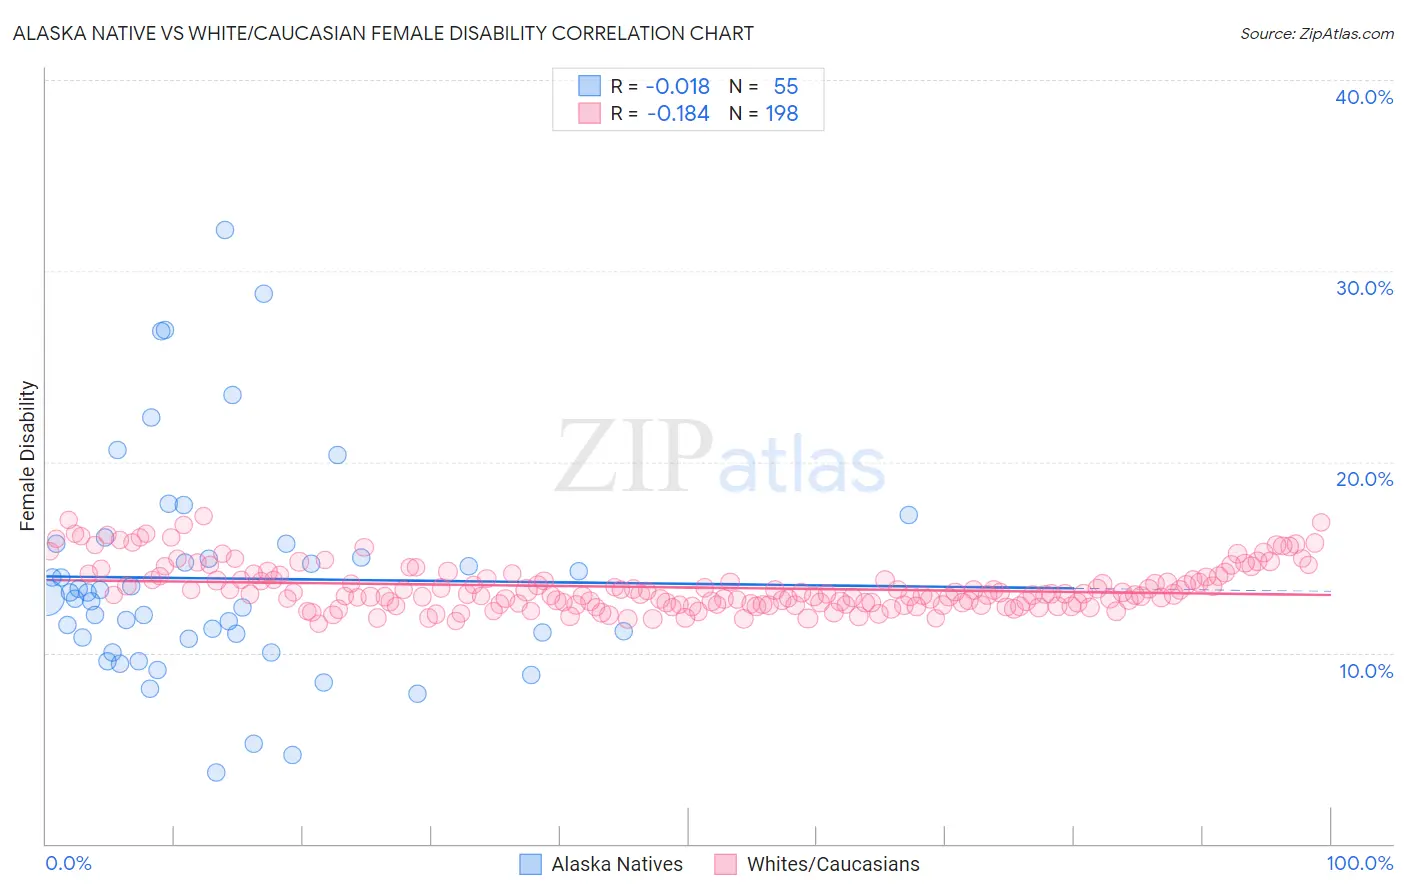
Alaska Native vs White/Caucasian Female Disability Correlation Chart
The statistical analysis conducted on geographies consisting of 76,769,198 people shows no correlation between the proportion of Alaska Natives and percentage of females with a disability in the United States with a correlation coefficient (R) of -0.018 and weighted average of 12.8%. Similarly, the statistical analysis conducted on geographies consisting of 582,775,170 people shows a poor negative correlation between the proportion of Whites/Caucasians and percentage of females with a disability in the United States with a correlation coefficient (R) of -0.184 and weighted average of 13.2%, a difference of 3.2%.
Female Disability Correlation Summary
| Measurement | Alaska Native | White/Caucasian |
| Minimum | 3.8% | 11.5% |
| Maximum | 32.1% | 17.2% |
| Range | 28.4% | 5.6% |
| Mean | 13.9% | 13.4% |
| Median | 12.9% | 13.1% |
| Interquartile 25% (IQ1) | 10.7% | 12.5% |
| Interquartile 75% (IQ3) | 15.7% | 14.0% |
| Interquartile Range (IQR) | 5.0% | 1.5% |
| Standard Deviation (Sample) | 5.7% | 1.2% |
| Standard Deviation (Population) | 5.7% | 1.2% |
Similar Demographics by Female Disability
Demographics Similar to Alaska Natives by Female Disability
In terms of female disability, the demographic groups most similar to Alaska Natives are Spaniard (12.8%, a difference of 0.12%), West Indian (12.8%, a difference of 0.19%), Finnish (12.8%, a difference of 0.31%), Senegalese (12.8%, a difference of 0.32%), and Czechoslovakian (12.7%, a difference of 0.35%).
| Demographics | Rating | Rank | Female Disability |
| Liberians | 1.1 /100 | #257 | Tragic 12.7% |
| Aleuts | 1.1 /100 | #258 | Tragic 12.7% |
| Immigrants | Armenia | 1.0 /100 | #259 | Tragic 12.7% |
| Sub-Saharan Africans | 1.0 /100 | #260 | Tragic 12.7% |
| Bermudans | 1.0 /100 | #261 | Tragic 12.7% |
| Czechoslovakians | 0.9 /100 | #262 | Tragic 12.7% |
| Spaniards | 0.7 /100 | #263 | Tragic 12.8% |
| Alaska Natives | 0.6 /100 | #264 | Tragic 12.8% |
| West Indians | 0.5 /100 | #265 | Tragic 12.8% |
| Finns | 0.4 /100 | #266 | Tragic 12.8% |
| Senegalese | 0.4 /100 | #267 | Tragic 12.8% |
| Immigrants | Laos | 0.4 /100 | #268 | Tragic 12.8% |
| Indonesians | 0.4 /100 | #269 | Tragic 12.8% |
| Immigrants | Liberia | 0.3 /100 | #270 | Tragic 12.9% |
| Dutch | 0.2 /100 | #271 | Tragic 12.9% |
Demographics Similar to Whites/Caucasians by Female Disability
In terms of female disability, the demographic groups most similar to Whites/Caucasians are Yaqui (13.2%, a difference of 0.10%), Tlingit-Haida (13.2%, a difference of 0.17%), Immigrants from Yemen (13.2%, a difference of 0.18%), Shoshone (13.2%, a difference of 0.24%), and Yakama (13.2%, a difference of 0.40%).
| Demographics | Rating | Rank | Female Disability |
| U.S. Virgin Islanders | 0.1 /100 | #281 | Tragic 13.1% |
| Welsh | 0.0 /100 | #282 | Tragic 13.1% |
| English | 0.0 /100 | #283 | Tragic 13.1% |
| Hmong | 0.0 /100 | #284 | Tragic 13.1% |
| Bangladeshis | 0.0 /100 | #285 | Tragic 13.1% |
| Fijians | 0.0 /100 | #286 | Tragic 13.1% |
| Yaqui | 0.0 /100 | #287 | Tragic 13.2% |
| Whites/Caucasians | 0.0 /100 | #288 | Tragic 13.2% |
| Tlingit-Haida | 0.0 /100 | #289 | Tragic 13.2% |
| Immigrants | Yemen | 0.0 /100 | #290 | Tragic 13.2% |
| Shoshone | 0.0 /100 | #291 | Tragic 13.2% |
| Yakama | 0.0 /100 | #292 | Tragic 13.2% |
| Marshallese | 0.0 /100 | #293 | Tragic 13.3% |
| Celtics | 0.0 /100 | #294 | Tragic 13.3% |
| French | 0.0 /100 | #295 | Tragic 13.3% |