Alaska Native vs South American Disability Age Under 5
COMPARE
Alaska Native
South American
Disability Age Under 5
Disability Age Under 5 Comparison
Alaska Natives
South Americans
2.9%
DISABILITY AGE UNDER 5
0.0/ 100
METRIC RATING
342nd/ 347
METRIC RANK
1.2%
DISABILITY AGE UNDER 5
75.6/ 100
METRIC RATING
150th/ 347
METRIC RANK
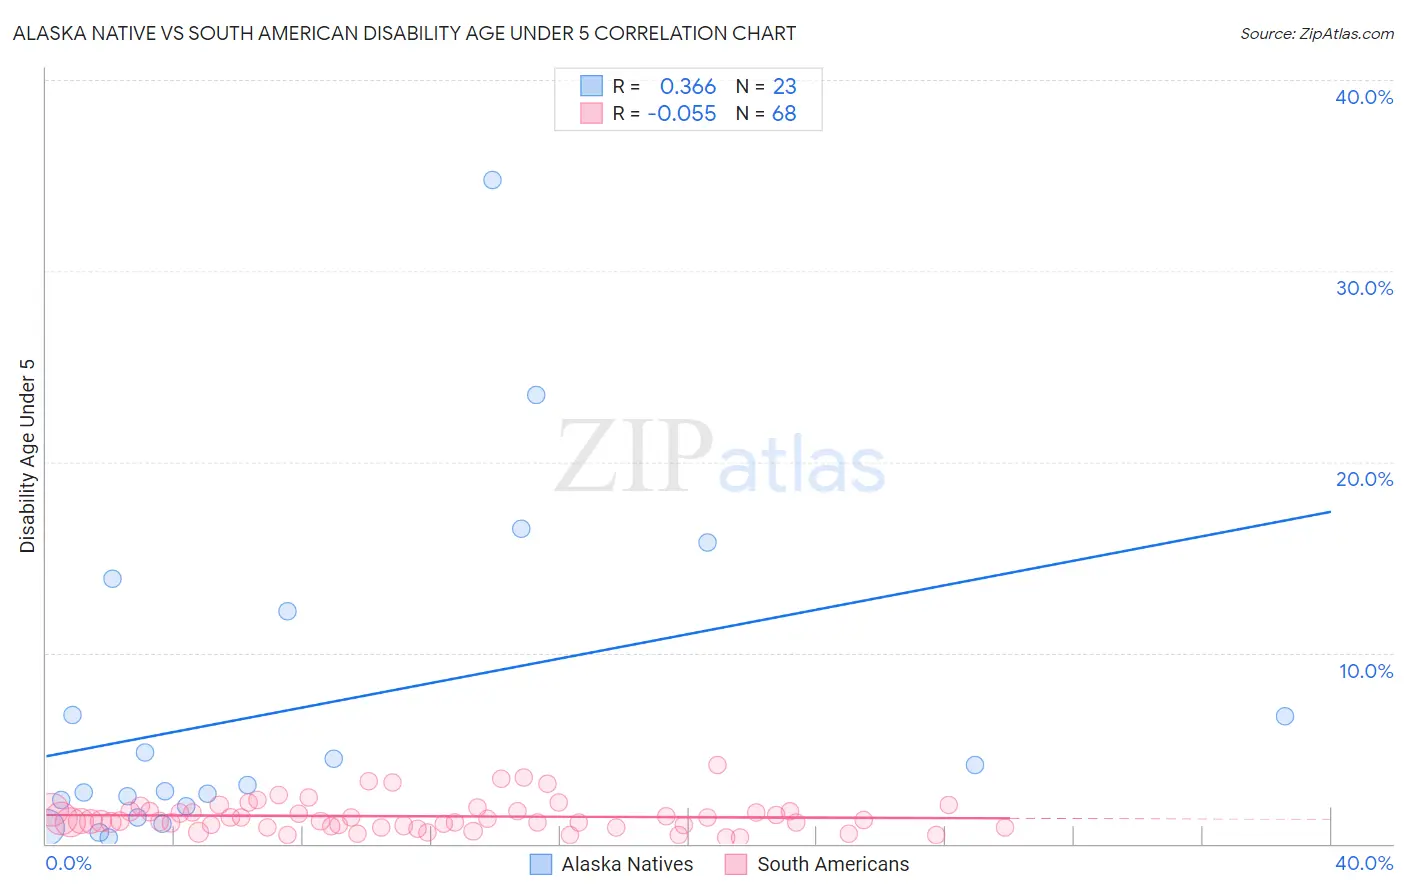
Alaska Native vs South American Disability Age Under 5 Correlation Chart
The statistical analysis conducted on geographies consisting of 62,848,423 people shows a mild positive correlation between the proportion of Alaska Natives and percentage of population with a disability under the age of 5 in the United States with a correlation coefficient (R) of 0.366 and weighted average of 2.9%. Similarly, the statistical analysis conducted on geographies consisting of 248,221,421 people shows a slight negative correlation between the proportion of South Americans and percentage of population with a disability under the age of 5 in the United States with a correlation coefficient (R) of -0.055 and weighted average of 1.2%, a difference of 143.5%.
Disability Age Under 5 Correlation Summary
| Measurement | Alaska Native | South American |
| Minimum | 0.35% | 0.32% |
| Maximum | 34.8% | 4.1% |
| Range | 34.4% | 3.8% |
| Mean | 7.2% | 1.4% |
| Median | 3.1% | 1.2% |
| Interquartile 25% (IQ1) | 2.0% | 0.93% |
| Interquartile 75% (IQ3) | 12.2% | 1.7% |
| Interquartile Range (IQR) | 10.2% | 0.78% |
| Standard Deviation (Sample) | 8.6% | 0.81% |
| Standard Deviation (Population) | 8.4% | 0.81% |
Similar Demographics by Disability Age Under 5
Demographics Similar to Alaska Natives by Disability Age Under 5
In terms of disability age under 5, the demographic groups most similar to Alaska Natives are Colville (3.3%, a difference of 11.6%), Tsimshian (2.4%, a difference of 22.1%), Inupiat (3.7%, a difference of 26.1%), Menominee (2.3%, a difference of 28.1%), and Immigrants from the Azores (2.2%, a difference of 31.6%).
| Demographics | Rating | Rank | Disability Age Under 5 |
| Dutch West Indians | 0.0 /100 | #333 | Tragic 1.9% |
| Natives/Alaskans | 0.0 /100 | #334 | Tragic 1.9% |
| Pennsylvania Germans | 0.0 /100 | #335 | Tragic 1.9% |
| Paraguayans | 0.0 /100 | #336 | Tragic 2.0% |
| Apache | 0.0 /100 | #337 | Tragic 2.0% |
| Tohono O'odham | 0.0 /100 | #338 | Tragic 2.2% |
| Immigrants | Azores | 0.0 /100 | #339 | Tragic 2.2% |
| Menominee | 0.0 /100 | #340 | Tragic 2.3% |
| Tsimshian | 0.0 /100 | #341 | Tragic 2.4% |
| Alaska Natives | 0.0 /100 | #342 | Tragic 2.9% |
| Colville | 0.0 /100 | #343 | Tragic 3.3% |
| Inupiat | 0.0 /100 | #344 | Tragic 3.7% |
| Paiute | 0.0 /100 | #345 | Tragic 3.9% |
| Yup'ik | 0.0 /100 | #346 | Tragic 4.5% |
| Hopi | 0.0 /100 | #347 | Tragic 4.6% |
Demographics Similar to South Americans by Disability Age Under 5
In terms of disability age under 5, the demographic groups most similar to South Americans are Kenyan (1.2%, a difference of 0.040%), Ghanaian (1.2%, a difference of 0.090%), Icelander (1.2%, a difference of 0.10%), Yaqui (1.2%, a difference of 0.10%), and Samoan (1.2%, a difference of 0.27%).
| Demographics | Rating | Rank | Disability Age Under 5 |
| Alsatians | 79.3 /100 | #143 | Good 1.2% |
| Immigrants | Middle Africa | 79.3 /100 | #144 | Good 1.2% |
| Immigrants | Zimbabwe | 77.9 /100 | #145 | Good 1.2% |
| Samoans | 77.7 /100 | #146 | Good 1.2% |
| Icelanders | 76.3 /100 | #147 | Good 1.2% |
| Ghanaians | 76.3 /100 | #148 | Good 1.2% |
| Kenyans | 75.9 /100 | #149 | Good 1.2% |
| South Americans | 75.6 /100 | #150 | Good 1.2% |
| Yaqui | 74.8 /100 | #151 | Good 1.2% |
| Hondurans | 72.5 /100 | #152 | Good 1.2% |
| Immigrants | Thailand | 69.4 /100 | #153 | Good 1.2% |
| Uruguayans | 68.8 /100 | #154 | Good 1.2% |
| Immigrants | Ghana | 68.7 /100 | #155 | Good 1.2% |
| Hawaiians | 68.5 /100 | #156 | Good 1.2% |
| Immigrants | South America | 67.0 /100 | #157 | Good 1.2% |