African vs Serbian Disability
COMPARE
African
Serbian
Disability
Disability Comparison
Africans
Serbians
13.0%
DISABILITY
0.0/ 100
METRIC RATING
287th/ 347
METRIC RANK
11.9%
DISABILITY
15.4/ 100
METRIC RATING
196th/ 347
METRIC RANK
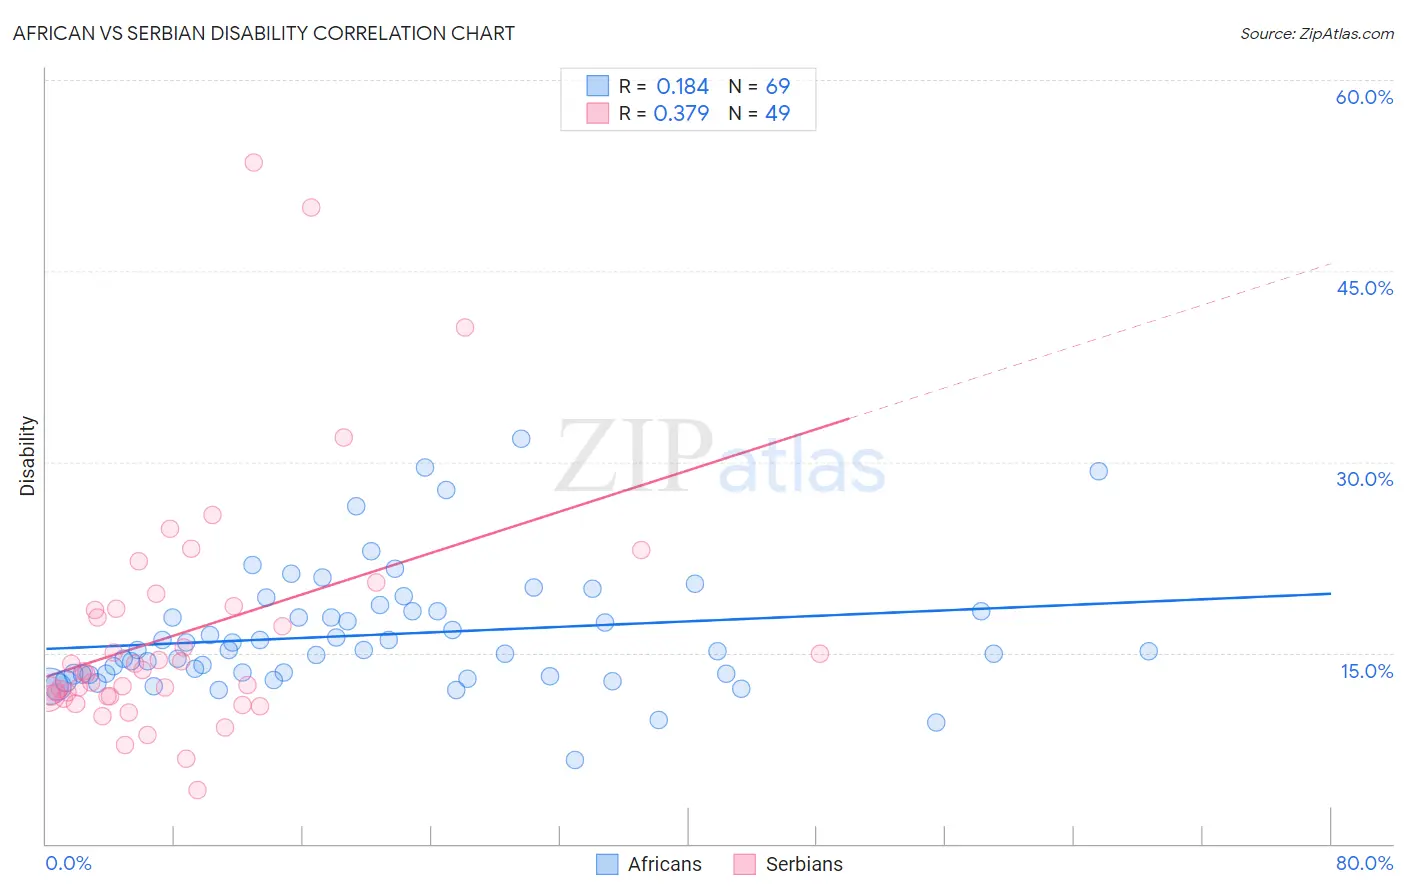
African vs Serbian Disability Correlation Chart
The statistical analysis conducted on geographies consisting of 469,989,744 people shows a poor positive correlation between the proportion of Africans and percentage of population with a disability in the United States with a correlation coefficient (R) of 0.184 and weighted average of 13.0%. Similarly, the statistical analysis conducted on geographies consisting of 267,644,318 people shows a mild positive correlation between the proportion of Serbians and percentage of population with a disability in the United States with a correlation coefficient (R) of 0.379 and weighted average of 11.9%, a difference of 9.1%.
Disability Correlation Summary
| Measurement | African | Serbian |
| Minimum | 6.6% | 4.2% |
| Maximum | 31.8% | 53.5% |
| Range | 25.2% | 49.3% |
| Mean | 16.4% | 16.6% |
| Median | 15.2% | 13.6% |
| Interquartile 25% (IQ1) | 13.3% | 11.6% |
| Interquartile 75% (IQ3) | 18.3% | 18.6% |
| Interquartile Range (IQR) | 5.0% | 7.0% |
| Standard Deviation (Sample) | 4.7% | 9.7% |
| Standard Deviation (Population) | 4.7% | 9.6% |
Similar Demographics by Disability
Demographics Similar to Africans by Disability
In terms of disability, the demographic groups most similar to Africans are White/Caucasian (13.0%, a difference of 0.020%), Slovak (13.0%, a difference of 0.020%), Cheyenne (13.0%, a difference of 0.080%), Yaqui (13.1%, a difference of 0.31%), and English (13.0%, a difference of 0.41%).
| Demographics | Rating | Rank | Disability |
| Spanish | 0.0 /100 | #280 | Tragic 12.8% |
| Immigrants | Portugal | 0.0 /100 | #281 | Tragic 12.9% |
| Scottish | 0.0 /100 | #282 | Tragic 12.9% |
| Irish | 0.0 /100 | #283 | Tragic 12.9% |
| Welsh | 0.0 /100 | #284 | Tragic 12.9% |
| Crow | 0.0 /100 | #285 | Tragic 12.9% |
| English | 0.0 /100 | #286 | Tragic 13.0% |
| Africans | 0.0 /100 | #287 | Tragic 13.0% |
| Whites/Caucasians | 0.0 /100 | #288 | Tragic 13.0% |
| Slovaks | 0.0 /100 | #289 | Tragic 13.0% |
| Cheyenne | 0.0 /100 | #290 | Tragic 13.0% |
| Yaqui | 0.0 /100 | #291 | Tragic 13.1% |
| Aleuts | 0.0 /100 | #292 | Tragic 13.1% |
| Marshallese | 0.0 /100 | #293 | Tragic 13.1% |
| Celtics | 0.0 /100 | #294 | Tragic 13.1% |
Demographics Similar to Serbians by Disability
In terms of disability, the demographic groups most similar to Serbians are Immigrants from Belize (11.9%, a difference of 0.010%), Barbadian (11.9%, a difference of 0.040%), Ukrainian (11.9%, a difference of 0.060%), Immigrants from Panama (11.9%, a difference of 0.070%), and Somali (11.9%, a difference of 0.15%).
| Demographics | Rating | Rank | Disability |
| Immigrants | Zaire | 21.8 /100 | #189 | Fair 11.9% |
| Immigrants | West Indies | 21.1 /100 | #190 | Fair 11.9% |
| Ute | 19.5 /100 | #191 | Poor 11.9% |
| Lithuanians | 18.8 /100 | #192 | Poor 11.9% |
| Immigrants | Bosnia and Herzegovina | 18.0 /100 | #193 | Poor 11.9% |
| Somalis | 17.3 /100 | #194 | Poor 11.9% |
| Barbadians | 15.8 /100 | #195 | Poor 11.9% |
| Serbians | 15.4 /100 | #196 | Poor 11.9% |
| Immigrants | Belize | 15.2 /100 | #197 | Poor 11.9% |
| Ukrainians | 14.7 /100 | #198 | Poor 11.9% |
| Immigrants | Panama | 14.6 /100 | #199 | Poor 11.9% |
| Belizeans | 12.8 /100 | #200 | Poor 11.9% |
| Assyrians/Chaldeans/Syriacs | 12.6 /100 | #201 | Poor 11.9% |
| Immigrants | England | 12.0 /100 | #202 | Poor 12.0% |
| British West Indians | 11.5 /100 | #203 | Poor 12.0% |