Brazilian 4 or more Vehicles in Household
COMPARE
Brazilian
Select to Compare
4 or more Vehicles in Household
Brazilian 4 or more Vehicles in Household
5.4%
4+ VEHICLES AVAILABLE
0.3/ 100
METRIC RATING
284th/ 347
METRIC RANK
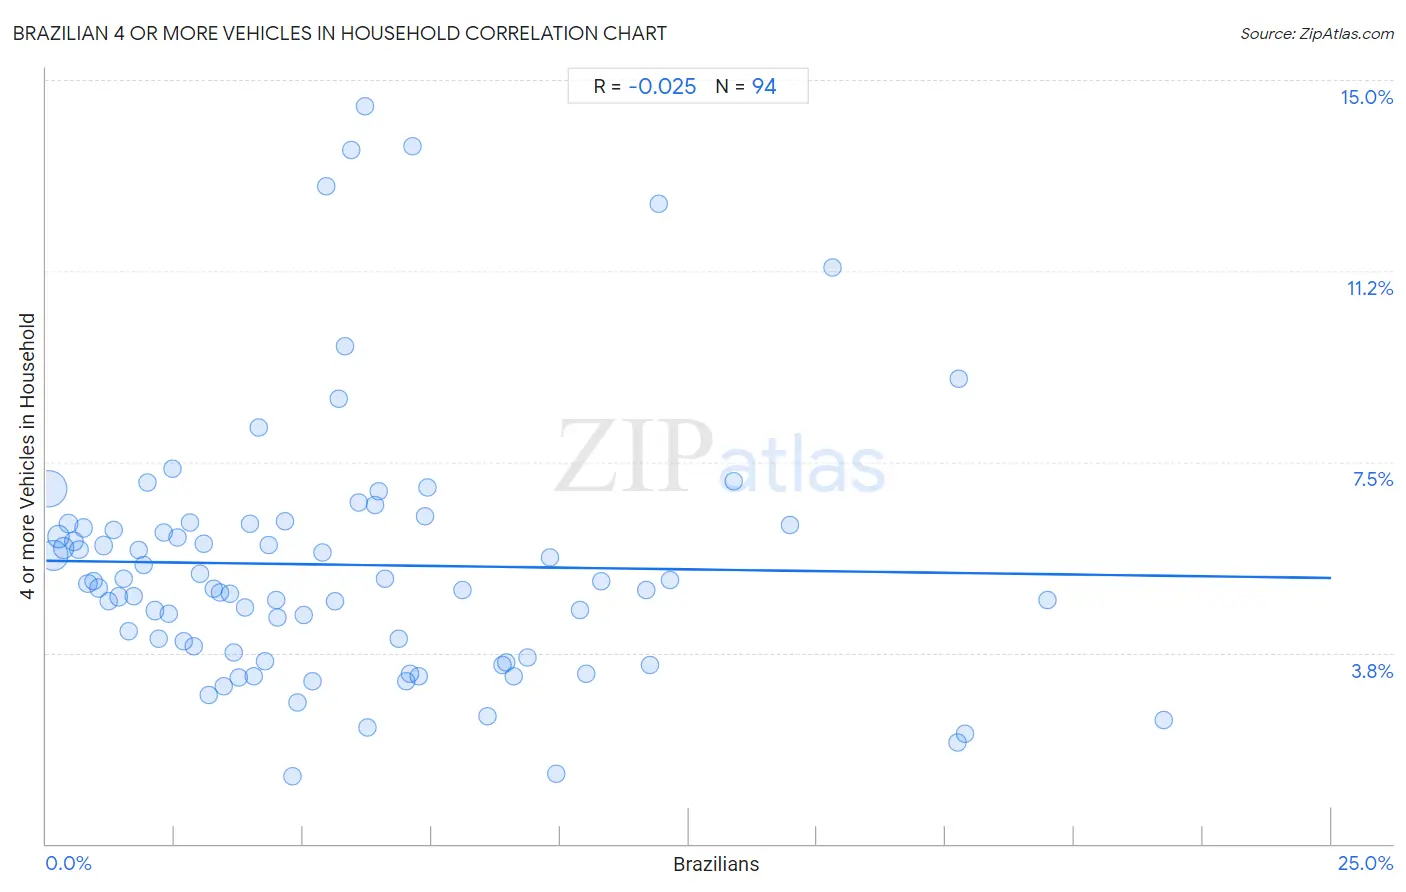
Brazilian 4 or more Vehicles in Household Correlation Chart
The statistical analysis conducted on geographies consisting of 322,327,740 people shows no correlation between the proportion of Brazilians and percentage of households with 4 or more vehicles available in the United States with a correlation coefficient (R) of -0.025 and weighted average of 5.4%. On average, for every 1% (one percent) increase in Brazilians within a typical geography, there is a decrease of 0.014% in percentage of households with 4 or more vehicles available.
It is essential to understand that the correlation between the percentage of Brazilians and percentage of households with 4 or more vehicles available does not imply a direct cause-and-effect relationship. It remains uncertain whether the presence of Brazilians influences an upward or downward trend in the level of percentage of households with 4 or more vehicles available within an area, or if Brazilians simply ended up residing in those areas with higher or lower levels of percentage of households with 4 or more vehicles available due to other factors.
Demographics Similar to Brazilians by 4 or more Vehicles in Household
In terms of 4 or more vehicles in household, the demographic groups most similar to Brazilians are Immigrants from Ireland (5.4%, a difference of 0.29%), Immigrants from Liberia (5.4%, a difference of 0.34%), Immigrants from Spain (5.4%, a difference of 0.37%), Immigrants from Colombia (5.4%, a difference of 0.38%), and Immigrants from Croatia (5.4%, a difference of 0.47%).
| Demographics | Rating | Rank | 4 or more Vehicles in Household |
| Immigrants from Bulgaria | 0.5 /100 | #277 | Tragic 5.5% |
| Immigrants from Eastern Europe | 0.4 /100 | #278 | Tragic 5.4% |
| Immigrants from Uruguay | 0.3 /100 | #279 | Tragic 5.4% |
| Alsatians | 0.3 /100 | #280 | Tragic 5.4% |
| Immigrants from Western Africa | 0.3 /100 | #281 | Tragic 5.4% |
| Immigrants from Spain | 0.3 /100 | #282 | Tragic 5.4% |
| Immigrants from Ireland | 0.3 /100 | #283 | Tragic 5.4% |
| Brazilians | 0.3 /100 | #284 | Tragic 5.4% |
| Immigrants from Liberia | 0.2 /100 | #285 | Tragic 5.4% |
| Immigrants from Colombia | 0.2 /100 | #286 | Tragic 5.4% |
| Immigrants from Croatia | 0.2 /100 | #287 | Tragic 5.4% |
| Venezuelans | 0.2 /100 | #288 | Tragic 5.3% |
| Immigrants from Bosnia and Herzegovina | 0.2 /100 | #289 | Tragic 5.3% |
| Immigrants from Russia | 0.2 /100 | #290 | Tragic 5.3% |
| Immigrants from Bahamas | 0.1 /100 | #291 | Tragic 5.3% |
Brazilian 4 or more Vehicles in Household Correlation Summary
| Measurement | Brazilian Data | 4 or more Vehicles in Household Data |
| Minimum | 0.046% | 1.3% |
| Maximum | 21.7% | 14.5% |
| Range | 21.7% | 13.2% |
| Mean | 5.8% | 5.5% |
| Median | 4.6% | 5.1% |
| Interquartile 25% (IQ1) | 2.3% | 3.7% |
| Interquartile 75% (IQ3) | 7.4% | 6.3% |
| Interquartile Range (IQR) | 5.1% | 2.5% |
| Standard Deviation (Sample) | 4.7% | 2.6% |
| Standard Deviation (Population) | 4.7% | 2.6% |
Correlation Details
| Brazilian Percentile | Sample Size | 4 or more Vehicles in Household |
[ 0.0% - 0.5% ] 0.046% | 136,582,602 | 7.0% |
[ 0.0% - 0.5% ] 0.14% | 85,061,241 | 5.7% |
[ 0.0% - 0.5% ] 0.24% | 31,639,593 | 6.0% |
[ 0.0% - 0.5% ] 0.33% | 19,629,614 | 5.8% |
[ 0.0% - 0.5% ] 0.43% | 12,067,388 | 6.3% |
[ 0.5% - 1.0% ] 0.53% | 7,539,244 | 5.9% |
[ 0.5% - 1.0% ] 0.63% | 5,615,067 | 5.8% |
[ 0.5% - 1.0% ] 0.73% | 2,611,307 | 6.2% |
[ 0.5% - 1.0% ] 0.81% | 3,042,611 | 5.1% |
[ 0.5% - 1.0% ] 0.92% | 2,544,906 | 5.2% |
[ 1.0% - 1.5% ] 1.02% | 2,015,073 | 5.0% |
[ 1.0% - 1.5% ] 1.12% | 1,556,191 | 5.9% |
[ 1.0% - 1.5% ] 1.21% | 1,419,130 | 4.8% |
[ 1.0% - 1.5% ] 1.31% | 956,869 | 6.2% |
[ 1.0% - 1.5% ] 1.41% | 807,816 | 4.8% |
[ 1.5% - 2.0% ] 1.50% | 800,376 | 5.2% |
[ 1.5% - 2.0% ] 1.60% | 579,473 | 4.2% |
[ 1.5% - 2.0% ] 1.69% | 982,509 | 4.9% |
[ 1.5% - 2.0% ] 1.81% | 242,790 | 5.8% |
[ 1.5% - 2.0% ] 1.90% | 479,483 | 5.5% |
[ 1.5% - 2.0% ] 1.97% | 133,783 | 7.1% |
[ 2.0% - 2.5% ] 2.11% | 734,420 | 4.6% |
[ 2.0% - 2.5% ] 2.18% | 439,215 | 4.0% |
[ 2.0% - 2.5% ] 2.30% | 364,643 | 6.1% |
[ 2.0% - 2.5% ] 2.37% | 295,619 | 4.5% |
[ 2.0% - 2.5% ] 2.47% | 142,722 | 7.4% |
[ 2.5% - 3.0% ] 2.56% | 198,265 | 6.0% |
[ 2.5% - 3.0% ] 2.67% | 121,068 | 4.0% |
[ 2.5% - 3.0% ] 2.80% | 50,439 | 6.3% |
[ 2.5% - 3.0% ] 2.87% | 167,682 | 3.9% |
[ 2.5% - 3.0% ] 2.98% | 180,523 | 5.3% |
[ 3.0% - 3.5% ] 3.06% | 65,423 | 5.9% |
[ 3.0% - 3.5% ] 3.16% | 60,936 | 2.9% |
[ 3.0% - 3.5% ] 3.25% | 154 | 5.0% |
[ 3.0% - 3.5% ] 3.37% | 107,926 | 4.9% |
[ 3.0% - 3.5% ] 3.45% | 240,705 | 3.1% |
[ 3.5% - 4.0% ] 3.58% | 255,318 | 4.9% |
[ 3.5% - 4.0% ] 3.65% | 143,358 | 3.7% |
[ 3.5% - 4.0% ] 3.74% | 174,154 | 3.3% |
[ 3.5% - 4.0% ] 3.87% | 32,655 | 4.6% |
[ 3.5% - 4.0% ] 3.96% | 97,412 | 6.3% |
[ 4.0% - 4.5% ] 4.03% | 151,720 | 3.3% |
[ 4.0% - 4.5% ] 4.13% | 29,781 | 8.2% |
[ 4.0% - 4.5% ] 4.25% | 7,419 | 3.6% |
[ 4.0% - 4.5% ] 4.32% | 63,170 | 5.9% |
[ 4.0% - 4.5% ] 4.47% | 42,045 | 4.8% |
[ 4.0% - 4.5% ] 4.50% | 122,618 | 4.5% |
[ 4.5% - 5.0% ] 4.64% | 12,532 | 6.3% |
[ 4.5% - 5.0% ] 4.79% | 321,508 | 1.3% |
[ 4.5% - 5.0% ] 4.90% | 9,246 | 2.8% |
[ 5.0% - 5.5% ] 5.02% | 5,799 | 4.5% |
[ 5.0% - 5.5% ] 5.18% | 29,576 | 3.2% |
[ 5.0% - 5.5% ] 5.37% | 670 | 5.7% |
[ 5.0% - 5.5% ] 5.46% | 1,924 | 12.9% |
[ 5.5% - 6.0% ] 5.61% | 144,030 | 4.8% |
[ 5.5% - 6.0% ] 5.70% | 20,668 | 8.7% |
[ 5.5% - 6.0% ] 5.81% | 3,957 | 9.8% |
[ 5.5% - 6.0% ] 5.93% | 843 | 13.6% |
[ 6.0% - 6.5% ] 6.09% | 10,623 | 6.7% |
[ 6.0% - 6.5% ] 6.20% | 742 | 14.5% |
[ 6.0% - 6.5% ] 6.25% | 9,051 | 2.3% |
[ 6.0% - 6.5% ] 6.40% | 5,003 | 6.7% |
[ 6.0% - 6.5% ] 6.48% | 48,922 | 6.9% |
[ 6.5% - 7.0% ] 6.59% | 56,891 | 5.2% |
[ 6.5% - 7.0% ] 6.85% | 70,451 | 4.0% |
[ 6.5% - 7.0% ] 7.00% | 46,938 | 3.2% |
[ 7.0% - 7.5% ] 7.07% | 948 | 3.3% |
[ 7.0% - 7.5% ] 7.12% | 2,330 | 13.7% |
[ 7.0% - 7.5% ] 7.25% | 33,691 | 3.3% |
[ 7.0% - 7.5% ] 7.37% | 17,214 | 6.4% |
[ 7.0% - 7.5% ] 7.42% | 58,564 | 7.0% |
[ 8.0% - 8.5% ] 8.10% | 51,318 | 5.0% |
[ 8.5% - 9.0% ] 8.59% | 32,076 | 2.5% |
[ 8.5% - 9.0% ] 8.89% | 118,546 | 3.5% |
[ 8.5% - 9.0% ] 8.96% | 31,932 | 3.6% |
[ 9.0% - 9.5% ] 9.11% | 2,570 | 3.3% |
[ 9.0% - 9.5% ] 9.37% | 98,856 | 3.6% |
[ 9.5% - 10.0% ] 9.81% | 11,551 | 5.6% |
[ 9.5% - 10.0% ] 9.91% | 13,154 | 1.4% |
[ 10.0% - 10.5% ] 10.38% | 60,009 | 4.6% |
[ 10.5% - 11.0% ] 10.51% | 1,580 | 3.4% |
[ 10.5% - 11.0% ] 10.79% | 82,782 | 5.2% |
[ 11.5% - 12.0% ] 11.68% | 50,112 | 5.0% |
[ 11.5% - 12.0% ] 11.74% | 71,805 | 3.5% |
[ 11.5% - 12.0% ] 11.93% | 3,848 | 12.6% |
[ 12.0% - 12.5% ] 12.14% | 17,178 | 5.2% |
[ 13.0% - 13.5% ] 13.38% | 30,411 | 7.1% |
[ 14.0% - 14.5% ] 14.48% | 27,569 | 6.3% |
[ 15.0% - 15.5% ] 15.29% | 8,547 | 11.3% |
[ 17.5% - 18.0% ] 17.72% | 1,016 | 2.0% |
[ 17.5% - 18.0% ] 17.75% | 1,183 | 9.1% |
[ 17.5% - 18.0% ] 17.87% | 38,898 | 2.2% |
[ 19.0% - 19.5% ] 19.48% | 2,367 | 4.8% |
[ 21.5% - 22.0% ] 21.74% | 61,855 | 2.4% |