Finnish 4 or more Vehicles in Household
COMPARE
Finnish
Select to Compare
4 or more Vehicles in Household
Finnish 4 or more Vehicles in Household
7.3%
4+ VEHICLES AVAILABLE
99.8/ 100
METRIC RATING
81st/ 347
METRIC RANK
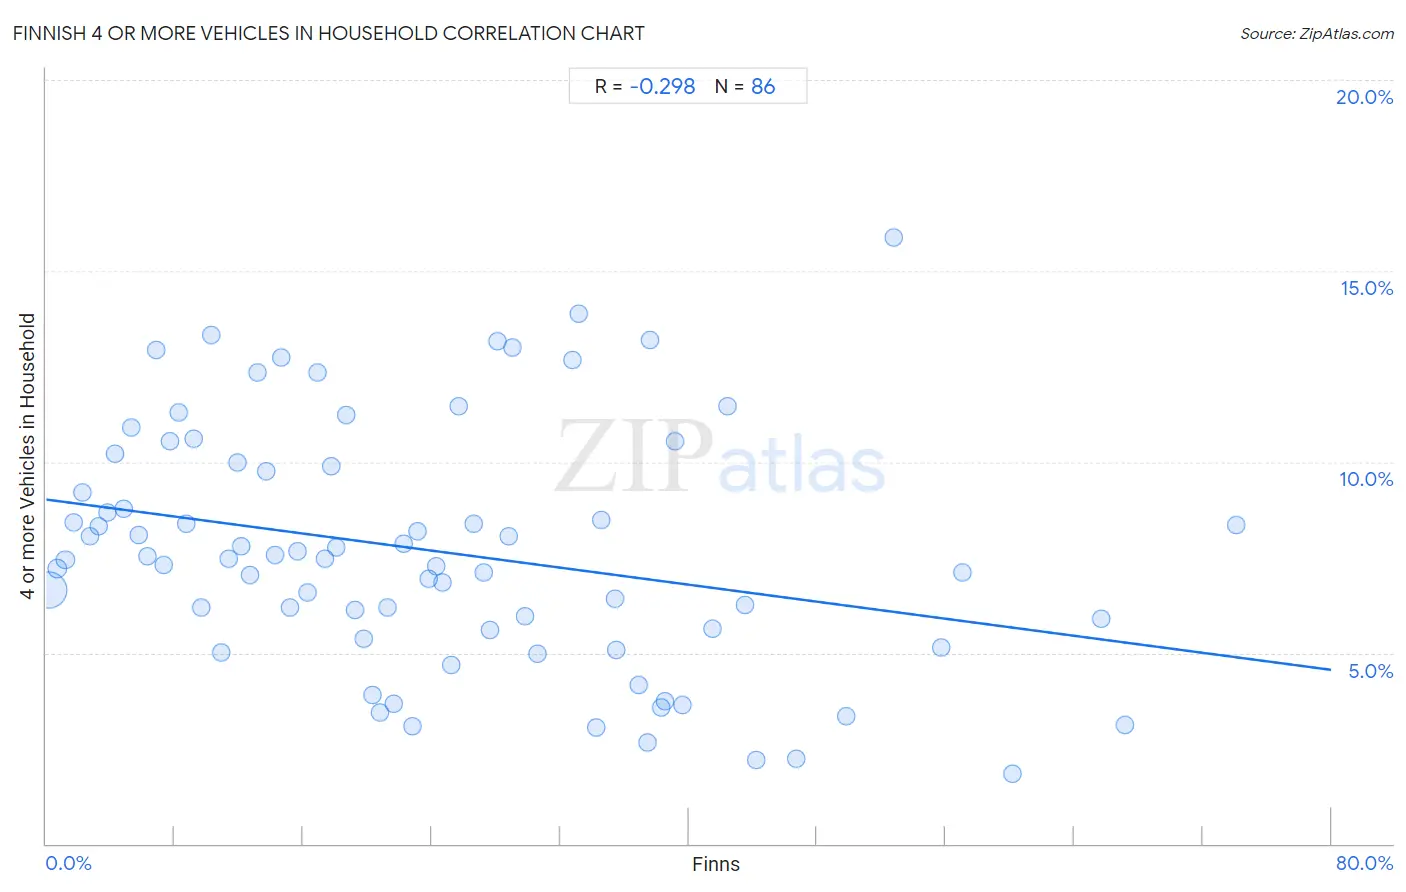
Finnish 4 or more Vehicles in Household Correlation Chart
The statistical analysis conducted on geographies consisting of 403,293,197 people shows a weak negative correlation between the proportion of Finns and percentage of households with 4 or more vehicles available in the United States with a correlation coefficient (R) of -0.298 and weighted average of 7.3%. On average, for every 1% (one percent) increase in Finns within a typical geography, there is a decrease of 0.056% in percentage of households with 4 or more vehicles available.
It is essential to understand that the correlation between the percentage of Finns and percentage of households with 4 or more vehicles available does not imply a direct cause-and-effect relationship. It remains uncertain whether the presence of Finns influences an upward or downward trend in the level of percentage of households with 4 or more vehicles available within an area, or if Finns simply ended up residing in those areas with higher or lower levels of percentage of households with 4 or more vehicles available due to other factors.
Demographics Similar to Finns by 4 or more Vehicles in Household
In terms of 4 or more vehicles in household, the demographic groups most similar to Finns are Northern European (7.3%, a difference of 0.20%), Potawatomi (7.3%, a difference of 0.32%), Alaska Native (7.3%, a difference of 0.56%), Afghan (7.3%, a difference of 0.65%), and Czech (7.4%, a difference of 0.70%).
| Demographics | Rating | Rank | 4 or more Vehicles in Household |
| Icelanders | 99.9 /100 | #74 | Exceptional 7.4% |
| Immigrants from Cambodia | 99.9 /100 | #75 | Exceptional 7.4% |
| Laotians | 99.9 /100 | #76 | Exceptional 7.4% |
| Apache | 99.9 /100 | #77 | Exceptional 7.4% |
| Whites/Caucasians | 99.8 /100 | #78 | Exceptional 7.4% |
| Czechs | 99.8 /100 | #79 | Exceptional 7.4% |
| Alaska Natives | 99.8 /100 | #80 | Exceptional 7.3% |
| Finns | 99.8 /100 | #81 | Exceptional 7.3% |
| Northern Europeans | 99.8 /100 | #82 | Exceptional 7.3% |
| Potawatomi | 99.7 /100 | #83 | Exceptional 7.3% |
| Afghans | 99.7 /100 | #84 | Exceptional 7.3% |
| Cree | 99.7 /100 | #85 | Exceptional 7.2% |
| Immigrants from Indonesia | 99.6 /100 | #86 | Exceptional 7.2% |
| Delaware | 99.6 /100 | #87 | Exceptional 7.2% |
| Nonimmigrants | 99.6 /100 | #88 | Exceptional 7.2% |
Finnish 4 or more Vehicles in Household Correlation Summary
| Measurement | Finnish Data | 4 or more Vehicles in Household Data |
| Minimum | 0.14% | 1.8% |
| Maximum | 74.1% | 15.9% |
| Range | 73.9% | 14.0% |
| Mean | 24.2% | 7.7% |
| Median | 21.5% | 7.5% |
| Interquartile 25% (IQ1) | 10.9% | 5.6% |
| Interquartile 75% (IQ3) | 35.4% | 9.9% |
| Interquartile Range (IQR) | 24.5% | 4.3% |
| Standard Deviation (Sample) | 16.9% | 3.2% |
| Standard Deviation (Population) | 16.8% | 3.1% |
Correlation Details
| Finnish Percentile | Sample Size | 4 or more Vehicles in Household |
[ 0.0% - 0.5% ] 0.14% | 356,647,477 | 6.7% |
[ 0.5% - 1.0% ] 0.68% | 31,670,830 | 7.2% |
[ 1.0% - 1.5% ] 1.20% | 8,157,518 | 7.4% |
[ 1.5% - 2.0% ] 1.70% | 2,739,756 | 8.4% |
[ 2.0% - 2.5% ] 2.24% | 1,184,319 | 9.2% |
[ 2.5% - 3.0% ] 2.75% | 614,807 | 8.1% |
[ 3.0% - 3.5% ] 3.25% | 480,892 | 8.3% |
[ 3.5% - 4.0% ] 3.79% | 177,843 | 8.7% |
[ 4.0% - 4.5% ] 4.25% | 257,421 | 10.2% |
[ 4.5% - 5.0% ] 4.79% | 98,593 | 8.8% |
[ 5.0% - 5.5% ] 5.30% | 86,228 | 10.9% |
[ 5.5% - 6.0% ] 5.79% | 144,629 | 8.1% |
[ 6.0% - 6.5% ] 6.28% | 177,071 | 7.5% |
[ 6.5% - 7.0% ] 6.81% | 78,155 | 12.9% |
[ 7.0% - 7.5% ] 7.29% | 73,597 | 7.3% |
[ 7.5% - 8.0% ] 7.74% | 35,005 | 10.5% |
[ 8.0% - 8.5% ] 8.25% | 39,621 | 11.3% |
[ 8.5% - 9.0% ] 8.69% | 55,592 | 8.4% |
[ 9.0% - 9.5% ] 9.21% | 38,545 | 10.6% |
[ 9.5% - 10.0% ] 9.62% | 30,003 | 6.2% |
[ 10.0% - 10.5% ] 10.30% | 33,794 | 13.3% |
[ 10.5% - 11.0% ] 10.87% | 70,757 | 5.0% |
[ 11.0% - 11.5% ] 11.36% | 36,626 | 7.5% |
[ 11.5% - 12.0% ] 11.92% | 48,839 | 10.0% |
[ 12.0% - 12.5% ] 12.17% | 27,004 | 7.8% |
[ 12.5% - 13.0% ] 12.66% | 18,363 | 7.0% |
[ 13.0% - 13.5% ] 13.18% | 10,503 | 12.3% |
[ 13.5% - 14.0% ] 13.69% | 9,374 | 9.8% |
[ 14.0% - 14.5% ] 14.26% | 14,226 | 7.6% |
[ 14.5% - 15.0% ] 14.61% | 12,734 | 12.7% |
[ 15.0% - 15.5% ] 15.18% | 5,750 | 6.2% |
[ 15.5% - 16.0% ] 15.68% | 2,883 | 7.7% |
[ 16.0% - 16.5% ] 16.29% | 4,009 | 6.6% |
[ 16.5% - 17.0% ] 16.88% | 10,266 | 12.3% |
[ 17.0% - 17.5% ] 17.33% | 13,116 | 7.5% |
[ 17.5% - 18.0% ] 17.73% | 11,318 | 9.9% |
[ 18.0% - 18.5% ] 18.09% | 8,089 | 7.7% |
[ 18.5% - 19.0% ] 18.67% | 4,563 | 11.2% |
[ 19.0% - 19.5% ] 19.20% | 14,269 | 6.1% |
[ 19.5% - 20.0% ] 19.75% | 8,540 | 5.4% |
[ 20.0% - 20.5% ] 20.29% | 12,833 | 3.9% |
[ 20.5% - 21.0% ] 20.81% | 9,708 | 3.4% |
[ 21.0% - 21.5% ] 21.28% | 7,553 | 6.2% |
[ 21.5% - 22.0% ] 21.65% | 194 | 3.7% |
[ 22.0% - 22.5% ] 22.27% | 7,521 | 7.9% |
[ 22.5% - 23.0% ] 22.80% | 3,461 | 3.1% |
[ 23.0% - 23.5% ] 23.13% | 2,309 | 8.2% |
[ 23.5% - 24.0% ] 23.82% | 10,516 | 6.9% |
[ 24.0% - 24.5% ] 24.29% | 2,697 | 7.3% |
[ 24.5% - 25.0% ] 24.70% | 19,575 | 6.8% |
[ 25.0% - 25.5% ] 25.25% | 5,121 | 4.7% |
[ 25.5% - 26.0% ] 25.70% | 2,673 | 11.5% |
[ 26.5% - 27.0% ] 26.64% | 9,910 | 8.4% |
[ 27.0% - 27.5% ] 27.26% | 2,781 | 7.1% |
[ 27.5% - 28.0% ] 27.66% | 3,012 | 5.6% |
[ 28.0% - 28.5% ] 28.08% | 527 | 13.2% |
[ 28.5% - 29.0% ] 28.76% | 3,390 | 8.1% |
[ 29.0% - 29.5% ] 29.06% | 2,780 | 13.0% |
[ 29.5% - 30.0% ] 29.83% | 10,754 | 5.9% |
[ 30.5% - 31.0% ] 30.59% | 706 | 5.0% |
[ 32.5% - 33.0% ] 32.76% | 7,945 | 12.7% |
[ 33.0% - 33.5% ] 33.11% | 1,063 | 13.9% |
[ 34.0% - 34.5% ] 34.27% | 356 | 3.0% |
[ 34.5% - 35.0% ] 34.55% | 301 | 8.5% |
[ 35.0% - 35.5% ] 35.39% | 1,003 | 6.4% |
[ 35.5% - 36.0% ] 35.51% | 780 | 5.1% |
[ 36.5% - 37.0% ] 36.90% | 393 | 4.2% |
[ 37.0% - 37.5% ] 37.40% | 1,179 | 2.6% |
[ 37.5% - 38.0% ] 37.61% | 117 | 13.2% |
[ 38.0% - 38.5% ] 38.28% | 1,382 | 3.6% |
[ 38.5% - 39.0% ] 38.51% | 509 | 3.7% |
[ 39.0% - 39.5% ] 39.13% | 69 | 10.5% |
[ 39.5% - 40.0% ] 39.59% | 1,109 | 3.6% |
[ 41.0% - 41.5% ] 41.47% | 516 | 5.6% |
[ 42.0% - 42.5% ] 42.40% | 1,198 | 11.5% |
[ 43.0% - 43.5% ] 43.49% | 499 | 6.2% |
[ 44.0% - 44.5% ] 44.23% | 312 | 2.2% |
[ 46.5% - 47.0% ] 46.69% | 347 | 2.2% |
[ 49.5% - 50.0% ] 49.77% | 217 | 3.3% |
[ 52.5% - 53.0% ] 52.80% | 2,072 | 15.9% |
[ 55.5% - 56.0% ] 55.70% | 237 | 5.2% |
[ 57.0% - 57.5% ] 57.04% | 277 | 7.1% |
[ 60.0% - 60.5% ] 60.15% | 133 | 1.8% |
[ 65.5% - 66.0% ] 65.69% | 137 | 5.9% |
[ 67.0% - 67.5% ] 67.12% | 73 | 3.1% |
[ 74.0% - 74.5% ] 74.07% | 27 | 8.3% |