Shoshone 4 or more Vehicles in Household

COMPARE

Shoshone
Race
Ancestry
AfghanAfricanAlaska NativeAlaskan AthabascanAlbanianAleutAlsatianAmericanApacheArabArapahoArgentineanArmenianAssyrian/Chaldean/SyriacAustralianAustrianBahamianBangladeshiBarbadianBasqueBelgianBelizeanBermudanBhutaneseBlackfeetBolivianBrazilianBritishBritish West IndianBulgarianBurmeseCajunCambodianCanadianCape VerdeanCarpatho RusynCelticCentral AmericanCentral American IndianCherokeeCheyenneChickasawChileanChineseChippewaChoctawColombianColvilleComancheCosta RicanCreeCreekCroatianCrowCubanCypriotCzechCzechoslovakianDanishDelawareDominicanDutchDutch West IndianEastern EuropeanEcuadorianEgyptianEnglishEstonianEthiopianEuropeanFijianFilipinoFinnishFrenchFrench American IndianFrench CanadianGermanGerman RussianGhanaianGreekGuamanian/ChamorroGuatemalanGuyaneseHaitianHmongHonduranHopiHoumaHungarianIcelanderIndian (Asian)IndonesianInupiatIranianIraqiIrishIroquoisIsraeliItalianJamaicanJapaneseJordanianKenyanKiowaKoreanLaotianLatvianLebaneseLiberianLithuanianLumbeeLuxembourgerMacedonianMalaysianMalteseMarshalleseMenomineeMexicanMexican American IndianMongolianMoroccanNative HawaiianNavajoNepaleseNew ZealanderNicaraguanNigerianNorthern EuropeanNorwegianOkinawanOsageOttawaPaiutePakistaniPalestinianPanamanianParaguayanPennsylvania GermanPeruvianPimaPolishPortuguesePotawatomiPuebloPuerto RicanPuget Sound SalishRomanianRussianSalvadoranSamoanScandinavianScotch-IrishScottishSeminoleSenegaleseSerbianShoshoneSierra LeoneanSiouxSlavicSlovakSloveneSomaliSouth AfricanSouth AmericanSouth American IndianSoviet UnionSpaniardSpanishSpanish AmericanSpanish American IndianSri LankanSubsaharan AfricanSudaneseSwedishSwissSyrianTaiwaneseThaiTlingit-HaidaTohono O'OdhamTonganTrinidadian and TobagonianTsimshianTurkishU.S. Virgin IslanderUgandanUkrainianUruguayanUteVenezuelanVietnameseWelshWest IndianYakamaYaquiYugoslavianYumanYup'ikZimbabwean
Immigration
NonimmigrantsImmigrantsAfghanistanAfricaAlbaniaArgentinaArmeniaAsiaAustraliaAustriaBahamasBangladeshBarbadosBelarusBelgiumBelizeBoliviaBosnia and HerzegovinaBrazilBulgariaBurma/MyanmarCabo VerdeCambodiaCameroonCanadaCaribbeanCentral AmericaChileChinaColombiaCongoCosta RicaCroatiaCubaCzechoslovakiaDenmarkDominicaDominican RepublicEastern AfricaEastern AsiaEastern EuropeEcuadorEgyptEl SalvadorEnglandEritreaEthiopiaEuropeFijiFranceGermanyGhanaGreeceGrenadaGuatemalaGuyanaHaitiHondurasHong KongHungaryIndiaIndonesiaIranIraqIrelandIsraelItalyJamaicaJapanJordanKazakhstanKenyaKoreaKuwaitLaosLatin AmericaLatviaLebanonLiberiaLithuaniaMalaysiaMexicoMicronesiaMiddle AfricaMoldovaMoroccoNepalNetherlandsNicaraguaNigeriaNorth AmericaNorth MacedoniaNorthern AfricaNorthern EuropeNorwayOceaniaPakistanPanamaPeruPhilippinesPolandPortugalRomaniaRussiaSaudi ArabiaScotlandSenegalSerbiaSierra LeoneSingaporeSomaliaSouth AfricaSouth AmericaSouth Central AsiaSouth Eastern AsiaSouthern EuropeSpainSri LankaSt. Vincent and the GrenadinesSudanSwedenSwitzerlandSyriaTaiwanThailandTrinidad and TobagoTurkeyUgandaUkraineUruguayUzbekistanVenezuelaVietnamWest IndiesWestern AfricaWestern AsiaWestern EuropeYemenZaireZimbabweAzores
Select to Compare
Race
Ancestry
AfghanAfricanAlaska NativeAlaskan AthabascanAlbanianAleutAlsatianAmericanApacheArabArapahoArgentineanArmenianAssyrian/Chaldean/SyriacAustralianAustrianBahamianBangladeshiBarbadianBasqueBelgianBelizeanBermudanBhutaneseBlackfeetBolivianBrazilianBritishBritish West IndianBulgarianBurmeseCajunCambodianCanadianCape VerdeanCarpatho RusynCelticCentral AmericanCentral American IndianCherokeeCheyenneChickasawChileanChineseChippewaChoctawColombianColvilleComancheCosta RicanCreeCreekCroatianCrowCubanCypriotCzechCzechoslovakianDanishDelawareDominicanDutchDutch West IndianEastern EuropeanEcuadorianEgyptianEnglishEstonianEthiopianEuropeanFijianFilipinoFinnishFrenchFrench American IndianFrench CanadianGermanGerman RussianGhanaianGreekGuamanian/ChamorroGuatemalanGuyaneseHaitianHmongHonduranHopiHoumaHungarianIcelanderIndian (Asian)IndonesianInupiatIranianIraqiIrishIroquoisIsraeliItalianJamaicanJapaneseJordanianKenyanKiowaKoreanLaotianLatvianLebaneseLiberianLithuanianLumbeeLuxembourgerMacedonianMalaysianMalteseMarshalleseMenomineeMexicanMexican American IndianMongolianMoroccanNative HawaiianNavajoNepaleseNew ZealanderNicaraguanNigerianNorthern EuropeanNorwegianOkinawanOsageOttawaPaiutePakistaniPalestinianPanamanianParaguayanPennsylvania GermanPeruvianPimaPolishPortuguesePotawatomiPuebloPuerto RicanPuget Sound SalishRomanianRussianSalvadoranSamoanScandinavianScotch-IrishScottishSeminoleSenegaleseSerbianSierra LeoneanSiouxSlavicSlovakSloveneSomaliSouth AfricanSouth AmericanSouth American IndianSoviet UnionSpaniardSpanishSpanish AmericanSpanish American IndianSri LankanSubsaharan AfricanSudaneseSwedishSwissSyrianTaiwaneseThaiTlingit-HaidaTohono O'OdhamTonganTrinidadian and TobagonianTsimshianTurkishU.S. Virgin IslanderUgandanUkrainianUruguayanUteVenezuelanVietnameseWelshWest IndianYakamaYaquiYugoslavianYumanYup'ikZimbabwean
Immigration
NonimmigrantsImmigrantsAfghanistanAfricaAlbaniaArgentinaArmeniaAsiaAustraliaAustriaBahamasBangladeshBarbadosBelarusBelgiumBelizeBoliviaBosnia and HerzegovinaBrazilBulgariaBurma/MyanmarCabo VerdeCambodiaCameroonCanadaCaribbeanCentral AmericaChileChinaColombiaCongoCosta RicaCroatiaCubaCzechoslovakiaDenmarkDominicaDominican RepublicEastern AfricaEastern AsiaEastern EuropeEcuadorEgyptEl SalvadorEnglandEritreaEthiopiaEuropeFijiFranceGermanyGhanaGreeceGrenadaGuatemalaGuyanaHaitiHondurasHong KongHungaryIndiaIndonesiaIranIraqIrelandIsraelItalyJamaicaJapanJordanKazakhstanKenyaKoreaKuwaitLaosLatin AmericaLatviaLebanonLiberiaLithuaniaMalaysiaMexicoMicronesiaMiddle AfricaMoldovaMoroccoNepalNetherlandsNicaraguaNigeriaNorth AmericaNorth MacedoniaNorthern AfricaNorthern EuropeNorwayOceaniaPakistanPanamaPeruPhilippinesPolandPortugalRomaniaRussiaSaudi ArabiaScotlandSenegalSerbiaSierra LeoneSingaporeSomaliaSouth AfricaSouth AmericaSouth Central AsiaSouth Eastern AsiaSouthern EuropeSpainSri LankaSt. Vincent and the GrenadinesSudanSwedenSwitzerlandSyriaTaiwanThailandTrinidad and TobagoTurkeyUgandaUkraineUruguayUzbekistanVenezuelaVietnamWest IndiesWestern AfricaWestern AsiaWestern EuropeYemenZaireZimbabweAzores
4 or more Vehicles in Household
Income
Poverty
Unemployment
Labor Participation
Family Structure
Vehicle Availability
Education Level
Disability

Shoshone 4 or more Vehicles in Household
Exceptional

8.8%
4+ VEHICLES AVAILABLE
100.0/ 100
METRIC RATING
15th/ 347
METRIC RANK

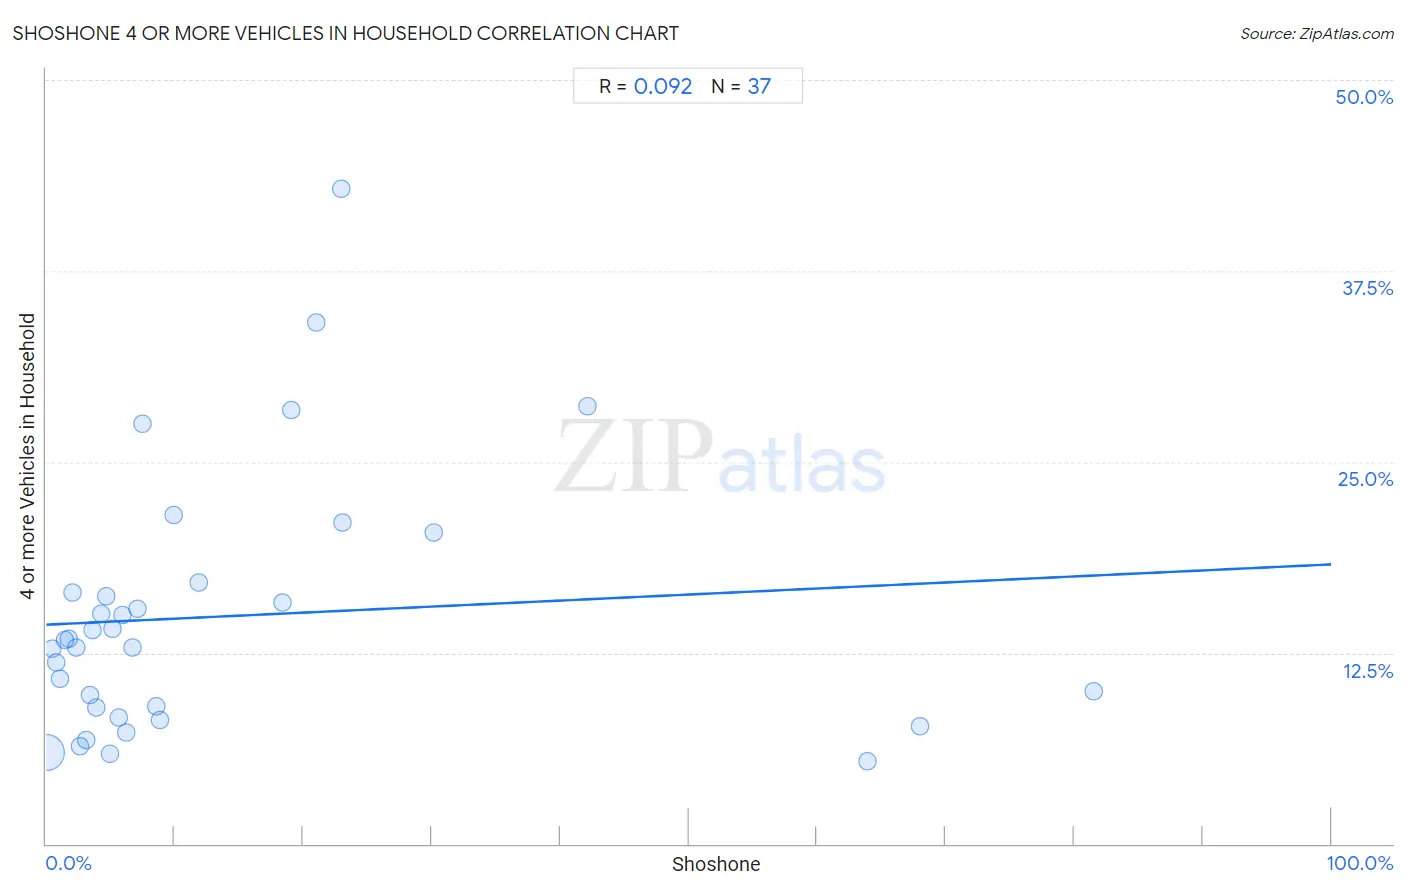
Shoshone 4 or more Vehicles in Household Correlation Chart

The statistical analysis conducted on geographies consisting of 66,577,093 people shows a slight positive correlation between the proportion of Shoshone and percentage of households with 4 or more vehicles available in the United States with a correlation coefficient (R) of 0.092 and weighted average of 8.8%. On average, for every 1% (one percent) increase in Shoshone within a typical geography, there is an increase of 0.039% in percentage of households with 4 or more vehicles available.
Shoshone 4 or more Vehicles in Household
It is essential to understand that the correlation between the percentage of Shoshone and percentage of households with 4 or more vehicles available does not imply a direct cause-and-effect relationship. It remains uncertain whether the presence of Shoshone influences an upward or downward trend in the level of percentage of households with 4 or more vehicles available within an area, or if Shoshone simply ended up residing in those areas with higher or lower levels of percentage of households with 4 or more vehicles available due to other factors.

Demographics Similar to Shoshone by 4 or more Vehicles in Household

In terms of 4 or more vehicles in household, the demographic groups most similar to Shoshone are Chinese (8.8%, a difference of 0.030%), Lumbee (8.8%, a difference of 0.71%), Hawaiian (8.9%, a difference of 1.0%), Mexican (8.9%, a difference of 1.0%), and Ute (8.8%, a difference of 1.1%).
DemographicsRating | Rank4 or more Vehicles in Household
Arapaho
100.0
/100
|
#8
Exceptional
9.4%
Samoans
100.0
/100
|
#9
Exceptional
9.2%
Paiute
100.0
/100
|
#10
Exceptional
9.0%
Immigrants from Mexico
100.0
/100
|
#11
Exceptional
9.0%
Mexicans
100.0
/100
|
#12
Exceptional
8.9%
Hawaiians
100.0
/100
|
#13
Exceptional
8.9%
Chinese
100.0
/100
|
#14
Exceptional
8.8%
Shoshone
100.0
/100
|
#15
Exceptional
8.8%
Lumbee
100.0
/100
|
#16
Exceptional
8.8%
Ute
100.0
/100
|
#17
Exceptional
8.8%
Nepalese
100.0
/100
|
#18
Exceptional
8.7%
Koreans
100.0
/100
|
#19
Exceptional
8.6%
Pueblo
100.0
/100
|
#20
Exceptional
8.6%
Danes
100.0
/100
|
#21
Exceptional
8.6%
Immigrants from Vietnam
100.0
/100
|
#22
Exceptional
8.6%

Shoshone 4 or more Vehicles in Household Correlation Summary

MeasurementShoshone Data4 or more Vehicles in Household Data
Minimum0.025%5.4%
Maximum81.5%42.9%
Range81.5%37.5%
Mean13.9%14.9%
Median6.0%13.3%
Interquartile 25% (IQ1)2.9%8.6%
Interquartile 75% (IQ3)18.7%16.8%
Interquartile Range (IQR)15.9%8.2%
Standard Deviation (Sample)19.7%8.4%
Standard Deviation (Population)19.4%8.3%

Correlation Details

Shoshone PercentileSample Size4 or more Vehicles in Household
[
0.0%
-
0.5%
]
0.025%
65,325,2985.9%
[
0.0%
-
0.5%
]
0.47%
675,67412.8%
[
0.5%
-
1.0%
]
0.76%
287,08411.9%
[
1.0%
-
1.5%
]
1.07%
67,81510.8%
[
1.0%
-
1.5%
]
1.45%
80,24313.3%
[
1.5%
-
2.0%
]
1.71%
9,50813.4%
[
2.0%
-
2.5%
]
2.07%
3,32916.4%
[
2.0%
-
2.5%
]
2.37%
33,84812.8%
[
2.5%
-
3.0%
]
2.64%
2,2366.4%
[
3.0%
-
3.5%
]
3.08%
13,2256.8%
[
3.0%
-
3.5%
]
3.39%
29,1459.7%
[
3.5%
-
4.0%
]
3.61%
1,10714.0%
[
3.5%
-
4.0%
]
3.91%
1,0498.9%
[
4.0%
-
4.5%
]
4.30%
3,25815.1%
[
4.5%
-
5.0%
]
4.70%
3,95716.2%
[
5.0%
-
5.5%
]
5.00%
5205.9%
[
5.0%
-
5.5%
]
5.16%
3,49014.1%
[
5.5%
-
6.0%
]
5.63%
1,3508.3%
[
5.5%
-
6.0%
]
5.96%
7,21215.0%
[
6.0%
-
6.5%
]
6.21%
2907.3%
[
6.5%
-
7.0%
]
6.68%
13,98912.8%
[
7.0%
-
7.5%
]
7.14%
1,82115.3%
[
7.0%
-
7.5%
]
7.50%
24027.5%
[
8.5%
-
9.0%
]
8.51%
2,6089.0%
[
8.5%
-
9.0%
]
8.83%
2,2658.1%
[
9.5%
-
10.0%
]
9.94%
18121.5%
[
11.5%
-
12.0%
]
11.83%
1,47117.1%
[
18.0%
-
18.5%
]
18.37%
28315.8%
[
19.0%
-
19.5%
]
19.05%
23128.4%
[
21.0%
-
21.5%
]
21.05%
30434.2%
[
22.5%
-
23.0%
]
22.92%
4842.9%
[
23.0%
-
23.5%
]
23.08%
7821.1%
[
30.0%
-
30.5%
]
30.15%
19920.3%
[
42.0%
-
42.5%
]
42.11%
51328.7%
[
63.5%
-
64.0%
]
63.88%
1,4815.4%
[
68.0%
-
68.5%
]
68.00%
1,5977.7%
[
81.5%
-
82.0%
]
81.51%
14610.0%