Carpatho Rusyn 4 or more Vehicles in Household

COMPARE

Carpatho Rusyn
Race
Ancestry
AfghanAfricanAlaska NativeAlaskan AthabascanAlbanianAleutAlsatianAmericanApacheArabArapahoArgentineanArmenianAssyrian/Chaldean/SyriacAustralianAustrianBahamianBangladeshiBarbadianBasqueBelgianBelizeanBermudanBhutaneseBlackfeetBolivianBrazilianBritishBritish West IndianBulgarianBurmeseCajunCambodianCanadianCape VerdeanCarpatho RusynCelticCentral AmericanCentral American IndianCherokeeCheyenneChickasawChileanChineseChippewaChoctawColombianColvilleComancheCosta RicanCreeCreekCroatianCrowCubanCypriotCzechCzechoslovakianDanishDelawareDominicanDutchDutch West IndianEastern EuropeanEcuadorianEgyptianEnglishEstonianEthiopianEuropeanFijianFilipinoFinnishFrenchFrench American IndianFrench CanadianGermanGerman RussianGhanaianGreekGuamanian/ChamorroGuatemalanGuyaneseHaitianHmongHonduranHopiHoumaHungarianIcelanderIndian (Asian)IndonesianInupiatIranianIraqiIrishIroquoisIsraeliItalianJamaicanJapaneseJordanianKenyanKiowaKoreanLaotianLatvianLebaneseLiberianLithuanianLumbeeLuxembourgerMacedonianMalaysianMalteseMarshalleseMenomineeMexicanMexican American IndianMongolianMoroccanNative HawaiianNavajoNepaleseNew ZealanderNicaraguanNigerianNorthern EuropeanNorwegianOkinawanOsageOttawaPaiutePakistaniPalestinianPanamanianParaguayanPennsylvania GermanPeruvianPimaPolishPortuguesePotawatomiPuebloPuerto RicanPuget Sound SalishRomanianRussianSalvadoranSamoanScandinavianScotch-IrishScottishSeminoleSenegaleseSerbianShoshoneSierra LeoneanSiouxSlavicSlovakSloveneSomaliSouth AfricanSouth AmericanSouth American IndianSoviet UnionSpaniardSpanishSpanish AmericanSpanish American IndianSri LankanSubsaharan AfricanSudaneseSwedishSwissSyrianTaiwaneseThaiTlingit-HaidaTohono O'OdhamTonganTrinidadian and TobagonianTsimshianTurkishU.S. Virgin IslanderUgandanUkrainianUruguayanUteVenezuelanVietnameseWelshWest IndianYakamaYaquiYugoslavianYumanYup'ikZimbabwean
Immigration
NonimmigrantsImmigrantsAfghanistanAfricaAlbaniaArgentinaArmeniaAsiaAustraliaAustriaBahamasBangladeshBarbadosBelarusBelgiumBelizeBoliviaBosnia and HerzegovinaBrazilBulgariaBurma/MyanmarCabo VerdeCambodiaCameroonCanadaCaribbeanCentral AmericaChileChinaColombiaCongoCosta RicaCroatiaCubaCzechoslovakiaDenmarkDominicaDominican RepublicEastern AfricaEastern AsiaEastern EuropeEcuadorEgyptEl SalvadorEnglandEritreaEthiopiaEuropeFijiFranceGermanyGhanaGreeceGrenadaGuatemalaGuyanaHaitiHondurasHong KongHungaryIndiaIndonesiaIranIraqIrelandIsraelItalyJamaicaJapanJordanKazakhstanKenyaKoreaKuwaitLaosLatin AmericaLatviaLebanonLiberiaLithuaniaMalaysiaMexicoMicronesiaMiddle AfricaMoldovaMoroccoNepalNetherlandsNicaraguaNigeriaNorth AmericaNorth MacedoniaNorthern AfricaNorthern EuropeNorwayOceaniaPakistanPanamaPeruPhilippinesPolandPortugalRomaniaRussiaSaudi ArabiaScotlandSenegalSerbiaSierra LeoneSingaporeSomaliaSouth AfricaSouth AmericaSouth Central AsiaSouth Eastern AsiaSouthern EuropeSpainSri LankaSt. Vincent and the GrenadinesSudanSwedenSwitzerlandSyriaTaiwanThailandTrinidad and TobagoTurkeyUgandaUkraineUruguayUzbekistanVenezuelaVietnamWest IndiesWestern AfricaWestern AsiaWestern EuropeYemenZaireZimbabweAzores
Select to Compare
Race
Ancestry
AfghanAfricanAlaska NativeAlaskan AthabascanAlbanianAleutAlsatianAmericanApacheArabArapahoArgentineanArmenianAssyrian/Chaldean/SyriacAustralianAustrianBahamianBangladeshiBarbadianBasqueBelgianBelizeanBermudanBhutaneseBlackfeetBolivianBrazilianBritishBritish West IndianBulgarianBurmeseCajunCambodianCanadianCape VerdeanCelticCentral AmericanCentral American IndianCherokeeCheyenneChickasawChileanChineseChippewaChoctawColombianColvilleComancheCosta RicanCreeCreekCroatianCrowCubanCypriotCzechCzechoslovakianDanishDelawareDominicanDutchDutch West IndianEastern EuropeanEcuadorianEgyptianEnglishEstonianEthiopianEuropeanFijianFilipinoFinnishFrenchFrench American IndianFrench CanadianGermanGerman RussianGhanaianGreekGuamanian/ChamorroGuatemalanGuyaneseHaitianHmongHonduranHopiHoumaHungarianIcelanderIndian (Asian)IndonesianInupiatIranianIraqiIrishIroquoisIsraeliItalianJamaicanJapaneseJordanianKenyanKiowaKoreanLaotianLatvianLebaneseLiberianLithuanianLumbeeLuxembourgerMacedonianMalaysianMalteseMarshalleseMenomineeMexicanMexican American IndianMongolianMoroccanNative HawaiianNavajoNepaleseNew ZealanderNicaraguanNigerianNorthern EuropeanNorwegianOkinawanOsageOttawaPaiutePakistaniPalestinianPanamanianParaguayanPennsylvania GermanPeruvianPimaPolishPortuguesePotawatomiPuebloPuerto RicanPuget Sound SalishRomanianRussianSalvadoranSamoanScandinavianScotch-IrishScottishSeminoleSenegaleseSerbianShoshoneSierra LeoneanSiouxSlavicSlovakSloveneSomaliSouth AfricanSouth AmericanSouth American IndianSoviet UnionSpaniardSpanishSpanish AmericanSpanish American IndianSri LankanSubsaharan AfricanSudaneseSwedishSwissSyrianTaiwaneseThaiTlingit-HaidaTohono O'OdhamTonganTrinidadian and TobagonianTsimshianTurkishU.S. Virgin IslanderUgandanUkrainianUruguayanUteVenezuelanVietnameseWelshWest IndianYakamaYaquiYugoslavianYumanYup'ikZimbabwean
Immigration
NonimmigrantsImmigrantsAfghanistanAfricaAlbaniaArgentinaArmeniaAsiaAustraliaAustriaBahamasBangladeshBarbadosBelarusBelgiumBelizeBoliviaBosnia and HerzegovinaBrazilBulgariaBurma/MyanmarCabo VerdeCambodiaCameroonCanadaCaribbeanCentral AmericaChileChinaColombiaCongoCosta RicaCroatiaCubaCzechoslovakiaDenmarkDominicaDominican RepublicEastern AfricaEastern AsiaEastern EuropeEcuadorEgyptEl SalvadorEnglandEritreaEthiopiaEuropeFijiFranceGermanyGhanaGreeceGrenadaGuatemalaGuyanaHaitiHondurasHong KongHungaryIndiaIndonesiaIranIraqIrelandIsraelItalyJamaicaJapanJordanKazakhstanKenyaKoreaKuwaitLaosLatin AmericaLatviaLebanonLiberiaLithuaniaMalaysiaMexicoMicronesiaMiddle AfricaMoldovaMoroccoNepalNetherlandsNicaraguaNigeriaNorth AmericaNorth MacedoniaNorthern AfricaNorthern EuropeNorwayOceaniaPakistanPanamaPeruPhilippinesPolandPortugalRomaniaRussiaSaudi ArabiaScotlandSenegalSerbiaSierra LeoneSingaporeSomaliaSouth AfricaSouth AmericaSouth Central AsiaSouth Eastern AsiaSouthern EuropeSpainSri LankaSt. Vincent and the GrenadinesSudanSwedenSwitzerlandSyriaTaiwanThailandTrinidad and TobagoTurkeyUgandaUkraineUruguayUzbekistanVenezuelaVietnamWest IndiesWestern AfricaWestern AsiaWestern EuropeYemenZaireZimbabweAzores
4 or more Vehicles in Household
Income
Poverty
Unemployment
Labor Participation
Family Structure
Vehicle Availability
Education Level
Disability

Carpatho Rusyn 4 or more Vehicles in Household
Tragic

5.5%
4+ VEHICLES AVAILABLE
0.7/ 100
METRIC RATING
269th/ 347
METRIC RANK

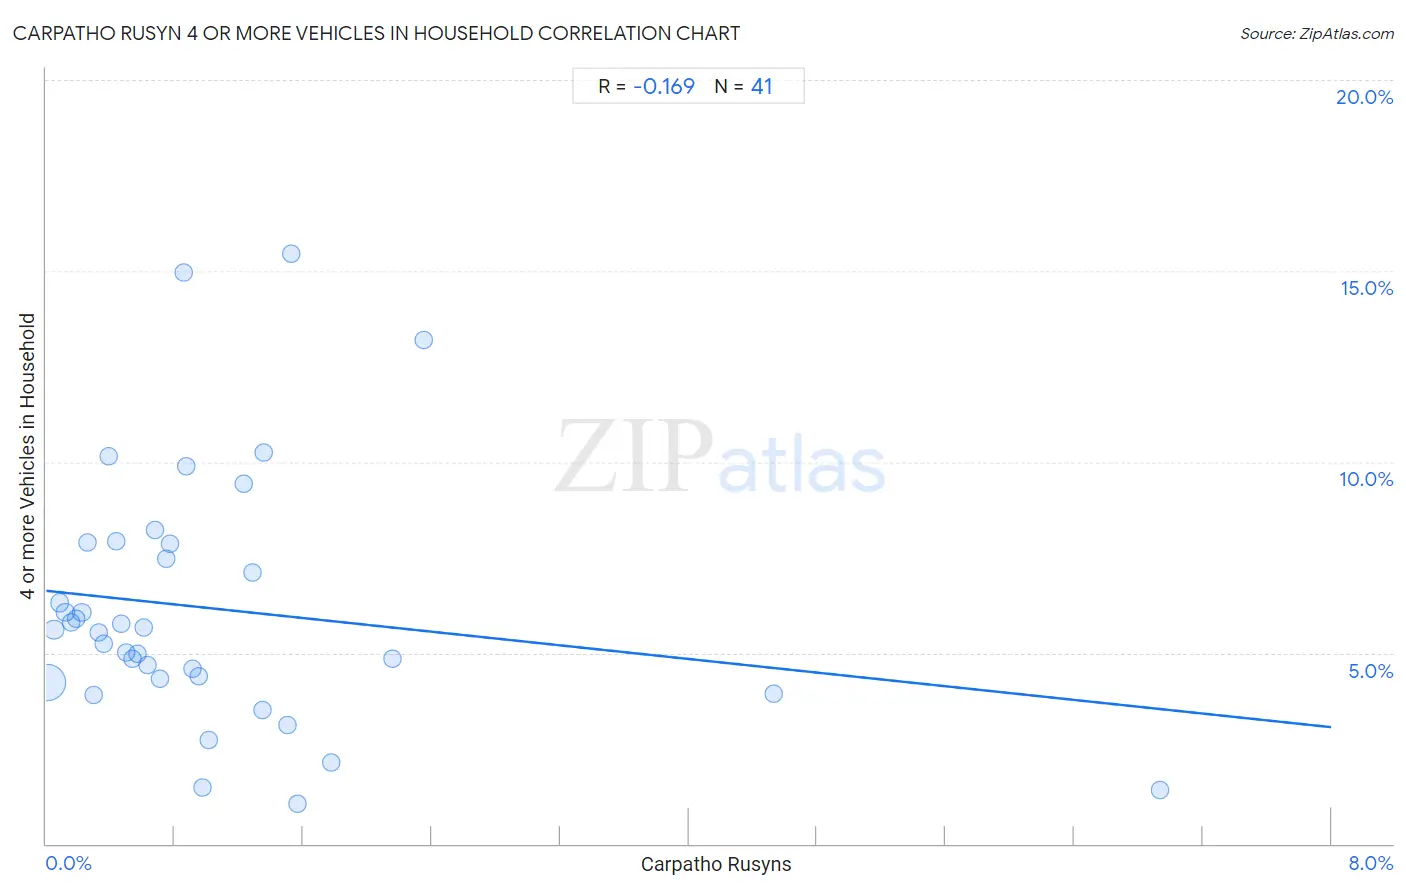
Carpatho Rusyn 4 or more Vehicles in Household Correlation Chart

The statistical analysis conducted on geographies consisting of 58,837,800 people shows a poor negative correlation between the proportion of Carpatho Rusyns and percentage of households with 4 or more vehicles available in the United States with a correlation coefficient (R) of -0.169 and weighted average of 5.5%. On average, for every 1% (one percent) increase in Carpatho Rusyns within a typical geography, there is a decrease of 0.45% in percentage of households with 4 or more vehicles available.
Carpatho Rusyn 4 or more Vehicles in Household
It is essential to understand that the correlation between the percentage of Carpatho Rusyns and percentage of households with 4 or more vehicles available does not imply a direct cause-and-effect relationship. It remains uncertain whether the presence of Carpatho Rusyns influences an upward or downward trend in the level of percentage of households with 4 or more vehicles available within an area, or if Carpatho Rusyns simply ended up residing in those areas with higher or lower levels of percentage of households with 4 or more vehicles available due to other factors.

Demographics Similar to Carpatho Rusyns by 4 or more Vehicles in Household

In terms of 4 or more vehicles in household, the demographic groups most similar to Carpatho Rusyns are Colombian (5.5%, a difference of 0.16%), Okinawan (5.5%, a difference of 0.20%), Immigrants from Sudan (5.5%, a difference of 0.30%), Immigrants from Kazakhstan (5.5%, a difference of 0.50%), and Macedonian (5.5%, a difference of 0.53%).
DemographicsRating | Rank4 or more Vehicles in Household
Bermudans
1.2
/100
|
#262
Tragic
5.6%
Immigrants from Saudi Arabia
1.1
/100
|
#263
Tragic
5.6%
Immigrants from Africa
1.0
/100
|
#264
Tragic
5.6%
South Americans
0.9
/100
|
#265
Tragic
5.6%
Immigrants from Nepal
0.9
/100
|
#266
Tragic
5.6%
Immigrants from Ukraine
0.9
/100
|
#267
Tragic
5.6%
Colombians
0.7
/100
|
#268
Tragic
5.5%
Carpatho Rusyns
0.7
/100
|
#269
Tragic
5.5%
Okinawans
0.6
/100
|
#270
Tragic
5.5%
Immigrants from Sudan
0.6
/100
|
#271
Tragic
5.5%
Immigrants from Kazakhstan
0.6
/100
|
#272
Tragic
5.5%
Macedonians
0.6
/100
|
#273
Tragic
5.5%
Blacks/African Americans
0.6
/100
|
#274
Tragic
5.5%
Cambodians
0.5
/100
|
#275
Tragic
5.5%
Immigrants from Latvia
0.5
/100
|
#276
Tragic
5.5%

Carpatho Rusyn 4 or more Vehicles in Household Correlation Summary

MeasurementCarpatho Rusyn Data4 or more Vehicles in Household Data
Minimum0.0073%1.0%
Maximum6.9%15.4%
Range6.9%14.4%
Mean1.0%6.2%
Median0.71%5.6%
Interquartile 25% (IQ1)0.34%4.3%
Interquartile 75% (IQ3)1.3%7.9%
Interquartile Range (IQR)0.97%3.6%
Standard Deviation (Sample)1.2%3.3%
Standard Deviation (Population)1.2%3.3%

Correlation Details

Carpatho Rusyn PercentileSample Size4 or more Vehicles in Household
[
0.0%
-
0.5%
]
0.0073%
48,800,2274.2%
[
0.0%
-
0.5%
]
0.047%
4,958,0935.6%
[
0.0%
-
0.5%
]
0.083%
1,902,2856.3%
[
0.0%
-
0.5%
]
0.12%
1,197,4396.1%
[
0.0%
-
0.5%
]
0.16%
395,0825.8%
[
0.0%
-
0.5%
]
0.19%
325,3275.9%
[
0.0%
-
0.5%
]
0.22%
312,9346.1%
[
0.0%
-
0.5%
]
0.26%
124,5527.9%
[
0.0%
-
0.5%
]
0.29%
231,2073.9%
[
0.0%
-
0.5%
]
0.33%
104,9295.5%
[
0.0%
-
0.5%
]
0.36%
53,8745.2%
[
0.0%
-
0.5%
]
0.39%
54,75510.2%
[
0.0%
-
0.5%
]
0.43%
30,2007.9%
[
0.0%
-
0.5%
]
0.47%
123,1725.8%
[
0.0%
-
0.5%
]
0.50%
28,0825.0%
[
0.5%
-
1.0%
]
0.54%
10,9504.8%
[
0.5%
-
1.0%
]
0.56%
10,6325.0%
[
0.5%
-
1.0%
]
0.61%
61,0675.7%
[
0.5%
-
1.0%
]
0.63%
12,0424.7%
[
0.5%
-
1.0%
]
0.67%
3,5608.2%
[
0.5%
-
1.0%
]
0.71%
8,5034.3%
[
0.5%
-
1.0%
]
0.75%
17,7487.5%
[
0.5%
-
1.0%
]
0.77%
1,5507.8%
[
0.5%
-
1.0%
]
0.85%
3,27514.9%
[
0.5%
-
1.0%
]
0.88%
20,9149.9%
[
0.5%
-
1.0%
]
0.91%
3,8534.6%
[
0.5%
-
1.0%
]
0.95%
5,5844.4%
[
0.5%
-
1.0%
]
0.97%
6171.5%
[
1.0%
-
1.5%
]
1.01%
7,4082.7%
[
1.0%
-
1.5%
]
1.23%
9,9859.4%
[
1.0%
-
1.5%
]
1.29%
3,0317.1%
[
1.0%
-
1.5%
]
1.34%
7,5143.5%
[
1.0%
-
1.5%
]
1.36%
1,84110.2%
[
1.5%
-
2.0%
]
1.50%
4663.1%
[
1.5%
-
2.0%
]
1.53%
72115.4%
[
1.5%
-
2.0%
]
1.56%
8311.0%
[
1.5%
-
2.0%
]
1.78%
9572.1%
[
2.0%
-
2.5%
]
2.15%
3254.8%
[
2.0%
-
2.5%
]
2.35%
8513.2%
[
4.5%
-
5.0%
]
4.53%
2653.9%
[
6.5%
-
7.0%
]
6.93%
1,9181.4%