Cities with the Highest Percentage of Immigrants from Oceania in Virginia
RELATED REPORTS & OPTIONS
Oceania
Virginia
Compare Cities
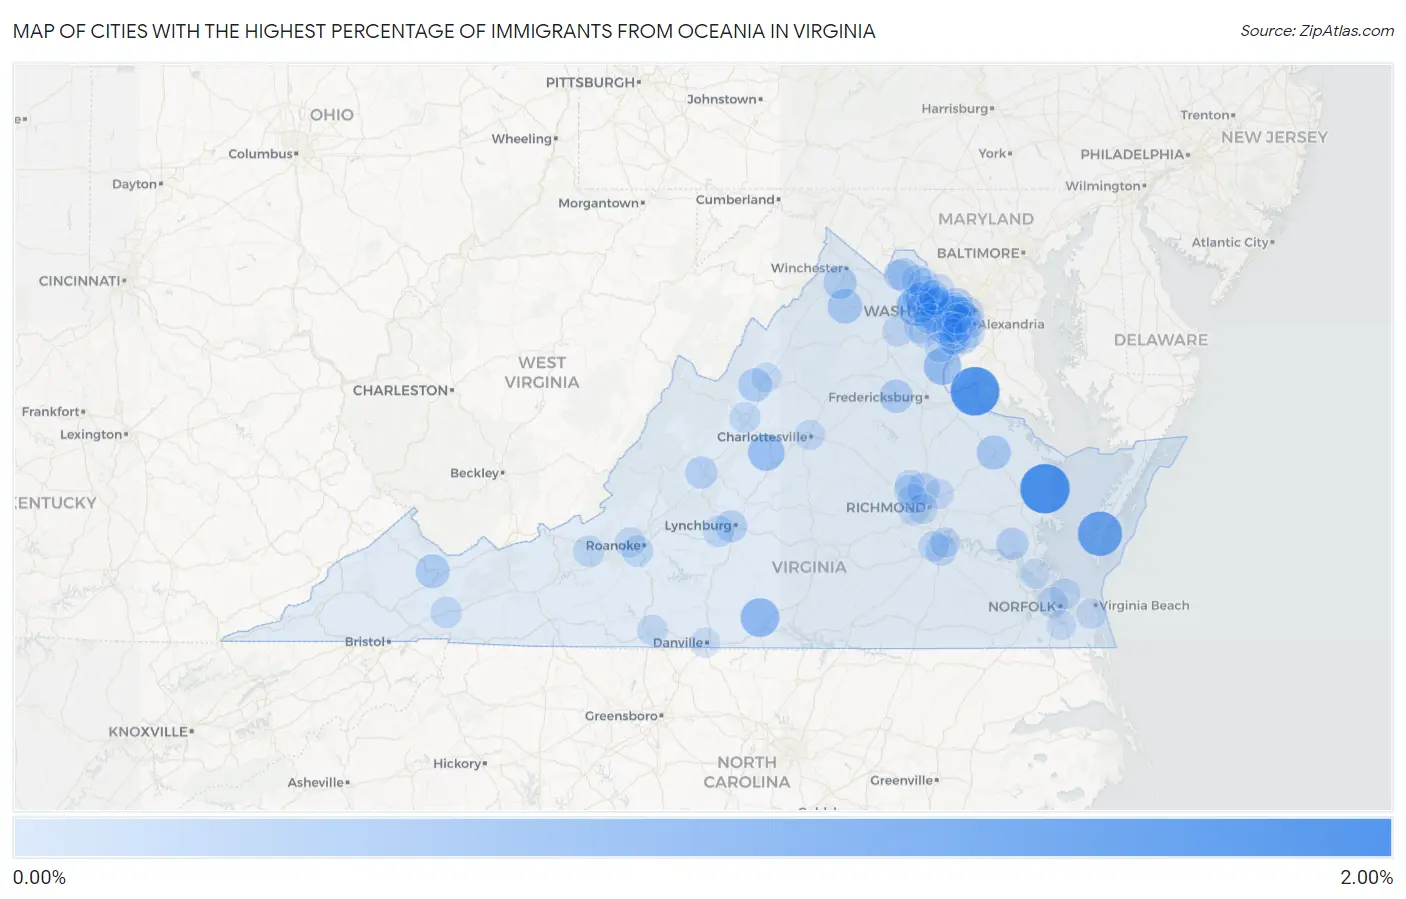
Map of Cities with the Highest Percentage of Immigrants from Oceania in Virginia
0.00%
2.00%
Cities with the Highest Percentage of Immigrants from Oceania in Virginia
| City | Oceania | vs State | vs National | |
| 1. | Irvington | 1.73% | 0.043%(+1.69)#-1 | 0.089%(+1.65)#0 |
| 2. | Dahlgren Center | 1.66% | 0.043%(+1.62)#0 | 0.089%(+1.57)#1 |
| 3. | Eastville | 1.27% | 0.043%(+1.22)#1 | 0.089%(+1.18)#2 |
| 4. | Stone Ridge | 0.79% | 0.043%(+0.742)#2 | 0.089%(+0.696)#3 |
| 5. | Halifax | 0.76% | 0.043%(+0.714)#3 | 0.089%(+0.669)#4 |
| 6. | Quantico Base | 0.63% | 0.043%(+0.589)#4 | 0.089%(+0.544)#5 |
| 7. | Nellysford | 0.57% | 0.043%(+0.530)#5 | 0.089%(+0.484)#6 |
| 8. | Front Royal | 0.39% | 0.043%(+0.348)#6 | 0.089%(+0.303)#7 |
| 9. | Mclean | 0.37% | 0.043%(+0.322)#7 | 0.089%(+0.276)#8 |
| 10. | Tappahannock | 0.36% | 0.043%(+0.321)#8 | 0.089%(+0.276)#9 |
| 11. | Richlands | 0.34% | 0.043%(+0.298)#9 | 0.089%(+0.253)#10 |
| 12. | Hamilton | 0.30% | 0.043%(+0.253)#10 | 0.089%(+0.208)#11 |
| 13. | Bridgewater | 0.29% | 0.043%(+0.246)#11 | 0.089%(+0.200)#12 |
| 14. | Lake Wilderness | 0.29% | 0.043%(+0.245)#12 | 0.089%(+0.200)#13 |
| 15. | Stephens City | 0.28% | 0.043%(+0.241)#13 | 0.089%(+0.196)#14 |
| 16. | Oakton | 0.27% | 0.043%(+0.222)#14 | 0.089%(+0.177)#15 |
| 17. | Fort Belvoir | 0.26% | 0.043%(+0.212)#15 | 0.089%(+0.167)#16 |
| 18. | Mantua | 0.25% | 0.043%(+0.209)#16 | 0.089%(+0.164)#17 |
| 19. | Fairfax Station | 0.24% | 0.043%(+0.193)#17 | 0.089%(+0.148)#18 |
| 20. | Brambleton | 0.22% | 0.043%(+0.180)#18 | 0.089%(+0.135)#19 |
| 21. | Williamsburg | 0.21% | 0.043%(+0.163)#19 | 0.089%(+0.118)#20 |
| 22. | Lexington | 0.20% | 0.043%(+0.161)#20 | 0.089%(+0.116)#21 |
| 23. | Idylwood | 0.20% | 0.043%(+0.159)#21 | 0.089%(+0.114)#22 |
| 24. | Loudoun Valley Estates | 0.19% | 0.043%(+0.147)#22 | 0.089%(+0.102)#38 |
| 25. | Alexandria | 0.18% | 0.043%(+0.141)#23 | 0.089%(+0.095)#74 |
| 26. | One Loudoun | 0.18% | 0.043%(+0.136)#24 | 0.089%(+0.091)#75 |
| 27. | Floris | 0.18% | 0.043%(+0.132)#25 | 0.089%(+0.087)#76 |
| 28. | Glen Allen | 0.17% | 0.043%(+0.129)#26 | 0.089%(+0.084)#77 |
| 29. | Lynchburg | 0.17% | 0.043%(+0.128)#27 | 0.089%(+0.083)#78 |
| 30. | Lowes Island | 0.15% | 0.043%(+0.107)#28 | 0.089%(+0.062)#79 |
| 31. | Arlington | 0.15% | 0.043%(+0.103)#29 | 0.089%(+0.058)#240 |
| 32. | Lansdowne | 0.14% | 0.043%(+0.097)#30 | 0.089%(+0.052)#241 |
| 33. | Laurel Hill | 0.14% | 0.043%(+0.093)#31 | 0.089%(+0.048)#242 |
| 34. | Difficult Run | 0.13% | 0.043%(+0.091)#32 | 0.089%(+0.046)#243 |
| 35. | Fort Lee | 0.13% | 0.043%(+0.089)#33 | 0.089%(+0.043)#244 |
| 36. | Forest | 0.13% | 0.043%(+0.086)#34 | 0.089%(+0.041)#245 |
| 37. | Chilhowie | 0.13% | 0.043%(+0.083)#35 | 0.089%(+0.038)#246 |
| 38. | Chantilly | 0.13% | 0.043%(+0.082)#36 | 0.089%(+0.037)#247 |
| 39. | Cave Spring | 0.12% | 0.043%(+0.080)#37 | 0.089%(+0.034)#248 |
| 40. | Mcnair | 0.12% | 0.043%(+0.078)#38 | 0.089%(+0.033)#249 |
| 41. | Bull Run | 0.12% | 0.043%(+0.077)#39 | 0.089%(+0.032)#250 |
| 42. | Falls Church | 0.12% | 0.043%(+0.073)#40 | 0.089%(+0.028)#251 |
| 43. | Reston | 0.11% | 0.043%(+0.069)#41 | 0.089%(+0.024)#252 |
| 44. | Rose Hill Cdp Fairfax County | 0.10% | 0.043%(+0.060)#42 | 0.089%(+0.015)#253 |
| 45. | Blacksburg | 0.10% | 0.043%(+0.058)#43 | 0.089%(+0.013)#254 |
| 46. | Fair Lakes | 0.10% | 0.043%(+0.057)#44 | 0.089%(+0.012)#255 |
| 47. | Lorton | 0.091% | 0.043%(+0.047)#45 | 0.089%(+0.002)#256 |
| 48. | Staunton | 0.086% | 0.043%(+0.043)#46 | 0.089%(-0.003)#257 |
| 49. | Dunn Loring | 0.080% | 0.043%(+0.037)#47 | 0.089%(-0.008)#258 |
| 50. | Norfolk | 0.074% | 0.043%(+0.030)#48 | 0.089%(-0.015)#278 |
| 51. | Bailey S Crossroads | 0.073% | 0.043%(+0.029)#49 | 0.089%(-0.016)#279 |
| 52. | Tysons | 0.072% | 0.043%(+0.029)#50 | 0.089%(-0.016)#280 |
| 53. | South Run | 0.072% | 0.043%(+0.029)#51 | 0.089%(-0.017)#281 |
| 54. | Portsmouth | 0.070% | 0.043%(+0.026)#52 | 0.089%(-0.019)#282 |
| 55. | Martinsville | 0.066% | 0.043%(+0.023)#53 | 0.089%(-0.022)#283 |
| 56. | Burke | 0.063% | 0.043%(+0.020)#54 | 0.089%(-0.025)#284 |
| 57. | Bon Air | 0.063% | 0.043%(+0.020)#55 | 0.089%(-0.026)#285 |
| 58. | New Baltimore | 0.060% | 0.043%(+0.016)#56 | 0.089%(-0.029)#286 |
| 59. | Wyndham | 0.058% | 0.043%(+0.014)#57 | 0.089%(-0.031)#287 |
| 60. | Newington Forest | 0.055% | 0.043%(+0.012)#58 | 0.089%(-0.033)#288 |
| 61. | Colonial Heights | 0.050% | 0.043%(+0.006)#59 | 0.089%(-0.039)#289 |
| 62. | Salem | 0.047% | 0.043%(+0.004)#60 | 0.089%(-0.041)#290 |
| 63. | Purcellville | 0.045% | 0.043%(+0.001)#61 | 0.089%(-0.044)#291 |
| 64. | Herndon | 0.041% | 0.043%(-0.003)#62 | 0.089%(-0.048)#292 |
| 65. | Ashburn | 0.040% | 0.043%(-0.004)#63 | 0.089%(-0.049)#293 |
| 66. | Hopewell | 0.039% | 0.043%(-0.004)#64 | 0.089%(-0.050)#294 |
| 67. | Short Pump | 0.039% | 0.043%(-0.005)#65 | 0.089%(-0.050)#295 |
| 68. | Leesburg | 0.033% | 0.043%(-0.010)#66 | 0.089%(-0.056)#296 |
| 69. | Virginia Beach | 0.027% | 0.043%(-0.017)#67 | 0.089%(-0.062)#297 |
| 70. | Mechanicsville | 0.026% | 0.043%(-0.017)#68 | 0.089%(-0.063)#298 |
| 71. | Charlottesville | 0.026% | 0.043%(-0.018)#69 | 0.089%(-0.063)#299 |
| 72. | Manassas | 0.026% | 0.043%(-0.018)#70 | 0.089%(-0.063)#300 |
| 73. | Springfield | 0.026% | 0.043%(-0.018)#71 | 0.089%(-0.063)#301 |
| 74. | Sterling | 0.026% | 0.043%(-0.018)#72 | 0.089%(-0.063)#302 |
| 75. | West Springfield | 0.026% | 0.043%(-0.018)#73 | 0.089%(-0.063)#303 |
| 76. | Richmond | 0.024% | 0.043%(-0.020)#74 | 0.089%(-0.065)#307 |
| 77. | Dale City | 0.022% | 0.043%(-0.022)#75 | 0.089%(-0.067)#308 |
| 78. | Centreville | 0.021% | 0.043%(-0.023)#76 | 0.089%(-0.068)#309 |
| 79. | Hybla Valley | 0.017% | 0.043%(-0.027)#77 | 0.089%(-0.072)#310 |
| 80. | South Riding | 0.012% | 0.043%(-0.031)#78 | 0.089%(-0.077)#311 |
| 81. | Danville | 0.012% | 0.043%(-0.032)#79 | 0.089%(-0.077)#312 |
| 82. | Harrisonburg | 0.012% | 0.043%(-0.032)#80 | 0.089%(-0.077)#313 |
| 83. | Newport News | 0.0097% | 0.043%(-0.034)#81 | 0.089%(-0.079)#328 |
| 84. | Annandale | 0.0094% | 0.043%(-0.034)#82 | 0.089%(-0.079)#329 |
| 85. | Tuckahoe | 0.0083% | 0.043%(-0.035)#83 | 0.089%(-0.080)#330 |
| 86. | Chesapeake | 0.0040% | 0.043%(-0.039)#84 | 0.089%(-0.085)#331 |
Common Questions
What are the Top 10 Cities with the Highest Percentage of Immigrants from Oceania in Virginia?
Top 10 Cities with the Highest Percentage of Immigrants from Oceania in Virginia are:
#1
1.73%
#2
1.66%
#3
1.27%
#4
0.79%
#5
0.76%
#6
0.63%
#7
0.57%
#8
0.39%
#9
0.37%
#10
0.36%
What city has the Highest Percentage of Immigrants from Oceania in Virginia?
Irvington has the Highest Percentage of Immigrants from Oceania in Virginia with 1.73%.
What is the Percentage of Immigrants from Oceania in the State of Virginia?
Percentage of Immigrants from Oceania in Virginia is 0.043%.
What is the Percentage of Immigrants from Oceania in the United States?
Percentage of Immigrants from Oceania in the United States is 0.089%.