Colver, PA Map & Demographics
Colver Map
Colver Overview
$27,234
PER CAPITA INCOME
$79,875
AVG FAMILY INCOME
0.39
INEQUALITY / GINI INDEX
544
TOTAL POPULATION
337
MALE POPULATION
207
FEMALE POPULATION
162.80
MALES / 100 FEMALES
61.42
FEMALES / 100 MALES
58.4
MEDIAN AGE
2.6
AVG FAMILY SIZE
1.8
AVG HOUSEHOLD SIZE
283
LABOR FORCE [ PEOPLE ]
57.5%
PERCENT IN LABOR FORCE
Colver Zip Codes
Colver Area Codes
Income in Colver
Income Overview in Colver
| Characteristic | Number | Measure |
| Per Capita Income | 544 | $27,234 |
| Median Family Income | 148 | $79,875 |
| Mean Family Income | 148 | $77,699 |
| Median Household Income | 301 | $0 |
| Mean Household Income | 301 | $47,532 |
| Income Deficit | 148 | $0 |
| Wage / Income Gap (%) | 544 | 0.00% |
| Wage / Income Gap ($) | 544 | 100.00¢ per $1 |
| Gini / Inequality Index | 544 | 0.39 |
Earnings by Sex in Colver
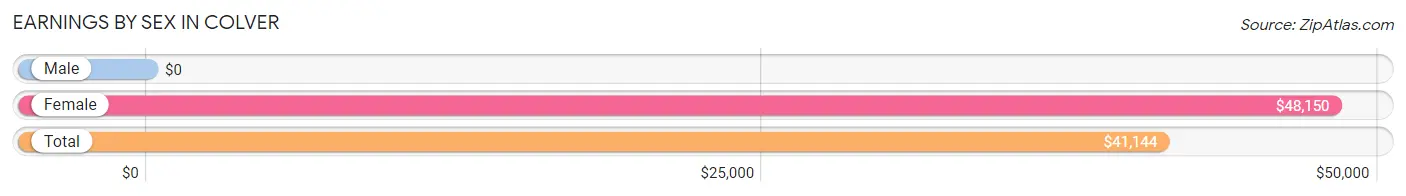
| Sex | Number | Average Earnings |
| Male | 194 (68.5%) | $0 |
| Female | 89 (31.5%) | $48,150 |
| Total | 283 (100.0%) | $41,144 |
Earnings by Sex by Income Bracket in Colver
The most common earnings brackets in Colver are $7,500 to $9,999 for men (56 | 28.9%) and $75,000 to $99,999 for women (26 | 29.2%).
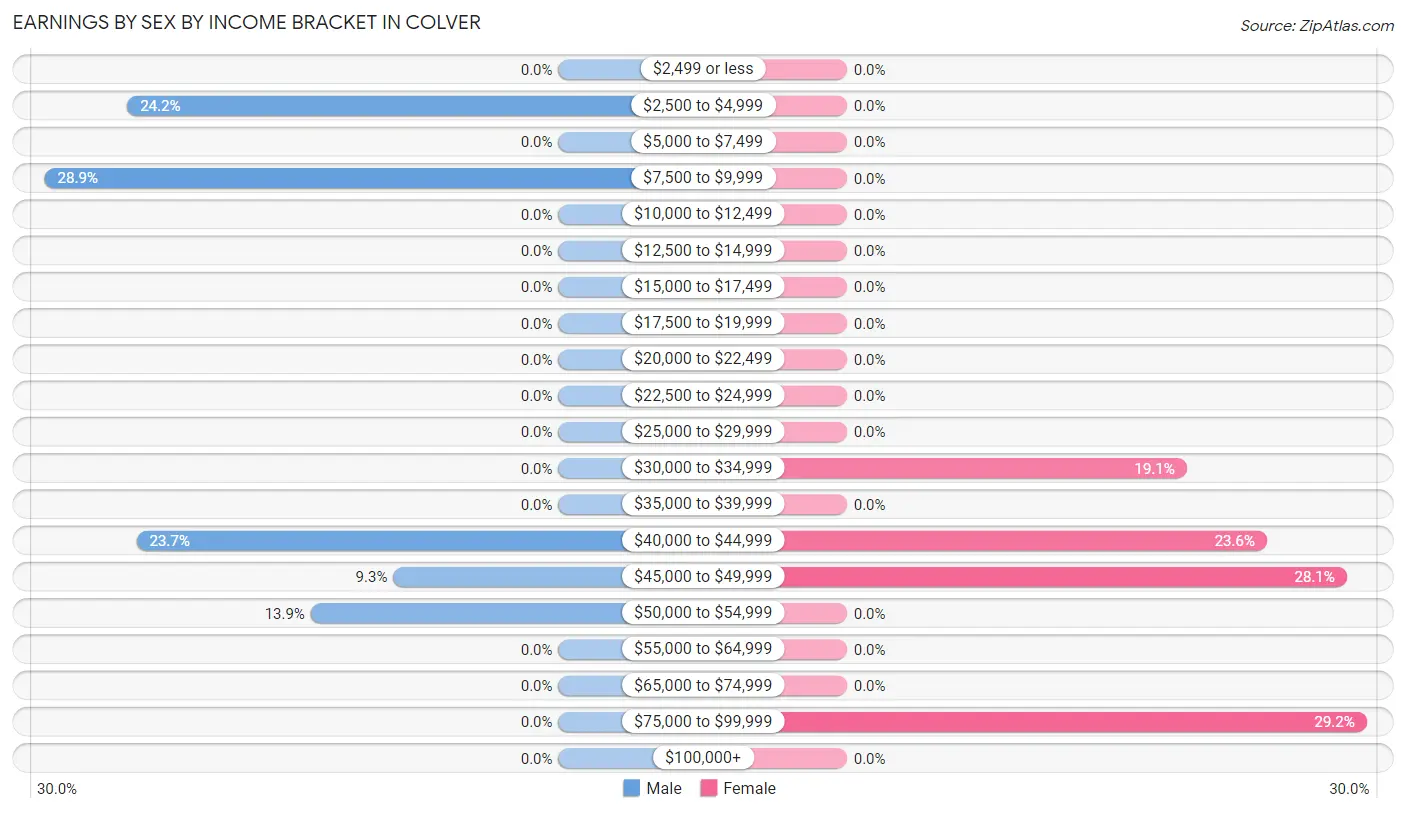
| Income | Male | Female |
| $2,499 or less | 0 (0.0%) | 0 (0.0%) |
| $2,500 to $4,999 | 47 (24.2%) | 0 (0.0%) |
| $5,000 to $7,499 | 0 (0.0%) | 0 (0.0%) |
| $7,500 to $9,999 | 56 (28.9%) | 0 (0.0%) |
| $10,000 to $12,499 | 0 (0.0%) | 0 (0.0%) |
| $12,500 to $14,999 | 0 (0.0%) | 0 (0.0%) |
| $15,000 to $17,499 | 0 (0.0%) | 0 (0.0%) |
| $17,500 to $19,999 | 0 (0.0%) | 0 (0.0%) |
| $20,000 to $22,499 | 0 (0.0%) | 0 (0.0%) |
| $22,500 to $24,999 | 0 (0.0%) | 0 (0.0%) |
| $25,000 to $29,999 | 0 (0.0%) | 0 (0.0%) |
| $30,000 to $34,999 | 0 (0.0%) | 17 (19.1%) |
| $35,000 to $39,999 | 0 (0.0%) | 0 (0.0%) |
| $40,000 to $44,999 | 46 (23.7%) | 21 (23.6%) |
| $45,000 to $49,999 | 18 (9.3%) | 25 (28.1%) |
| $50,000 to $54,999 | 27 (13.9%) | 0 (0.0%) |
| $55,000 to $64,999 | 0 (0.0%) | 0 (0.0%) |
| $65,000 to $74,999 | 0 (0.0%) | 0 (0.0%) |
| $75,000 to $99,999 | 0 (0.0%) | 26 (29.2%) |
| $100,000+ | 0 (0.0%) | 0 (0.0%) |
| Total | 194 (100.0%) | 89 (100.0%) |
Earnings by Sex by Educational Attainment in Colver
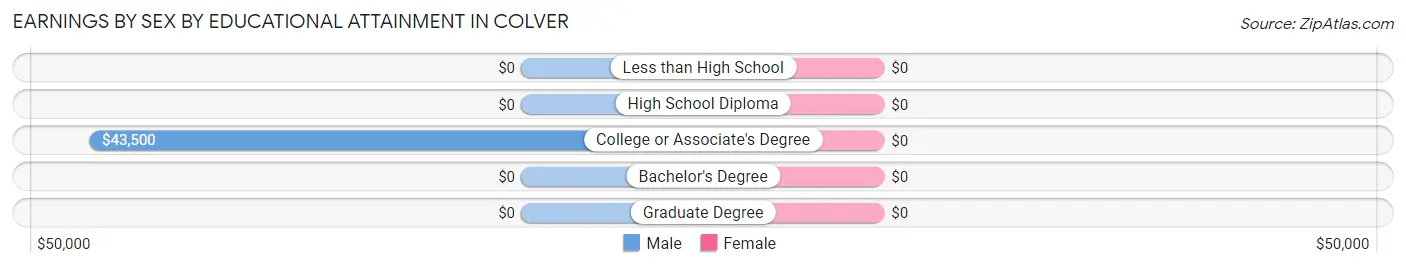
| Educational Attainment | Male Income | Female Income |
| Less than High School | - | - |
| High School Diploma | - | - |
| College or Associate's Degree | $43,500 | $0 |
| Bachelor's Degree | - | - |
| Graduate Degree | - | - |
| Total | - | - |
Family Income in Colver
Family Income Brackets in Colver
According to the Colver family income data, there are 112 families falling into the $75,000 to $99,999 income range, which is the most common income bracket and makes up 75.7% of all families.
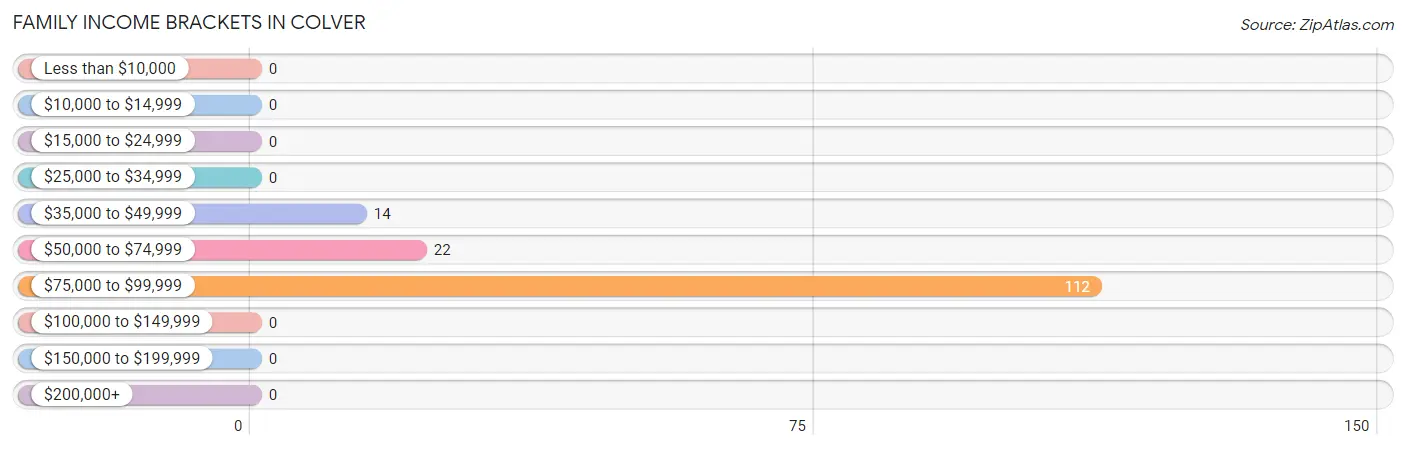
| Income Bracket | # Families | % Families |
| Less than $10,000 | 0 | 0.0% |
| $10,000 to $14,999 | 0 | 0.0% |
| $15,000 to $24,999 | 0 | 0.0% |
| $25,000 to $34,999 | 0 | 0.0% |
| $35,000 to $49,999 | 14 | 9.5% |
| $50,000 to $74,999 | 22 | 14.9% |
| $75,000 to $99,999 | 112 | 75.7% |
| $100,000 to $149,999 | 0 | 0.0% |
| $150,000 to $199,999 | 0 | 0.0% |
| $200,000+ | 0 | 0.0% |
Family Income by Famaliy Size in Colver
3-person families (74 | 50.0%) account for the highest median family income in Colver with $88,900 per family, while 2-person families (74 | 50.0%) have the highest median income of $38,824 per family member.
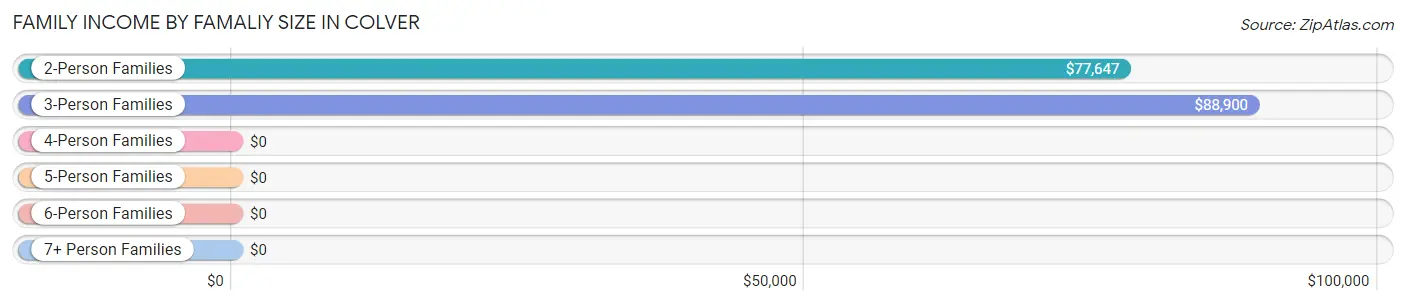
| Income Bracket | # Families | Median Income |
| 2-Person Families | 74 (50.0%) | $77,647 |
| 3-Person Families | 74 (50.0%) | $88,900 |
| 4-Person Families | 0 (0.0%) | $0 |
| 5-Person Families | 0 (0.0%) | $0 |
| 6-Person Families | 0 (0.0%) | $0 |
| 7+ Person Families | 0 (0.0%) | $0 |
| Total | 148 (100.0%) | $79,875 |
Family Income by Number of Earners in Colver
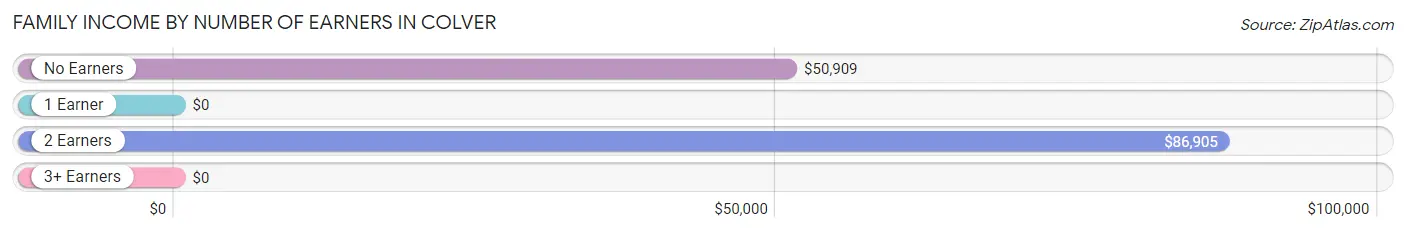
| Number of Earners | # Families | Median Income |
| No Earners | 36 (24.3%) | $50,909 |
| 1 Earner | 0 (0.0%) | $0 |
| 2 Earners | 112 (75.7%) | $86,905 |
| 3+ Earners | 0 (0.0%) | $0 |
| Total | 148 (100.0%) | $79,875 |
Household Income in Colver
Household Income Brackets in Colver
With 112 households falling in the category, the $75,000 to $99,999 income range is the most frequent in Colver, accounting for 37.2% of all households.
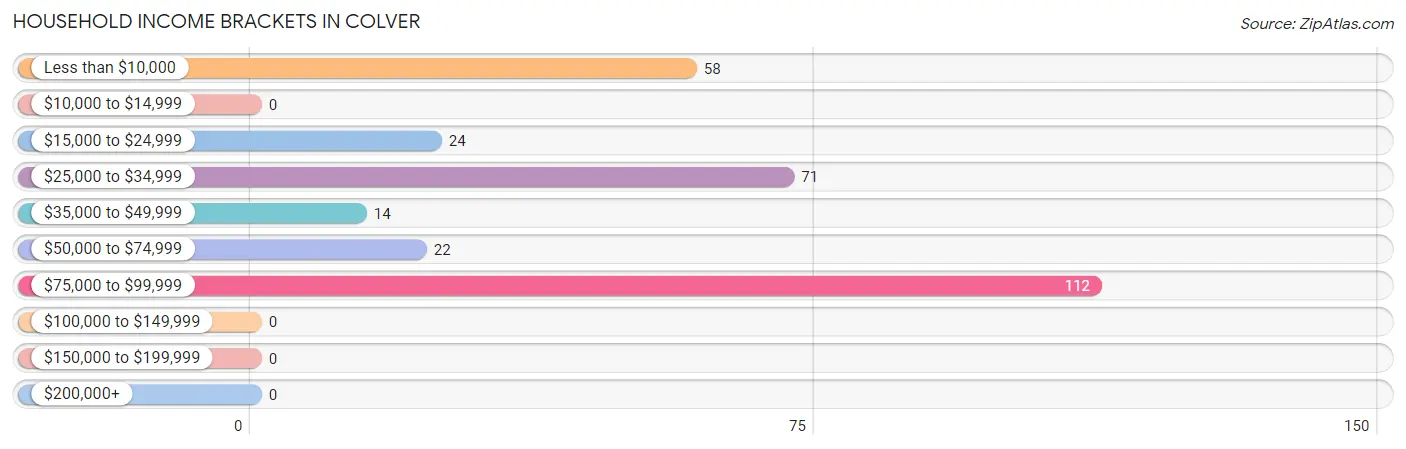
| Income Bracket | # Households | % Households |
| Less than $10,000 | 58 | 19.3% |
| $10,000 to $14,999 | 0 | 0.0% |
| $15,000 to $24,999 | 24 | 8.0% |
| $25,000 to $34,999 | 71 | 23.6% |
| $35,000 to $49,999 | 14 | 4.7% |
| $50,000 to $74,999 | 22 | 7.3% |
| $75,000 to $99,999 | 112 | 37.2% |
| $100,000 to $149,999 | 0 | 0.0% |
| $150,000 to $199,999 | 0 | 0.0% |
| $200,000+ | 0 | 0.0% |
Household Income by Householder Age in Colver
The median household income in Colver is $0, with the highest median household income of $44,286 found in the 65+ years age bracket for the primary householder. A total of 98 households (32.6%) fall into this category.
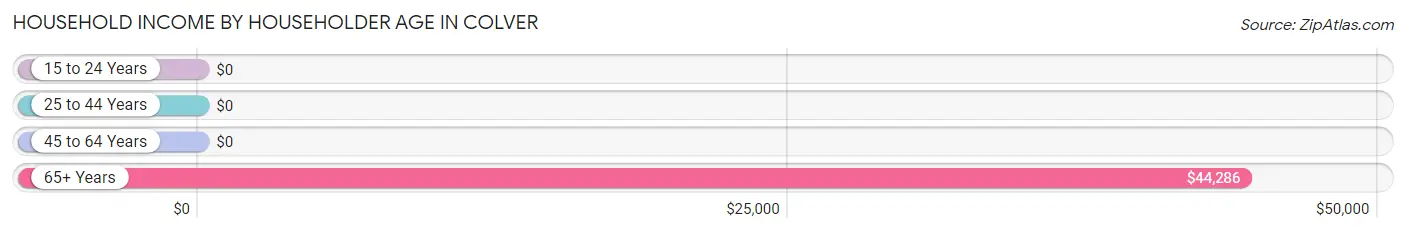
| Income Bracket | # Households | Median Income |
| 15 to 24 Years | 0 (0.0%) | $0 |
| 25 to 44 Years | 46 (15.3%) | $0 |
| 45 to 64 Years | 157 (52.2%) | $0 |
| 65+ Years | 98 (32.6%) | $44,286 |
| Total | 301 (100.0%) | $0 |
Poverty in Colver
Income Below Poverty by Sex and Age in Colver
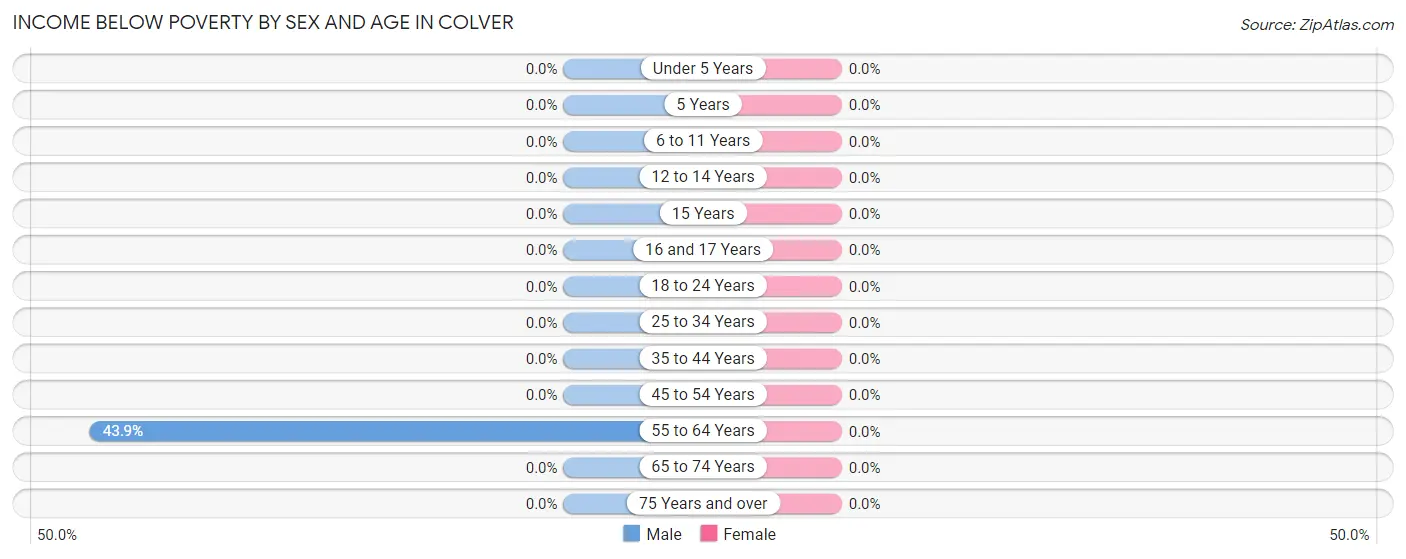
| Age Bracket | Male | Female |
| Under 5 Years | 0 (0.0%) | 0 (0.0%) |
| 5 Years | 0 (0.0%) | 0 (0.0%) |
| 6 to 11 Years | 0 (0.0%) | 0 (0.0%) |
| 12 to 14 Years | 0 (0.0%) | 0 (0.0%) |
| 15 Years | 0 (0.0%) | 0 (0.0%) |
| 16 and 17 Years | 0 (0.0%) | 0 (0.0%) |
| 18 to 24 Years | 0 (0.0%) | 0 (0.0%) |
| 25 to 34 Years | 0 (0.0%) | 0 (0.0%) |
| 35 to 44 Years | 0 (0.0%) | 0 (0.0%) |
| 45 to 54 Years | 0 (0.0%) | 0 (0.0%) |
| 55 to 64 Years | 58 (43.9%) | 0 (0.0%) |
| 65 to 74 Years | 0 (0.0%) | 0 (0.0%) |
| 75 Years and over | 0 (0.0%) | 0 (0.0%) |
| Total | 58 (17.2%) | 0 (0.0%) |
Income Above Poverty by Sex and Age in Colver
According to the poverty statistics in Colver, males aged 15 years and females aged under 5 years are the age groups that are most secure financially, with 100.0% of males and 100.0% of females in these age groups living above the poverty line.
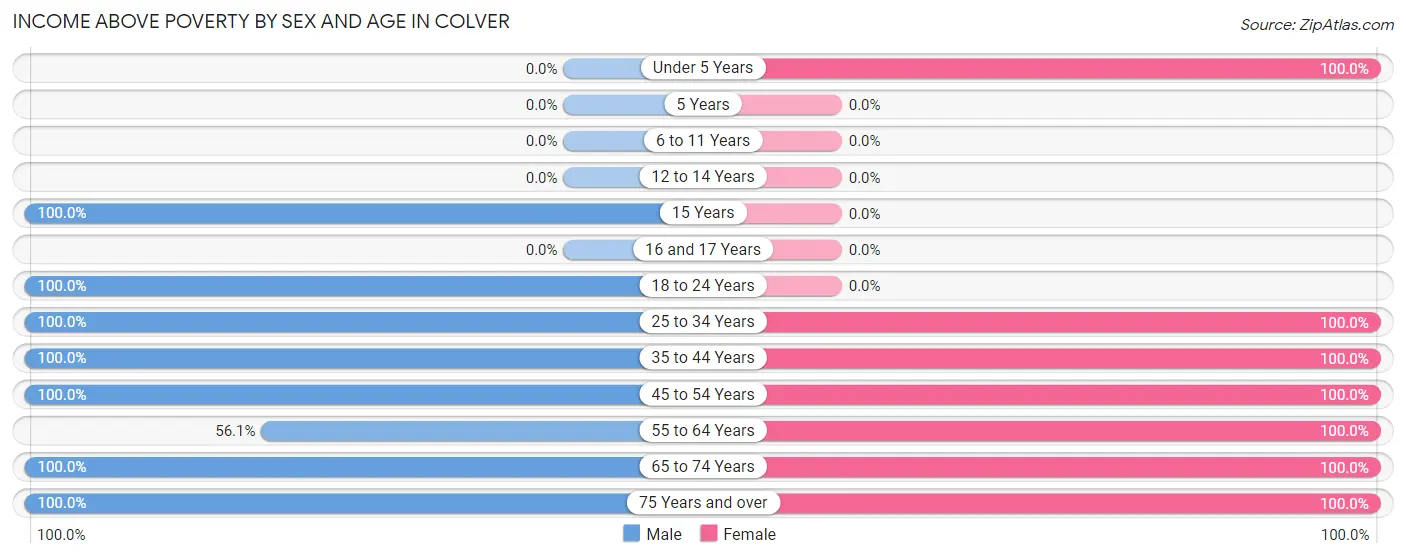
| Age Bracket | Male | Female |
| Under 5 Years | 0 (0.0%) | 24 (100.0%) |
| 5 Years | 0 (0.0%) | 0 (0.0%) |
| 6 to 11 Years | 0 (0.0%) | 0 (0.0%) |
| 12 to 14 Years | 0 (0.0%) | 0 (0.0%) |
| 15 Years | 28 (100.0%) | 0 (0.0%) |
| 16 and 17 Years | 0 (0.0%) | 0 (0.0%) |
| 18 to 24 Years | 24 (100.0%) | 0 (0.0%) |
| 25 to 34 Years | 26 (100.0%) | 25 (100.0%) |
| 35 to 44 Years | 52 (100.0%) | 21 (100.0%) |
| 45 to 54 Years | 6 (100.0%) | 26 (100.0%) |
| 55 to 64 Years | 74 (56.1%) | 59 (100.0%) |
| 65 to 74 Years | 47 (100.0%) | 12 (100.0%) |
| 75 Years and over | 22 (100.0%) | 40 (100.0%) |
| Total | 279 (82.8%) | 207 (100.0%) |
Income Below Poverty Among Married-Couple Families in Colver
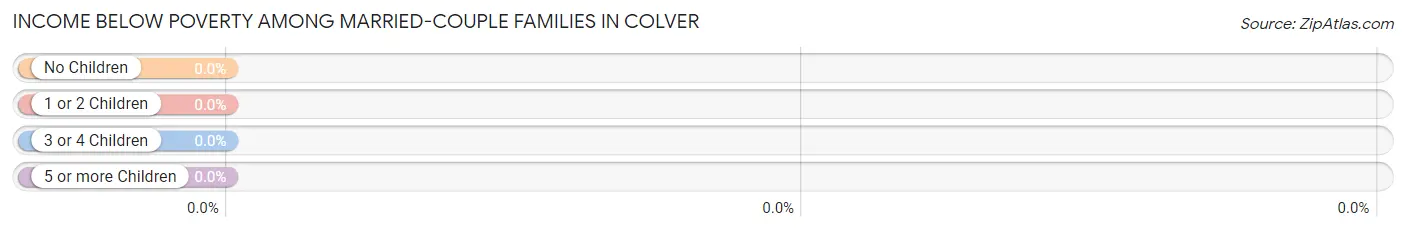
| Children | Above Poverty | Below Poverty |
| No Children | 83 (100.0%) | 0 (0.0%) |
| 1 or 2 Children | 25 (100.0%) | 0 (0.0%) |
| 3 or 4 Children | 0 (0.0%) | 0 (0.0%) |
| 5 or more Children | 0 (0.0%) | 0 (0.0%) |
| Total | 108 (100.0%) | 0 (0.0%) |
Income Below Poverty Among Single-Parent Households in Colver
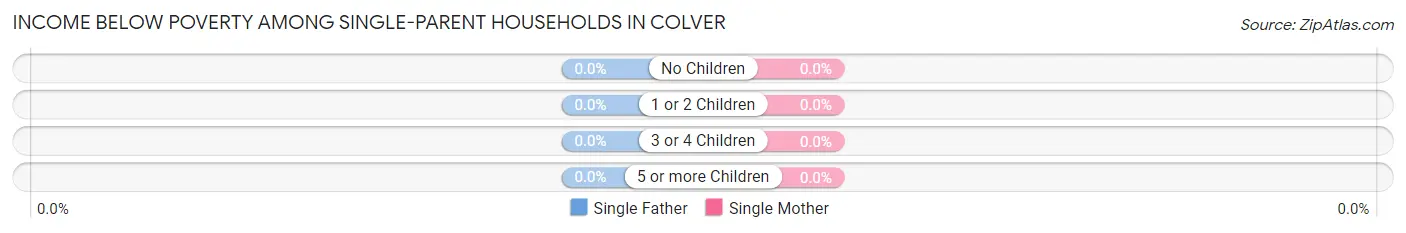
| Children | Single Father | Single Mother |
| No Children | 0 (0.0%) | 0 (0.0%) |
| 1 or 2 Children | 0 (0.0%) | 0 (0.0%) |
| 3 or 4 Children | 0 (0.0%) | 0 (0.0%) |
| 5 or more Children | 0 (0.0%) | 0 (0.0%) |
| Total | 0 (0.0%) | 0 (0.0%) |
Income Below Poverty Among Married-Couple vs Single-Parent Households in Colver
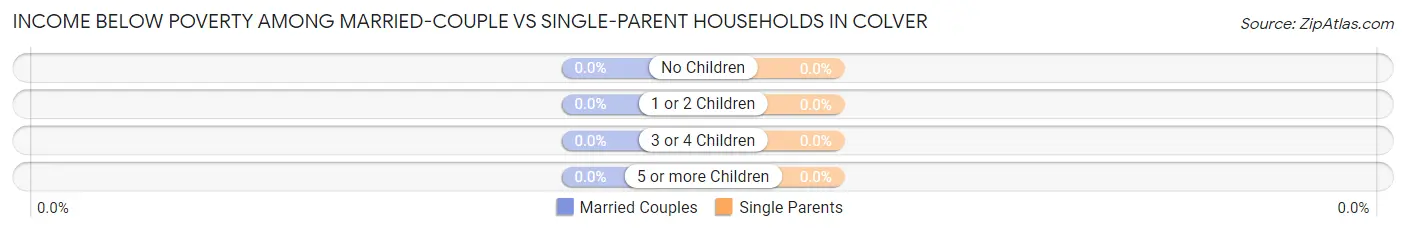
| Children | Married-Couple Families | Single-Parent Households |
| No Children | 0 (0.0%) | 0 (0.0%) |
| 1 or 2 Children | 0 (0.0%) | 0 (0.0%) |
| 3 or 4 Children | 0 (0.0%) | 0 (0.0%) |
| 5 or more Children | 0 (0.0%) | 0 (0.0%) |
| Total | 0 (0.0%) | 0 (0.0%) |
Race in Colver
The most populous races in Colver are , and White / Caucasian (544 | 100.0%).
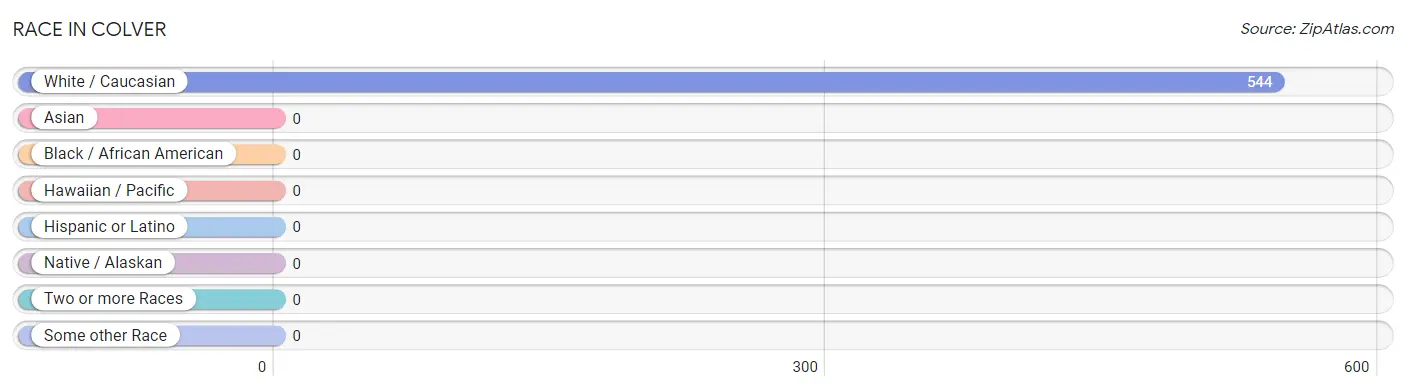
| Race | # Population | % Population |
| Asian | 0 | 0.0% |
| Black / African American | 0 | 0.0% |
| Hawaiian / Pacific | 0 | 0.0% |
| Hispanic or Latino | 0 | 0.0% |
| Native / Alaskan | 0 | 0.0% |
| White / Caucasian | 544 | 100.0% |
| Two or more Races | 0 | 0.0% |
| Some other Race | 0 | 0.0% |
| Total | 544 | 100.0% |
Ancestry in Colver
The most populous ancestries reported in Colver are German (108 | 19.9%), Hungarian (95 | 17.5%), Italian (71 | 13.1%), Irish (64 | 11.8%), and Austrian (58 | 10.7%), together accounting for 72.8% of all Colver residents.
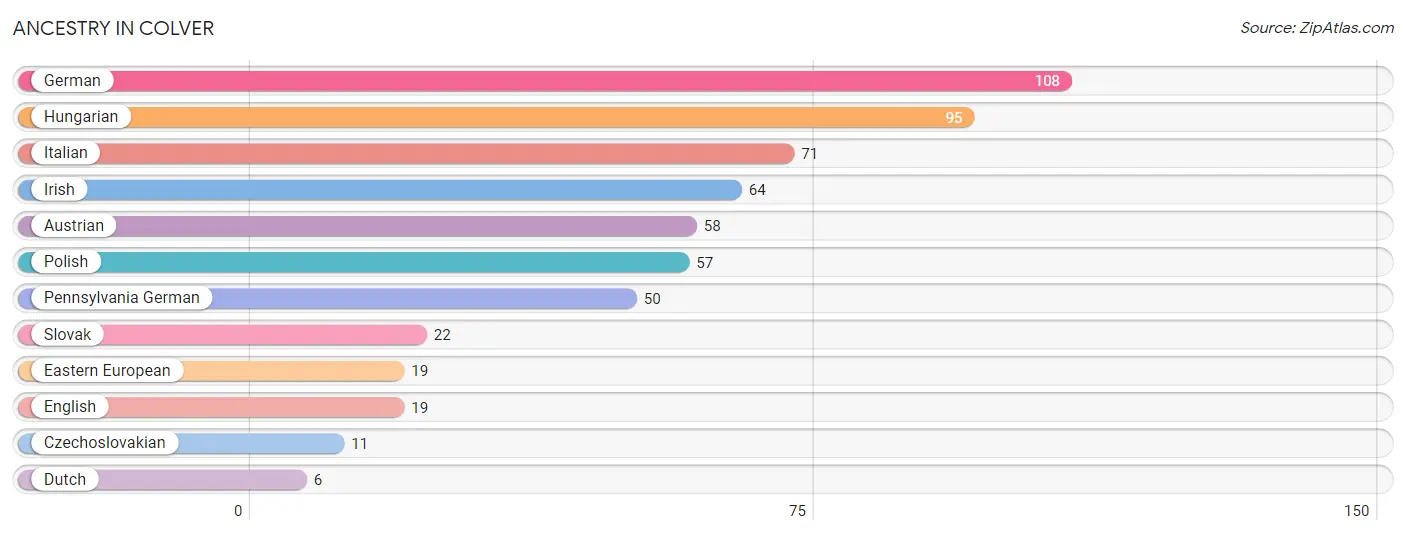
| Ancestry | # Population | % Population |
| Austrian | 58 | 10.7% |
| Czechoslovakian | 11 | 2.0% |
| Dutch | 6 | 1.1% |
| Eastern European | 19 | 3.5% |
| English | 19 | 3.5% |
| German | 108 | 19.9% |
| Hungarian | 95 | 17.5% |
| Irish | 64 | 11.8% |
| Italian | 71 | 13.1% |
| Pennsylvania German | 50 | 9.2% |
| Polish | 57 | 10.5% |
| Slovak | 22 | 4.0% | View All 12 Rows |
Immigrants in Colver

| Immigration Origin | # Population | % Population | View All 0 Rows |
Sex and Age in Colver
Sex and Age in Colver
The most populous age groups in Colver are 55 to 59 Years (74 | 22.0%) for men and 60 to 64 Years (42 | 20.3%) for women.
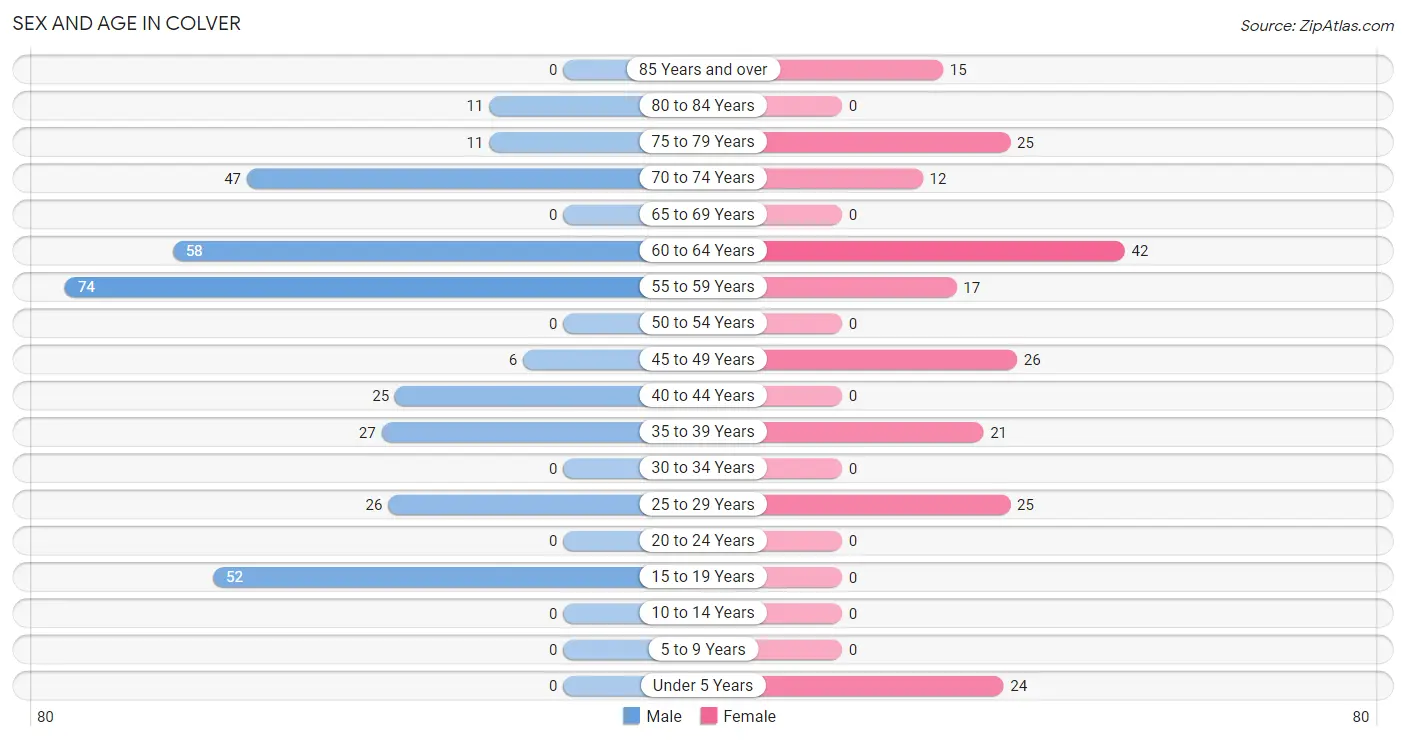
| Age Bracket | Male | Female |
| Under 5 Years | 0 (0.0%) | 24 (11.6%) |
| 5 to 9 Years | 0 (0.0%) | 0 (0.0%) |
| 10 to 14 Years | 0 (0.0%) | 0 (0.0%) |
| 15 to 19 Years | 52 (15.4%) | 0 (0.0%) |
| 20 to 24 Years | 0 (0.0%) | 0 (0.0%) |
| 25 to 29 Years | 26 (7.7%) | 25 (12.1%) |
| 30 to 34 Years | 0 (0.0%) | 0 (0.0%) |
| 35 to 39 Years | 27 (8.0%) | 21 (10.1%) |
| 40 to 44 Years | 25 (7.4%) | 0 (0.0%) |
| 45 to 49 Years | 6 (1.8%) | 26 (12.6%) |
| 50 to 54 Years | 0 (0.0%) | 0 (0.0%) |
| 55 to 59 Years | 74 (22.0%) | 17 (8.2%) |
| 60 to 64 Years | 58 (17.2%) | 42 (20.3%) |
| 65 to 69 Years | 0 (0.0%) | 0 (0.0%) |
| 70 to 74 Years | 47 (14.0%) | 12 (5.8%) |
| 75 to 79 Years | 11 (3.3%) | 25 (12.1%) |
| 80 to 84 Years | 11 (3.3%) | 0 (0.0%) |
| 85 Years and over | 0 (0.0%) | 15 (7.2%) |
| Total | 337 (100.0%) | 207 (100.0%) |
Families and Households in Colver
Median Family Size in Colver
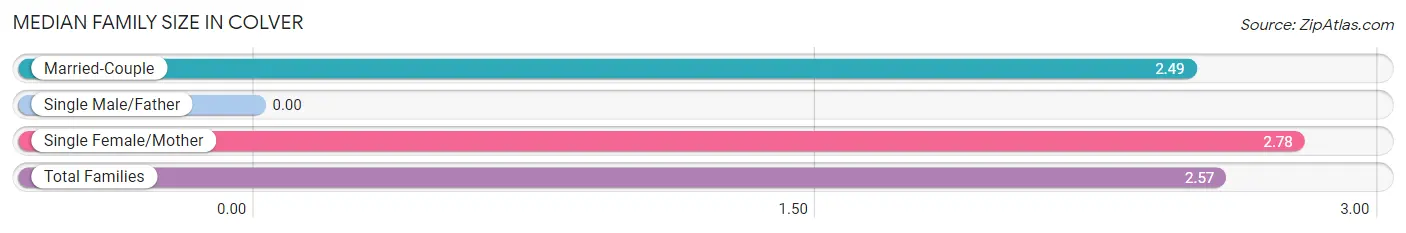
| Family Type | # Families | Family Size |
| Married-Couple | 108 (73.0%) | 2.49 |
| Single Male/Father | 0 (0.0%) | - |
| Single Female/Mother | 40 (27.0%) | 2.78 |
| Total Families | 148 (100.0%) | 2.57 |
Median Household Size in Colver
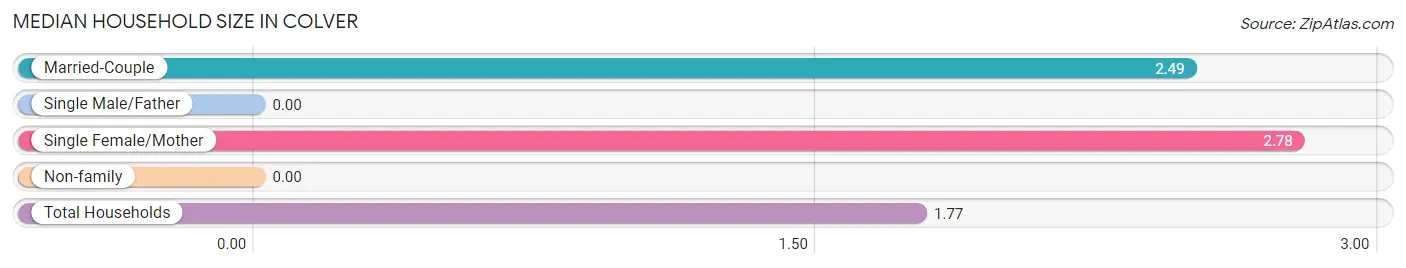
| Household Type | # Households | Household Size |
| Married-Couple | 108 (35.9%) | 2.49 |
| Single Male/Father | 0 (0.0%) | - |
| Single Female/Mother | 40 (13.3%) | 2.78 |
| Non-family | 153 (50.8%) | - |
| Total Households | 301 (100.0%) | 1.77 |
Household Size by Marriage Status in Colver
Out of a total of 301 households in Colver, 148 (49.2%) are family households, while 153 (50.8%) are nonfamily households. The most numerous type of family households are 2-person households, comprising 74, and the most common type of nonfamily households are 1-person households, comprising 153.
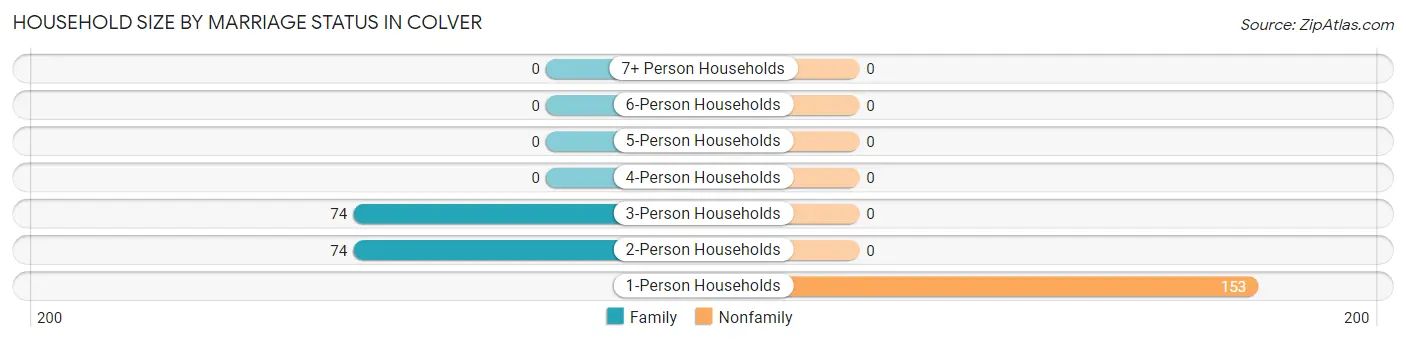
| Household Size | Family Households | Nonfamily Households |
| 1-Person Households | - | 153 (50.8%) |
| 2-Person Households | 74 (24.6%) | 0 (0.0%) |
| 3-Person Households | 74 (24.6%) | 0 (0.0%) |
| 4-Person Households | 0 (0.0%) | 0 (0.0%) |
| 5-Person Households | 0 (0.0%) | 0 (0.0%) |
| 6-Person Households | 0 (0.0%) | 0 (0.0%) |
| 7+ Person Households | 0 (0.0%) | 0 (0.0%) |
| Total | 148 (49.2%) | 153 (50.8%) |
Female Fertility in Colver
Fertility by Age in Colver
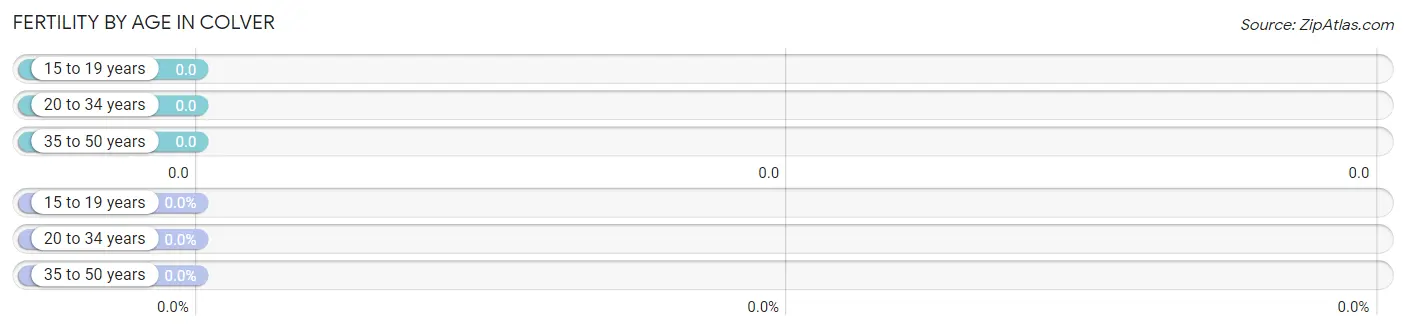
| Age Bracket | Women with Births | Births / 1,000 Women |
| 15 to 19 years | 0 (0.0%) | 0.0 |
| 20 to 34 years | 0 (0.0%) | 0.0 |
| 35 to 50 years | 0 (0.0%) | 0.0 |
| Total | 0 (0.0%) | 0.0 |
Fertility by Age by Marriage Status in Colver
| Age Bracket | Married | Unmarried |
| 15 to 19 years | 0 (0.0%) | 0 (0.0%) |
| 20 to 34 years | 0 (0.0%) | 0 (0.0%) |
| 35 to 50 years | 0 (0.0%) | 0 (0.0%) |
| Total | 0 (0.0%) | 0 (0.0%) |
Fertility by Education in Colver
| Educational Attainment | Women with Births | Births / 1,000 Women |
| Less than High School | 0 (0.0%) | 0.0 |
| High School Diploma | 0 (0.0%) | 0.0 |
| College or Associate's Degree | 0 (0.0%) | 0.0 |
| Bachelor's Degree | 0 (0.0%) | 0.0 |
| Graduate Degree | 0 (0.0%) | 0.0 |
| Total | 0 (0.0%) | 0.0 |
Fertility by Education by Marriage Status in Colver
| Educational Attainment | Married | Unmarried |
| Less than High School | 0 (0.0%) | 0 (0.0%) |
| High School Diploma | 0 (0.0%) | 0 (0.0%) |
| College or Associate's Degree | 0 (0.0%) | 0 (0.0%) |
| Bachelor's Degree | 0 (0.0%) | 0 (0.0%) |
| Graduate Degree | 0 (0.0%) | 0 (0.0%) |
| Total | 0 (0.0%) | 0 (0.0%) |
Employment Characteristics in Colver
Employment by Class of Employer in Colver
Among the 283 employed individuals in Colver, private company employees (258 | 91.2%), and local government employees (25 | 8.8%) make up the most common classes of employment.
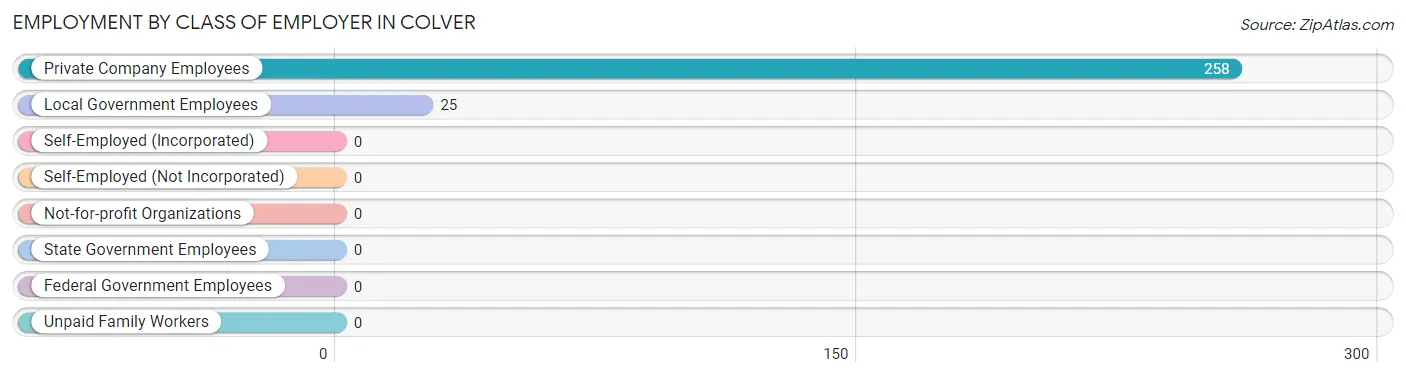
| Employer Class | # Employees | % Employees |
| Private Company Employees | 258 | 91.2% |
| Self-Employed (Incorporated) | 0 | 0.0% |
| Self-Employed (Not Incorporated) | 0 | 0.0% |
| Not-for-profit Organizations | 0 | 0.0% |
| Local Government Employees | 25 | 8.8% |
| State Government Employees | 0 | 0.0% |
| Federal Government Employees | 0 | 0.0% |
| Unpaid Family Workers | 0 | 0.0% |
| Total | 283 | 100.0% |
Employment Status by Age in Colver
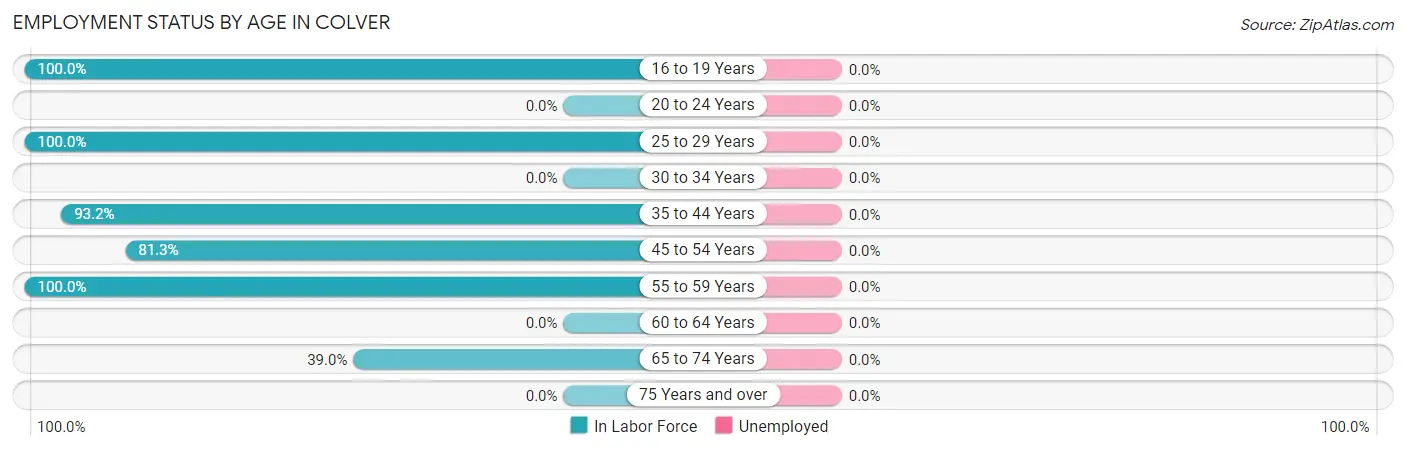
| Age Bracket | In Labor Force | Unemployed |
| 16 to 19 Years | 24 (100.0%) | 0 (0.0%) |
| 20 to 24 Years | 0 (0.0%) | 0 (0.0%) |
| 25 to 29 Years | 51 (100.0%) | 0 (0.0%) |
| 30 to 34 Years | 0 (0.0%) | 0 (0.0%) |
| 35 to 44 Years | 68 (93.2%) | 0 (0.0%) |
| 45 to 54 Years | 26 (81.3%) | 0 (0.0%) |
| 55 to 59 Years | 91 (100.0%) | 0 (0.0%) |
| 60 to 64 Years | 0 (0.0%) | 0 (0.0%) |
| 65 to 74 Years | 23 (39.0%) | 0 (0.0%) |
| 75 Years and over | 0 (0.0%) | 0 (0.0%) |
| Total | 283 (57.5%) | 0 (0.0%) |
Employment Status by Educational Attainment in Colver
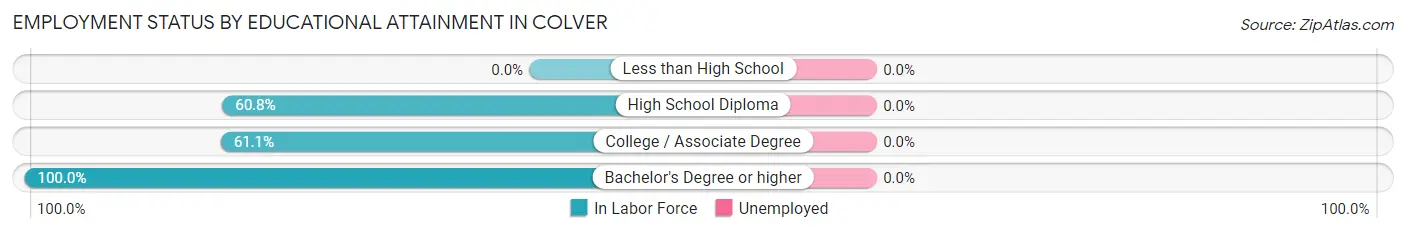
| Educational Attainment | In Labor Force | Unemployed |
| Less than High School | 0 (0.0%) | 0 (0.0%) |
| High School Diploma | 73 (60.8%) | 0 (0.0%) |
| College / Associate Degree | 91 (61.1%) | 0 (0.0%) |
| Bachelor's Degree or higher | 72 (100.0%) | 0 (0.0%) |
| Total | 236 (68.0%) | 0 (0.0%) |
Employment Occupations by Sex in Colver
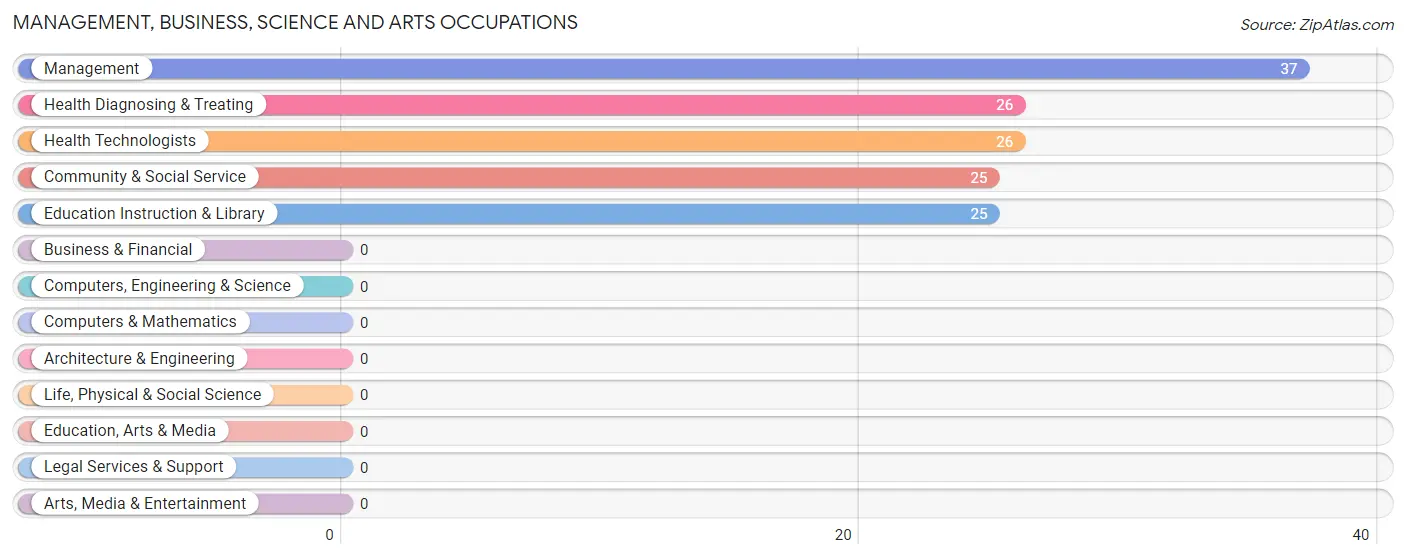
Management, Business, Science and Arts Occupations
The most common Management, Business, Science and Arts occupations in Colver are Management (37 | 13.1%), Health Diagnosing & Treating (26 | 9.2%), Health Technologists (26 | 9.2%), Community & Social Service (25 | 8.8%), and Education Instruction & Library (25 | 8.8%).
Management, Business, Science and Arts Occupations by Sex
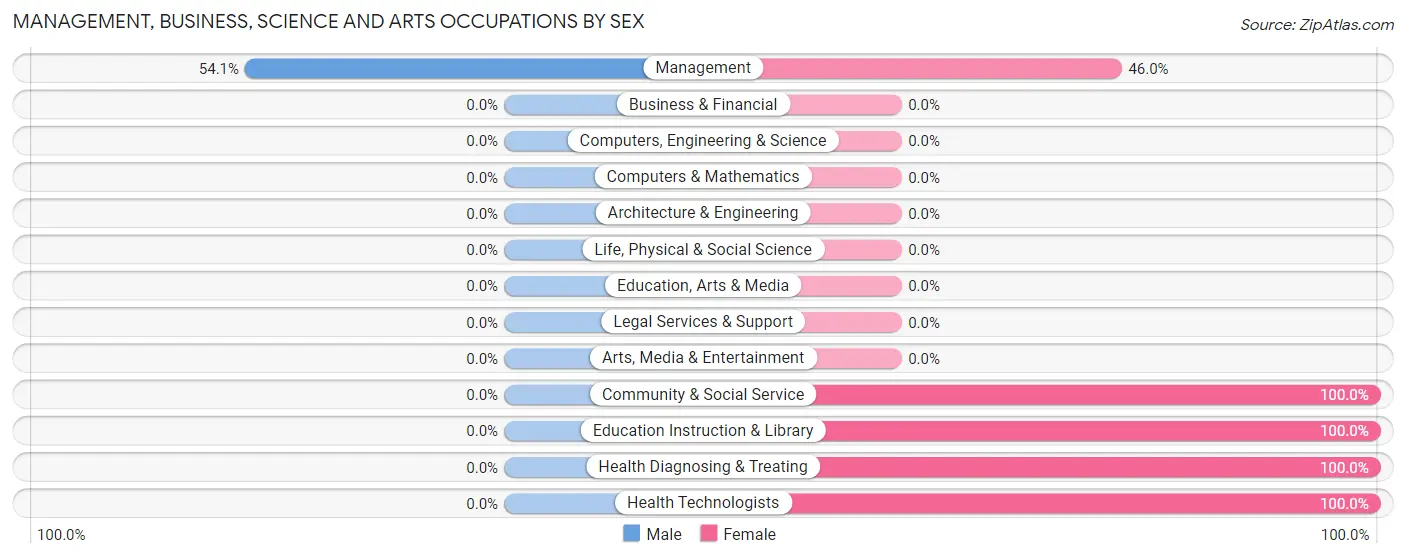
| Occupation | Male | Female |
| Management | 20 (54.0%) | 17 (46.0%) |
| Business & Financial | 0 (0.0%) | 0 (0.0%) |
| Computers, Engineering & Science | 0 (0.0%) | 0 (0.0%) |
| Computers & Mathematics | 0 (0.0%) | 0 (0.0%) |
| Architecture & Engineering | 0 (0.0%) | 0 (0.0%) |
| Life, Physical & Social Science | 0 (0.0%) | 0 (0.0%) |
| Community & Social Service | 0 (0.0%) | 25 (100.0%) |
| Education, Arts & Media | 0 (0.0%) | 0 (0.0%) |
| Legal Services & Support | 0 (0.0%) | 0 (0.0%) |
| Education Instruction & Library | 0 (0.0%) | 25 (100.0%) |
| Arts, Media & Entertainment | 0 (0.0%) | 0 (0.0%) |
| Health Diagnosing & Treating | 0 (0.0%) | 26 (100.0%) |
| Health Technologists | 0 (0.0%) | 26 (100.0%) |
| Total (Category) | 20 (22.7%) | 68 (77.3%) |
| Total (Overall) | 194 (68.5%) | 89 (31.5%) |
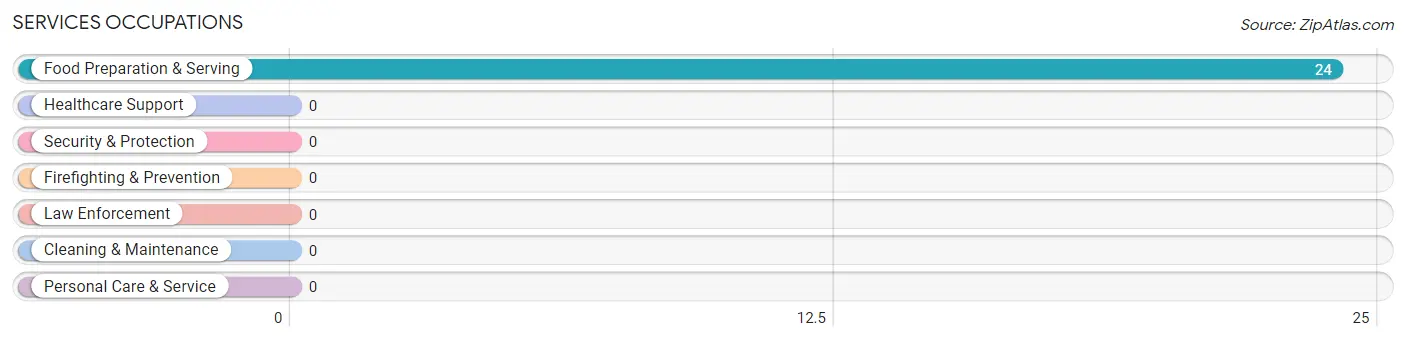
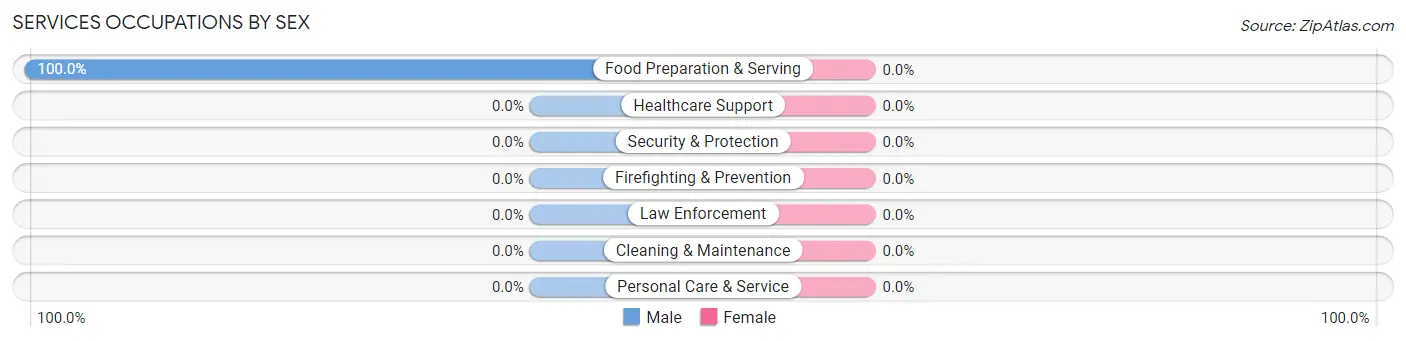
Services Occupations
The most common Services occupations in Colver are , and Food Preparation & Serving (24 | 8.5%).
Services Occupations by Sex
| Occupation | Male | Female |
| Healthcare Support | 0 (0.0%) | 0 (0.0%) |
| Security & Protection | 0 (0.0%) | 0 (0.0%) |
| Firefighting & Prevention | 0 (0.0%) | 0 (0.0%) |
| Law Enforcement | 0 (0.0%) | 0 (0.0%) |
| Food Preparation & Serving | 24 (100.0%) | 0 (0.0%) |
| Cleaning & Maintenance | 0 (0.0%) | 0 (0.0%) |
| Personal Care & Service | 0 (0.0%) | 0 (0.0%) |
| Total (Category) | 24 (100.0%) | 0 (0.0%) |
| Total (Overall) | 194 (68.5%) | 89 (31.5%) |
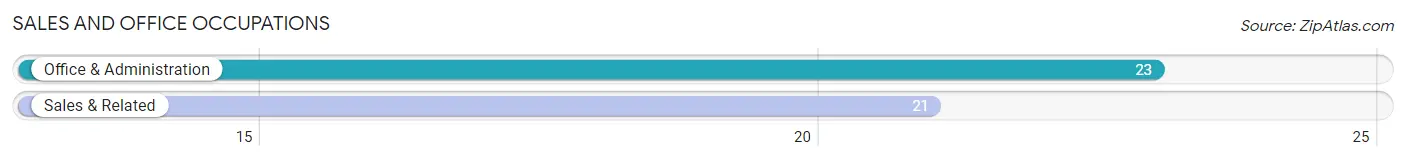
Sales and Office Occupations
The most common Sales and Office occupations in Colver are Office & Administration (23 | 8.1%), and Sales & Related (21 | 7.4%).
Sales and Office Occupations by Sex

| Occupation | Male | Female |
| Sales & Related | 0 (0.0%) | 21 (100.0%) |
| Office & Administration | 23 (100.0%) | 0 (0.0%) |
| Total (Category) | 23 (52.3%) | 21 (47.7%) |
| Total (Overall) | 194 (68.5%) | 89 (31.5%) |
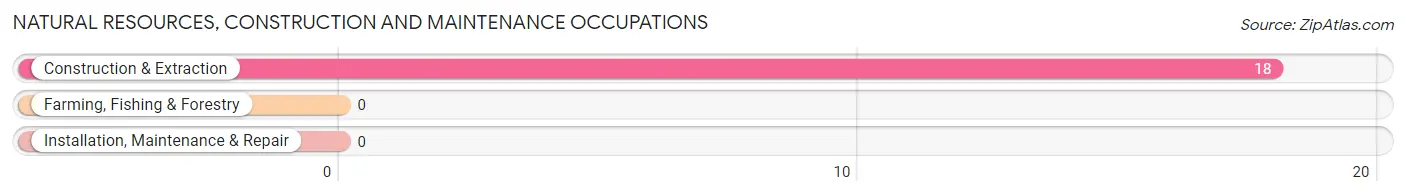
Natural Resources, Construction and Maintenance Occupations
The most common Natural Resources, Construction and Maintenance occupations in Colver are , and Construction & Extraction (18 | 6.4%).
Natural Resources, Construction and Maintenance Occupations by Sex
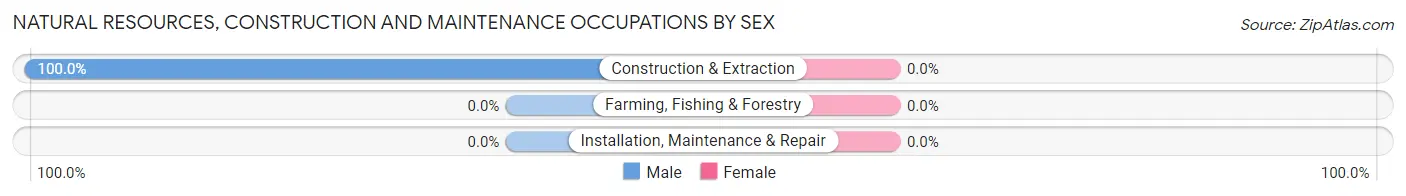
| Occupation | Male | Female |
| Farming, Fishing & Forestry | 0 (0.0%) | 0 (0.0%) |
| Construction & Extraction | 18 (100.0%) | 0 (0.0%) |
| Installation, Maintenance & Repair | 0 (0.0%) | 0 (0.0%) |
| Total (Category) | 18 (100.0%) | 0 (0.0%) |
| Total (Overall) | 194 (68.5%) | 89 (31.5%) |
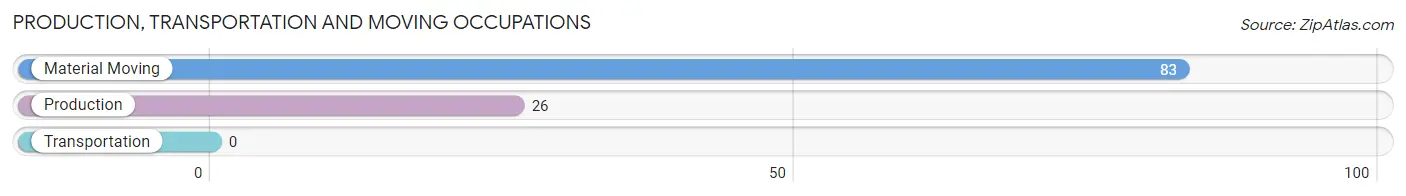
Production, Transportation and Moving Occupations
The most common Production, Transportation and Moving occupations in Colver are Material Moving (83 | 29.3%), and Production (26 | 9.2%).
Production, Transportation and Moving Occupations by Sex
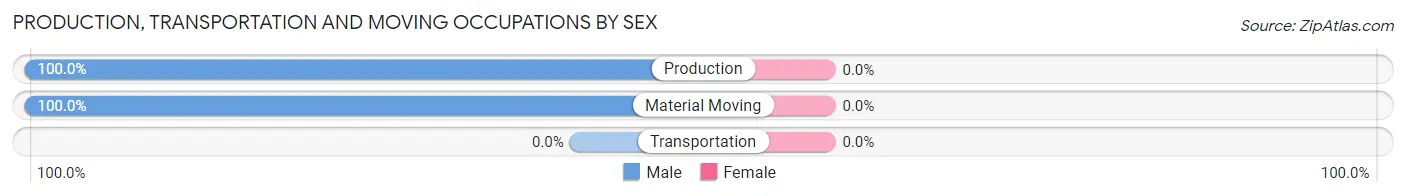
| Occupation | Male | Female |
| Production | 26 (100.0%) | 0 (0.0%) |
| Transportation | 0 (0.0%) | 0 (0.0%) |
| Material Moving | 83 (100.0%) | 0 (0.0%) |
| Total (Category) | 109 (100.0%) | 0 (0.0%) |
| Total (Overall) | 194 (68.5%) | 89 (31.5%) |
Employment Industries by Sex in Colver
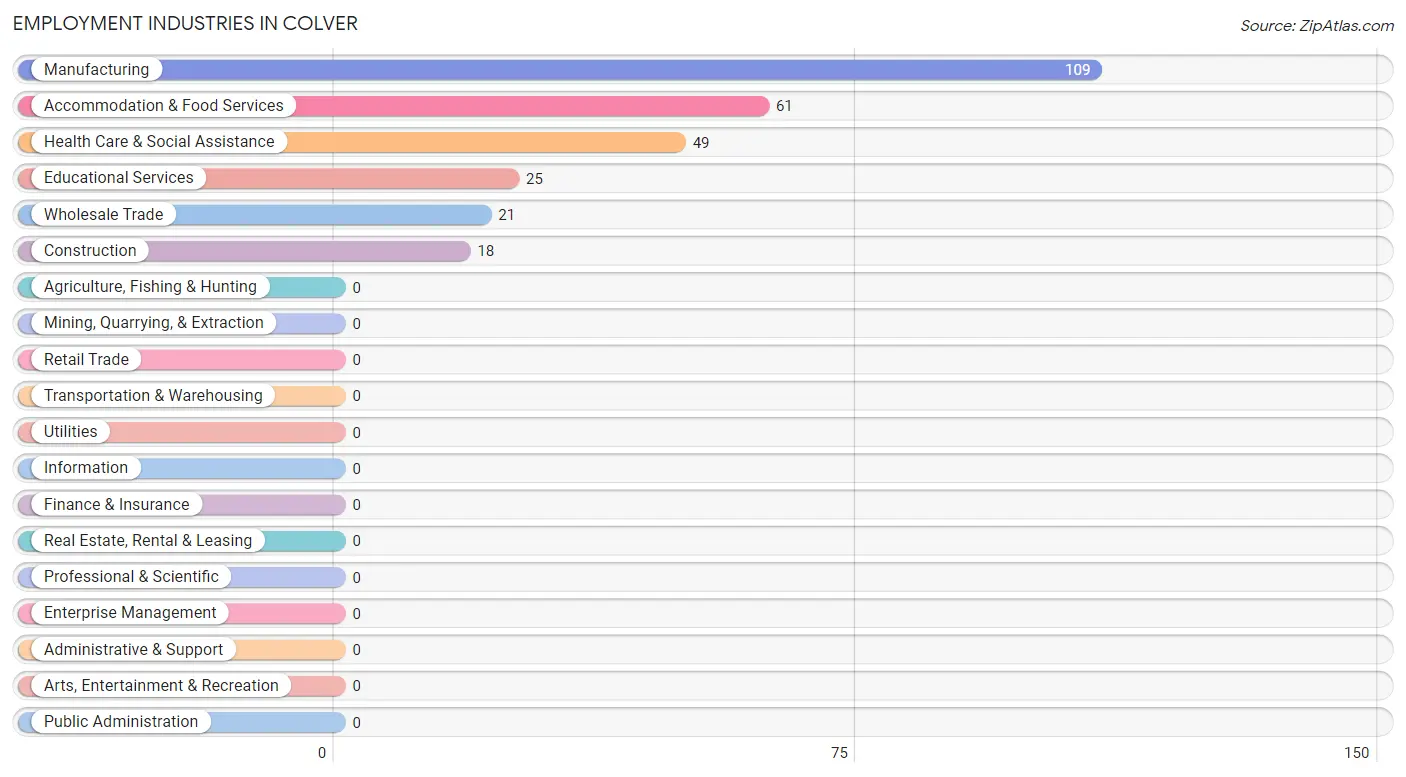
Employment Industries in Colver
The major employment industries in Colver include Manufacturing (109 | 38.5%), Accommodation & Food Services (61 | 21.5%), Health Care & Social Assistance (49 | 17.3%), Educational Services (25 | 8.8%), and Wholesale Trade (21 | 7.4%).
Employment Industries by Sex in Colver
The Colver industries that see more men than women are Construction (100.0%), Manufacturing (100.0%), and Accommodation & Food Services (72.1%), whereas the industries that tend to have a higher number of women are Wholesale Trade (100.0%), Educational Services (100.0%), and Health Care & Social Assistance (53.1%).
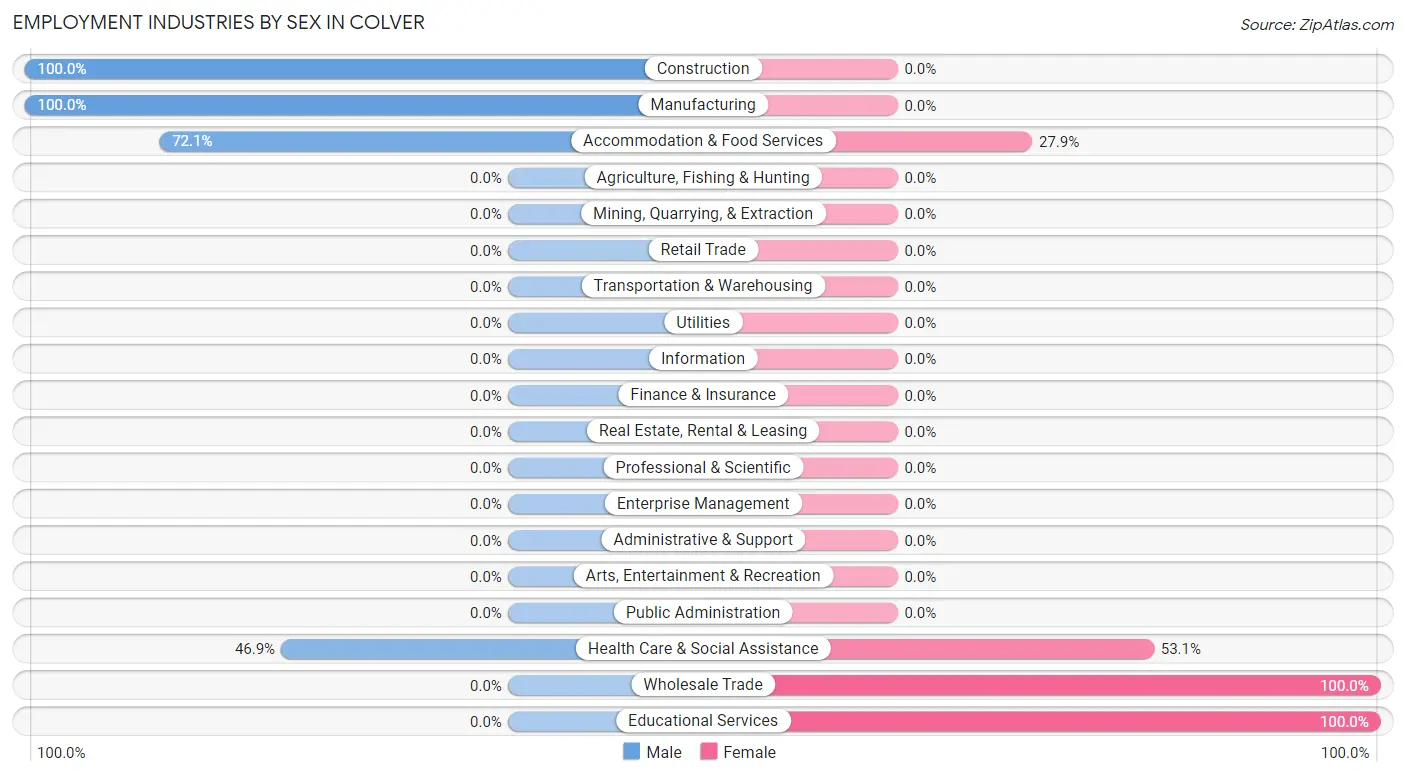
| Industry | Male | Female |
| Agriculture, Fishing & Hunting | 0 (0.0%) | 0 (0.0%) |
| Mining, Quarrying, & Extraction | 0 (0.0%) | 0 (0.0%) |
| Construction | 18 (100.0%) | 0 (0.0%) |
| Manufacturing | 109 (100.0%) | 0 (0.0%) |
| Wholesale Trade | 0 (0.0%) | 21 (100.0%) |
| Retail Trade | 0 (0.0%) | 0 (0.0%) |
| Transportation & Warehousing | 0 (0.0%) | 0 (0.0%) |
| Utilities | 0 (0.0%) | 0 (0.0%) |
| Information | 0 (0.0%) | 0 (0.0%) |
| Finance & Insurance | 0 (0.0%) | 0 (0.0%) |
| Real Estate, Rental & Leasing | 0 (0.0%) | 0 (0.0%) |
| Professional & Scientific | 0 (0.0%) | 0 (0.0%) |
| Enterprise Management | 0 (0.0%) | 0 (0.0%) |
| Administrative & Support | 0 (0.0%) | 0 (0.0%) |
| Educational Services | 0 (0.0%) | 25 (100.0%) |
| Health Care & Social Assistance | 23 (46.9%) | 26 (53.1%) |
| Arts, Entertainment & Recreation | 0 (0.0%) | 0 (0.0%) |
| Accommodation & Food Services | 44 (72.1%) | 17 (27.9%) |
| Public Administration | 0 (0.0%) | 0 (0.0%) |
| Total | 194 (68.5%) | 89 (31.5%) |
Education in Colver
School Enrollment in Colver
The most common levels of schooling among the 52 students in Colver are high school (28 | 53.8%), and college / undergraduate (24 | 46.2%).
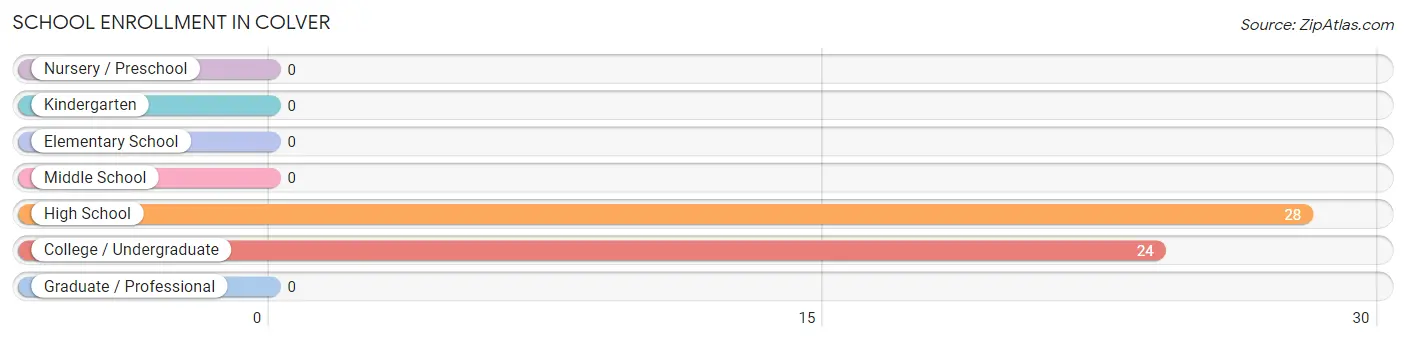
| School Level | # Students | % Students |
| Nursery / Preschool | 0 | 0.0% |
| Kindergarten | 0 | 0.0% |
| Elementary School | 0 | 0.0% |
| Middle School | 0 | 0.0% |
| High School | 28 | 53.8% |
| College / Undergraduate | 24 | 46.2% |
| Graduate / Professional | 0 | 0.0% |
| Total | 52 | 100.0% |
School Enrollment by Age by Funding Source in Colver
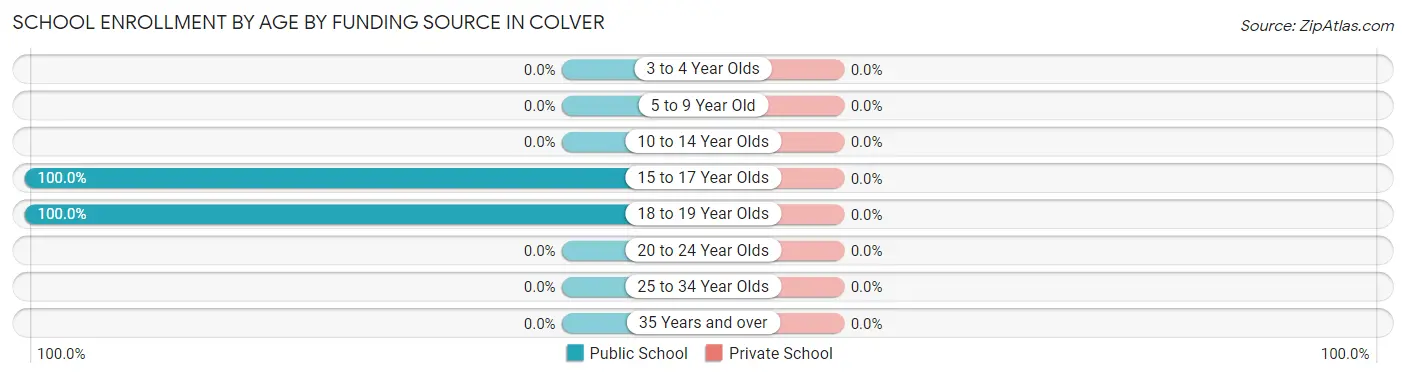
| Age Bracket | Public School | Private School |
| 3 to 4 Year Olds | 0 (0.0%) | 0 (0.0%) |
| 5 to 9 Year Old | 0 (0.0%) | 0 (0.0%) |
| 10 to 14 Year Olds | 0 (0.0%) | 0 (0.0%) |
| 15 to 17 Year Olds | 28 (100.0%) | 0 (0.0%) |
| 18 to 19 Year Olds | 24 (100.0%) | 0 (0.0%) |
| 20 to 24 Year Olds | 0 (0.0%) | 0 (0.0%) |
| 25 to 34 Year Olds | 0 (0.0%) | 0 (0.0%) |
| 35 Years and over | 0 (0.0%) | 0 (0.0%) |
| Total | 52 (100.0%) | 0 (0.0%) |
Educational Attainment by Field of Study in Colver
Science & technology (26 | 36.1%), education (25 | 34.7%), and communications (21 | 29.2%) are the most common fields of study among 72 individuals in Colver who have obtained a bachelor's degree or higher.
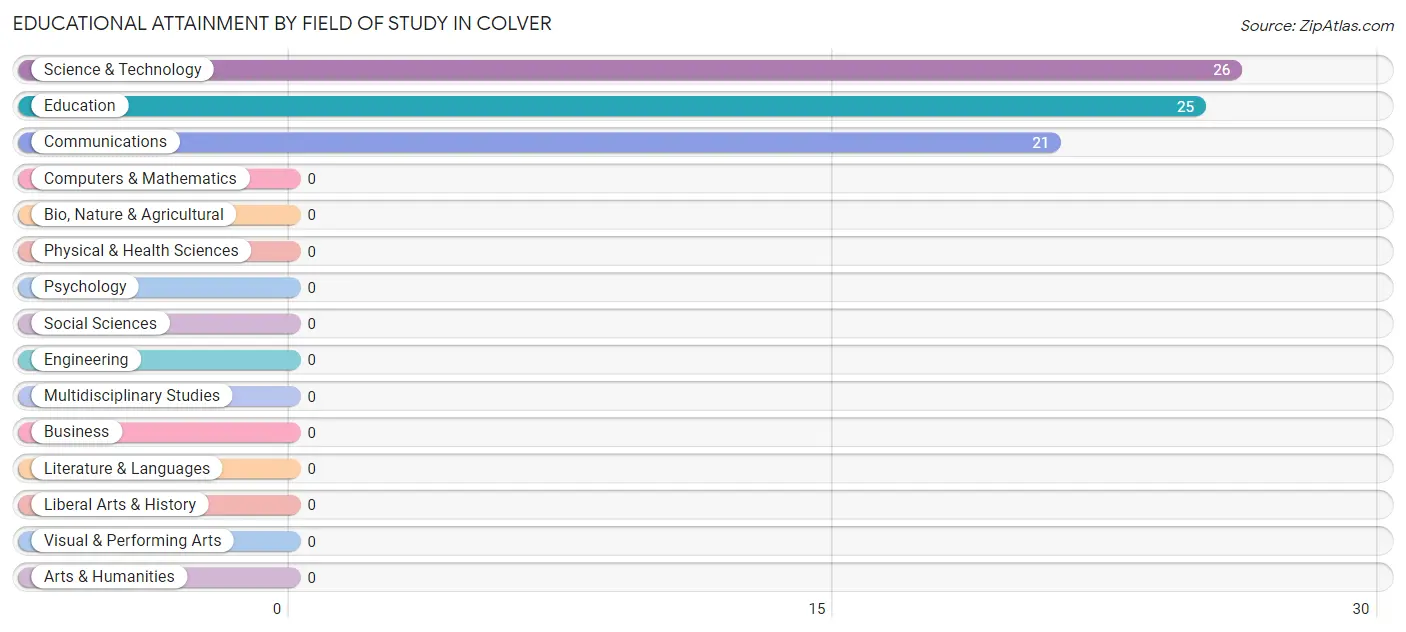
| Field of Study | # Graduates | % Graduates |
| Computers & Mathematics | 0 | 0.0% |
| Bio, Nature & Agricultural | 0 | 0.0% |
| Physical & Health Sciences | 0 | 0.0% |
| Psychology | 0 | 0.0% |
| Social Sciences | 0 | 0.0% |
| Engineering | 0 | 0.0% |
| Multidisciplinary Studies | 0 | 0.0% |
| Science & Technology | 26 | 36.1% |
| Business | 0 | 0.0% |
| Education | 25 | 34.7% |
| Literature & Languages | 0 | 0.0% |
| Liberal Arts & History | 0 | 0.0% |
| Visual & Performing Arts | 0 | 0.0% |
| Communications | 21 | 29.2% |
| Arts & Humanities | 0 | 0.0% |
| Total | 72 | 100.0% |
Transportation & Commute in Colver
Vehicle Availability by Sex in Colver
The most prevalent vehicle ownership categories in Colver are males with 2 vehicles (120, accounting for 61.9%) and females with 2 vehicles (72, making up 134.8%).
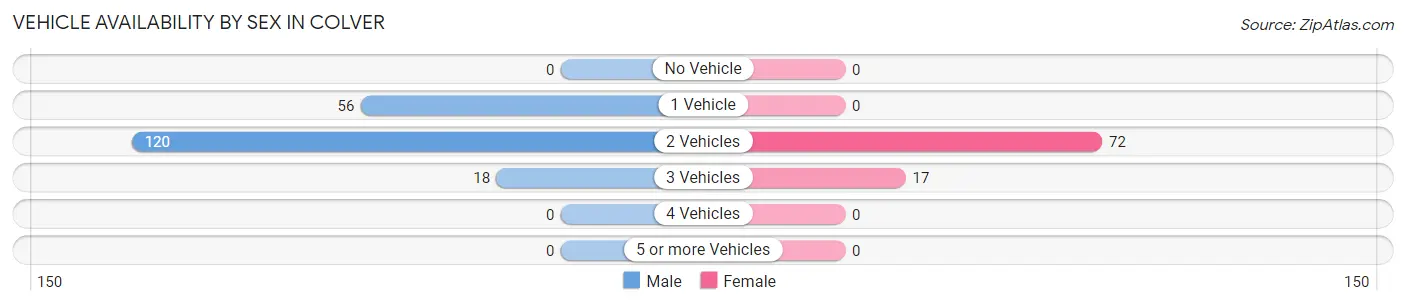
| Vehicles Available | Male | Female |
| No Vehicle | 0 (0.0%) | 0 (0.0%) |
| 1 Vehicle | 56 (28.9%) | 0 (0.0%) |
| 2 Vehicles | 120 (61.9%) | 72 (80.9%) |
| 3 Vehicles | 18 (9.3%) | 17 (19.1%) |
| 4 Vehicles | 0 (0.0%) | 0 (0.0%) |
| 5 or more Vehicles | 0 (0.0%) | 0 (0.0%) |
| Total | 194 (100.0%) | 89 (100.0%) |
Commute Time in Colver
The most frequently occuring commute durations in Colver are 15 to 19 minutes (114 commuters, 40.3%), 45 to 59 minutes (73 commuters, 25.8%), and 20 to 24 minutes (45 commuters, 15.9%).
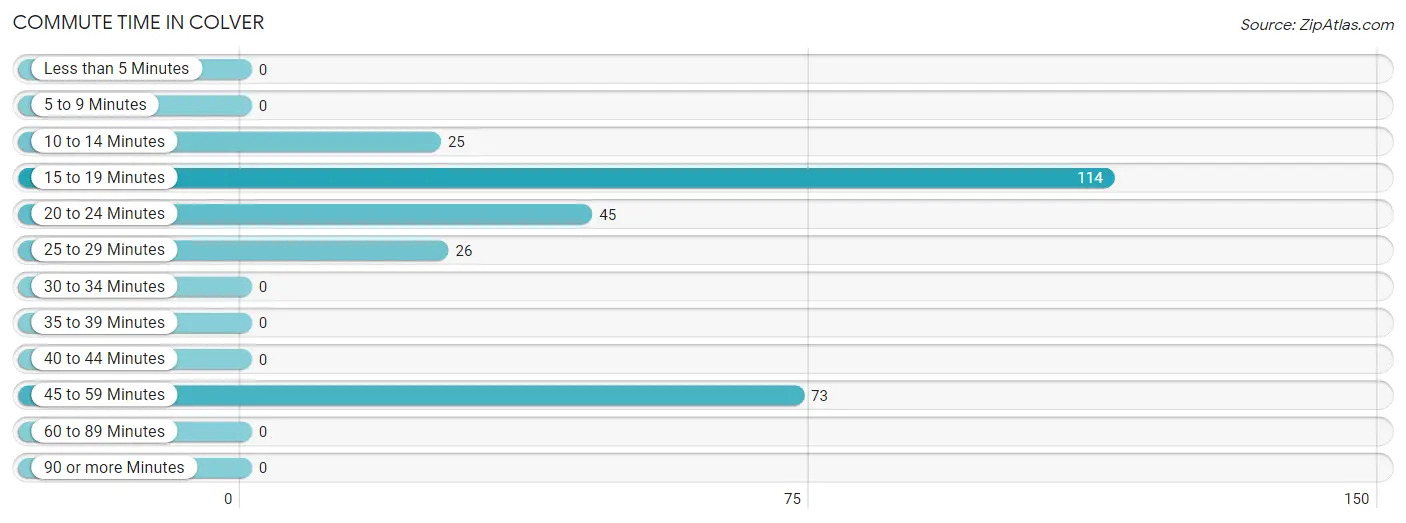
| Commute Time | # Commuters | % Commuters |
| Less than 5 Minutes | 0 | 0.0% |
| 5 to 9 Minutes | 0 | 0.0% |
| 10 to 14 Minutes | 25 | 8.8% |
| 15 to 19 Minutes | 114 | 40.3% |
| 20 to 24 Minutes | 45 | 15.9% |
| 25 to 29 Minutes | 26 | 9.2% |
| 30 to 34 Minutes | 0 | 0.0% |
| 35 to 39 Minutes | 0 | 0.0% |
| 40 to 44 Minutes | 0 | 0.0% |
| 45 to 59 Minutes | 73 | 25.8% |
| 60 to 89 Minutes | 0 | 0.0% |
| 90 or more Minutes | 0 | 0.0% |
Commute Time by Sex in Colver
The most common commute times in Colver are 15 to 19 minutes (97 commuters, 50.0%) for males and 45 to 59 minutes (26 commuters, 29.2%) for females.
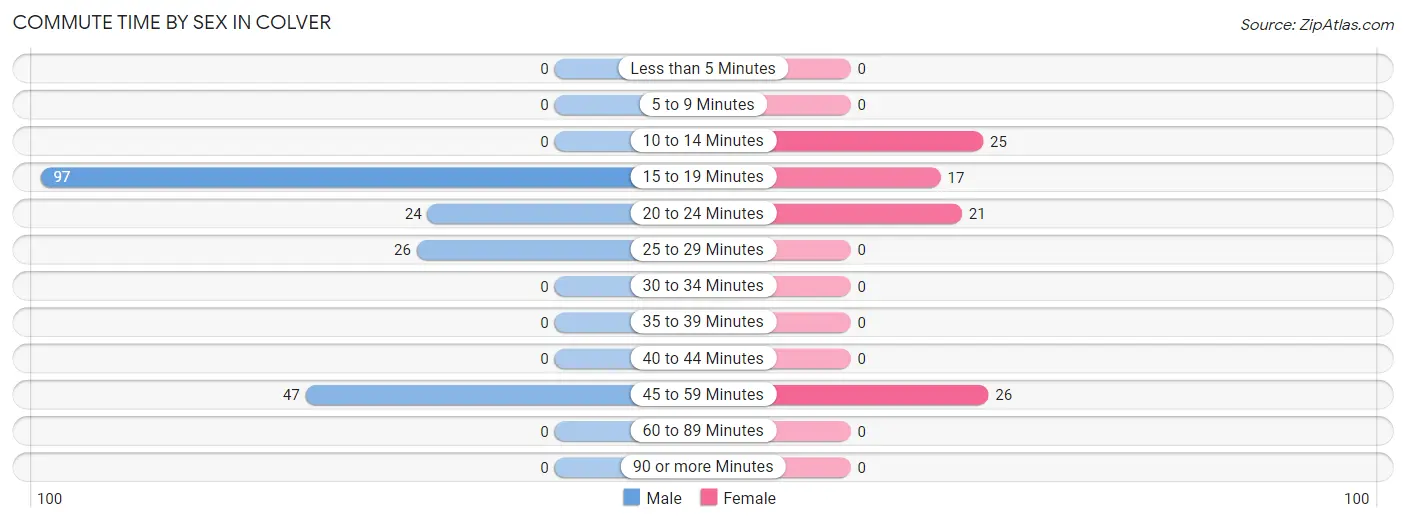
| Commute Time | Male | Female |
| Less than 5 Minutes | 0 (0.0%) | 0 (0.0%) |
| 5 to 9 Minutes | 0 (0.0%) | 0 (0.0%) |
| 10 to 14 Minutes | 0 (0.0%) | 25 (28.1%) |
| 15 to 19 Minutes | 97 (50.0%) | 17 (19.1%) |
| 20 to 24 Minutes | 24 (12.4%) | 21 (23.6%) |
| 25 to 29 Minutes | 26 (13.4%) | 0 (0.0%) |
| 30 to 34 Minutes | 0 (0.0%) | 0 (0.0%) |
| 35 to 39 Minutes | 0 (0.0%) | 0 (0.0%) |
| 40 to 44 Minutes | 0 (0.0%) | 0 (0.0%) |
| 45 to 59 Minutes | 47 (24.2%) | 26 (29.2%) |
| 60 to 89 Minutes | 0 (0.0%) | 0 (0.0%) |
| 90 or more Minutes | 0 (0.0%) | 0 (0.0%) |
Time of Departure to Work by Sex in Colver
The most frequent times of departure to work in Colver are 7:30 AM to 7:59 AM (97, 50.0%) for males and 7:00 AM to 7:29 AM (46, 51.7%) for females.
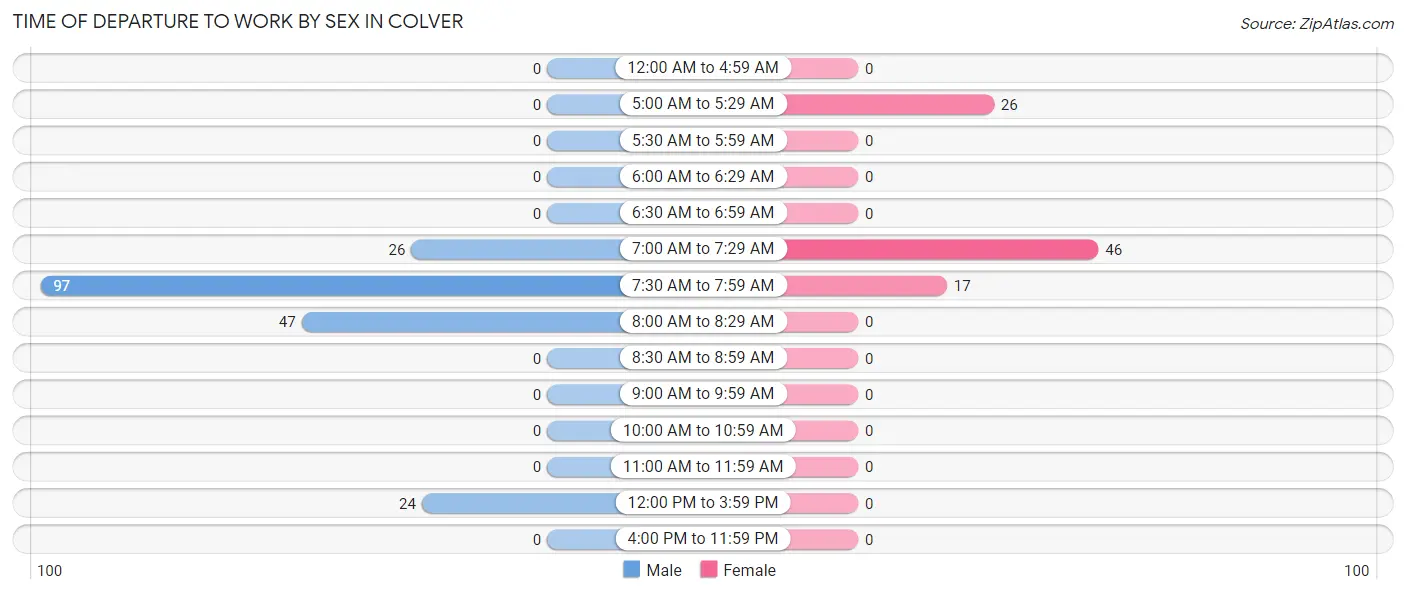
| Time of Departure | Male | Female |
| 12:00 AM to 4:59 AM | 0 (0.0%) | 0 (0.0%) |
| 5:00 AM to 5:29 AM | 0 (0.0%) | 26 (29.2%) |
| 5:30 AM to 5:59 AM | 0 (0.0%) | 0 (0.0%) |
| 6:00 AM to 6:29 AM | 0 (0.0%) | 0 (0.0%) |
| 6:30 AM to 6:59 AM | 0 (0.0%) | 0 (0.0%) |
| 7:00 AM to 7:29 AM | 26 (13.4%) | 46 (51.7%) |
| 7:30 AM to 7:59 AM | 97 (50.0%) | 17 (19.1%) |
| 8:00 AM to 8:29 AM | 47 (24.2%) | 0 (0.0%) |
| 8:30 AM to 8:59 AM | 0 (0.0%) | 0 (0.0%) |
| 9:00 AM to 9:59 AM | 0 (0.0%) | 0 (0.0%) |
| 10:00 AM to 10:59 AM | 0 (0.0%) | 0 (0.0%) |
| 11:00 AM to 11:59 AM | 0 (0.0%) | 0 (0.0%) |
| 12:00 PM to 3:59 PM | 24 (12.4%) | 0 (0.0%) |
| 4:00 PM to 11:59 PM | 0 (0.0%) | 0 (0.0%) |
| Total | 194 (100.0%) | 89 (100.0%) |
Housing Occupancy in Colver
Occupancy by Ownership in Colver
Of the total 301 dwellings in Colver, owner-occupied units account for 221 (73.4%), while renter-occupied units make up 80 (26.6%).
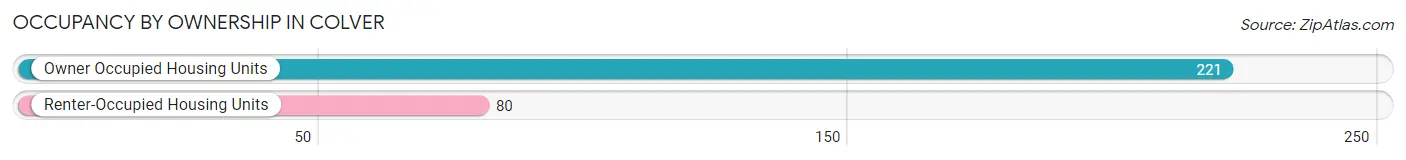
| Occupancy | # Housing Units | % Housing Units |
| Owner Occupied Housing Units | 221 | 73.4% |
| Renter-Occupied Housing Units | 80 | 26.6% |
| Total Occupied Housing Units | 301 | 100.0% |
Occupancy by Household Size in Colver
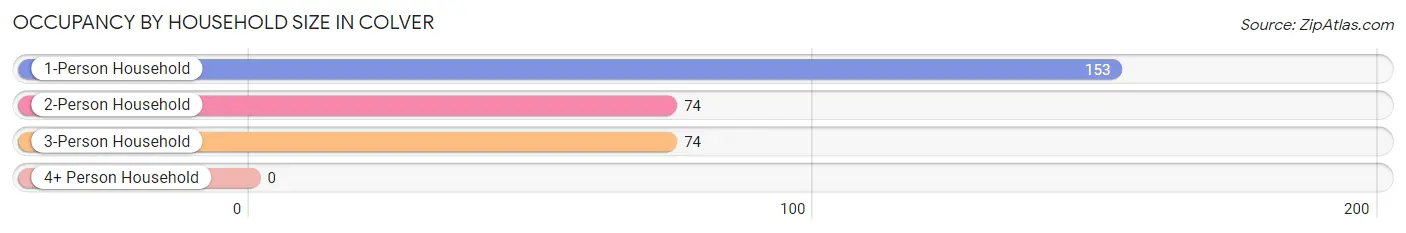
| Household Size | # Housing Units | % Housing Units |
| 1-Person Household | 153 | 50.8% |
| 2-Person Household | 74 | 24.6% |
| 3-Person Household | 74 | 24.6% |
| 4+ Person Household | 0 | 0.0% |
| Total Housing Units | 301 | 100.0% |
Occupancy by Ownership by Household Size in Colver
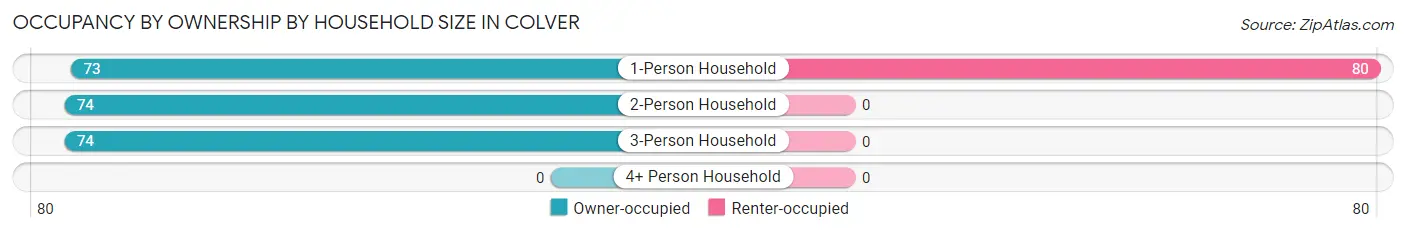
| Household Size | Owner-occupied | Renter-occupied |
| 1-Person Household | 73 (47.7%) | 80 (52.3%) |
| 2-Person Household | 74 (100.0%) | 0 (0.0%) |
| 3-Person Household | 74 (100.0%) | 0 (0.0%) |
| 4+ Person Household | 0 (0.0%) | 0 (0.0%) |
| Total Housing Units | 221 (73.4%) | 80 (26.6%) |
Occupancy by Educational Attainment in Colver
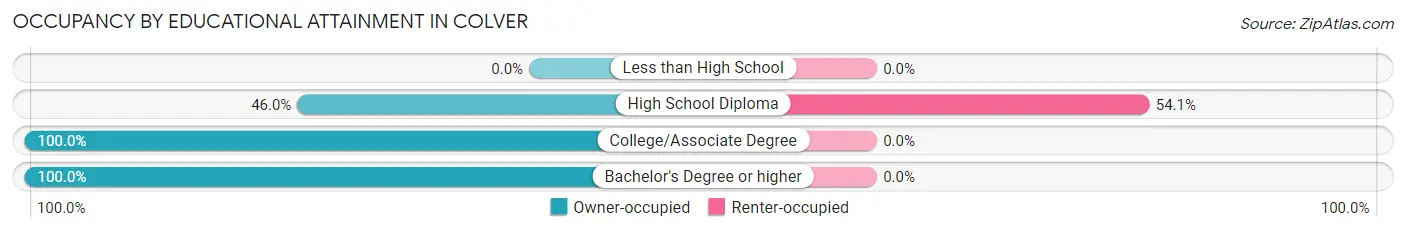
| Household Size | Owner-occupied | Renter-occupied |
| Less than High School | 0 (0.0%) | 0 (0.0%) |
| High School Diploma | 68 (46.0%) | 80 (54.0%) |
| College/Associate Degree | 81 (100.0%) | 0 (0.0%) |
| Bachelor's Degree or higher | 72 (100.0%) | 0 (0.0%) |
Occupancy by Age of Householder in Colver
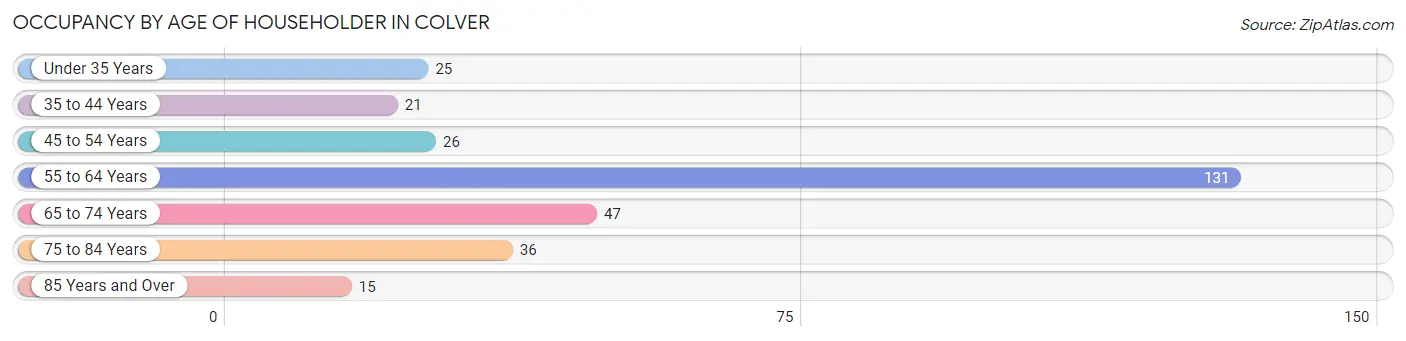
| Age Bracket | # Households | % Households |
| Under 35 Years | 25 | 8.3% |
| 35 to 44 Years | 21 | 7.0% |
| 45 to 54 Years | 26 | 8.6% |
| 55 to 64 Years | 131 | 43.5% |
| 65 to 74 Years | 47 | 15.6% |
| 75 to 84 Years | 36 | 12.0% |
| 85 Years and Over | 15 | 5.0% |
| Total | 301 | 100.0% |
Housing Finances in Colver
Median Income by Occupancy in Colver
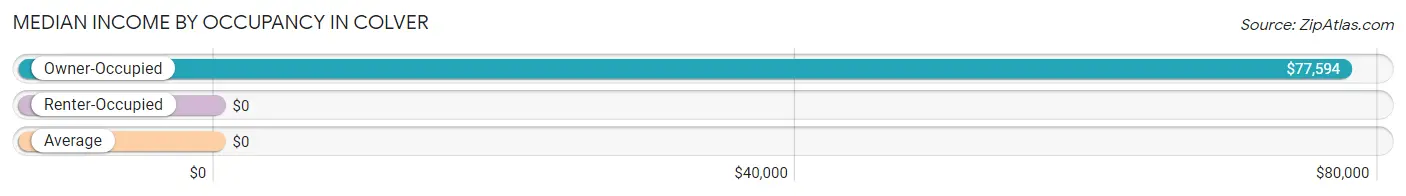
| Occupancy Type | # Households | Median Income |
| Owner-Occupied | 221 (73.4%) | $77,594 |
| Renter-Occupied | 80 (26.6%) | $0 |
| Average | 301 (100.0%) | $0 |
Occupancy by Householder Income Bracket in Colver
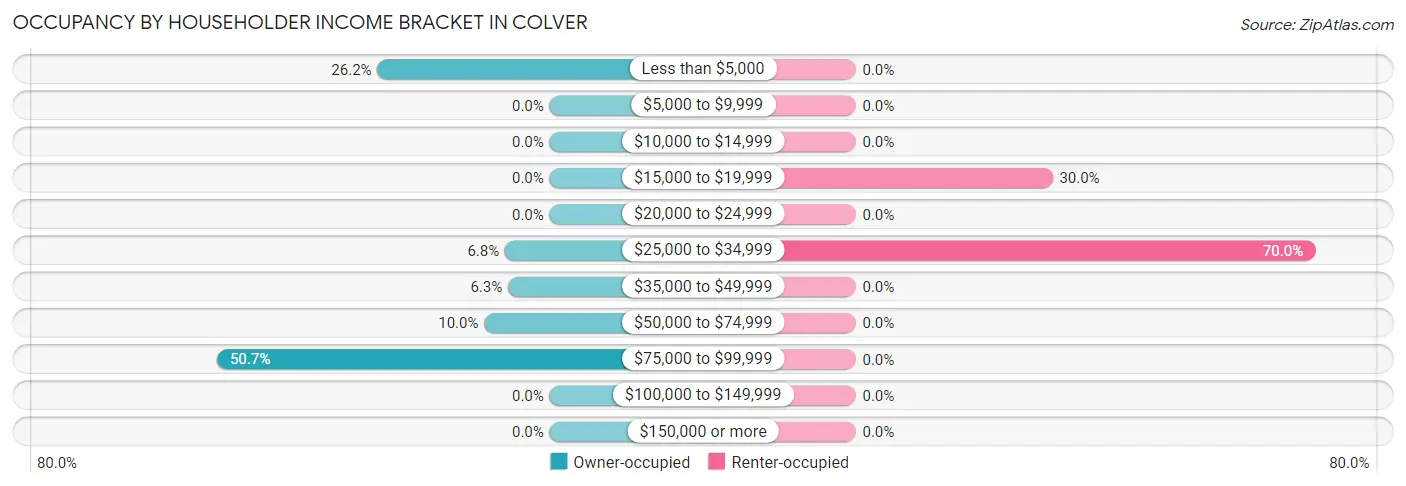
| Income Bracket | Owner-occupied | Renter-occupied |
| Less than $5,000 | 58 (26.2%) | 0 (0.0%) |
| $5,000 to $9,999 | 0 (0.0%) | 0 (0.0%) |
| $10,000 to $14,999 | 0 (0.0%) | 0 (0.0%) |
| $15,000 to $19,999 | 0 (0.0%) | 24 (30.0%) |
| $20,000 to $24,999 | 0 (0.0%) | 0 (0.0%) |
| $25,000 to $34,999 | 15 (6.8%) | 56 (70.0%) |
| $35,000 to $49,999 | 14 (6.3%) | 0 (0.0%) |
| $50,000 to $74,999 | 22 (10.0%) | 0 (0.0%) |
| $75,000 to $99,999 | 112 (50.7%) | 0 (0.0%) |
| $100,000 to $149,999 | 0 (0.0%) | 0 (0.0%) |
| $150,000 or more | 0 (0.0%) | 0 (0.0%) |
| Total | 221 (100.0%) | 80 (100.0%) |
Monthly Housing Cost Tiers in Colver
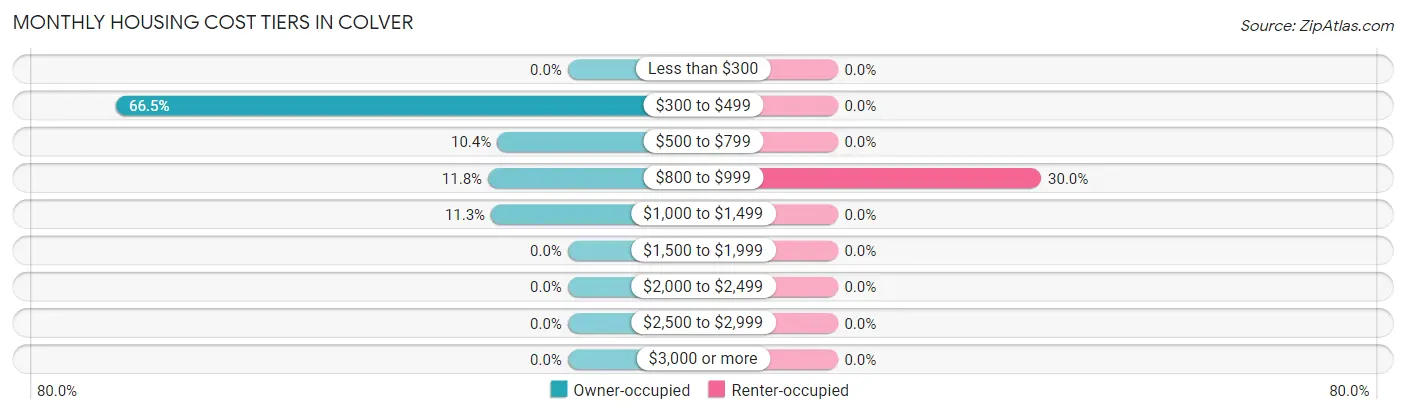
| Monthly Cost | Owner-occupied | Renter-occupied |
| Less than $300 | 0 (0.0%) | 0 (0.0%) |
| $300 to $499 | 147 (66.5%) | 0 (0.0%) |
| $500 to $799 | 23 (10.4%) | 0 (0.0%) |
| $800 to $999 | 26 (11.8%) | 24 (30.0%) |
| $1,000 to $1,499 | 25 (11.3%) | 0 (0.0%) |
| $1,500 to $1,999 | 0 (0.0%) | 0 (0.0%) |
| $2,000 to $2,499 | 0 (0.0%) | 0 (0.0%) |
| $2,500 to $2,999 | 0 (0.0%) | 0 (0.0%) |
| $3,000 or more | 0 (0.0%) | 0 (0.0%) |
| Total | 221 (100.0%) | 80 (100.0%) |
Physical Housing Characteristics in Colver
Housing Structures in Colver
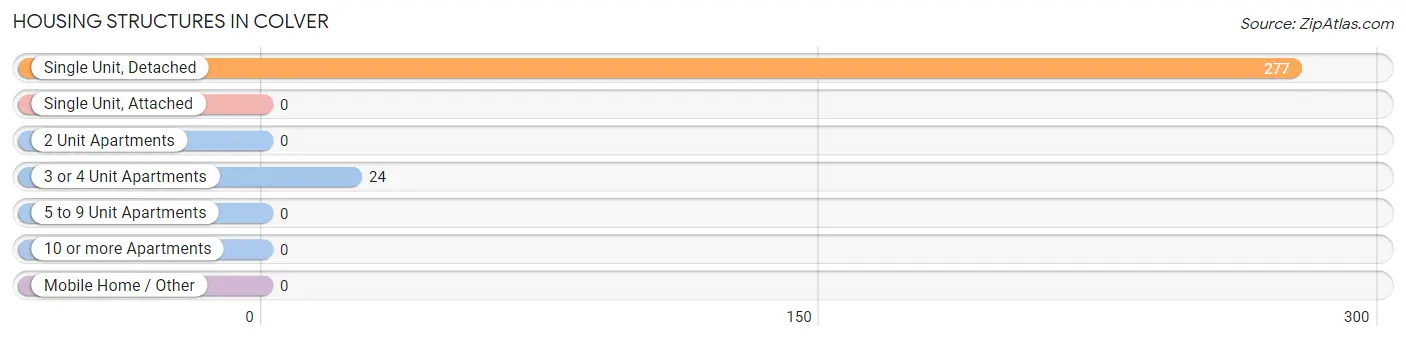
| Structure Type | # Housing Units | % Housing Units |
| Single Unit, Detached | 277 | 92.0% |
| Single Unit, Attached | 0 | 0.0% |
| 2 Unit Apartments | 0 | 0.0% |
| 3 or 4 Unit Apartments | 24 | 8.0% |
| 5 to 9 Unit Apartments | 0 | 0.0% |
| 10 or more Apartments | 0 | 0.0% |
| Mobile Home / Other | 0 | 0.0% |
| Total | 301 | 100.0% |
Housing Structures by Occupancy in Colver
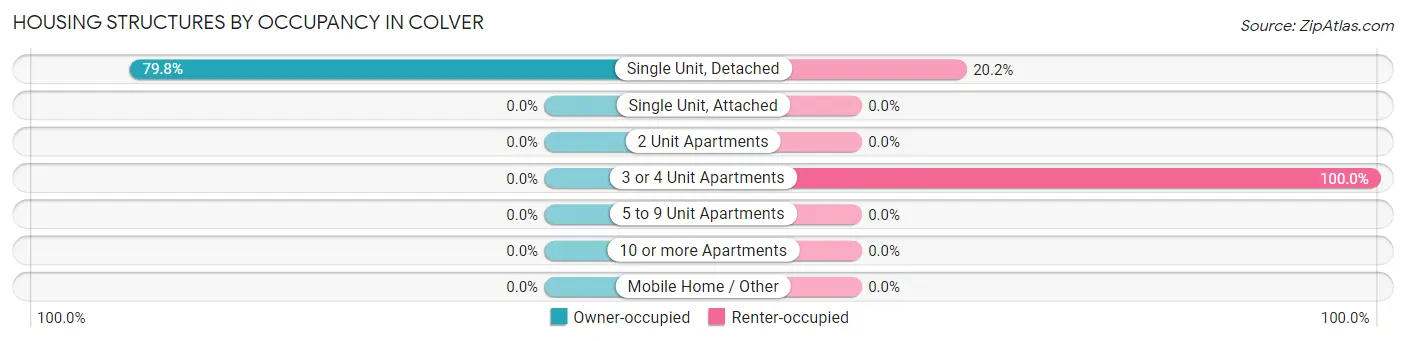
| Structure Type | Owner-occupied | Renter-occupied |
| Single Unit, Detached | 221 (79.8%) | 56 (20.2%) |
| Single Unit, Attached | 0 (0.0%) | 0 (0.0%) |
| 2 Unit Apartments | 0 (0.0%) | 0 (0.0%) |
| 3 or 4 Unit Apartments | 0 (0.0%) | 24 (100.0%) |
| 5 to 9 Unit Apartments | 0 (0.0%) | 0 (0.0%) |
| 10 or more Apartments | 0 (0.0%) | 0 (0.0%) |
| Mobile Home / Other | 0 (0.0%) | 0 (0.0%) |
| Total | 221 (73.4%) | 80 (26.6%) |
Housing Structures by Number of Rooms in Colver
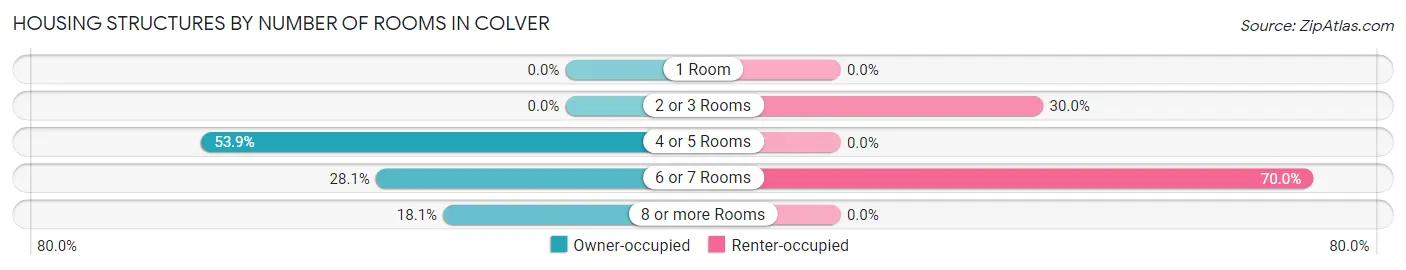
| Number of Rooms | Owner-occupied | Renter-occupied |
| 1 Room | 0 (0.0%) | 0 (0.0%) |
| 2 or 3 Rooms | 0 (0.0%) | 24 (30.0%) |
| 4 or 5 Rooms | 119 (53.8%) | 0 (0.0%) |
| 6 or 7 Rooms | 62 (28.1%) | 56 (70.0%) |
| 8 or more Rooms | 40 (18.1%) | 0 (0.0%) |
| Total | 221 (100.0%) | 80 (100.0%) |
Housing Structure by Heating Type in Colver
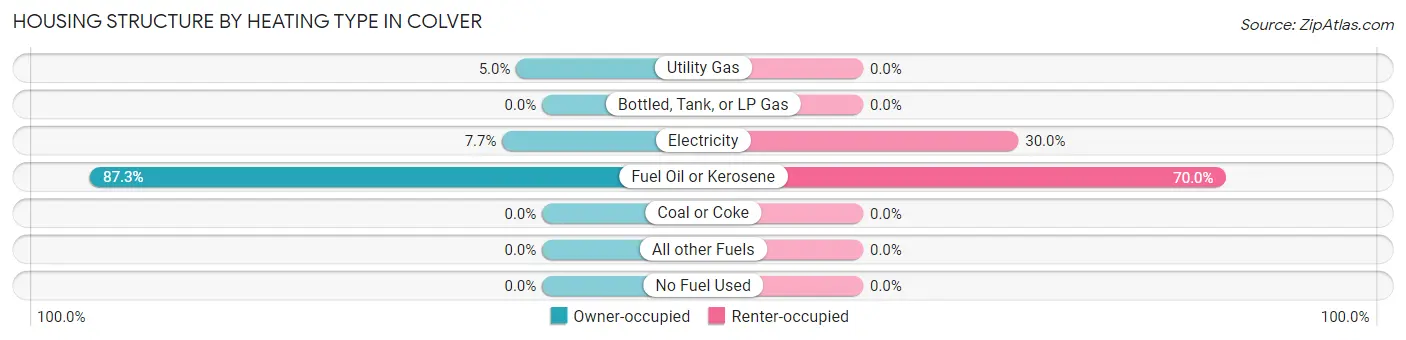
| Heating Type | Owner-occupied | Renter-occupied |
| Utility Gas | 11 (5.0%) | 0 (0.0%) |
| Bottled, Tank, or LP Gas | 0 (0.0%) | 0 (0.0%) |
| Electricity | 17 (7.7%) | 24 (30.0%) |
| Fuel Oil or Kerosene | 193 (87.3%) | 56 (70.0%) |
| Coal or Coke | 0 (0.0%) | 0 (0.0%) |
| All other Fuels | 0 (0.0%) | 0 (0.0%) |
| No Fuel Used | 0 (0.0%) | 0 (0.0%) |
| Total | 221 (100.0%) | 80 (100.0%) |
Household Vehicle Usage in Colver
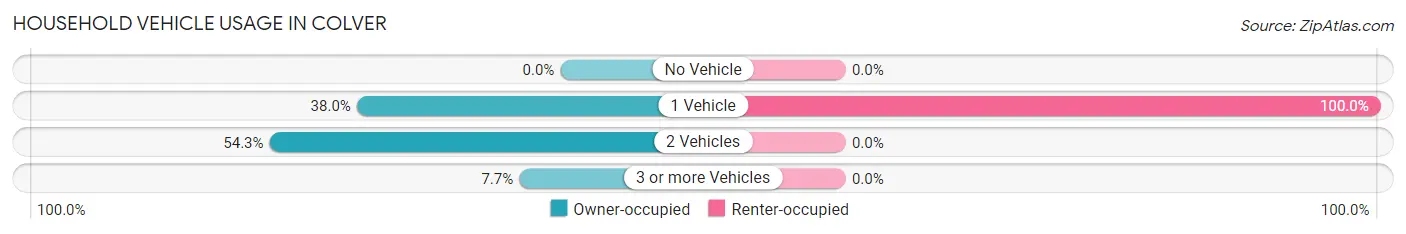
| Vehicles per Household | Owner-occupied | Renter-occupied |
| No Vehicle | 0 (0.0%) | 0 (0.0%) |
| 1 Vehicle | 84 (38.0%) | 80 (100.0%) |
| 2 Vehicles | 120 (54.3%) | 0 (0.0%) |
| 3 or more Vehicles | 17 (7.7%) | 0 (0.0%) |
| Total | 221 (100.0%) | 80 (100.0%) |
Real Estate & Mortgages in Colver
Real Estate and Mortgage Overview in Colver
| Characteristic | Without Mortgage | With Mortgage |
| Housing Units | 170 | 51 |
| Median Property Value | $56,800 | $0 |
| Median Household Income | - | - |
| Monthly Housing Costs | $381 | $0 |
| Real Estate Taxes | $1,011 | $0 |
Property Value by Mortgage Status in Colver
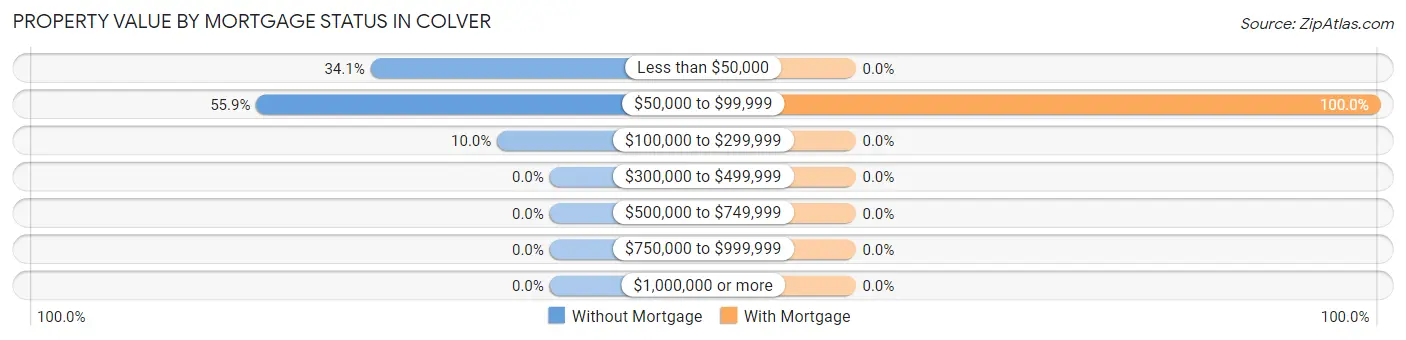
| Property Value | Without Mortgage | With Mortgage |
| Less than $50,000 | 58 (34.1%) | 0 (0.0%) |
| $50,000 to $99,999 | 95 (55.9%) | 51 (100.0%) |
| $100,000 to $299,999 | 17 (10.0%) | 0 (0.0%) |
| $300,000 to $499,999 | 0 (0.0%) | 0 (0.0%) |
| $500,000 to $749,999 | 0 (0.0%) | 0 (0.0%) |
| $750,000 to $999,999 | 0 (0.0%) | 0 (0.0%) |
| $1,000,000 or more | 0 (0.0%) | 0 (0.0%) |
| Total | 170 (100.0%) | 51 (100.0%) |
Household Income by Mortgage Status in Colver
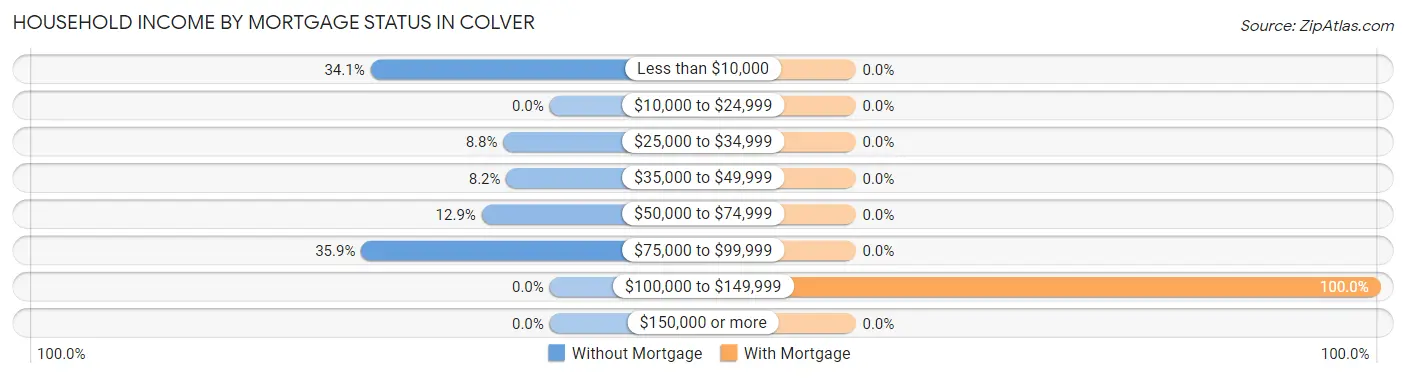
| Household Income | Without Mortgage | With Mortgage |
| Less than $10,000 | 58 (34.1%) | 0 (0.0%) |
| $10,000 to $24,999 | 0 (0.0%) | 0 (0.0%) |
| $25,000 to $34,999 | 15 (8.8%) | 0 (0.0%) |
| $35,000 to $49,999 | 14 (8.2%) | 0 (0.0%) |
| $50,000 to $74,999 | 22 (12.9%) | 0 (0.0%) |
| $75,000 to $99,999 | 61 (35.9%) | 0 (0.0%) |
| $100,000 to $149,999 | 0 (0.0%) | 51 (100.0%) |
| $150,000 or more | 0 (0.0%) | 0 (0.0%) |
| Total | 170 (100.0%) | 51 (100.0%) |
Property Value to Household Income Ratio in Colver
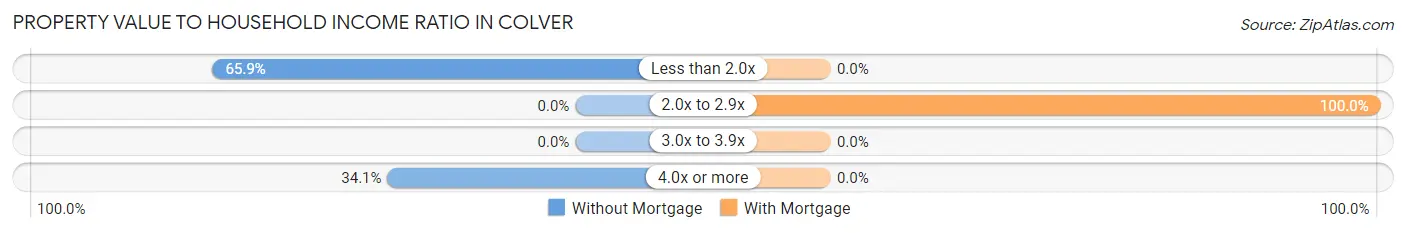
| Value-to-Income Ratio | Without Mortgage | With Mortgage |
| Less than 2.0x | 112 (65.9%) | 0 (0.0%) |
| 2.0x to 2.9x | 0 (0.0%) | 51 (100.0%) |
| 3.0x to 3.9x | 0 (0.0%) | 0 (0.0%) |
| 4.0x or more | 58 (34.1%) | 0 (0.0%) |
| Total | 170 (100.0%) | 51 (100.0%) |
Real Estate Taxes by Mortgage Status in Colver
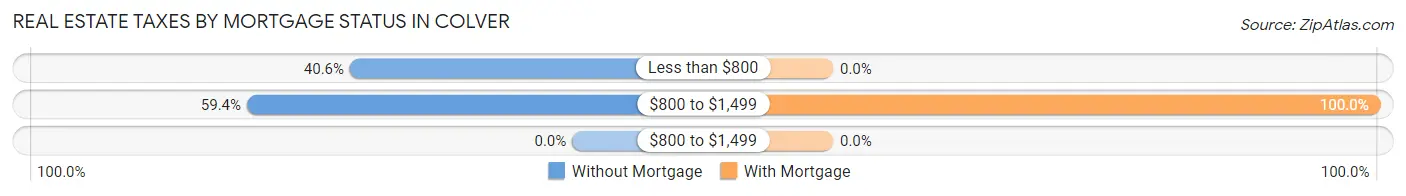
| Property Taxes | Without Mortgage | With Mortgage |
| Less than $800 | 69 (40.6%) | 0 (0.0%) |
| $800 to $1,499 | 101 (59.4%) | 51 (100.0%) |
| $800 to $1,499 | 0 (0.0%) | 0 (0.0%) |
| Total | 170 (100.0%) | 51 (100.0%) |
Health & Disability in Colver
Health Insurance Coverage by Age in Colver
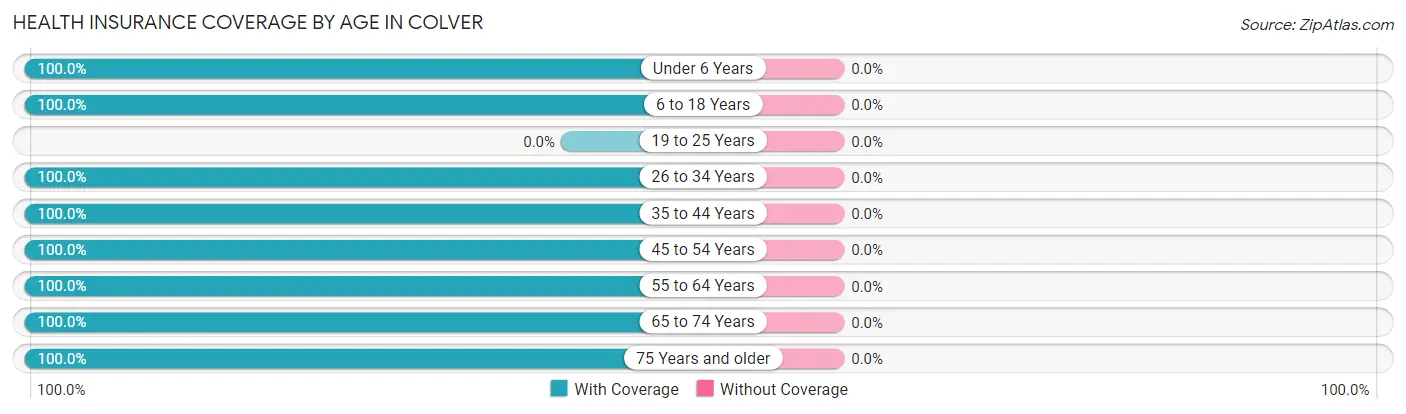
| Age Bracket | With Coverage | Without Coverage |
| Under 6 Years | 24 (100.0%) | 0 (0.0%) |
| 6 to 18 Years | 52 (100.0%) | 0 (0.0%) |
| 19 to 25 Years | 0 (0.0%) | 0 (0.0%) |
| 26 to 34 Years | 51 (100.0%) | 0 (0.0%) |
| 35 to 44 Years | 73 (100.0%) | 0 (0.0%) |
| 45 to 54 Years | 32 (100.0%) | 0 (0.0%) |
| 55 to 64 Years | 191 (100.0%) | 0 (0.0%) |
| 65 to 74 Years | 59 (100.0%) | 0 (0.0%) |
| 75 Years and older | 62 (100.0%) | 0 (0.0%) |
| Total | 544 (100.0%) | 0 (0.0%) |
Health Insurance Coverage by Citizenship Status in Colver
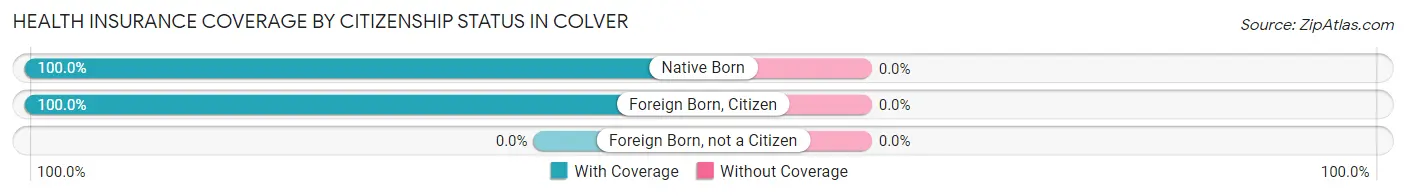
| Citizenship Status | With Coverage | Without Coverage |
| Native Born | 24 (100.0%) | 0 (0.0%) |
| Foreign Born, Citizen | 52 (100.0%) | 0 (0.0%) |
| Foreign Born, not a Citizen | 0 (0.0%) | 0 (0.0%) |
Health Insurance Coverage by Household Income in Colver
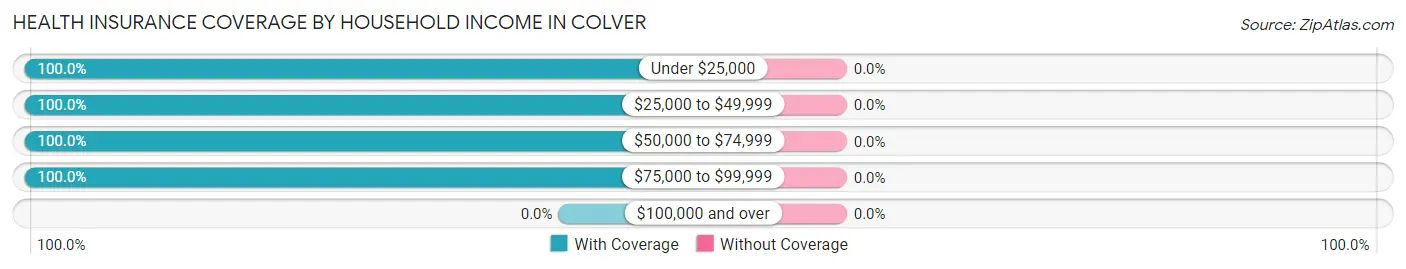
| Household Income | With Coverage | Without Coverage |
| Under $25,000 | 82 (100.0%) | 0 (0.0%) |
| $25,000 to $49,999 | 104 (100.0%) | 0 (0.0%) |
| $50,000 to $74,999 | 45 (100.0%) | 0 (0.0%) |
| $75,000 to $99,999 | 302 (100.0%) | 0 (0.0%) |
| $100,000 and over | 0 (0.0%) | 0 (0.0%) |
Public vs Private Health Insurance Coverage by Age in Colver
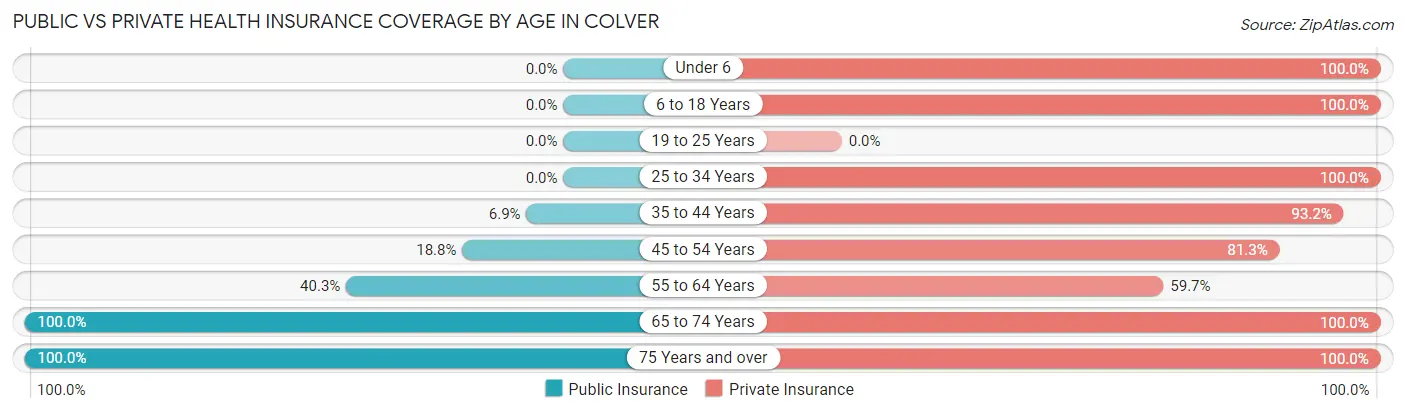
| Age Bracket | Public Insurance | Private Insurance |
| Under 6 | 0 (0.0%) | 24 (100.0%) |
| 6 to 18 Years | 0 (0.0%) | 52 (100.0%) |
| 19 to 25 Years | 0 (0.0%) | 0 (0.0%) |
| 25 to 34 Years | 0 (0.0%) | 51 (100.0%) |
| 35 to 44 Years | 5 (6.9%) | 68 (93.1%) |
| 45 to 54 Years | 6 (18.8%) | 26 (81.2%) |
| 55 to 64 Years | 77 (40.3%) | 114 (59.7%) |
| 65 to 74 Years | 59 (100.0%) | 59 (100.0%) |
| 75 Years and over | 62 (100.0%) | 62 (100.0%) |
| Total | 209 (38.4%) | 456 (83.8%) |
Disability Status by Sex by Age in Colver
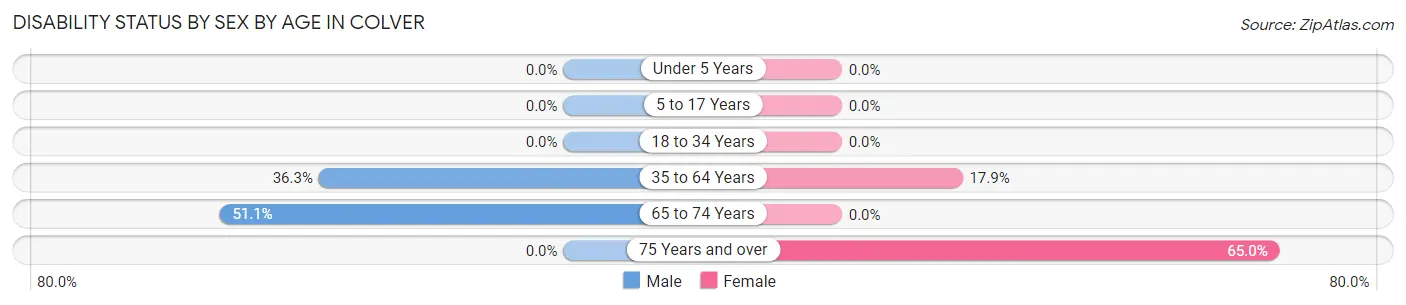
| Age Bracket | Male | Female |
| Under 5 Years | 0 (0.0%) | 0 (0.0%) |
| 5 to 17 Years | 0 (0.0%) | 0 (0.0%) |
| 18 to 34 Years | 0 (0.0%) | 0 (0.0%) |
| 35 to 64 Years | 69 (36.3%) | 19 (17.9%) |
| 65 to 74 Years | 24 (51.1%) | 0 (0.0%) |
| 75 Years and over | 0 (0.0%) | 26 (65.0%) |
Disability Class by Sex by Age in Colver
Disability Class: Hearing Difficulty
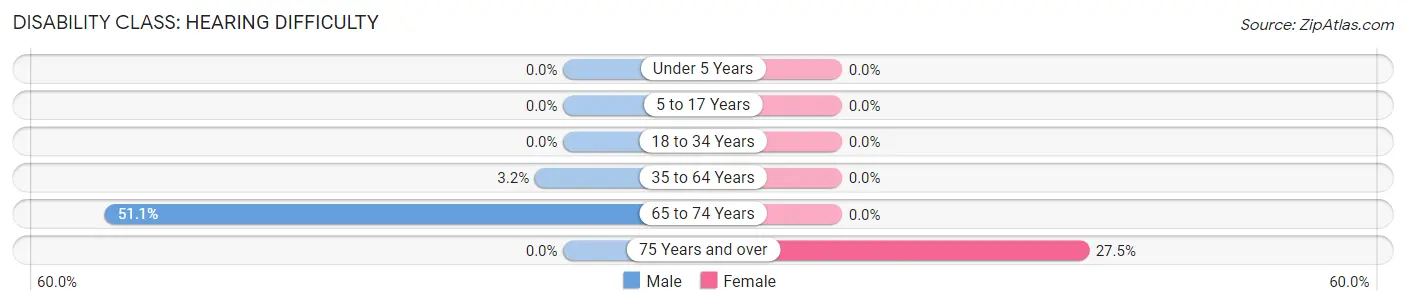
| Age Bracket | Male | Female |
| Under 5 Years | 0 (0.0%) | 0 (0.0%) |
| 5 to 17 Years | 0 (0.0%) | 0 (0.0%) |
| 18 to 34 Years | 0 (0.0%) | 0 (0.0%) |
| 35 to 64 Years | 6 (3.2%) | 0 (0.0%) |
| 65 to 74 Years | 24 (51.1%) | 0 (0.0%) |
| 75 Years and over | 0 (0.0%) | 11 (27.5%) |
Disability Class: Vision Difficulty
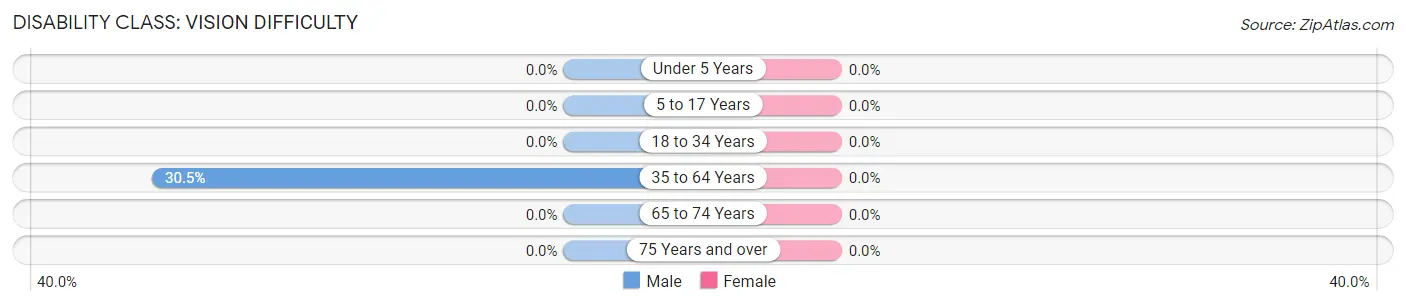
| Age Bracket | Male | Female |
| Under 5 Years | 0 (0.0%) | 0 (0.0%) |
| 5 to 17 Years | 0 (0.0%) | 0 (0.0%) |
| 18 to 34 Years | 0 (0.0%) | 0 (0.0%) |
| 35 to 64 Years | 58 (30.5%) | 0 (0.0%) |
| 65 to 74 Years | 0 (0.0%) | 0 (0.0%) |
| 75 Years and over | 0 (0.0%) | 0 (0.0%) |
Disability Class: Cognitive Difficulty
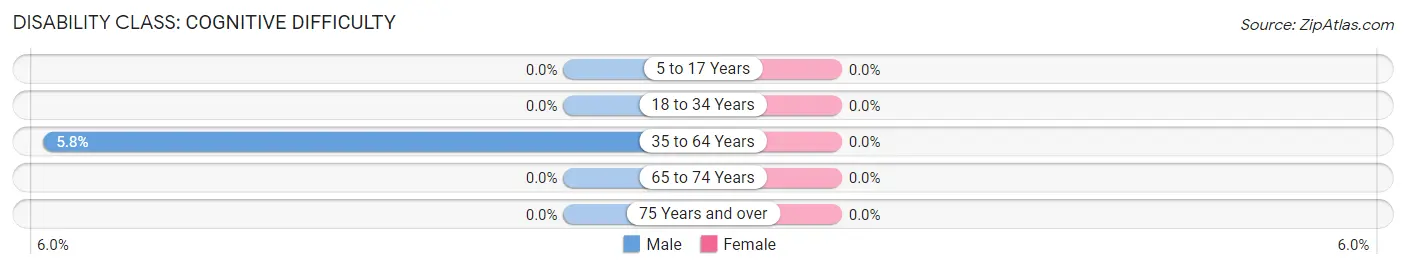
| Age Bracket | Male | Female |
| 5 to 17 Years | 0 (0.0%) | 0 (0.0%) |
| 18 to 34 Years | 0 (0.0%) | 0 (0.0%) |
| 35 to 64 Years | 11 (5.8%) | 0 (0.0%) |
| 65 to 74 Years | 0 (0.0%) | 0 (0.0%) |
| 75 Years and over | 0 (0.0%) | 0 (0.0%) |
Disability Class: Ambulatory Difficulty
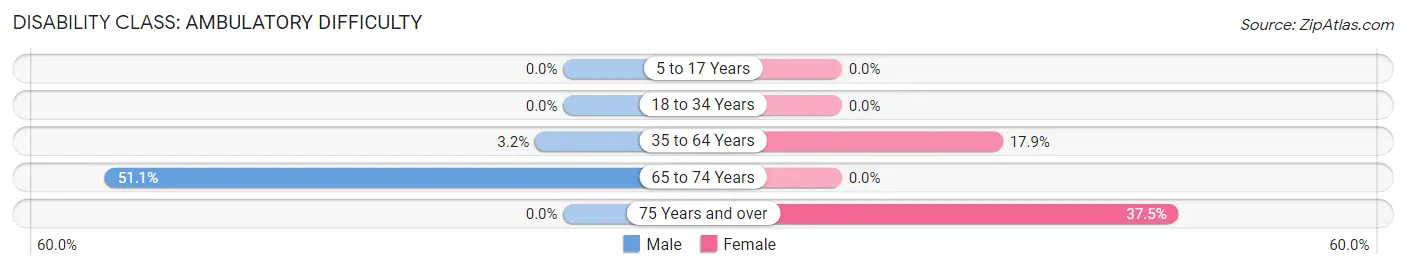
| Age Bracket | Male | Female |
| 5 to 17 Years | 0 (0.0%) | 0 (0.0%) |
| 18 to 34 Years | 0 (0.0%) | 0 (0.0%) |
| 35 to 64 Years | 6 (3.2%) | 19 (17.9%) |
| 65 to 74 Years | 24 (51.1%) | 0 (0.0%) |
| 75 Years and over | 0 (0.0%) | 15 (37.5%) |
Disability Class: Self-Care Difficulty
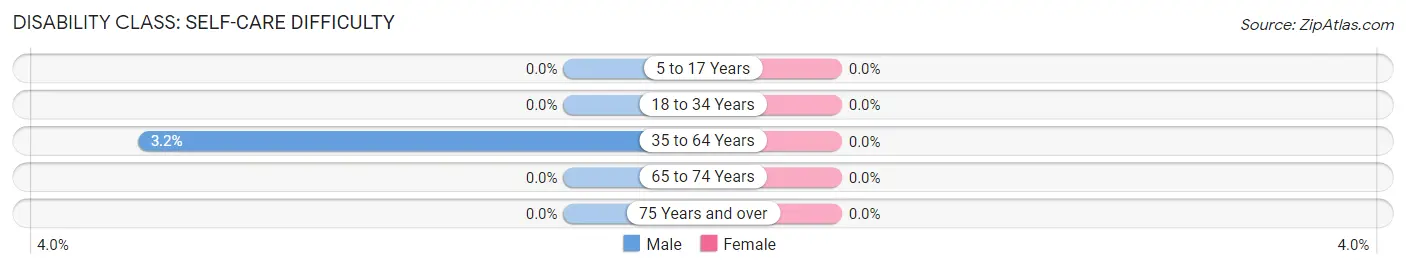
| Age Bracket | Male | Female |
| 5 to 17 Years | 0 (0.0%) | 0 (0.0%) |
| 18 to 34 Years | 0 (0.0%) | 0 (0.0%) |
| 35 to 64 Years | 6 (3.2%) | 0 (0.0%) |
| 65 to 74 Years | 0 (0.0%) | 0 (0.0%) |
| 75 Years and over | 0 (0.0%) | 0 (0.0%) |
Technology Access in Colver
Computing Device Access in Colver
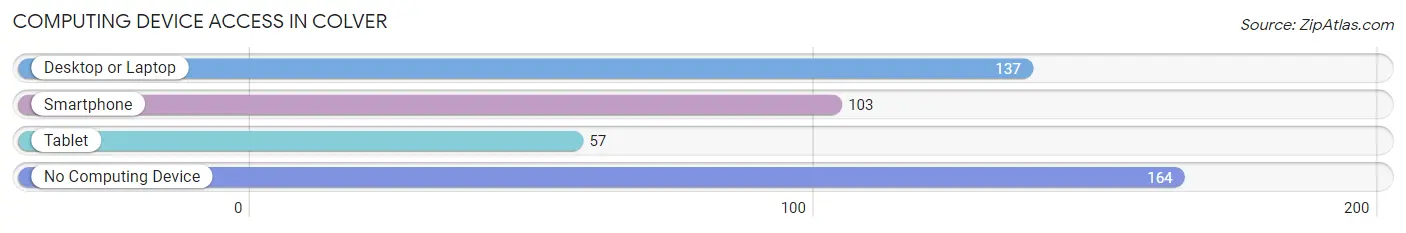
| Device Type | # Households | % Households |
| Desktop or Laptop | 137 | 45.5% |
| Smartphone | 103 | 34.2% |
| Tablet | 57 | 18.9% |
| No Computing Device | 164 | 54.5% |
| Total | 301 | 100.0% |
Internet Access in Colver

| Internet Type | # Households | % Households |
| Dial-Up Internet | 0 | 0.0% |
| Broadband Home | 137 | 45.5% |
| Cellular Data Only | 0 | 0.0% |
| Satellite Internet | 0 | 0.0% |
| No Internet | 164 | 54.5% |
| Total | 301 | 100.0% |
Colver Summary
Colver, Pennsylvania is a small borough located in Cambria County, Pennsylvania. It is situated in the foothills of the Allegheny Mountains, approximately 10 miles east of Johnstown. The borough was founded in 1891 and has a population of approximately 500 people.
Geography
Colver is located in the foothills of the Allegheny Mountains, approximately 10 miles east of Johnstown. The borough is situated in a valley surrounded by hills and mountains. The terrain is mostly hilly and wooded, with some flat areas. The borough is located in the Conemaugh River Valley, which is part of the Allegheny Plateau. The climate is humid continental, with cold winters and hot summers.
Economy
The economy of Colver is largely based on agriculture and tourism. The borough is home to several small farms, which produce a variety of crops, including corn, soybeans, hay, and wheat. The borough also has several small businesses, including a grocery store, a hardware store, and a restaurant. Tourism is also an important part of the local economy, as the borough is located near several popular attractions, including the Johnstown Flood National Memorial and the Allegheny Portage Railroad National Historic Site.
Demographics
As of the 2010 census, the population of Colver was 498. The racial makeup of the borough was 97.2% White, 0.6% African American, 0.2% Native American, 0.2% Asian, 0.2% from other races, and 1.8% from two or more races. Hispanic or Latino of any race were 0.8% of the population.
The median income for a household in Colver was $37,500, and the median income for a family was $41,250. The per capita income for the borough was $17,845. About 11.2% of families and 13.2% of the population were below the poverty line, including 16.7% of those under age 18 and 8.3% of those age 65 or over.
Conclusion
Colver, Pennsylvania is a small borough located in Cambria County, Pennsylvania. It is situated in the foothills of the Allegheny Mountains, approximately 10 miles east of Johnstown. The borough was founded in 1891 and has a population of approximately 500 people. The economy of Colver is largely based on agriculture and tourism, and the borough is home to several small businesses. The population of Colver is mostly White, with a small percentage of African American, Native American, and Asian residents. The median income for a household in Colver is $37,500, and the per capita income for the borough is $17,845.
Common Questions
What is Per Capita Income in Colver?
Per Capita income in Colver is $27,234.
What is the Median Family Income in Colver?
Median Family Income in Colver is $79,875.
What is Inequality or Gini Index in Colver?
Inequality or Gini Index in Colver is 0.39.
What is the Total Population of Colver?
Total Population of Colver is 544.
What is the Total Male Population of Colver?
Total Male Population of Colver is 337.
What is the Total Female Population of Colver?
Total Female Population of Colver is 207.
What is the Ratio of Males per 100 Females in Colver?
There are 162.80 Males per 100 Females in Colver.
What is the Ratio of Females per 100 Males in Colver?
There are 61.42 Females per 100 Males in Colver.
What is the Median Population Age in Colver?
Median Population Age in Colver is 58.4 Years.
What is the Average Family Size in Colver
Average Family Size in Colver is 2.6 People.
What is the Average Household Size in Colver
Average Household Size in Colver is 1.8 People.
How Large is the Labor Force in Colver?
There are 283 People in the Labor Forcein in Colver.
What is the Percentage of People in the Labor Force in Colver?
57.5% of People are in the Labor Force in Colver.