Cities with the Most Immigrants from Latin America in Pennsylvania
RELATED REPORTS & OPTIONS
Latin America
Pennsylvania
Compare Cities
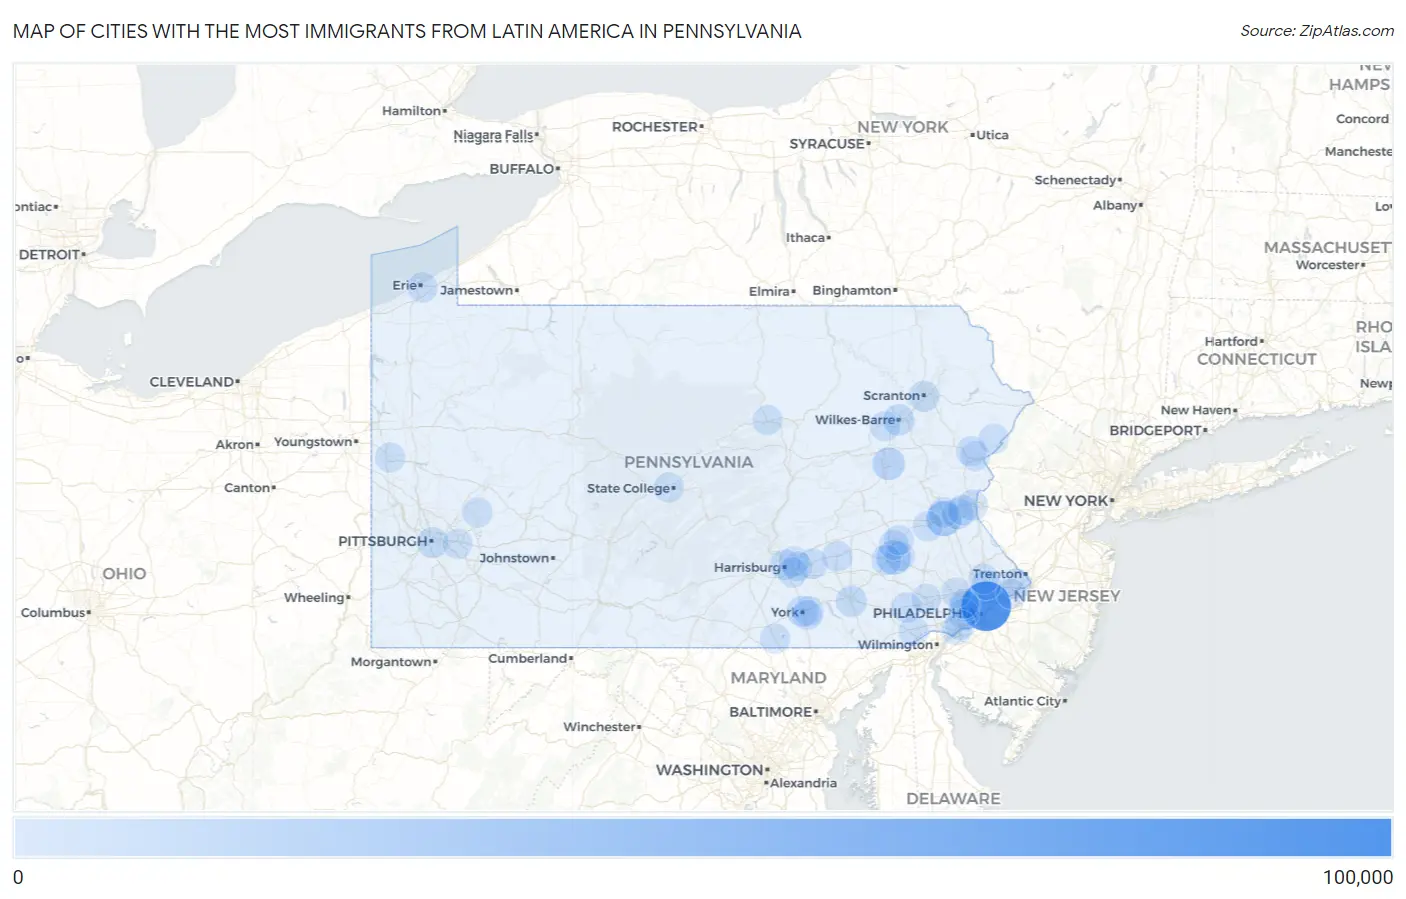
Map of Cities with the Most Immigrants from Latin America in Pennsylvania
0
100,000
Cities with the Most Immigrants from Latin America in Pennsylvania
| City | Latin America | vs State | vs National | |
| 1. | Philadelphia | 81,050 | 300,632(26.96%)#1 | 22,649,518(0.36%)#18 |
| 2. | Allentown | 19,647 | 300,632(6.54%)#2 | 22,649,518(0.09%)#160 |
| 3. | Reading | 16,832 | 300,632(5.60%)#3 | 22,649,518(0.07%)#190 |
| 4. | Hazleton | 9,962 | 300,632(3.31%)#4 | 22,649,518(0.04%)#334 |
| 5. | Wilkes Barre | 5,154 | 300,632(1.71%)#5 | 22,649,518(0.02%)#659 |
| 6. | Lancaster | 4,345 | 300,632(1.45%)#6 | 22,649,518(0.02%)#747 |
| 7. | Pittsburgh | 4,254 | 300,632(1.42%)#7 | 22,649,518(0.02%)#760 |
| 8. | Norristown Borough | 4,199 | 300,632(1.40%)#8 | 22,649,518(0.02%)#770 |
| 9. | Bethlehem | 4,112 | 300,632(1.37%)#9 | 22,649,518(0.02%)#780 |
| 10. | York | 3,924 | 300,632(1.31%)#10 | 22,649,518(0.02%)#809 |
| 11. | Scranton | 3,342 | 300,632(1.11%)#11 | 22,649,518(0.01%)#919 |
| 12. | Easton | 3,041 | 300,632(1.01%)#12 | 22,649,518(0.01%)#992 |
| 13. | Harrisburg | 1,964 | 300,632(0.65%)#13 | 22,649,518(0.01%)#1,364 |
| 14. | Chambersburg Borough | 1,876 | 300,632(0.62%)#14 | 22,649,518(0.01%)#1,414 |
| 15. | West Hazleton Borough | 1,617 | 300,632(0.54%)#15 | 22,649,518(0.01%)#1,546 |
| 16. | Lebanon | 1,511 | 300,632(0.50%)#16 | 22,649,518(0.01%)#1,610 |
| 17. | Levittown | 1,472 | 300,632(0.49%)#17 | 22,649,518(0.01%)#1,642 |
| 18. | Kennett Square Borough | 1,301 | 300,632(0.43%)#18 | 22,649,518(0.01%)#1,797 |
| 19. | Fullerton | 1,300 | 300,632(0.43%)#19 | 22,649,518(0.01%)#1,798 |
| 20. | Horsham | 1,229 | 300,632(0.41%)#20 | 22,649,518(0.01%)#1,876 |
| 21. | Erie | 1,056 | 300,632(0.35%)#21 | 22,649,518(0.00%)#2,060 |
| 22. | Coatesville | 999 | 300,632(0.33%)#22 | 22,649,518(0.00%)#2,144 |
| 23. | Hershey | 958 | 300,632(0.32%)#23 | 22,649,518(0.00%)#2,206 |
| 24. | Drexel Hill | 840 | 300,632(0.28%)#24 | 22,649,518(0.00%)#2,382 |
| 25. | Oxford Borough | 779 | 300,632(0.26%)#25 | 22,649,518(0.00%)#2,509 |
| 26. | Yeadon Borough | 765 | 300,632(0.25%)#26 | 22,649,518(0.00%)#2,537 |
| 27. | Hanover Borough | 712 | 300,632(0.24%)#27 | 22,649,518(0.00%)#2,654 |
| 28. | Pottstown Borough | 707 | 300,632(0.24%)#28 | 22,649,518(0.00%)#2,665 |
| 29. | Lansdale Borough | 670 | 300,632(0.22%)#29 | 22,649,518(0.00%)#2,752 |
| 30. | Wilson Borough | 608 | 300,632(0.20%)#30 | 22,649,518(0.00%)#2,906 |
| 31. | King Of Prussia | 606 | 300,632(0.20%)#31 | 22,649,518(0.00%)#2,909 |
| 32. | Souderton Borough | 598 | 300,632(0.20%)#32 | 22,649,518(0.00%)#2,935 |
| 33. | Avondale Borough | 582 | 300,632(0.19%)#33 | 22,649,518(0.00%)#2,994 |
| 34. | Collingdale Borough | 575 | 300,632(0.19%)#34 | 22,649,518(0.00%)#3,024 |
| 35. | Breinigsville | 558 | 300,632(0.19%)#35 | 22,649,518(0.00%)#3,072 |
| 36. | Roslyn | 544 | 300,632(0.18%)#36 | 22,649,518(0.00%)#3,119 |
| 37. | Hyde Park | 520 | 300,632(0.17%)#37 | 22,649,518(0.00%)#3,206 |
| 38. | Arlington Heights | 518 | 300,632(0.17%)#38 | 22,649,518(0.00%)#3,213 |
| 39. | Chester | 512 | 300,632(0.17%)#39 | 22,649,518(0.00%)#3,236 |
| 40. | Fountain Hill Borough | 500 | 300,632(0.17%)#40 | 22,649,518(0.00%)#3,278 |
| 41. | Quakertown Borough | 493 | 300,632(0.16%)#41 | 22,649,518(0.00%)#3,306 |
| 42. | Penn Estates | 471 | 300,632(0.16%)#42 | 22,649,518(0.00%)#3,403 |
| 43. | Laureldale Borough | 470 | 300,632(0.16%)#43 | 22,649,518(0.00%)#3,409 |
| 44. | Colonial Park | 457 | 300,632(0.15%)#44 | 22,649,518(0.00%)#3,445 |
| 45. | Toughkenamon | 433 | 300,632(0.14%)#45 | 22,649,518(0.00%)#3,569 |
| 46. | Phoenixville Borough | 409 | 300,632(0.14%)#46 | 22,649,518(0.00%)#3,685 |
| 47. | Saw Creek | 398 | 300,632(0.13%)#47 | 22,649,518(0.00%)#3,733 |
| 48. | Shillington Borough | 397 | 300,632(0.13%)#48 | 22,649,518(0.00%)#3,739 |
| 49. | Lansdowne Borough | 390 | 300,632(0.13%)#49 | 22,649,518(0.00%)#3,776 |
| 50. | Mcadoo Borough | 387 | 300,632(0.13%)#50 | 22,649,518(0.00%)#3,791 |
| 51. | Croydon | 380 | 300,632(0.13%)#51 | 22,649,518(0.00%)#3,826 |
| 52. | Pennside | 379 | 300,632(0.13%)#52 | 22,649,518(0.00%)#3,835 |
| 53. | West York Borough | 374 | 300,632(0.12%)#53 | 22,649,518(0.00%)#3,869 |
| 54. | West Chester Borough | 371 | 300,632(0.12%)#54 | 22,649,518(0.00%)#3,884 |
| 55. | Bressler | 358 | 300,632(0.12%)#55 | 22,649,518(0.00%)#3,964 |
| 56. | Darby Borough | 350 | 300,632(0.12%)#56 | 22,649,518(0.00%)#4,012 |
| 57. | Lincoln Park | 338 | 300,632(0.11%)#57 | 22,649,518(0.00%)#4,088 |
| 58. | Monroeville | 329 | 300,632(0.11%)#58 | 22,649,518(0.00%)#4,146 |
| 59. | Middletown | 323 | 300,632(0.11%)#59 | 22,649,518(0.00%)#4,184 |
| 60. | Dunmore Borough | 317 | 300,632(0.11%)#60 | 22,649,518(0.00%)#4,217 |
| 61. | Willow Grove | 312 | 300,632(0.10%)#61 | 22,649,518(0.00%)#4,245 |
| 62. | State College Borough | 311 | 300,632(0.10%)#62 | 22,649,518(0.00%)#4,250 |
| 63. | East Stroudsburg Borough | 310 | 300,632(0.10%)#63 | 22,649,518(0.00%)#4,263 |
| 64. | East York | 310 | 300,632(0.10%)#64 | 22,649,518(0.00%)#4,264 |
| 65. | Nanticoke | 307 | 300,632(0.10%)#65 | 22,649,518(0.00%)#4,280 |
| 66. | Queens Gate | 305 | 300,632(0.10%)#66 | 22,649,518(0.00%)#4,298 |
| 67. | West Grove Borough | 292 | 300,632(0.10%)#67 | 22,649,518(0.00%)#4,391 |
| 68. | Mount Joy Borough | 288 | 300,632(0.10%)#68 | 22,649,518(0.00%)#4,417 |
| 69. | Baldwin Borough | 284 | 300,632(0.09%)#69 | 22,649,518(0.00%)#4,447 |
| 70. | Carlisle Borough | 281 | 300,632(0.09%)#70 | 22,649,518(0.00%)#4,465 |
| 71. | Shenandoah Borough | 279 | 300,632(0.09%)#71 | 22,649,518(0.00%)#4,483 |
| 72. | Freeland Borough | 279 | 300,632(0.09%)#72 | 22,649,518(0.00%)#4,485 |
| 73. | Moosic Borough | 278 | 300,632(0.09%)#73 | 22,649,518(0.00%)#4,491 |
| 74. | Temple | 271 | 300,632(0.09%)#74 | 22,649,518(0.00%)#4,542 |
| 75. | Stroudsburg Borough | 268 | 300,632(0.09%)#75 | 22,649,518(0.00%)#4,570 |
| 76. | Mount Pocono Borough | 267 | 300,632(0.09%)#76 | 22,649,518(0.00%)#4,578 |
| 77. | Bridgeport Borough | 256 | 300,632(0.09%)#77 | 22,649,518(0.00%)#4,652 |
| 78. | Park Forest Village | 251 | 300,632(0.08%)#78 | 22,649,518(0.00%)#4,702 |
| 79. | Ephrata Borough | 246 | 300,632(0.08%)#79 | 22,649,518(0.00%)#4,732 |
| 80. | Ambler Borough | 243 | 300,632(0.08%)#80 | 22,649,518(0.00%)#4,765 |
| 81. | Freemansburg Borough | 243 | 300,632(0.08%)#81 | 22,649,518(0.00%)#4,769 |
| 82. | Wyomissing Borough | 242 | 300,632(0.08%)#82 | 22,649,518(0.00%)#4,772 |
| 83. | Tamaqua Borough | 242 | 300,632(0.08%)#83 | 22,649,518(0.00%)#4,775 |
| 84. | Ardmore | 241 | 300,632(0.08%)#84 | 22,649,518(0.00%)#4,784 |
| 85. | Columbia Borough | 241 | 300,632(0.08%)#85 | 22,649,518(0.00%)#4,786 |
| 86. | Williamsport | 240 | 300,632(0.08%)#86 | 22,649,518(0.00%)#4,795 |
| 87. | Elkins Park | 235 | 300,632(0.08%)#87 | 22,649,518(0.00%)#4,847 |
| 88. | Parkville | 234 | 300,632(0.08%)#88 | 22,649,518(0.00%)#4,855 |
| 89. | Sharon Hill Borough | 234 | 300,632(0.08%)#89 | 22,649,518(0.00%)#4,857 |
| 90. | Rutherford | 231 | 300,632(0.08%)#90 | 22,649,518(0.00%)#4,890 |
| 91. | Wayne | 230 | 300,632(0.08%)#91 | 22,649,518(0.00%)#4,905 |
| 92. | Milton Borough | 229 | 300,632(0.08%)#92 | 22,649,518(0.00%)#4,914 |
| 93. | Telford Borough | 228 | 300,632(0.08%)#93 | 22,649,518(0.00%)#4,923 |
| 94. | New Castle | 227 | 300,632(0.08%)#94 | 22,649,518(0.00%)#4,929 |
| 95. | Woodlyn | 226 | 300,632(0.08%)#95 | 22,649,518(0.00%)#4,938 |
| 96. | Lionville | 226 | 300,632(0.08%)#96 | 22,649,518(0.00%)#4,939 |
| 97. | Hatboro Borough | 224 | 300,632(0.07%)#97 | 22,649,518(0.00%)#4,961 |
| 98. | York Springs Borough | 222 | 300,632(0.07%)#98 | 22,649,518(0.00%)#4,987 |
| 99. | Blandon | 219 | 300,632(0.07%)#99 | 22,649,518(0.00%)#5,010 |
| 100. | Bryn Mawr | 218 | 300,632(0.07%)#100 | 22,649,518(0.00%)#5,022 |
Common Questions
What are the Top 10 Cities with the Most Immigrants from Latin America in Pennsylvania?
Top 10 Cities with the Most Immigrants from Latin America in Pennsylvania are:
#1
81,050
#2
19,647
#3
16,832
#4
9,962
#5
5,154
#6
4,345
#7
4,254
#8
4,112
#9
3,924
#10
3,342
What city has the Most Immigrants from Latin America in Pennsylvania?
Philadelphia has the Most Immigrants from Latin America in Pennsylvania with 81,050.
What is the Total Immigrants from Latin America in the State of Pennsylvania?
Total Immigrants from Latin America in Pennsylvania is 300,632.
What is the Total Immigrants from Latin America in the United States?
Total Immigrants from Latin America in the United States is 22,649,518.