Cities with the Largest Indian (Asian) Community in Pennsylvania
RELATED REPORTS & OPTIONS
Indian (Asian)
Pennsylvania
Compare Cities
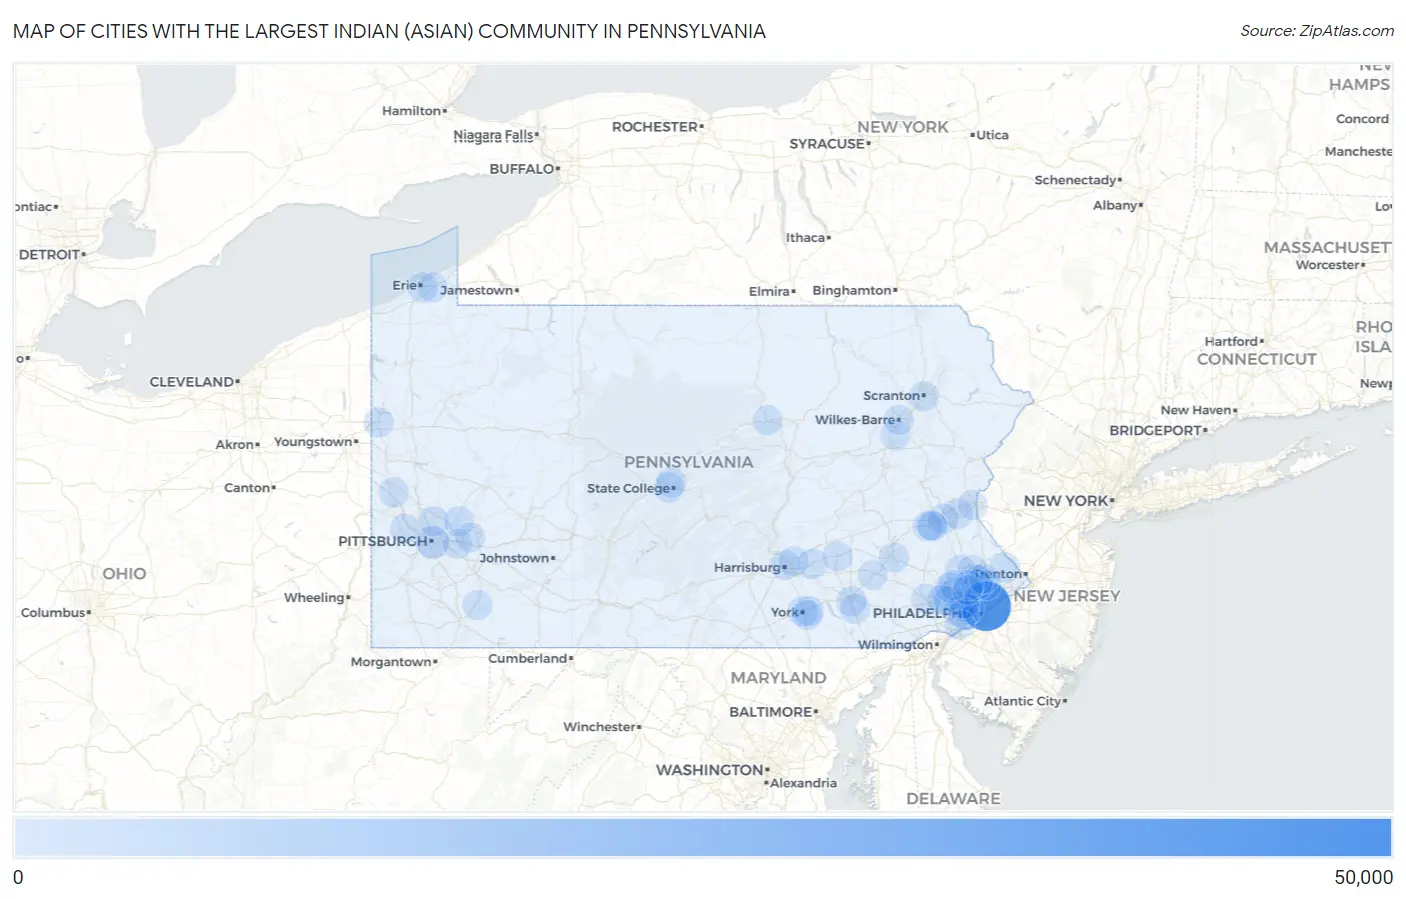
Map of Cities with the Largest Indian (Asian) Community in Pennsylvania
0
50,000
Cities with the Largest Indian (Asian) Community in Pennsylvania
| City | Indian (Asian) | vs State | vs National | |
| 1. | Philadelphia | 45,497 | 133,991(33.96%)#1 | 5,326,595(0.85%)#10 |
| 2. | Pittsburgh | 6,465 | 133,991(4.82%)#2 | 5,326,595(0.12%)#102 |
| 3. | State College Borough | 2,282 | 133,991(1.70%)#3 | 5,326,595(0.04%)#312 |
| 4. | King Of Prussia | 1,425 | 133,991(1.06%)#4 | 5,326,595(0.03%)#474 |
| 5. | Bethlehem | 1,095 | 133,991(0.82%)#5 | 5,326,595(0.02%)#606 |
| 6. | Franklin Park Borough | 787 | 133,991(0.59%)#6 | 5,326,595(0.01%)#759 |
| 7. | Lancaster | 603 | 133,991(0.45%)#7 | 5,326,595(0.01%)#945 |
| 8. | Park Forest Village | 572 | 133,991(0.43%)#8 | 5,326,595(0.01%)#991 |
| 9. | Chesterbrook | 552 | 133,991(0.41%)#9 | 5,326,595(0.01%)#1,011 |
| 10. | Allentown | 529 | 133,991(0.39%)#10 | 5,326,595(0.01%)#1,051 |
| 11. | Penn Wynne | 450 | 133,991(0.34%)#11 | 5,326,595(0.01%)#1,199 |
| 12. | Phoenixville Borough | 431 | 133,991(0.32%)#12 | 5,326,595(0.01%)#1,239 |
| 13. | Scranton | 424 | 133,991(0.32%)#13 | 5,326,595(0.01%)#1,246 |
| 14. | Kulpsville | 418 | 133,991(0.31%)#14 | 5,326,595(0.01%)#1,260 |
| 15. | Allison Park | 399 | 133,991(0.30%)#15 | 5,326,595(0.01%)#1,309 |
| 16. | Montgomeryville | 359 | 133,991(0.27%)#16 | 5,326,595(0.01%)#1,434 |
| 17. | Paoli | 355 | 133,991(0.26%)#17 | 5,326,595(0.01%)#1,445 |
| 18. | Lionville | 340 | 133,991(0.25%)#18 | 5,326,595(0.01%)#1,482 |
| 19. | Bala Cynwyd | 333 | 133,991(0.25%)#19 | 5,326,595(0.01%)#1,504 |
| 20. | Reading | 331 | 133,991(0.25%)#20 | 5,326,595(0.01%)#1,505 |
| 21. | Villanova | 329 | 133,991(0.25%)#21 | 5,326,595(0.01%)#1,513 |
| 22. | Broomall | 319 | 133,991(0.24%)#22 | 5,326,595(0.01%)#1,552 |
| 23. | Swarthmore Borough | 311 | 133,991(0.23%)#23 | 5,326,595(0.01%)#1,583 |
| 24. | Ardmore | 299 | 133,991(0.22%)#24 | 5,326,595(0.01%)#1,621 |
| 25. | Drexel Hill | 298 | 133,991(0.22%)#25 | 5,326,595(0.01%)#1,624 |
| 26. | Hershey | 295 | 133,991(0.22%)#26 | 5,326,595(0.01%)#1,637 |
| 27. | Spring House | 295 | 133,991(0.22%)#27 | 5,326,595(0.01%)#1,639 |
| 28. | Rosemont | 295 | 133,991(0.22%)#28 | 5,326,595(0.01%)#1,640 |
| 29. | St. Davids | 294 | 133,991(0.22%)#29 | 5,326,595(0.01%)#1,644 |
| 30. | Harrisburg | 286 | 133,991(0.21%)#30 | 5,326,595(0.01%)#1,682 |
| 31. | Willow Grove | 273 | 133,991(0.20%)#31 | 5,326,595(0.01%)#1,736 |
| 32. | Ashley Borough | 259 | 133,991(0.19%)#32 | 5,326,595(0.00%)#1,802 |
| 33. | Trooper | 252 | 133,991(0.19%)#33 | 5,326,595(0.00%)#1,841 |
| 34. | Newtown Grant | 247 | 133,991(0.18%)#34 | 5,326,595(0.00%)#1,867 |
| 35. | New Kensington | 243 | 133,991(0.18%)#35 | 5,326,595(0.00%)#1,893 |
| 36. | Maple Glen | 242 | 133,991(0.18%)#36 | 5,326,595(0.00%)#1,897 |
| 37. | Carnot Moon | 237 | 133,991(0.18%)#37 | 5,326,595(0.00%)#1,922 |
| 38. | Narberth Borough | 233 | 133,991(0.17%)#38 | 5,326,595(0.00%)#1,939 |
| 39. | Willow Street | 232 | 133,991(0.17%)#39 | 5,326,595(0.00%)#1,947 |
| 40. | Bryn Mawr | 216 | 133,991(0.16%)#40 | 5,326,595(0.00%)#2,032 |
| 41. | Berwyn | 211 | 133,991(0.16%)#41 | 5,326,595(0.00%)#2,061 |
| 42. | Morgan Hill | 211 | 133,991(0.16%)#42 | 5,326,595(0.00%)#2,062 |
| 43. | Murrysville | 208 | 133,991(0.16%)#43 | 5,326,595(0.00%)#2,076 |
| 44. | Jefferson Hills Borough | 198 | 133,991(0.15%)#44 | 5,326,595(0.00%)#2,139 |
| 45. | Aspinwall Borough | 194 | 133,991(0.14%)#45 | 5,326,595(0.00%)#2,166 |
| 46. | Breinigsville | 193 | 133,991(0.14%)#46 | 5,326,595(0.00%)#2,175 |
| 47. | Williamsport | 191 | 133,991(0.14%)#47 | 5,326,595(0.00%)#2,188 |
| 48. | Toftrees | 189 | 133,991(0.14%)#48 | 5,326,595(0.00%)#2,207 |
| 49. | York | 183 | 133,991(0.14%)#49 | 5,326,595(0.00%)#2,244 |
| 50. | Lansdale Borough | 180 | 133,991(0.13%)#50 | 5,326,595(0.00%)#2,278 |
| 51. | Fort Washington | 179 | 133,991(0.13%)#51 | 5,326,595(0.00%)#2,287 |
| 52. | Carlisle Borough | 176 | 133,991(0.13%)#52 | 5,326,595(0.00%)#2,309 |
| 53. | Eagleville Cdp Montgomery County | 172 | 133,991(0.13%)#53 | 5,326,595(0.00%)#2,342 |
| 54. | Fox Chapel Borough | 168 | 133,991(0.13%)#54 | 5,326,595(0.00%)#2,380 |
| 55. | Monroeville | 167 | 133,991(0.12%)#55 | 5,326,595(0.00%)#2,383 |
| 56. | Old Forge Borough | 163 | 133,991(0.12%)#56 | 5,326,595(0.00%)#2,429 |
| 57. | Connellsville | 163 | 133,991(0.12%)#57 | 5,326,595(0.00%)#2,430 |
| 58. | Wilson Borough | 161 | 133,991(0.12%)#58 | 5,326,595(0.00%)#2,451 |
| 59. | Audubon | 159 | 133,991(0.12%)#59 | 5,326,595(0.00%)#2,476 |
| 60. | Mountain Top | 151 | 133,991(0.11%)#60 | 5,326,595(0.00%)#2,552 |
| 61. | Northampton Borough | 151 | 133,991(0.11%)#61 | 5,326,595(0.00%)#2,554 |
| 62. | Trexlertown | 147 | 133,991(0.11%)#62 | 5,326,595(0.00%)#2,592 |
| 63. | Woodlyn | 146 | 133,991(0.11%)#63 | 5,326,595(0.00%)#2,598 |
| 64. | Morton Borough | 146 | 133,991(0.11%)#64 | 5,326,595(0.00%)#2,603 |
| 65. | Merion Station | 140 | 133,991(0.10%)#65 | 5,326,595(0.00%)#2,659 |
| 66. | Horsham | 139 | 133,991(0.10%)#66 | 5,326,595(0.00%)#2,662 |
| 67. | Lansdowne Borough | 139 | 133,991(0.10%)#67 | 5,326,595(0.00%)#2,665 |
| 68. | Penn Farms | 129 | 133,991(0.10%)#68 | 5,326,595(0.00%)#2,778 |
| 69. | Wayne | 128 | 133,991(0.10%)#69 | 5,326,595(0.00%)#2,792 |
| 70. | Roslyn | 127 | 133,991(0.09%)#70 | 5,326,595(0.00%)#2,802 |
| 71. | Blue Bell | 127 | 133,991(0.09%)#71 | 5,326,595(0.00%)#2,805 |
| 72. | Easton | 124 | 133,991(0.09%)#72 | 5,326,595(0.00%)#2,833 |
| 73. | East Stroudsburg Borough | 124 | 133,991(0.09%)#73 | 5,326,595(0.00%)#2,839 |
| 74. | Erie | 122 | 133,991(0.09%)#74 | 5,326,595(0.00%)#2,856 |
| 75. | East York | 122 | 133,991(0.09%)#75 | 5,326,595(0.00%)#2,870 |
| 76. | Plum Borough | 118 | 133,991(0.09%)#76 | 5,326,595(0.00%)#2,909 |
| 77. | Hermitage | 114 | 133,991(0.09%)#77 | 5,326,595(0.00%)#2,959 |
| 78. | Ancient Oaks | 113 | 133,991(0.08%)#78 | 5,326,595(0.00%)#2,982 |
| 79. | Millbourne Borough | 113 | 133,991(0.08%)#79 | 5,326,595(0.00%)#2,984 |
| 80. | Plymouth Meeting | 111 | 133,991(0.08%)#80 | 5,326,595(0.00%)#3,011 |
| 81. | Wilkes Barre | 108 | 133,991(0.08%)#81 | 5,326,595(0.00%)#3,037 |
| 82. | Chambersburg Borough | 108 | 133,991(0.08%)#82 | 5,326,595(0.00%)#3,038 |
| 83. | Red Lion Borough | 107 | 133,991(0.08%)#83 | 5,326,595(0.00%)#3,061 |
| 84. | Wesleyville Borough | 104 | 133,991(0.08%)#84 | 5,326,595(0.00%)#3,124 |
| 85. | Reamstown | 101 | 133,991(0.08%)#85 | 5,326,595(0.00%)#3,180 |
| 86. | Malvern Borough | 101 | 133,991(0.08%)#86 | 5,326,595(0.00%)#3,181 |
| 87. | Sharon Hill Borough | 99 | 133,991(0.07%)#87 | 5,326,595(0.00%)#3,215 |
| 88. | Doylestown Borough | 98 | 133,991(0.07%)#88 | 5,326,595(0.00%)#3,229 |
| 89. | Wilkinsburg Borough | 97 | 133,991(0.07%)#89 | 5,326,595(0.00%)#3,244 |
| 90. | Prospect Park Borough | 97 | 133,991(0.07%)#90 | 5,326,595(0.00%)#3,250 |
| 91. | Lebanon | 95 | 133,991(0.07%)#91 | 5,326,595(0.00%)#3,278 |
| 92. | Dunmore Borough | 93 | 133,991(0.07%)#92 | 5,326,595(0.00%)#3,308 |
| 93. | Millersville Borough | 93 | 133,991(0.07%)#93 | 5,326,595(0.00%)#3,315 |
| 94. | Sellersville Borough | 93 | 133,991(0.07%)#94 | 5,326,595(0.00%)#3,319 |
| 95. | Elizabethtown Borough | 92 | 133,991(0.07%)#95 | 5,326,595(0.00%)#3,333 |
| 96. | Wyomissing Borough | 92 | 133,991(0.07%)#96 | 5,326,595(0.00%)#3,334 |
| 97. | Queens Gate | 92 | 133,991(0.07%)#97 | 5,326,595(0.00%)#3,338 |
| 98. | Beaver Falls | 91 | 133,991(0.07%)#98 | 5,326,595(0.00%)#3,353 |
| 99. | Penn State Erie Behrend | 91 | 133,991(0.07%)#99 | 5,326,595(0.00%)#3,357 |
| 100. | Colonial Park | 88 | 133,991(0.07%)#100 | 5,326,595(0.00%)#3,393 |
Common Questions
What are the Top 10 Cities with the Largest Indian (Asian) Community in Pennsylvania?
Top 10 Cities with the Largest Indian (Asian) Community in Pennsylvania are:
#1
45,497
#2
6,465
#3
1,425
#4
1,095
#5
603
#6
572
#7
552
#8
529
#9
450
#10
424
What city has the Largest Indian (Asian) Community in Pennsylvania?
Philadelphia has the Largest Indian (Asian) Community in Pennsylvania with 45,497.
What is the Total Indian (Asian) Population in the State of Pennsylvania?
Total Indian (Asian) Population in Pennsylvania is 133,991.
What is the Total Indian (Asian) Population in the United States?
Total Indian (Asian) Population in the United States is 5,326,595.