Bloomsburg, PA Map & Demographics
Bloomsburg Map
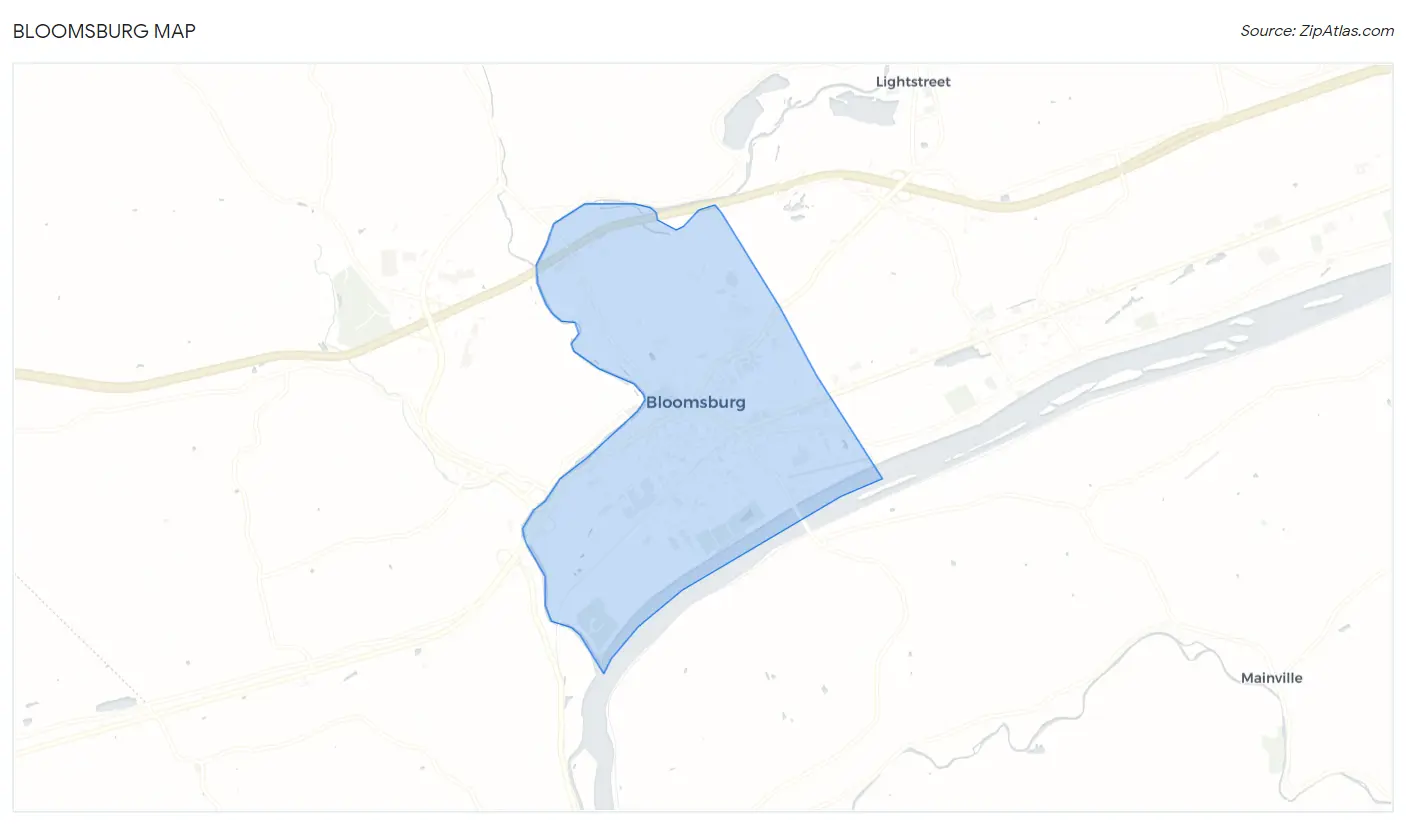
Bloomsburg Overview
$21,313
PER CAPITA INCOME
$70,775
AVG FAMILY INCOME
$46,019
AVG HOUSEHOLD INCOME
44.0%
WAGE / INCOME GAP [ % ]
56.0¢/ $1
WAGE / INCOME GAP [ $ ]
0.50
INEQUALITY / GINI INDEX
12,836
TOTAL POPULATION
5,869
MALE POPULATION
6,967
FEMALE POPULATION
84.24
MALES / 100 FEMALES
118.71
FEMALES / 100 MALES
23.1
MEDIAN AGE
3.0
AVG FAMILY SIZE
2.2
AVG HOUSEHOLD SIZE
5,679
LABOR FORCE [ PEOPLE ]
49.3%
PERCENT IN LABOR FORCE
5.4%
UNEMPLOYMENT RATE
Bloomsburg Zip Codes
Bloomsburg Area Codes
Income in Bloomsburg
Income Overview in Bloomsburg
Per Capita Income in Bloomsburg is $21,313, while median incomes of families and households are $70,775 and $46,019 respectively.
| Characteristic | Number | Measure |
| Per Capita Income | 12,836 | $21,313 |
| Median Family Income | 1,690 | $70,775 |
| Mean Family Income | 1,690 | $82,502 |
| Median Household Income | 4,191 | $46,019 |
| Mean Household Income | 4,191 | $60,772 |
| Income Deficit | 1,690 | $0 |
| Wage / Income Gap (%) | 12,836 | 44.00% |
| Wage / Income Gap ($) | 12,836 | 56.00¢ per $1 |
| Gini / Inequality Index | 12,836 | 0.50 |
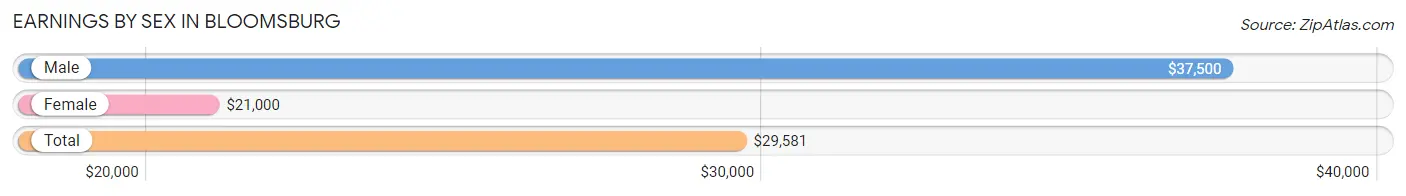
Earnings by Sex in Bloomsburg
Average Earnings in Bloomsburg are $29,581, $37,500 for men and $21,000 for women, a difference of 44.0%.
| Sex | Number | Average Earnings |
| Male | 2,464 (41.1%) | $37,500 |
| Female | 3,536 (58.9%) | $21,000 |
| Total | 6,000 (100.0%) | $29,581 |
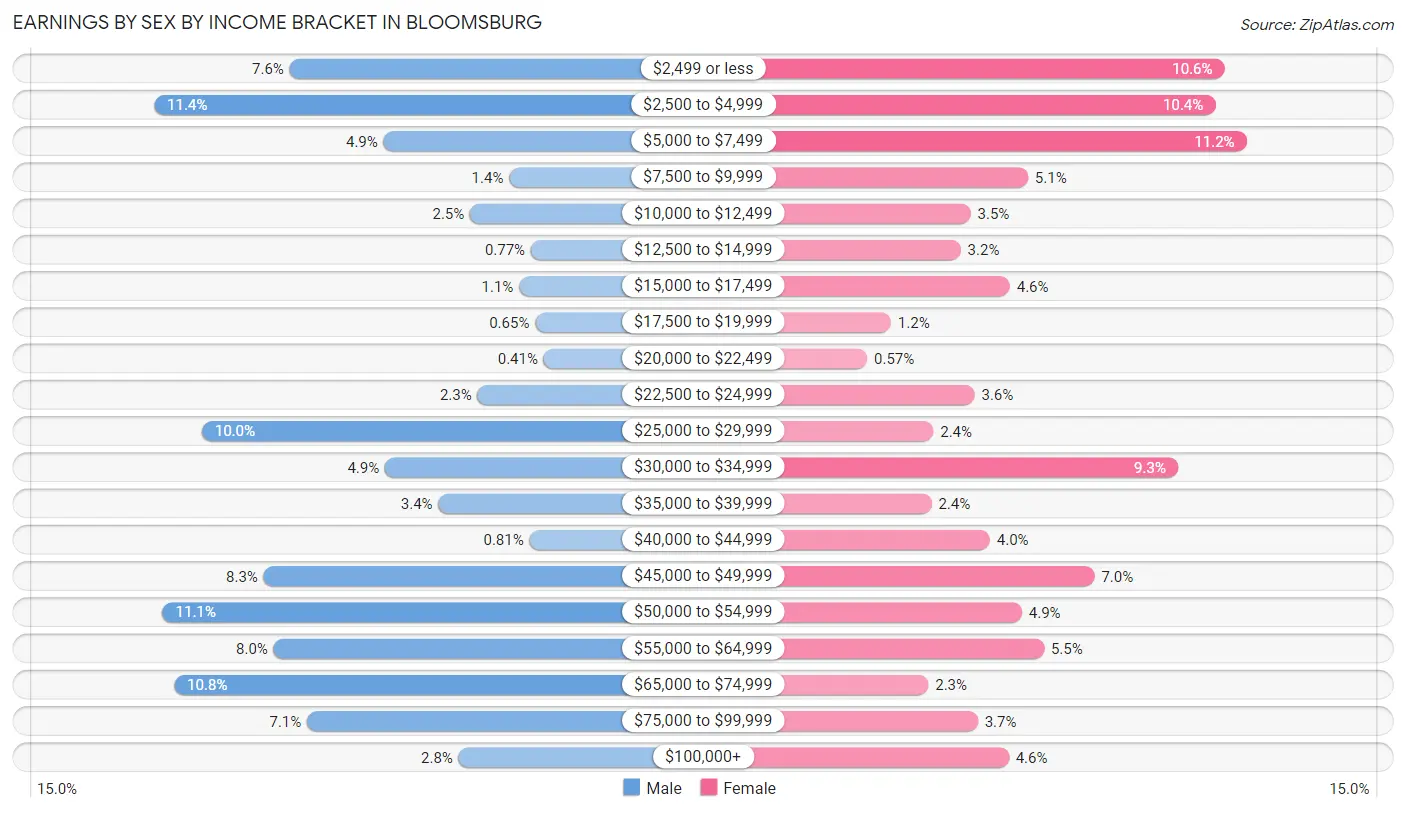
Earnings by Sex by Income Bracket in Bloomsburg
The most common earnings brackets in Bloomsburg are $2,500 to $4,999 for men (280 | 11.4%) and $5,000 to $7,499 for women (397 | 11.2%).
| Income | Male | Female |
| $2,499 or less | 186 (7.5%) | 375 (10.6%) |
| $2,500 to $4,999 | 280 (11.4%) | 366 (10.3%) |
| $5,000 to $7,499 | 121 (4.9%) | 397 (11.2%) |
| $7,500 to $9,999 | 34 (1.4%) | 180 (5.1%) |
| $10,000 to $12,499 | 61 (2.5%) | 123 (3.5%) |
| $12,500 to $14,999 | 19 (0.8%) | 113 (3.2%) |
| $15,000 to $17,499 | 27 (1.1%) | 162 (4.6%) |
| $17,500 to $19,999 | 16 (0.6%) | 44 (1.2%) |
| $20,000 to $22,499 | 10 (0.4%) | 20 (0.6%) |
| $22,500 to $24,999 | 56 (2.3%) | 127 (3.6%) |
| $25,000 to $29,999 | 247 (10.0%) | 86 (2.4%) |
| $30,000 to $34,999 | 120 (4.9%) | 329 (9.3%) |
| $35,000 to $39,999 | 83 (3.4%) | 84 (2.4%) |
| $40,000 to $44,999 | 20 (0.8%) | 142 (4.0%) |
| $45,000 to $49,999 | 204 (8.3%) | 246 (7.0%) |
| $50,000 to $54,999 | 274 (11.1%) | 174 (4.9%) |
| $55,000 to $64,999 | 197 (8.0%) | 196 (5.5%) |
| $65,000 to $74,999 | 266 (10.8%) | 81 (2.3%) |
| $75,000 to $99,999 | 174 (7.1%) | 130 (3.7%) |
| $100,000+ | 69 (2.8%) | 161 (4.5%) |
| Total | 2,464 (100.0%) | 3,536 (100.0%) |
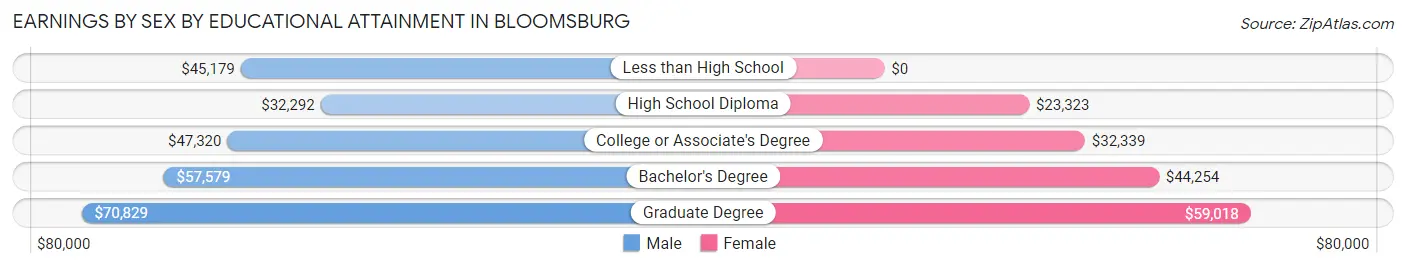
Earnings by Sex by Educational Attainment in Bloomsburg
Average earnings in Bloomsburg are $51,522 for men and $34,450 for women, a difference of 33.1%. Men with an educational attainment of graduate degree enjoy the highest average annual earnings of $70,829, while those with high school diploma education earn the least with $32,292. Women with an educational attainment of graduate degree earn the most with the average annual earnings of $59,018, while those with high school diploma education have the smallest earnings of $23,323.
| Educational Attainment | Male Income | Female Income |
| Less than High School | $45,179 | $0 |
| High School Diploma | $32,292 | $23,323 |
| College or Associate's Degree | $47,320 | $32,339 |
| Bachelor's Degree | $57,579 | $44,254 |
| Graduate Degree | $70,829 | $59,018 |
| Total | $51,522 | $34,450 |
Family Income in Bloomsburg
Family Income Brackets in Bloomsburg
According to the Bloomsburg family income data, there are 352 families falling into the $50,000 to $74,999 income range, which is the most common income bracket and makes up 20.8% of all families. Conversely, the $10,000 to $14,999 income bracket is the least frequent group with only 34 families (2.0%) belonging to this category.
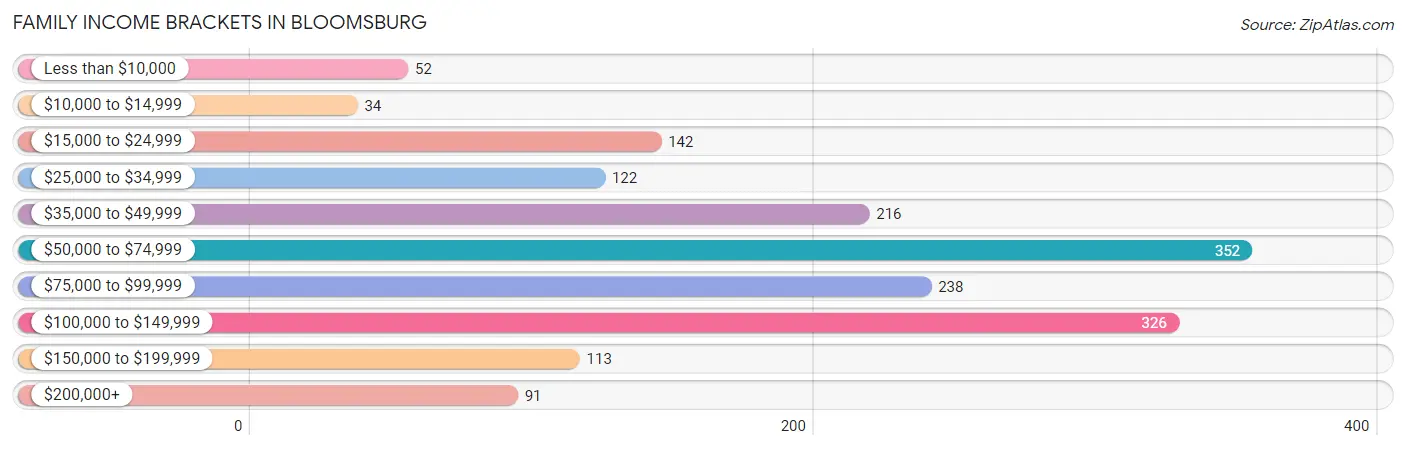
| Income Bracket | # Families | % Families |
| Less than $10,000 | 52 | 3.1% |
| $10,000 to $14,999 | 34 | 2.0% |
| $15,000 to $24,999 | 142 | 8.4% |
| $25,000 to $34,999 | 122 | 7.2% |
| $35,000 to $49,999 | 216 | 12.8% |
| $50,000 to $74,999 | 352 | 20.8% |
| $75,000 to $99,999 | 238 | 14.1% |
| $100,000 to $149,999 | 326 | 19.3% |
| $150,000 to $199,999 | 113 | 6.7% |
| $200,000+ | 91 | 5.4% |
Family Income by Famaliy Size in Bloomsburg
3-person families (382 | 22.6%) account for the highest median family income in Bloomsburg with $84,904 per family, while 2-person families (737 | 43.6%) have the highest median income of $34,930 per family member.
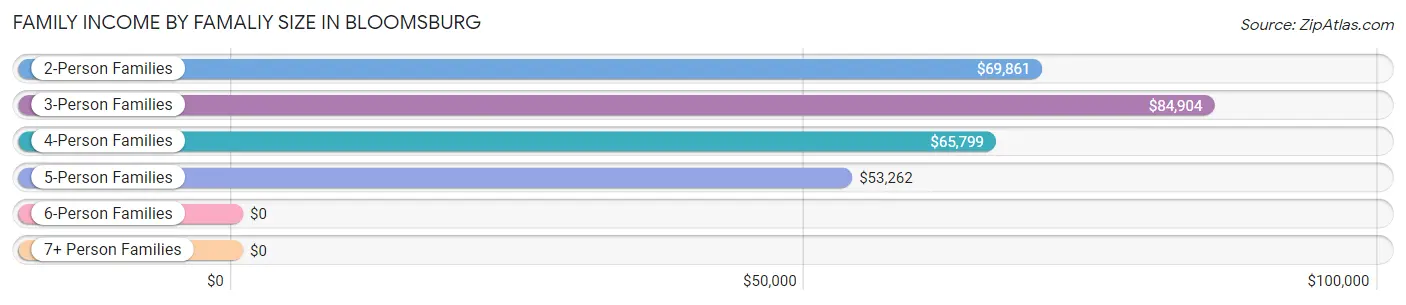
| Income Bracket | # Families | Median Income |
| 2-Person Families | 737 (43.6%) | $69,861 |
| 3-Person Families | 382 (22.6%) | $84,904 |
| 4-Person Families | 349 (20.6%) | $65,799 |
| 5-Person Families | 202 (11.9%) | $53,262 |
| 6-Person Families | 20 (1.2%) | $0 |
| 7+ Person Families | 0 (0.0%) | $0 |
| Total | 1,690 (100.0%) | $70,775 |
Family Income by Number of Earners in Bloomsburg
The median family income in Bloomsburg is $70,775, with families comprising 3+ earners (136) having the highest median family income of $119,000, while families with no earners (266) have the lowest median family income of $41,818, accounting for 8.1% and 15.7% of families, respectively.
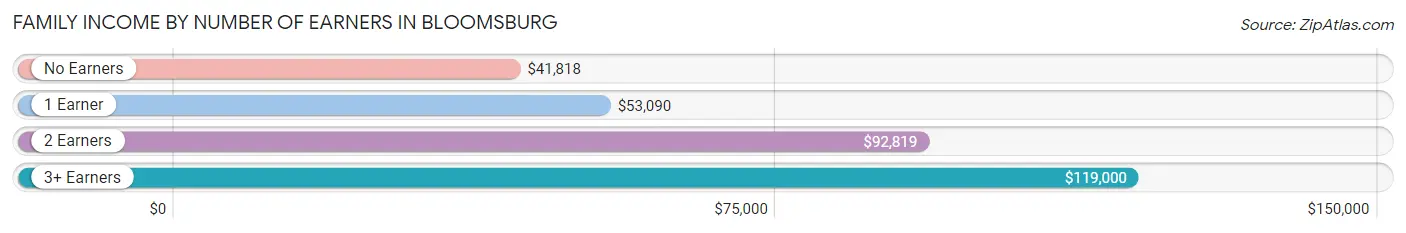
| Number of Earners | # Families | Median Income |
| No Earners | 266 (15.7%) | $41,818 |
| 1 Earner | 556 (32.9%) | $53,090 |
| 2 Earners | 732 (43.3%) | $92,819 |
| 3+ Earners | 136 (8.1%) | $119,000 |
| Total | 1,690 (100.0%) | $70,775 |
Household Income in Bloomsburg
Household Income Brackets in Bloomsburg
With 742 households falling in the category, the $50,000 to $74,999 income range is the most frequent in Bloomsburg, accounting for 17.7% of all households. In contrast, only 117 households (2.8%) fall into the $200,000+ income bracket, making it the least populous group.
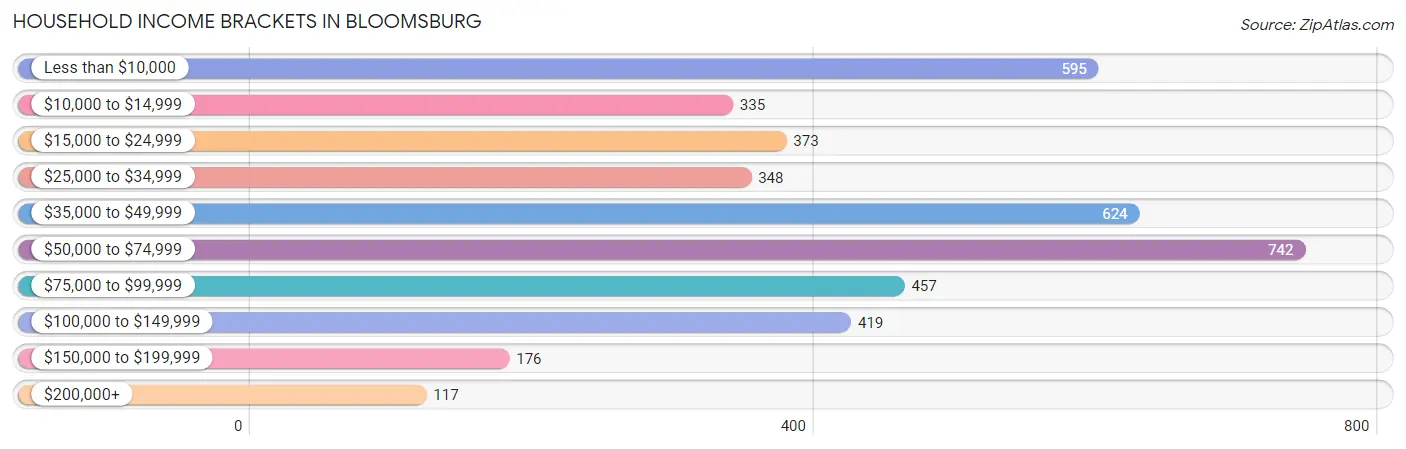
| Income Bracket | # Households | % Households |
| Less than $10,000 | 595 | 14.2% |
| $10,000 to $14,999 | 335 | 8.0% |
| $15,000 to $24,999 | 373 | 8.9% |
| $25,000 to $34,999 | 348 | 8.3% |
| $35,000 to $49,999 | 624 | 14.9% |
| $50,000 to $74,999 | 742 | 17.7% |
| $75,000 to $99,999 | 457 | 10.9% |
| $100,000 to $149,999 | 419 | 10.0% |
| $150,000 to $199,999 | 176 | 4.2% |
| $200,000+ | 117 | 2.8% |
Household Income by Householder Age in Bloomsburg
The median household income in Bloomsburg is $46,019, with the highest median household income of $71,442 found in the 45 to 64 years age bracket for the primary householder. A total of 1,112 households (26.5%) fall into this category. Meanwhile, the 15 to 24 years age bracket for the primary householder has the lowest median household income of $11,671, with 843 households (20.1%) in this group.
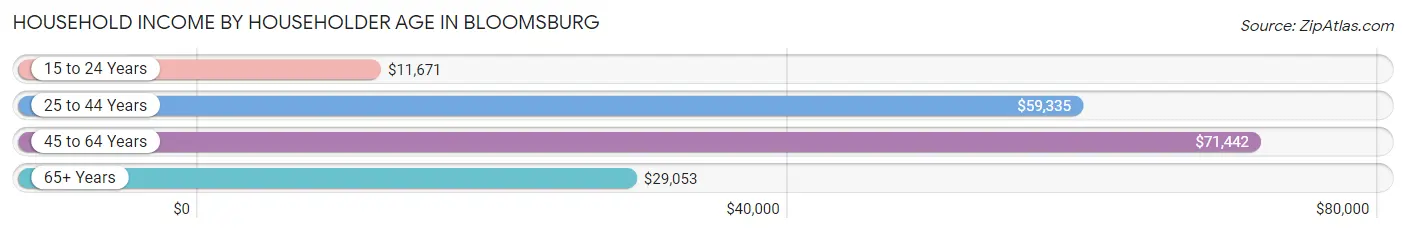
| Income Bracket | # Households | Median Income |
| 15 to 24 Years | 843 (20.1%) | $11,671 |
| 25 to 44 Years | 1,285 (30.7%) | $59,335 |
| 45 to 64 Years | 1,112 (26.5%) | $71,442 |
| 65+ Years | 951 (22.7%) | $29,053 |
| Total | 4,191 (100.0%) | $46,019 |
Poverty in Bloomsburg
Income Below Poverty by Sex and Age in Bloomsburg
With 31.1% poverty level for males and 32.7% for females among the residents of Bloomsburg, 18 to 24 year old males and 16 and 17 year old females are the most vulnerable to poverty, with 730 males (74.9%) and 49 females (80.3%) in their respective age groups living below the poverty level.
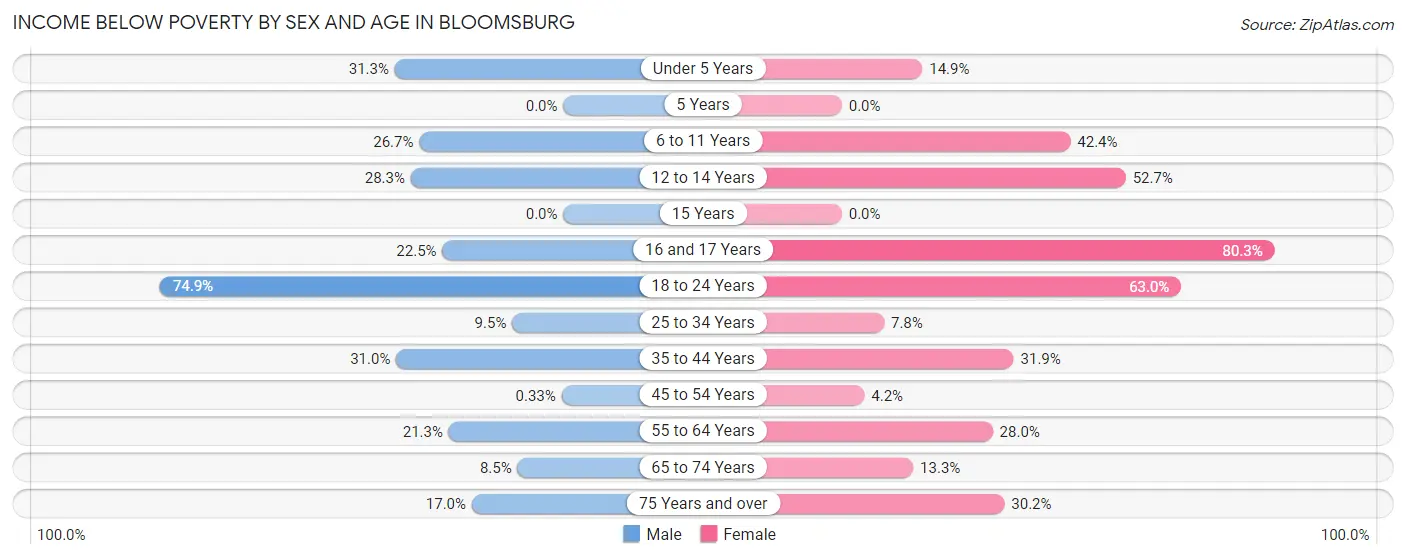
| Age Bracket | Male | Female |
| Under 5 Years | 61 (31.3%) | 46 (14.9%) |
| 5 Years | 0 (0.0%) | 0 (0.0%) |
| 6 to 11 Years | 69 (26.7%) | 98 (42.4%) |
| 12 to 14 Years | 49 (28.3%) | 39 (52.7%) |
| 15 Years | 0 (0.0%) | 0 (0.0%) |
| 16 and 17 Years | 33 (22.5%) | 49 (80.3%) |
| 18 to 24 Years | 730 (74.9%) | 829 (63.0%) |
| 25 to 34 Years | 70 (9.5%) | 42 (7.8%) |
| 35 to 44 Years | 165 (31.0%) | 192 (31.9%) |
| 45 to 54 Years | 1 (0.3%) | 19 (4.2%) |
| 55 to 64 Years | 81 (21.3%) | 154 (28.0%) |
| 65 to 74 Years | 29 (8.5%) | 60 (13.3%) |
| 75 Years and over | 36 (17.0%) | 124 (30.2%) |
| Total | 1,324 (31.1%) | 1,652 (32.7%) |
Income Above Poverty by Sex and Age in Bloomsburg
According to the poverty statistics in Bloomsburg, males aged 5 years and females aged 5 years are the age groups that are most secure financially, with 100.0% of males and 100.0% of females in these age groups living above the poverty line.
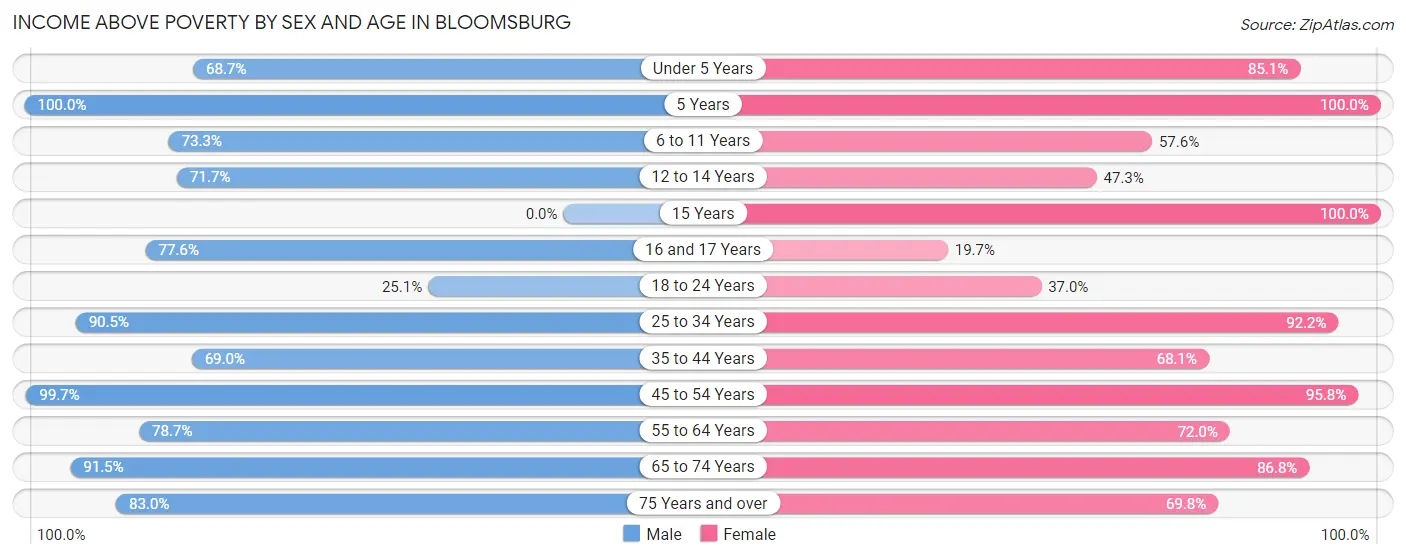
| Age Bracket | Male | Female |
| Under 5 Years | 134 (68.7%) | 262 (85.1%) |
| 5 Years | 4 (100.0%) | 32 (100.0%) |
| 6 to 11 Years | 189 (73.3%) | 133 (57.6%) |
| 12 to 14 Years | 124 (71.7%) | 35 (47.3%) |
| 15 Years | 0 (0.0%) | 20 (100.0%) |
| 16 and 17 Years | 114 (77.5%) | 12 (19.7%) |
| 18 to 24 Years | 245 (25.1%) | 487 (37.0%) |
| 25 to 34 Years | 668 (90.5%) | 494 (92.2%) |
| 35 to 44 Years | 367 (69.0%) | 410 (68.1%) |
| 45 to 54 Years | 303 (99.7%) | 434 (95.8%) |
| 55 to 64 Years | 300 (78.7%) | 396 (72.0%) |
| 65 to 74 Years | 312 (91.5%) | 393 (86.8%) |
| 75 Years and over | 176 (83.0%) | 287 (69.8%) |
| Total | 2,936 (68.9%) | 3,395 (67.3%) |
Income Below Poverty Among Married-Couple Families in Bloomsburg
The poverty statistics for married-couple families in Bloomsburg show that 5.5% or 51 of the total 931 families live below the poverty line. Families with 1 or 2 children have the highest poverty rate of 10.0%, comprising of 39 families. On the other hand, families with 3 or 4 children have the lowest poverty rate of 0.0%, which includes 0 families.
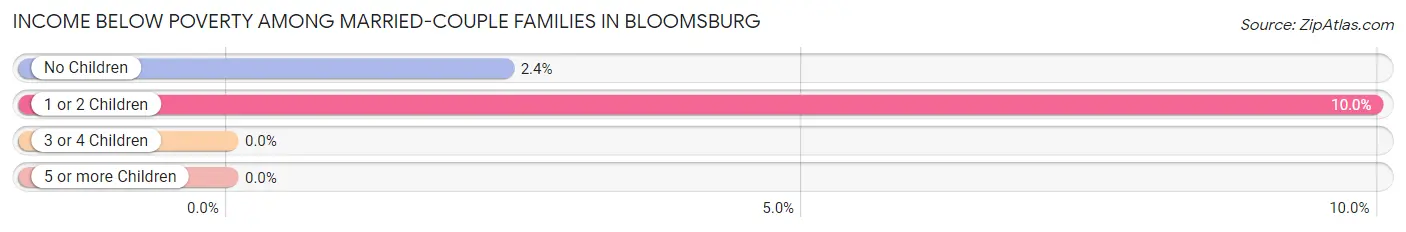
| Children | Above Poverty | Below Poverty |
| No Children | 489 (97.6%) | 12 (2.4%) |
| 1 or 2 Children | 352 (90.0%) | 39 (10.0%) |
| 3 or 4 Children | 39 (100.0%) | 0 (0.0%) |
| 5 or more Children | 0 (0.0%) | 0 (0.0%) |
| Total | 880 (94.5%) | 51 (5.5%) |
Income Below Poverty Among Single-Parent Households in Bloomsburg
According to the poverty data in Bloomsburg, 3.6% or 10 single-father households and 41.3% or 200 single-mother households are living below the poverty line. Among single-father households, those with no children have the highest poverty rate, with 10 households (8.1%) experiencing poverty. Likewise, among single-mother households, those with 3 or 4 children have the highest poverty rate, with 96 households (85.7%) falling below the poverty line.
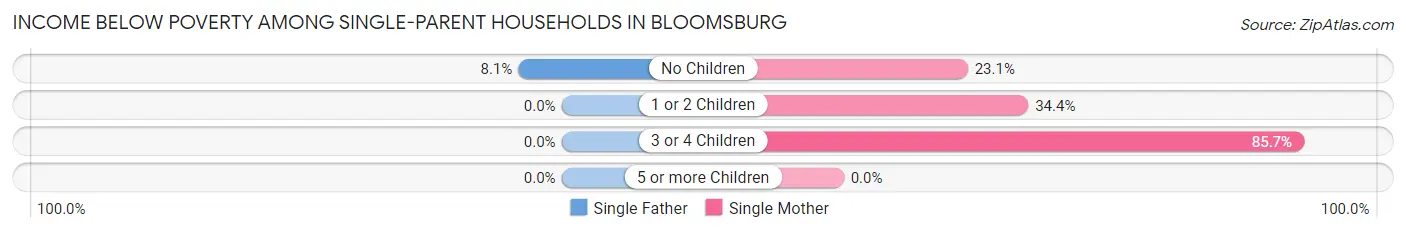
| Children | Single Father | Single Mother |
| No Children | 10 (8.1%) | 49 (23.1%) |
| 1 or 2 Children | 0 (0.0%) | 55 (34.4%) |
| 3 or 4 Children | 0 (0.0%) | 96 (85.7%) |
| 5 or more Children | 0 (0.0%) | 0 (0.0%) |
| Total | 10 (3.6%) | 200 (41.3%) |
Income Below Poverty Among Married-Couple vs Single-Parent Households in Bloomsburg
The poverty data for Bloomsburg shows that 51 of the married-couple family households (5.5%) and 210 of the single-parent households (27.7%) are living below the poverty level. Within the married-couple family households, those with 1 or 2 children have the highest poverty rate, with 39 households (10.0%) falling below the poverty line. Among the single-parent households, those with 3 or 4 children have the highest poverty rate, with 96 household (48.5%) living below poverty.
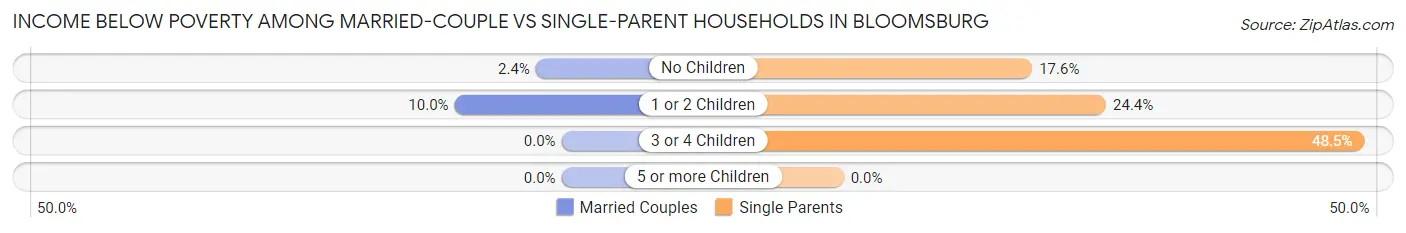
| Children | Married-Couple Families | Single-Parent Households |
| No Children | 12 (2.4%) | 59 (17.6%) |
| 1 or 2 Children | 39 (10.0%) | 55 (24.4%) |
| 3 or 4 Children | 0 (0.0%) | 96 (48.5%) |
| 5 or more Children | 0 (0.0%) | 0 (0.0%) |
| Total | 51 (5.5%) | 210 (27.7%) |
Race in Bloomsburg
The most populous races in Bloomsburg are White / Caucasian (11,141 | 86.8%), Hispanic or Latino (1,053 | 8.2%), and Two or more Races (629 | 4.9%).
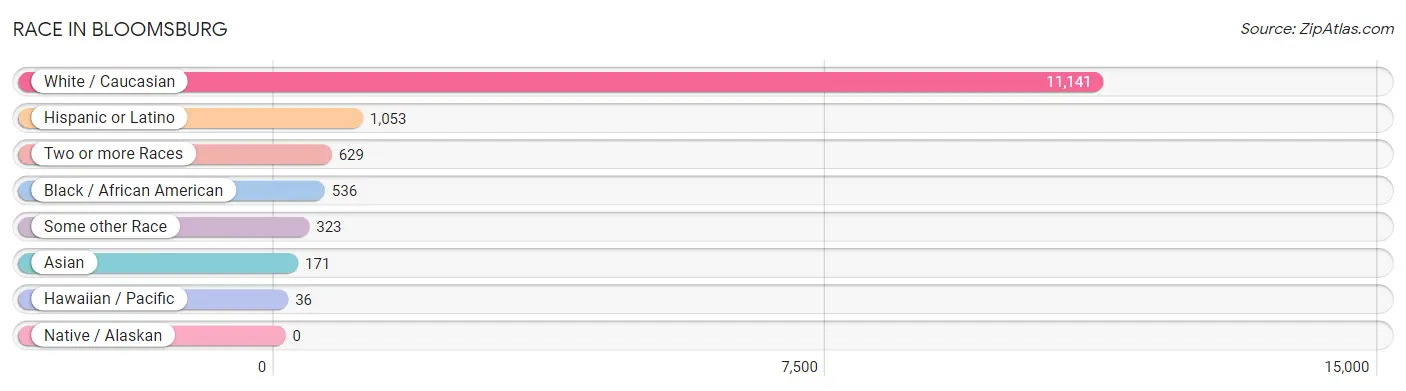
| Race | # Population | % Population |
| Asian | 171 | 1.3% |
| Black / African American | 536 | 4.2% |
| Hawaiian / Pacific | 36 | 0.3% |
| Hispanic or Latino | 1,053 | 8.2% |
| Native / Alaskan | 0 | 0.0% |
| White / Caucasian | 11,141 | 86.8% |
| Two or more Races | 629 | 4.9% |
| Some other Race | 323 | 2.5% |
| Total | 12,836 | 100.0% |
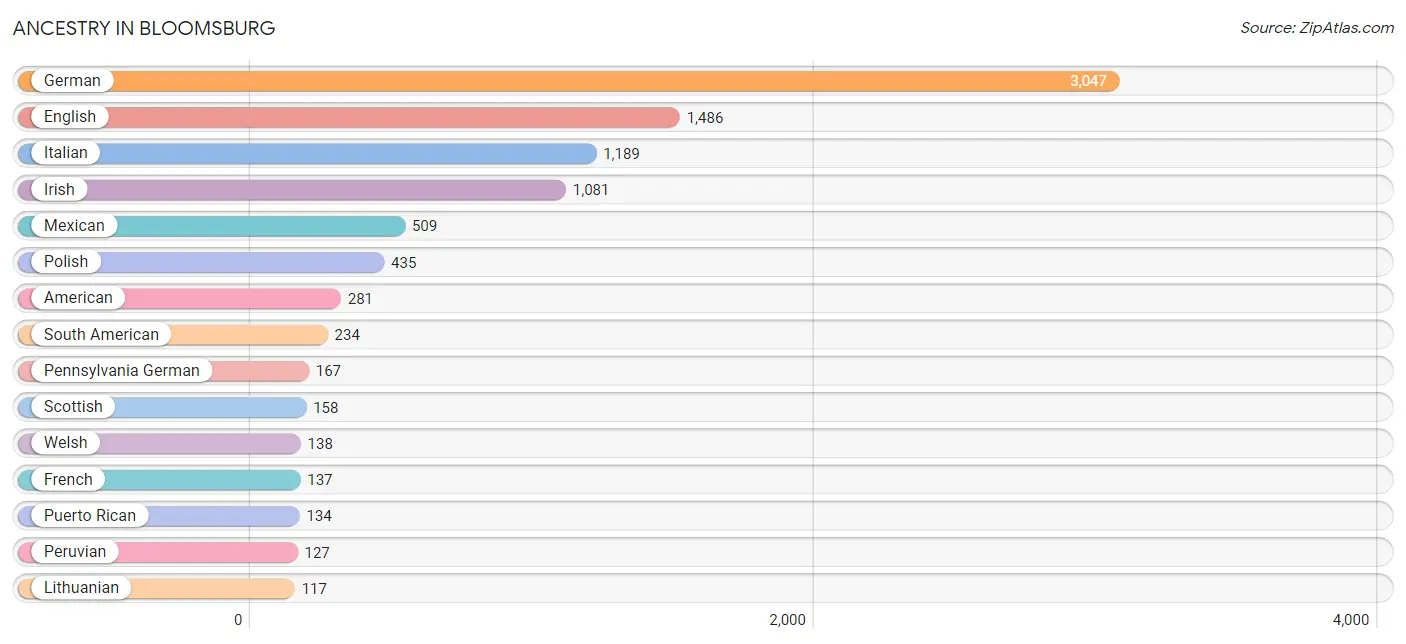
Ancestry in Bloomsburg
The most populous ancestries reported in Bloomsburg are German (3,047 | 23.7%), English (1,486 | 11.6%), Italian (1,189 | 9.3%), Irish (1,081 | 8.4%), and Mexican (509 | 4.0%), together accounting for 57.0% of all Bloomsburg residents.
| Ancestry | # Population | % Population |
| African | 49 | 0.4% |
| Albanian | 5 | 0.0% |
| Alsatian | 7 | 0.1% |
| American | 281 | 2.2% |
| Arab | 72 | 0.6% |
| Argentinean | 10 | 0.1% |
| British | 48 | 0.4% |
| Burmese | 12 | 0.1% |
| Croatian | 7 | 0.1% |
| Cuban | 10 | 0.1% |
| Czech | 20 | 0.2% |
| Dominican | 73 | 0.6% |
| Dutch | 73 | 0.6% |
| Ecuadorian | 97 | 0.8% |
| Egyptian | 53 | 0.4% |
| English | 1,486 | 11.6% |
| European | 57 | 0.4% |
| French | 137 | 1.1% |
| German | 3,047 | 23.7% |
| Greek | 6 | 0.1% |
| Guyanese | 3 | 0.0% |
| Haitian | 7 | 0.1% |
| Hungarian | 44 | 0.3% |
| Indian (Asian) | 35 | 0.3% |
| Irish | 1,081 | 8.4% |
| Italian | 1,189 | 9.3% |
| Jamaican | 6 | 0.1% |
| Korean | 30 | 0.2% |
| Laotian | 21 | 0.2% |
| Lebanese | 10 | 0.1% |
| Lithuanian | 117 | 0.9% |
| Maltese | 17 | 0.1% |
| Mexican | 509 | 4.0% |
| Native Hawaiian | 36 | 0.3% |
| Northern European | 16 | 0.1% |
| Norwegian | 105 | 0.8% |
| Pennsylvania German | 167 | 1.3% |
| Peruvian | 127 | 1.0% |
| Polish | 435 | 3.4% |
| Portuguese | 34 | 0.3% |
| Puerto Rican | 134 | 1.0% |
| Russian | 15 | 0.1% |
| Scotch-Irish | 25 | 0.2% |
| Scottish | 158 | 1.2% |
| Slavic | 15 | 0.1% |
| Slovak | 40 | 0.3% |
| Slovene | 31 | 0.2% |
| South American | 234 | 1.8% |
| South American Indian | 100 | 0.8% |
| Spaniard | 19 | 0.2% |
| Sri Lankan | 13 | 0.1% |
| Subsaharan African | 49 | 0.4% |
| Swedish | 32 | 0.3% |
| Swiss | 44 | 0.3% |
| Ukrainian | 21 | 0.2% |
| Welsh | 138 | 1.1% | View All 56 Rows |
Immigrants in Bloomsburg
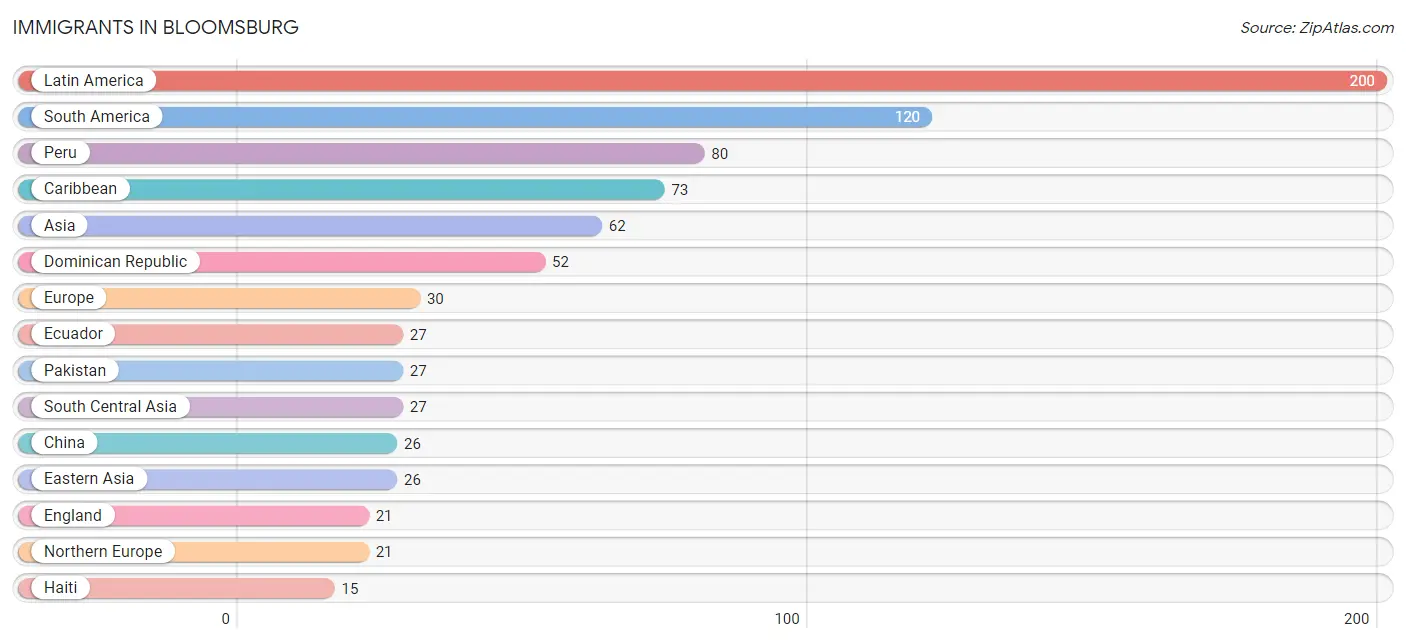
The most numerous immigrant groups reported in Bloomsburg came from Latin America (200 | 1.6%), South America (120 | 0.9%), Peru (80 | 0.6%), Caribbean (73 | 0.6%), and Asia (62 | 0.5%), together accounting for 4.2% of all Bloomsburg residents.
| Immigration Origin | # Population | % Population |
| Africa | 10 | 0.1% |
| Argentina | 10 | 0.1% |
| Asia | 62 | 0.5% |
| Caribbean | 73 | 0.6% |
| Central America | 7 | 0.1% |
| China | 26 | 0.2% |
| Dominican Republic | 52 | 0.4% |
| Eastern Asia | 26 | 0.2% |
| Ecuador | 27 | 0.2% |
| Egypt | 10 | 0.1% |
| England | 21 | 0.2% |
| Europe | 30 | 0.2% |
| France | 9 | 0.1% |
| Guyana | 3 | 0.0% |
| Haiti | 15 | 0.1% |
| Jamaica | 6 | 0.1% |
| Latin America | 200 | 1.6% |
| Mexico | 7 | 0.1% |
| Northern Africa | 10 | 0.1% |
| Northern Europe | 21 | 0.2% |
| Pakistan | 27 | 0.2% |
| Peru | 80 | 0.6% |
| South America | 120 | 0.9% |
| South Central Asia | 27 | 0.2% |
| Syria | 9 | 0.1% |
| Western Asia | 9 | 0.1% |
| Western Europe | 9 | 0.1% | View All 27 Rows |
Sex and Age in Bloomsburg
Sex and Age in Bloomsburg
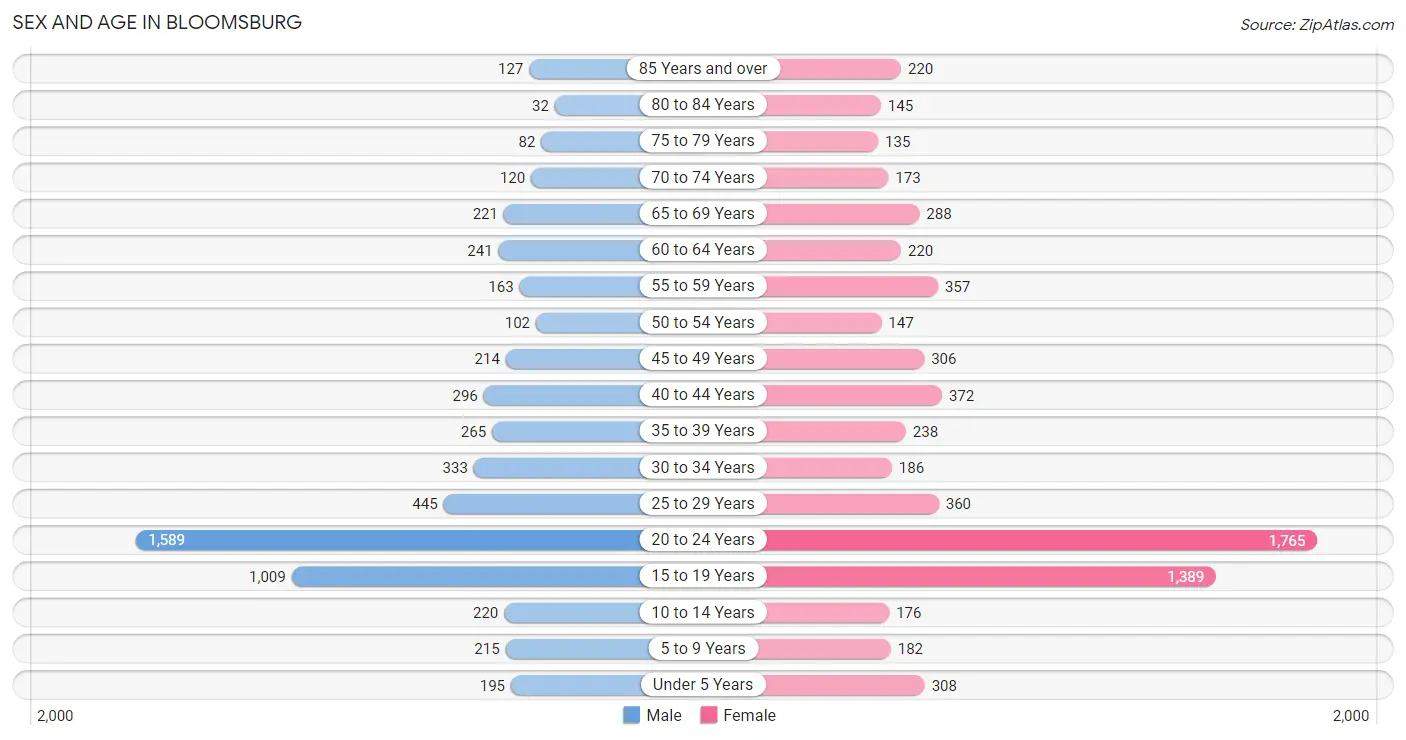
The most populous age groups in Bloomsburg are 20 to 24 Years (1,589 | 27.1%) for men and 20 to 24 Years (1,765 | 25.3%) for women.
| Age Bracket | Male | Female |
| Under 5 Years | 195 (3.3%) | 308 (4.4%) |
| 5 to 9 Years | 215 (3.7%) | 182 (2.6%) |
| 10 to 14 Years | 220 (3.7%) | 176 (2.5%) |
| 15 to 19 Years | 1,009 (17.2%) | 1,389 (19.9%) |
| 20 to 24 Years | 1,589 (27.1%) | 1,765 (25.3%) |
| 25 to 29 Years | 445 (7.6%) | 360 (5.2%) |
| 30 to 34 Years | 333 (5.7%) | 186 (2.7%) |
| 35 to 39 Years | 265 (4.5%) | 238 (3.4%) |
| 40 to 44 Years | 296 (5.0%) | 372 (5.3%) |
| 45 to 49 Years | 214 (3.6%) | 306 (4.4%) |
| 50 to 54 Years | 102 (1.7%) | 147 (2.1%) |
| 55 to 59 Years | 163 (2.8%) | 357 (5.1%) |
| 60 to 64 Years | 241 (4.1%) | 220 (3.2%) |
| 65 to 69 Years | 221 (3.8%) | 288 (4.1%) |
| 70 to 74 Years | 120 (2.0%) | 173 (2.5%) |
| 75 to 79 Years | 82 (1.4%) | 135 (1.9%) |
| 80 to 84 Years | 32 (0.5%) | 145 (2.1%) |
| 85 Years and over | 127 (2.2%) | 220 (3.2%) |
| Total | 5,869 (100.0%) | 6,967 (100.0%) |
Families and Households in Bloomsburg
Median Family Size in Bloomsburg
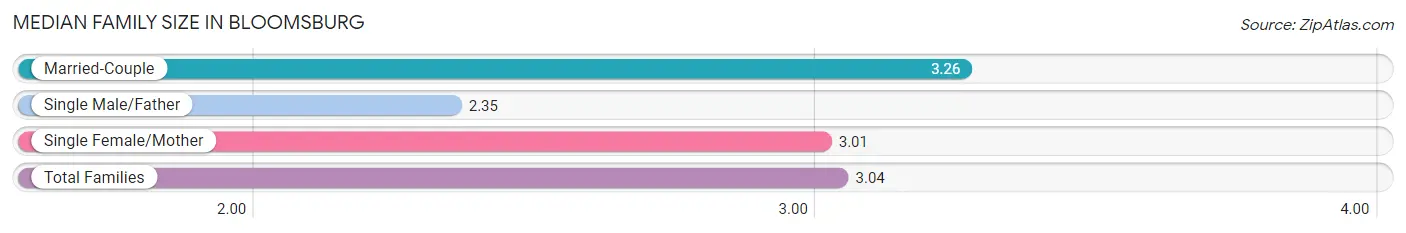
The median family size in Bloomsburg is 3.04 persons per family, with married-couple families (931 | 55.1%) accounting for the largest median family size of 3.26 persons per family. On the other hand, single male/father families (275 | 16.3%) represent the smallest median family size with 2.35 persons per family.
| Family Type | # Families | Family Size |
| Married-Couple | 931 (55.1%) | 3.26 |
| Single Male/Father | 275 (16.3%) | 2.35 |
| Single Female/Mother | 484 (28.6%) | 3.01 |
| Total Families | 1,690 (100.0%) | 3.04 |
Median Household Size in Bloomsburg
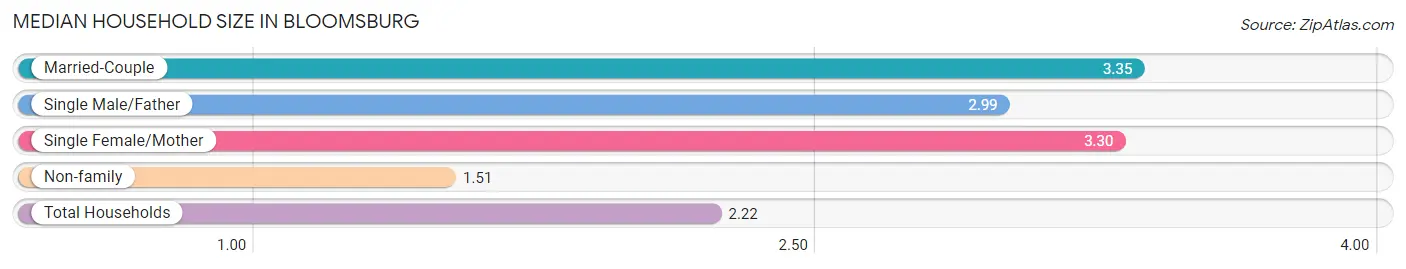
The median household size in Bloomsburg is 2.22 persons per household, with married-couple households (931 | 22.2%) accounting for the largest median household size of 3.35 persons per household. non-family households (2,501 | 59.7%) represent the smallest median household size with 1.51 persons per household.
| Household Type | # Households | Household Size |
| Married-Couple | 931 (22.2%) | 3.35 |
| Single Male/Father | 275 (6.6%) | 2.99 |
| Single Female/Mother | 484 (11.6%) | 3.30 |
| Non-family | 2,501 (59.7%) | 1.51 |
| Total Households | 4,191 (100.0%) | 2.22 |
Household Size by Marriage Status in Bloomsburg
Out of a total of 4,191 households in Bloomsburg, 1,690 (40.3%) are family households, while 2,501 (59.7%) are nonfamily households. The most numerous type of family households are 2-person households, comprising 625, and the most common type of nonfamily households are 1-person households, comprising 1,912.
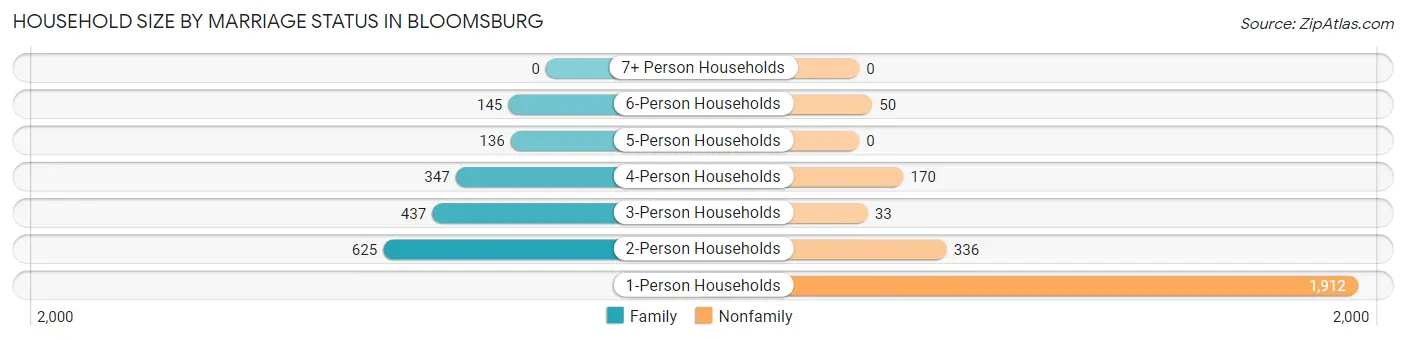
| Household Size | Family Households | Nonfamily Households |
| 1-Person Households | - | 1,912 (45.6%) |
| 2-Person Households | 625 (14.9%) | 336 (8.0%) |
| 3-Person Households | 437 (10.4%) | 33 (0.8%) |
| 4-Person Households | 347 (8.3%) | 170 (4.1%) |
| 5-Person Households | 136 (3.3%) | 0 (0.0%) |
| 6-Person Households | 145 (3.5%) | 50 (1.2%) |
| 7+ Person Households | 0 (0.0%) | 0 (0.0%) |
| Total | 1,690 (40.3%) | 2,501 (59.7%) |
Female Fertility in Bloomsburg
Fertility by Age in Bloomsburg
Average fertility rate in Bloomsburg is 21.0 births per 1,000 women. Women in the age bracket of 20 to 34 years have the highest fertility rate with 37.0 births per 1,000 women. Women in the age bracket of 20 to 34 years acount for 88.7% of all women with births.
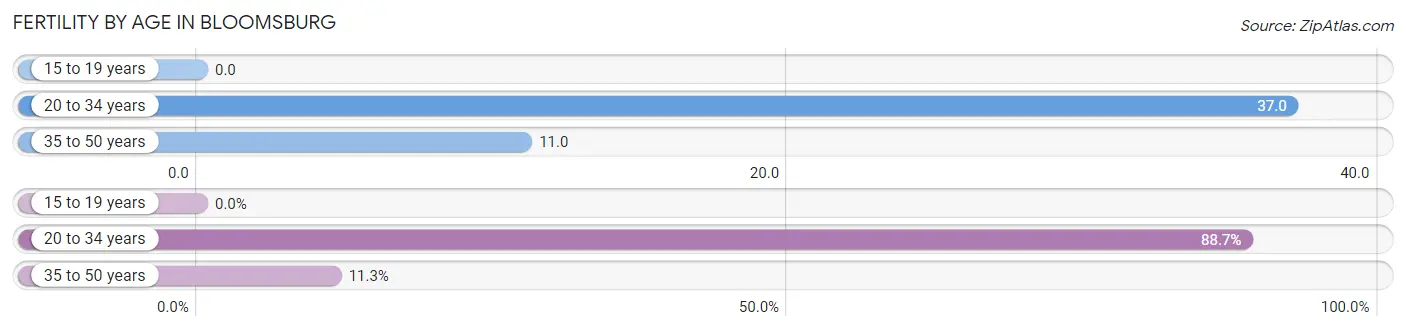
| Age Bracket | Women with Births | Births / 1,000 Women |
| 15 to 19 years | 0 (0.0%) | 0.0 |
| 20 to 34 years | 86 (88.7%) | 37.0 |
| 35 to 50 years | 11 (11.3%) | 11.0 |
| Total | 97 (100.0%) | 21.0 |
Fertility by Age by Marriage Status in Bloomsburg
66.0% of women with births (97) in Bloomsburg are married. The highest percentage of unmarried women with births falls into 20 to 34 years age bracket with 38.4% of them unmarried at the time of birth, while the lowest percentage of unmarried women with births belong to 35 to 50 years age bracket with 0.0% of them unmarried.
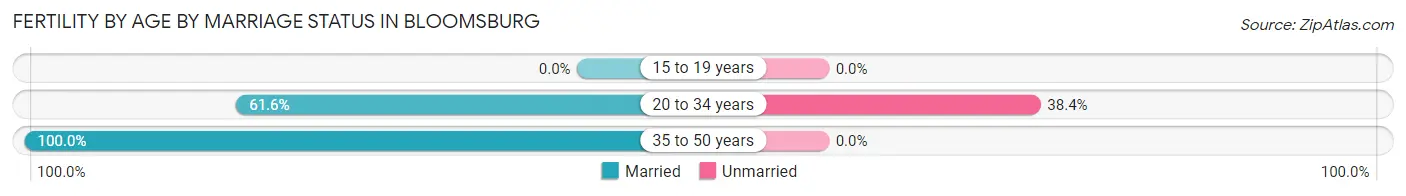
| Age Bracket | Married | Unmarried |
| 15 to 19 years | 0 (0.0%) | 0 (0.0%) |
| 20 to 34 years | 53 (61.6%) | 33 (38.4%) |
| 35 to 50 years | 11 (100.0%) | 0 (0.0%) |
| Total | 64 (66.0%) | 33 (34.0%) |
Fertility by Education in Bloomsburg
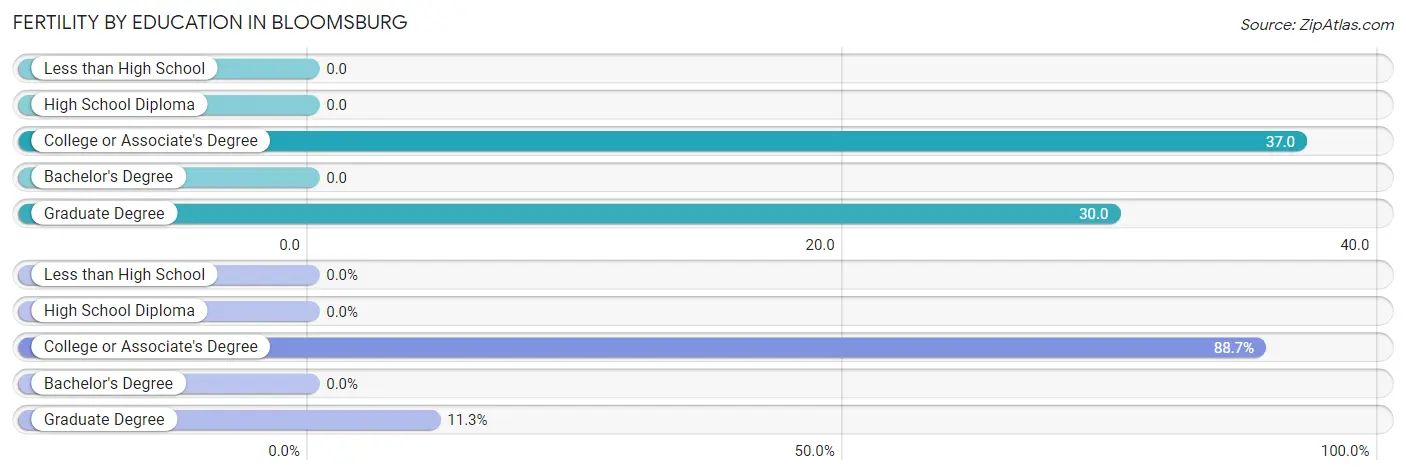
| Educational Attainment | Women with Births | Births / 1,000 Women |
| Less than High School | 0 (0.0%) | 0.0 |
| High School Diploma | 0 (0.0%) | 0.0 |
| College or Associate's Degree | 86 (88.7%) | 37.0 |
| Bachelor's Degree | 0 (0.0%) | 0.0 |
| Graduate Degree | 11 (11.3%) | 30.0 |
| Total | 97 (100.0%) | 21.0 |
Fertility by Education by Marriage Status in Bloomsburg
34.0% of women with births in Bloomsburg are unmarried. Women with the educational attainment of graduate degree are most likely to be married with 100.0% of them married at childbirth, while women with the educational attainment of college or associate's degree are least likely to be married with 38.4% of them unmarried at childbirth.
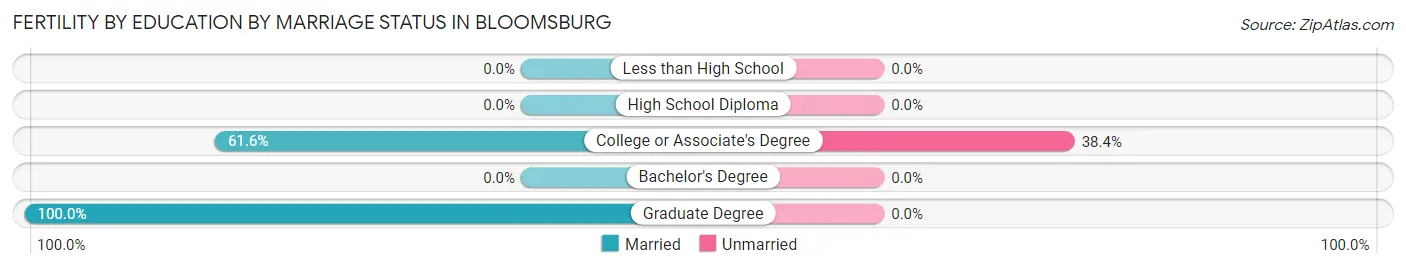
| Educational Attainment | Married | Unmarried |
| Less than High School | 0 (0.0%) | 0 (0.0%) |
| High School Diploma | 0 (0.0%) | 0 (0.0%) |
| College or Associate's Degree | 53 (61.6%) | 33 (38.4%) |
| Bachelor's Degree | 0 (0.0%) | 0 (0.0%) |
| Graduate Degree | 11 (100.0%) | 0 (0.0%) |
| Total | 64 (66.0%) | 33 (34.0%) |
Employment Characteristics in Bloomsburg
Employment by Class of Employer in Bloomsburg
Among the 5,236 employed individuals in Bloomsburg, private company employees (3,358 | 64.1%), not-for-profit organizations (655 | 12.5%), and state government employees (398 | 7.6%) make up the most common classes of employment.
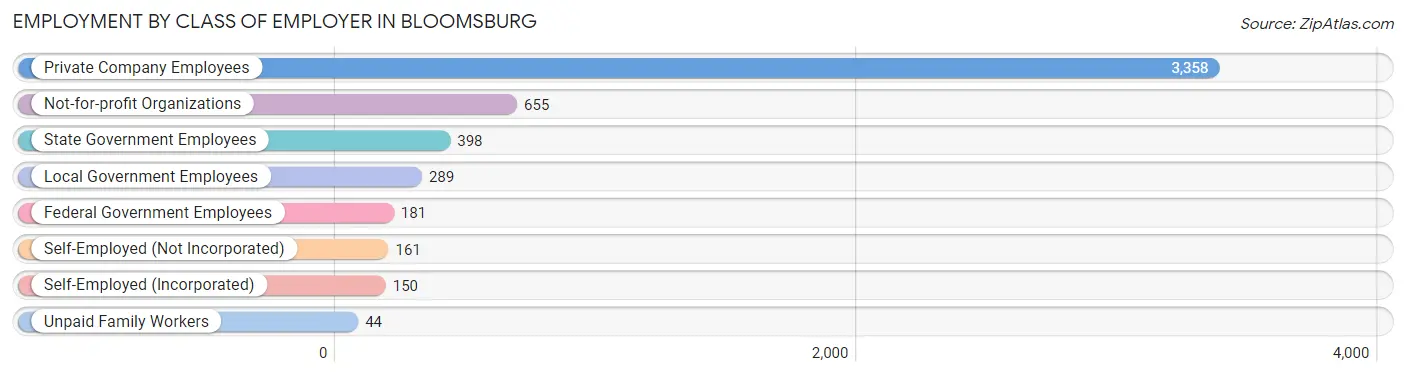
| Employer Class | # Employees | % Employees |
| Private Company Employees | 3,358 | 64.1% |
| Self-Employed (Incorporated) | 150 | 2.9% |
| Self-Employed (Not Incorporated) | 161 | 3.1% |
| Not-for-profit Organizations | 655 | 12.5% |
| Local Government Employees | 289 | 5.5% |
| State Government Employees | 398 | 7.6% |
| Federal Government Employees | 181 | 3.5% |
| Unpaid Family Workers | 44 | 0.8% |
| Total | 5,236 | 100.0% |
Employment Status by Age in Bloomsburg
According to the labor force statistics for Bloomsburg, out of the total population over 16 years of age (11,520), 49.3% or 5,679 individuals are in the labor force, with 5.4% or 307 of them unemployed. The age group with the highest labor force participation rate is 45 to 54 years, with 94.7% or 728 individuals in the labor force. Within the labor force, the 55 to 59 years age range has the highest percentage of unemployed individuals, with 14.1% or 60 of them being unemployed.
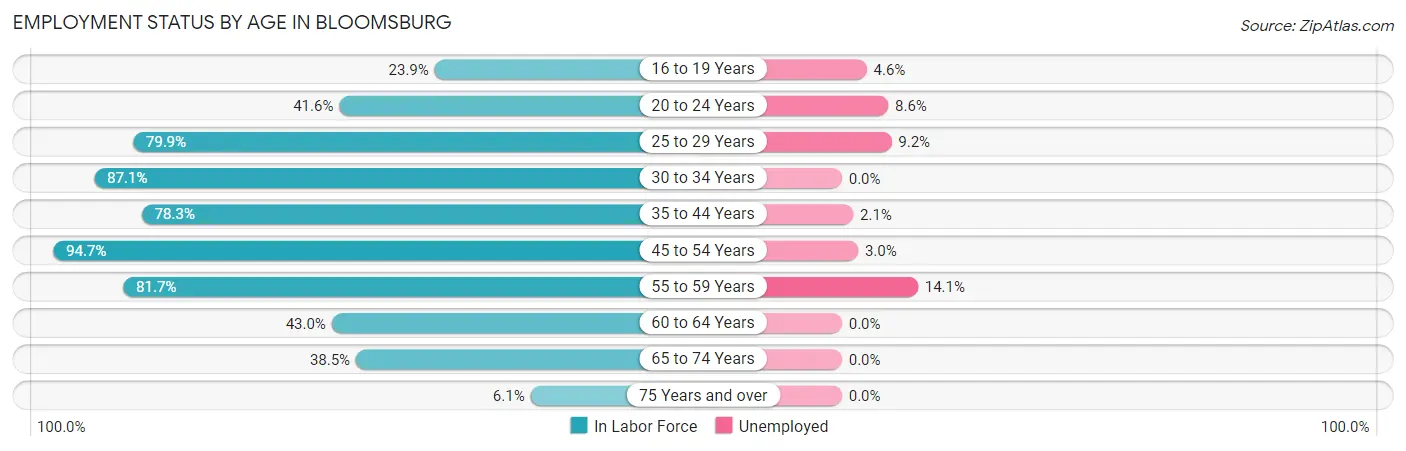
| Age Bracket | In Labor Force | Unemployed |
| 16 to 19 Years | 568 (23.9%) | 26 (4.6%) |
| 20 to 24 Years | 1,395 (41.6%) | 120 (8.6%) |
| 25 to 29 Years | 643 (79.9%) | 59 (9.2%) |
| 30 to 34 Years | 452 (87.1%) | 0 (0.0%) |
| 35 to 44 Years | 917 (78.3%) | 19 (2.1%) |
| 45 to 54 Years | 728 (94.7%) | 22 (3.0%) |
| 55 to 59 Years | 425 (81.7%) | 60 (14.1%) |
| 60 to 64 Years | 198 (43.0%) | 0 (0.0%) |
| 65 to 74 Years | 309 (38.5%) | 0 (0.0%) |
| 75 Years and over | 45 (6.1%) | 0 (0.0%) |
| Total | 5,679 (49.3%) | 307 (5.4%) |
Employment Status by Educational Attainment in Bloomsburg
According to labor force statistics for Bloomsburg, 79.2% of individuals (3,362) out of the total population between 25 and 64 years of age (4,245) are in the labor force, with 4.8% or 161 of them being unemployed. The group with the highest labor force participation rate are those with the educational attainment of bachelor's degree or higher, with 93.4% or 1,464 individuals in the labor force. Within the labor force, individuals with less than high school education have the highest percentage of unemployment, with 31.4% or 16 of them being unemployed.
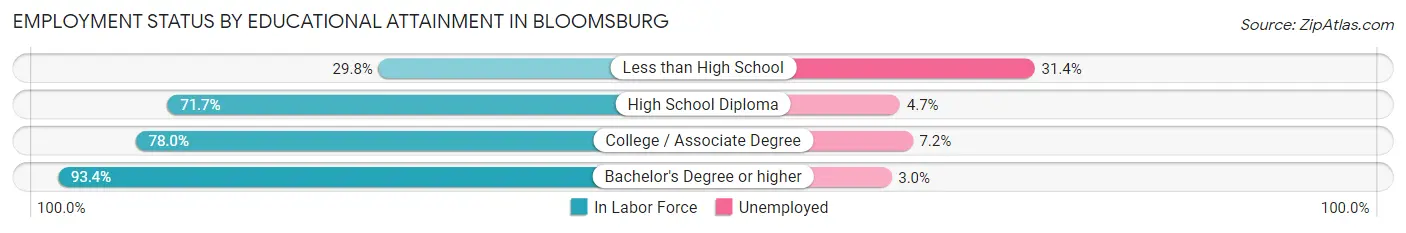
| Educational Attainment | In Labor Force | Unemployed |
| Less than High School | 51 (29.8%) | 54 (31.4%) |
| High School Diploma | 1,207 (71.7%) | 79 (4.7%) |
| College / Associate Degree | 642 (78.0%) | 59 (7.2%) |
| Bachelor's Degree or higher | 1,464 (93.4%) | 47 (3.0%) |
| Total | 3,362 (79.2%) | 204 (4.8%) |
Employment Occupations by Sex in Bloomsburg
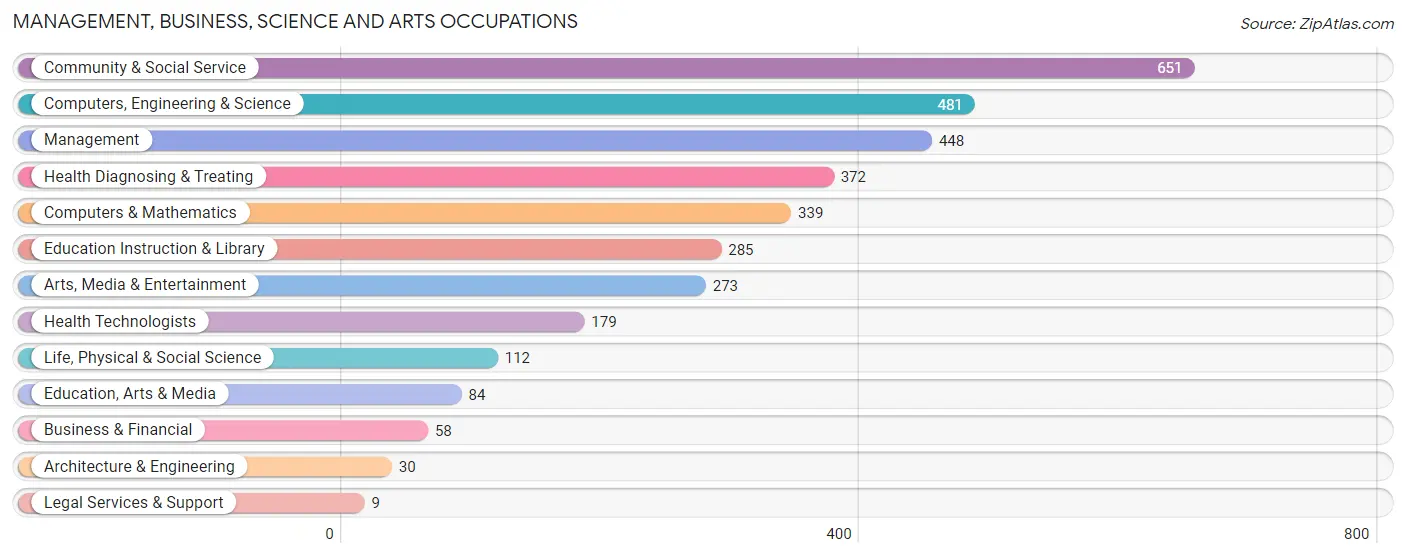
Management, Business, Science and Arts Occupations
The most common Management, Business, Science and Arts occupations in Bloomsburg are Community & Social Service (651 | 12.2%), Computers, Engineering & Science (481 | 9.0%), Management (448 | 8.4%), Health Diagnosing & Treating (372 | 7.0%), and Computers & Mathematics (339 | 6.4%).
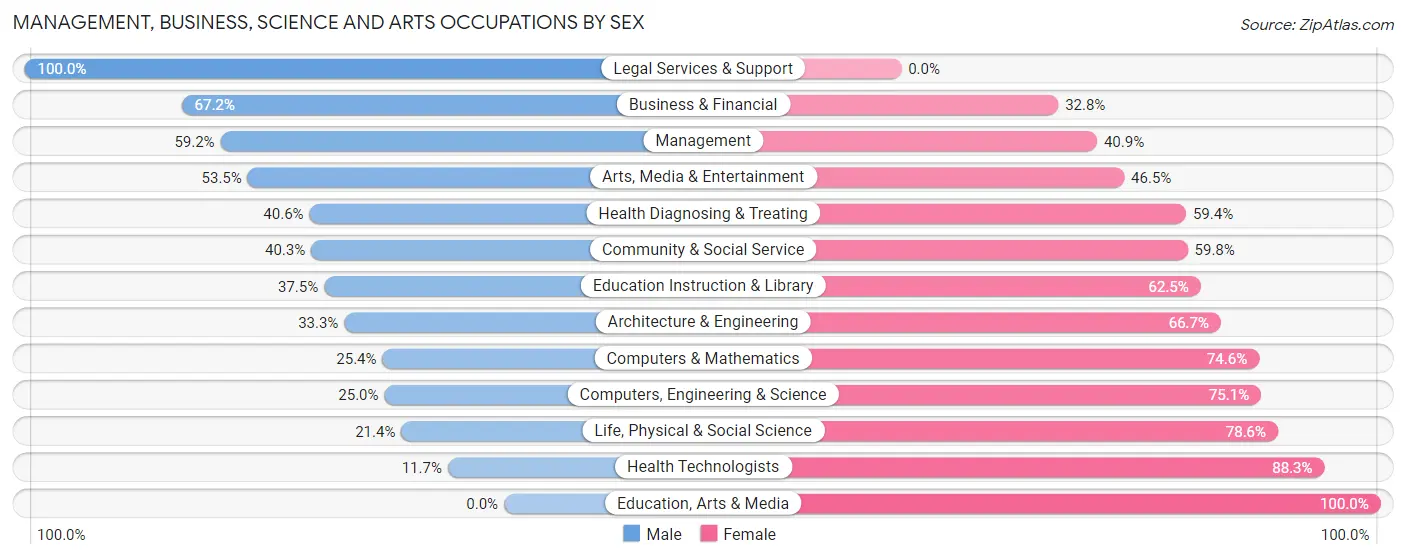
Management, Business, Science and Arts Occupations by Sex
Within the Management, Business, Science and Arts occupations in Bloomsburg, the most male-oriented occupations are Legal Services & Support (100.0%), Business & Financial (67.2%), and Management (59.2%), while the most female-oriented occupations are Education, Arts & Media (100.0%), Health Technologists (88.3%), and Life, Physical & Social Science (78.6%).
| Occupation | Male | Female |
| Management | 265 (59.2%) | 183 (40.8%) |
| Business & Financial | 39 (67.2%) | 19 (32.8%) |
| Computers, Engineering & Science | 120 (24.9%) | 361 (75.0%) |
| Computers & Mathematics | 86 (25.4%) | 253 (74.6%) |
| Architecture & Engineering | 10 (33.3%) | 20 (66.7%) |
| Life, Physical & Social Science | 24 (21.4%) | 88 (78.6%) |
| Community & Social Service | 262 (40.3%) | 389 (59.8%) |
| Education, Arts & Media | 0 (0.0%) | 84 (100.0%) |
| Legal Services & Support | 9 (100.0%) | 0 (0.0%) |
| Education Instruction & Library | 107 (37.5%) | 178 (62.5%) |
| Arts, Media & Entertainment | 146 (53.5%) | 127 (46.5%) |
| Health Diagnosing & Treating | 151 (40.6%) | 221 (59.4%) |
| Health Technologists | 21 (11.7%) | 158 (88.3%) |
| Total (Category) | 837 (41.6%) | 1,173 (58.4%) |
| Total (Overall) | 2,082 (39.0%) | 3,251 (61.0%) |
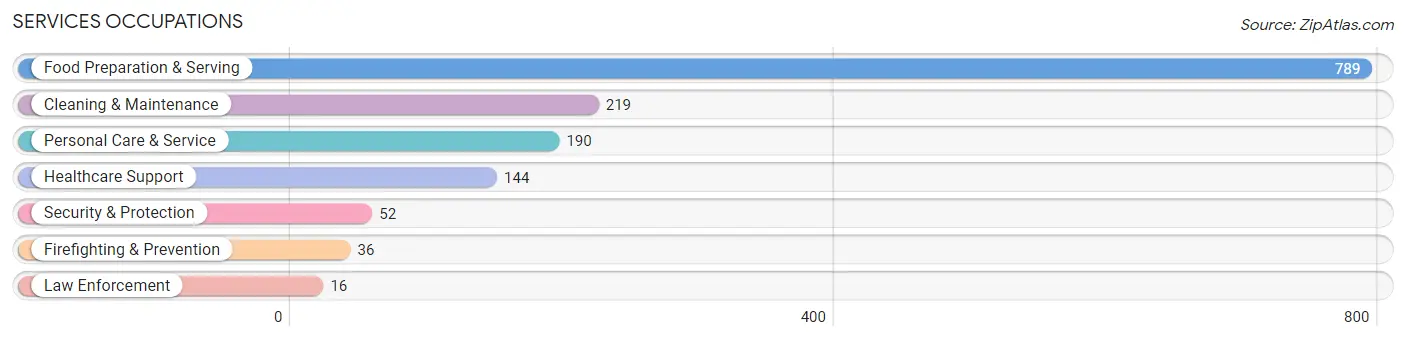
Services Occupations
The most common Services occupations in Bloomsburg are Food Preparation & Serving (789 | 14.8%), Cleaning & Maintenance (219 | 4.1%), Personal Care & Service (190 | 3.6%), Healthcare Support (144 | 2.7%), and Security & Protection (52 | 1.0%).
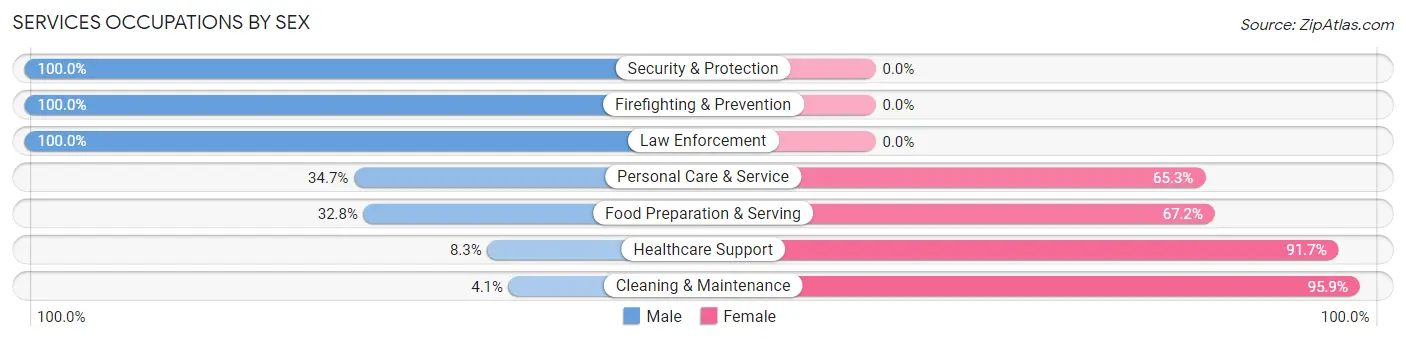
Services Occupations by Sex
Within the Services occupations in Bloomsburg, the most male-oriented occupations are Security & Protection (100.0%), Firefighting & Prevention (100.0%), and Law Enforcement (100.0%), while the most female-oriented occupations are Cleaning & Maintenance (95.9%), Healthcare Support (91.7%), and Food Preparation & Serving (67.2%).
| Occupation | Male | Female |
| Healthcare Support | 12 (8.3%) | 132 (91.7%) |
| Security & Protection | 52 (100.0%) | 0 (0.0%) |
| Firefighting & Prevention | 36 (100.0%) | 0 (0.0%) |
| Law Enforcement | 16 (100.0%) | 0 (0.0%) |
| Food Preparation & Serving | 259 (32.8%) | 530 (67.2%) |
| Cleaning & Maintenance | 9 (4.1%) | 210 (95.9%) |
| Personal Care & Service | 66 (34.7%) | 124 (65.3%) |
| Total (Category) | 398 (28.5%) | 996 (71.5%) |
| Total (Overall) | 2,082 (39.0%) | 3,251 (61.0%) |
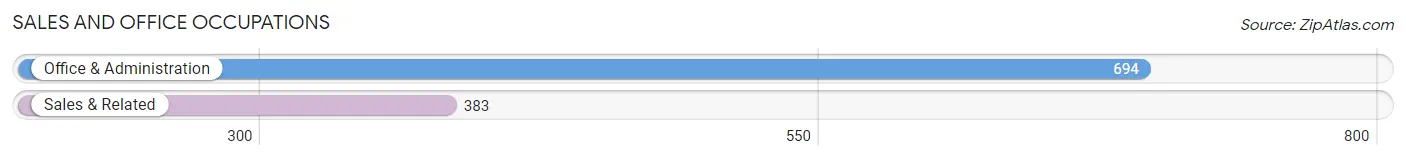
Sales and Office Occupations
The most common Sales and Office occupations in Bloomsburg are Office & Administration (694 | 13.0%), and Sales & Related (383 | 7.2%).
Sales and Office Occupations by Sex
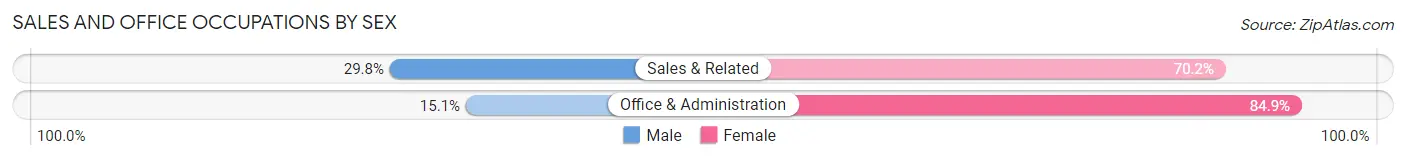
| Occupation | Male | Female |
| Sales & Related | 114 (29.8%) | 269 (70.2%) |
| Office & Administration | 105 (15.1%) | 589 (84.9%) |
| Total (Category) | 219 (20.3%) | 858 (79.7%) |
| Total (Overall) | 2,082 (39.0%) | 3,251 (61.0%) |
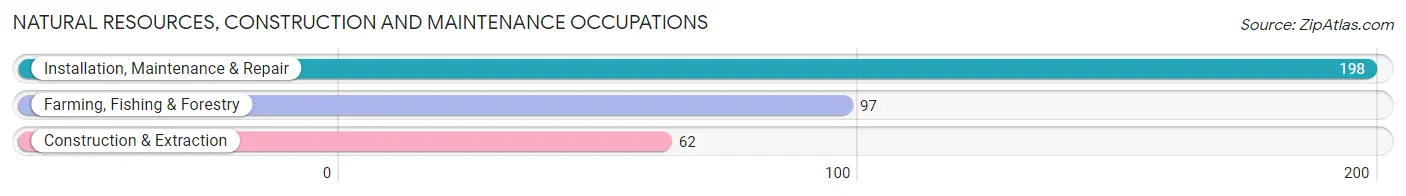
Natural Resources, Construction and Maintenance Occupations
The most common Natural Resources, Construction and Maintenance occupations in Bloomsburg are Installation, Maintenance & Repair (198 | 3.7%), Farming, Fishing & Forestry (97 | 1.8%), and Construction & Extraction (62 | 1.2%).
Natural Resources, Construction and Maintenance Occupations by Sex
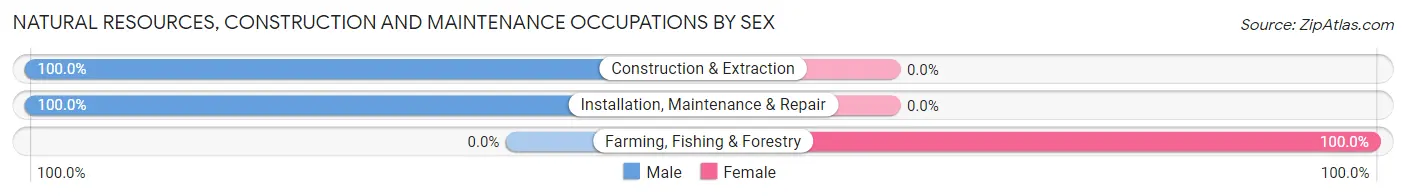
| Occupation | Male | Female |
| Farming, Fishing & Forestry | 0 (0.0%) | 97 (100.0%) |
| Construction & Extraction | 62 (100.0%) | 0 (0.0%) |
| Installation, Maintenance & Repair | 198 (100.0%) | 0 (0.0%) |
| Total (Category) | 260 (72.8%) | 97 (27.2%) |
| Total (Overall) | 2,082 (39.0%) | 3,251 (61.0%) |
Production, Transportation and Moving Occupations
The most common Production, Transportation and Moving occupations in Bloomsburg are Material Moving (253 | 4.7%), Production (144 | 2.7%), and Transportation (98 | 1.8%).
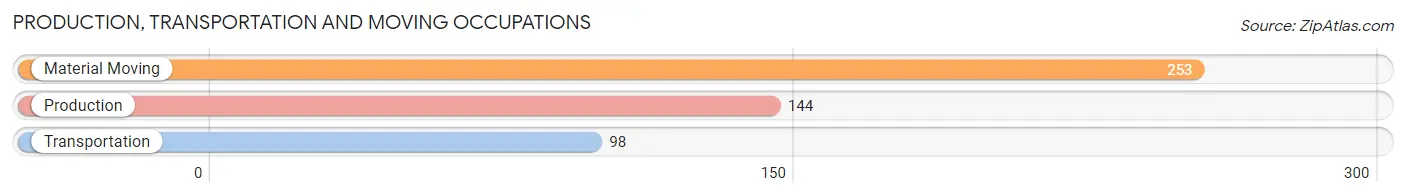
Production, Transportation and Moving Occupations by Sex
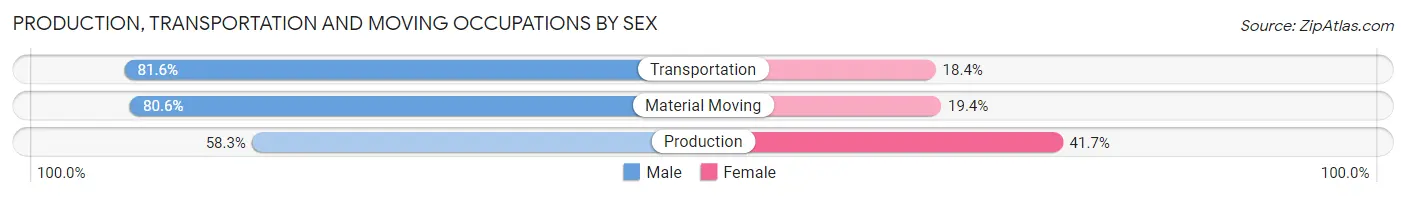
| Occupation | Male | Female |
| Production | 84 (58.3%) | 60 (41.7%) |
| Transportation | 80 (81.6%) | 18 (18.4%) |
| Material Moving | 204 (80.6%) | 49 (19.4%) |
| Total (Category) | 368 (74.3%) | 127 (25.7%) |
| Total (Overall) | 2,082 (39.0%) | 3,251 (61.0%) |
Employment Industries by Sex in Bloomsburg
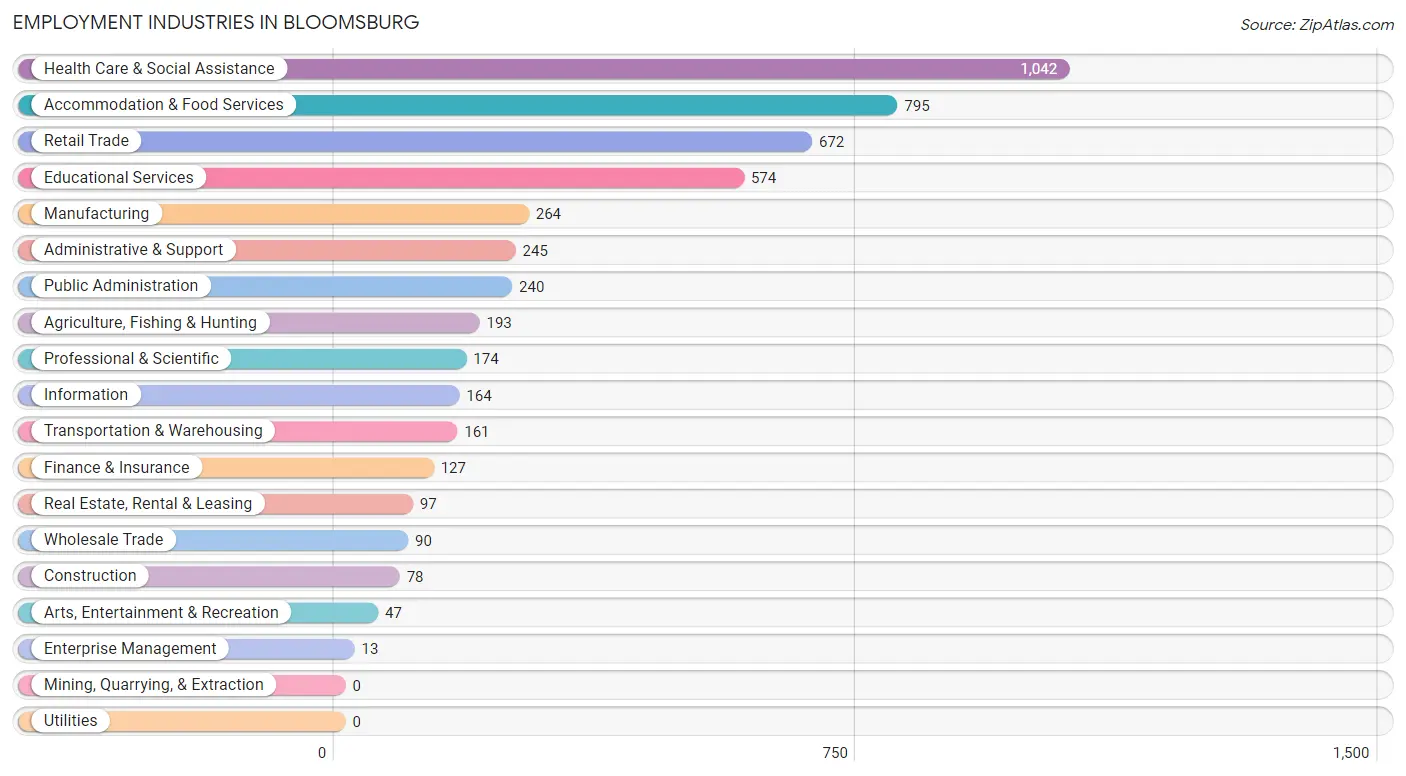
Employment Industries in Bloomsburg
The major employment industries in Bloomsburg include Health Care & Social Assistance (1,042 | 19.5%), Accommodation & Food Services (795 | 14.9%), Retail Trade (672 | 12.6%), Educational Services (574 | 10.8%), and Manufacturing (264 | 5.0%).
Employment Industries by Sex in Bloomsburg
The Bloomsburg industries that see more men than women are Enterprise Management (100.0%), Manufacturing (83.0%), and Construction (73.1%), whereas the industries that tend to have a higher number of women are Finance & Insurance (89.8%), Health Care & Social Assistance (84.5%), and Transportation & Warehousing (74.5%).
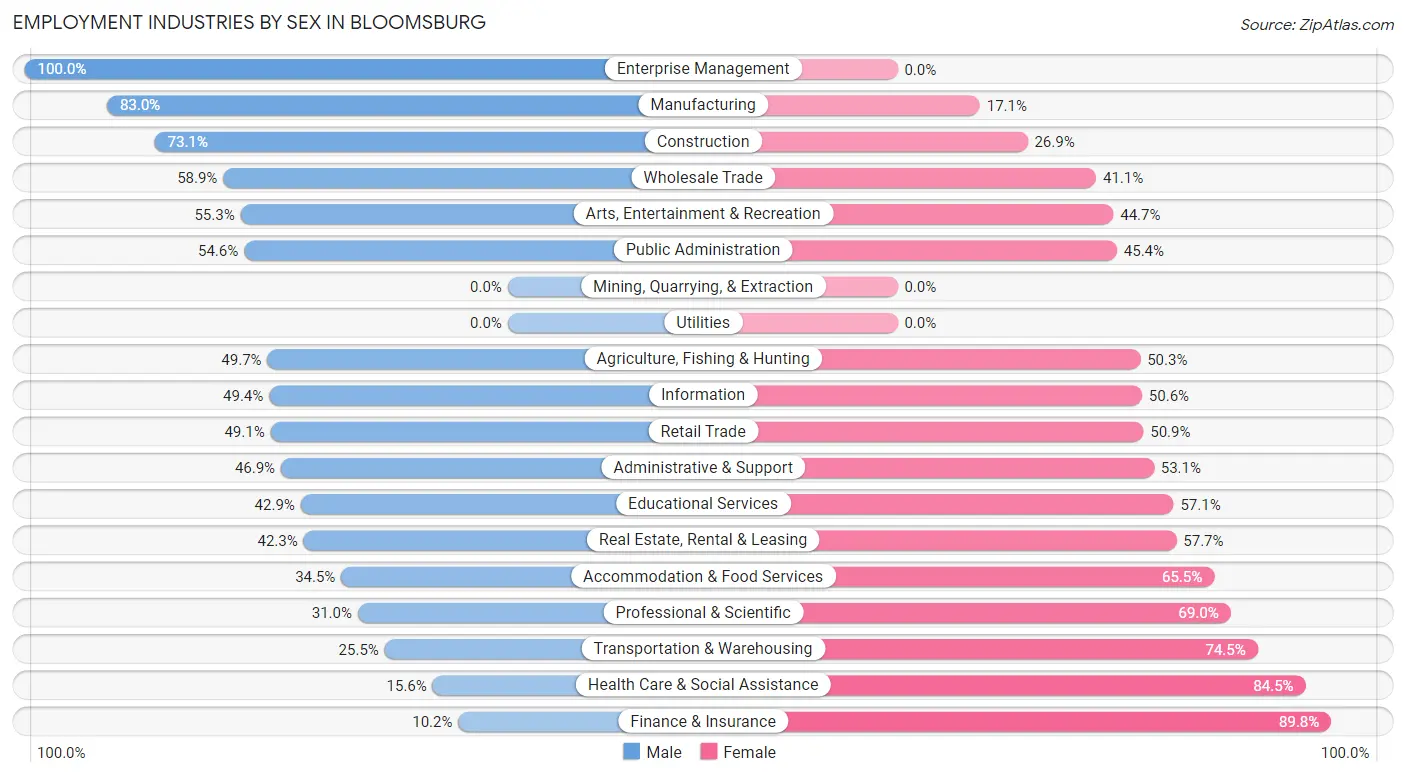
| Industry | Male | Female |
| Agriculture, Fishing & Hunting | 96 (49.7%) | 97 (50.3%) |
| Mining, Quarrying, & Extraction | 0 (0.0%) | 0 (0.0%) |
| Construction | 57 (73.1%) | 21 (26.9%) |
| Manufacturing | 219 (83.0%) | 45 (17.1%) |
| Wholesale Trade | 53 (58.9%) | 37 (41.1%) |
| Retail Trade | 330 (49.1%) | 342 (50.9%) |
| Transportation & Warehousing | 41 (25.5%) | 120 (74.5%) |
| Utilities | 0 (0.0%) | 0 (0.0%) |
| Information | 81 (49.4%) | 83 (50.6%) |
| Finance & Insurance | 13 (10.2%) | 114 (89.8%) |
| Real Estate, Rental & Leasing | 41 (42.3%) | 56 (57.7%) |
| Professional & Scientific | 54 (31.0%) | 120 (69.0%) |
| Enterprise Management | 13 (100.0%) | 0 (0.0%) |
| Administrative & Support | 115 (46.9%) | 130 (53.1%) |
| Educational Services | 246 (42.9%) | 328 (57.1%) |
| Health Care & Social Assistance | 162 (15.5%) | 880 (84.5%) |
| Arts, Entertainment & Recreation | 26 (55.3%) | 21 (44.7%) |
| Accommodation & Food Services | 274 (34.5%) | 521 (65.5%) |
| Public Administration | 131 (54.6%) | 109 (45.4%) |
| Total | 2,082 (39.0%) | 3,251 (61.0%) |
Education in Bloomsburg
School Enrollment in Bloomsburg
The most common levels of schooling among the 6,238 students in Bloomsburg are college / undergraduate (4,880 | 78.2%), high school (354 | 5.7%), and elementary school (345 | 5.5%).
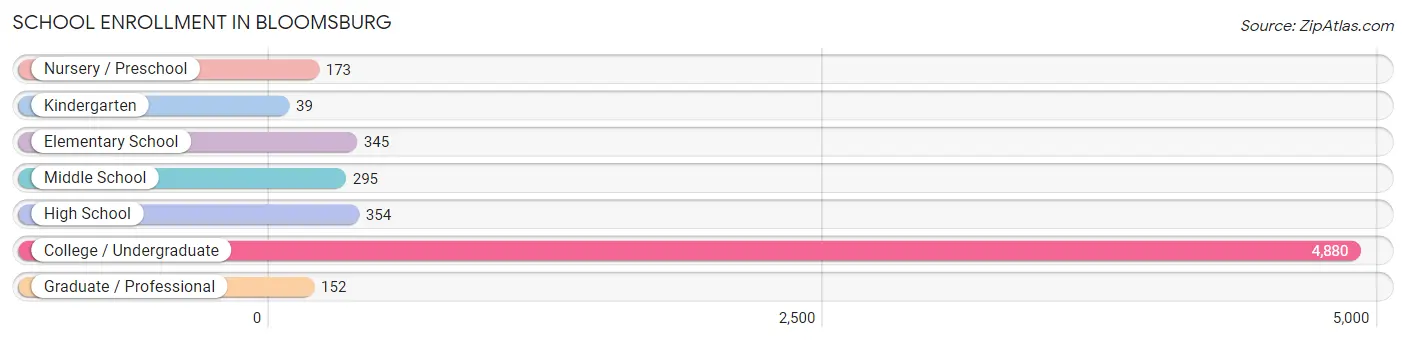
| School Level | # Students | % Students |
| Nursery / Preschool | 173 | 2.8% |
| Kindergarten | 39 | 0.6% |
| Elementary School | 345 | 5.5% |
| Middle School | 295 | 4.7% |
| High School | 354 | 5.7% |
| College / Undergraduate | 4,880 | 78.2% |
| Graduate / Professional | 152 | 2.4% |
| Total | 6,238 | 100.0% |
School Enrollment by Age by Funding Source in Bloomsburg
Out of a total of 6,238 students who are enrolled in schools in Bloomsburg, 530 (8.5%) attend a private institution, while the remaining 5,708 (91.5%) are enrolled in public schools. The age group of 35 years and over has the highest likelihood of being enrolled in private schools, with 39 (78.0% in the age bracket) enrolled. Conversely, the age group of 15 to 17 year olds has the lowest likelihood of being enrolled in a private school, with 235 (100.0% in the age bracket) attending a public institution.
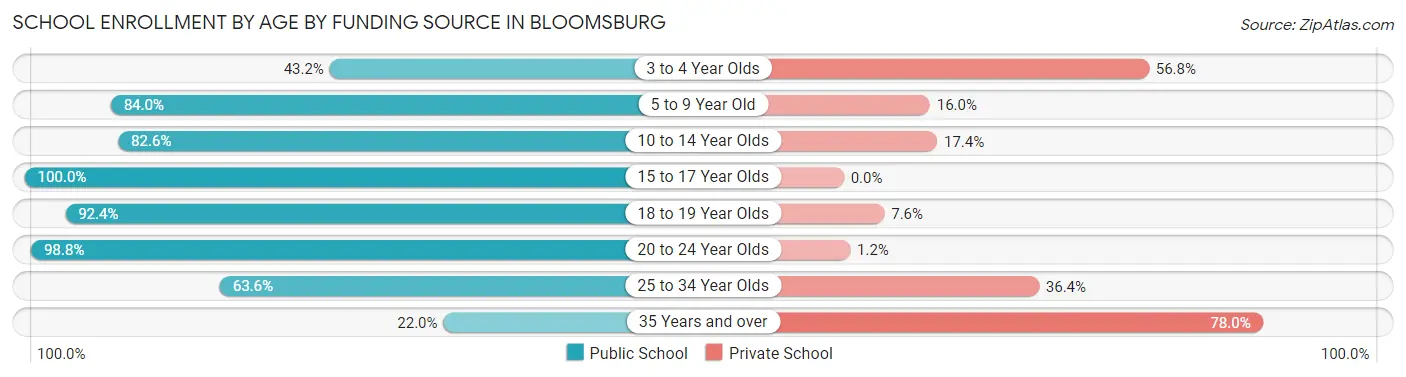
| Age Bracket | Public School | Private School |
| 3 to 4 Year Olds | 79 (43.2%) | 104 (56.8%) |
| 5 to 9 Year Old | 314 (84.0%) | 60 (16.0%) |
| 10 to 14 Year Olds | 299 (82.6%) | 63 (17.4%) |
| 15 to 17 Year Olds | 235 (100.0%) | 0 (0.0%) |
| 18 to 19 Year Olds | 1,929 (92.4%) | 158 (7.6%) |
| 20 to 24 Year Olds | 2,716 (98.8%) | 33 (1.2%) |
| 25 to 34 Year Olds | 126 (63.6%) | 72 (36.4%) |
| 35 Years and over | 11 (22.0%) | 39 (78.0%) |
| Total | 5,708 (91.5%) | 530 (8.5%) |
Educational Attainment by Field of Study in Bloomsburg
Education (289 | 14.0%), literature & languages (227 | 11.0%), science & technology (205 | 9.9%), communications (201 | 9.7%), and business (186 | 9.0%) are the most common fields of study among 2,068 individuals in Bloomsburg who have obtained a bachelor's degree or higher.
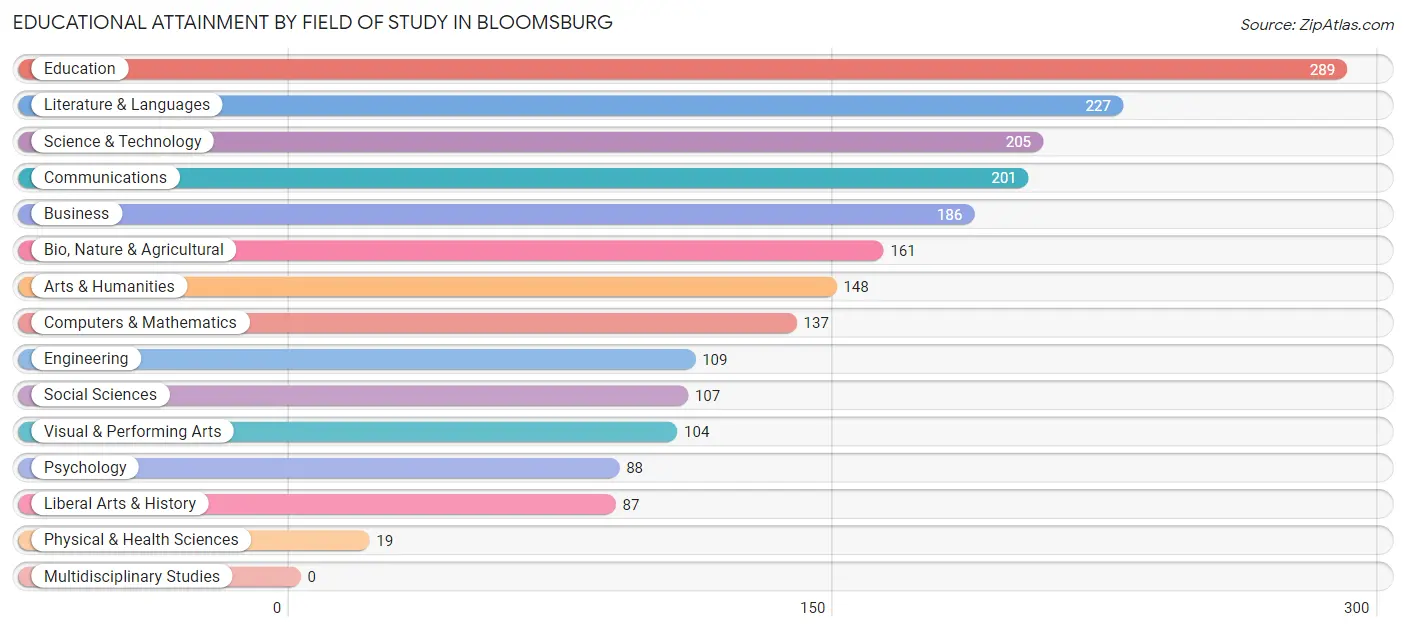
| Field of Study | # Graduates | % Graduates |
| Computers & Mathematics | 137 | 6.6% |
| Bio, Nature & Agricultural | 161 | 7.8% |
| Physical & Health Sciences | 19 | 0.9% |
| Psychology | 88 | 4.3% |
| Social Sciences | 107 | 5.2% |
| Engineering | 109 | 5.3% |
| Multidisciplinary Studies | 0 | 0.0% |
| Science & Technology | 205 | 9.9% |
| Business | 186 | 9.0% |
| Education | 289 | 14.0% |
| Literature & Languages | 227 | 11.0% |
| Liberal Arts & History | 87 | 4.2% |
| Visual & Performing Arts | 104 | 5.0% |
| Communications | 201 | 9.7% |
| Arts & Humanities | 148 | 7.2% |
| Total | 2,068 | 100.0% |
Transportation & Commute in Bloomsburg
Vehicle Availability by Sex in Bloomsburg
The most prevalent vehicle ownership categories in Bloomsburg are males with 2 vehicles (700, accounting for 35.8%) and females with 2 vehicles (740, making up 25.3%).
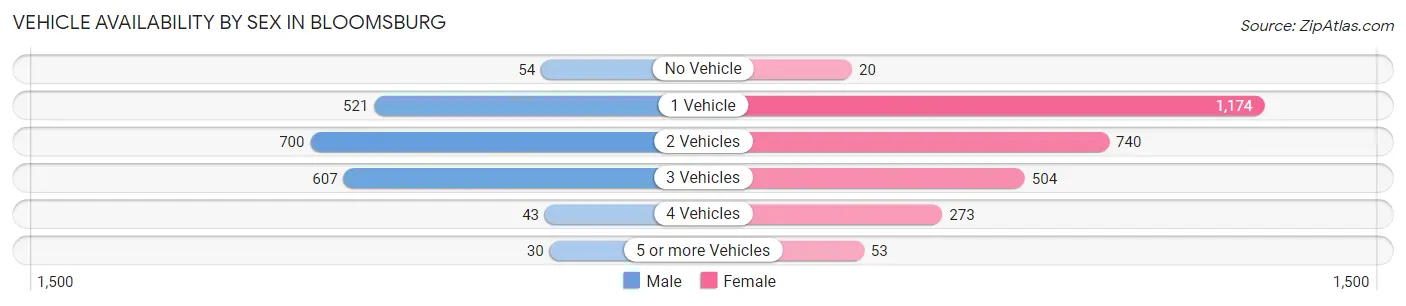
| Vehicles Available | Male | Female |
| No Vehicle | 54 (2.8%) | 20 (0.7%) |
| 1 Vehicle | 521 (26.7%) | 1,174 (42.5%) |
| 2 Vehicles | 700 (35.8%) | 740 (26.8%) |
| 3 Vehicles | 607 (31.0%) | 504 (18.2%) |
| 4 Vehicles | 43 (2.2%) | 273 (9.9%) |
| 5 or more Vehicles | 30 (1.5%) | 53 (1.9%) |
| Total | 1,955 (100.0%) | 2,764 (100.0%) |
Commute Time in Bloomsburg
The most frequently occuring commute durations in Bloomsburg are 5 to 9 minutes (1,208 commuters, 26.0%), 10 to 14 minutes (1,009 commuters, 21.7%), and 15 to 19 minutes (930 commuters, 20.0%).
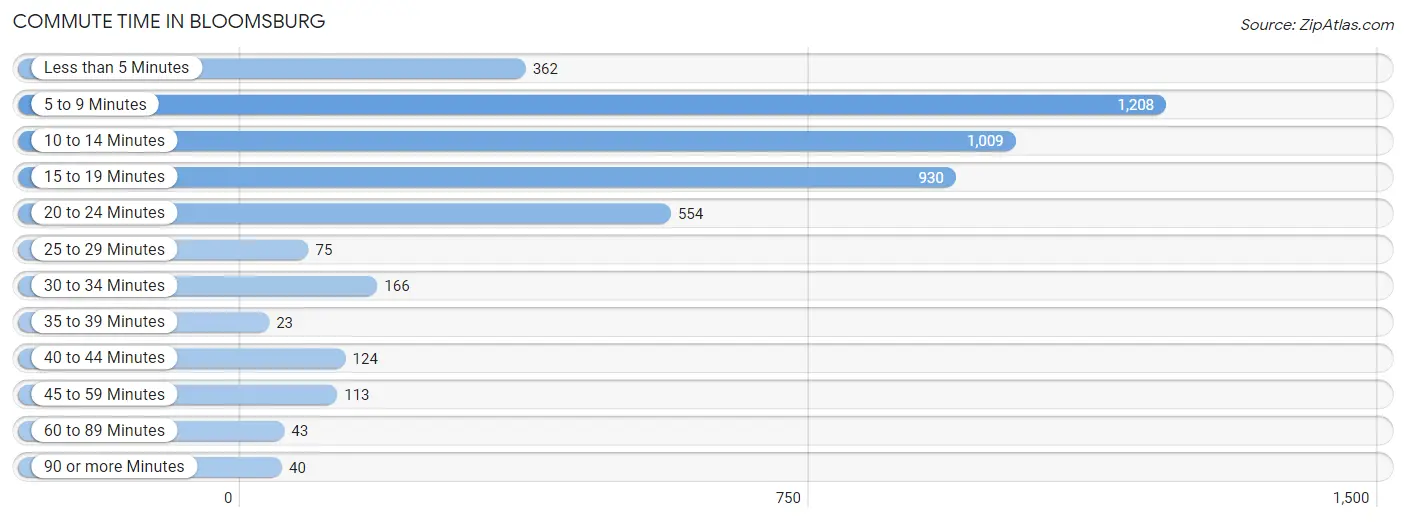
| Commute Time | # Commuters | % Commuters |
| Less than 5 Minutes | 362 | 7.8% |
| 5 to 9 Minutes | 1,208 | 26.0% |
| 10 to 14 Minutes | 1,009 | 21.7% |
| 15 to 19 Minutes | 930 | 20.0% |
| 20 to 24 Minutes | 554 | 11.9% |
| 25 to 29 Minutes | 75 | 1.6% |
| 30 to 34 Minutes | 166 | 3.6% |
| 35 to 39 Minutes | 23 | 0.5% |
| 40 to 44 Minutes | 124 | 2.7% |
| 45 to 59 Minutes | 113 | 2.4% |
| 60 to 89 Minutes | 43 | 0.9% |
| 90 or more Minutes | 40 | 0.9% |
Commute Time by Sex in Bloomsburg
The most common commute times in Bloomsburg are 5 to 9 minutes (595 commuters, 29.9%) for males and 15 to 19 minutes (679 commuters, 25.6%) for females.
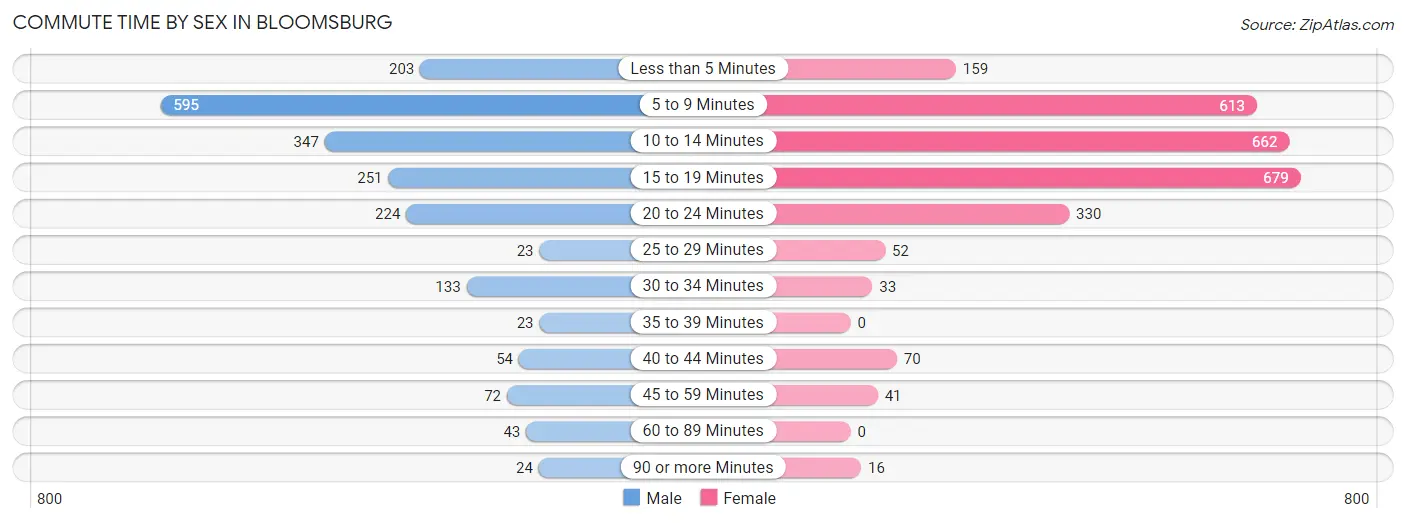
| Commute Time | Male | Female |
| Less than 5 Minutes | 203 (10.2%) | 159 (6.0%) |
| 5 to 9 Minutes | 595 (29.9%) | 613 (23.1%) |
| 10 to 14 Minutes | 347 (17.4%) | 662 (24.9%) |
| 15 to 19 Minutes | 251 (12.6%) | 679 (25.6%) |
| 20 to 24 Minutes | 224 (11.2%) | 330 (12.4%) |
| 25 to 29 Minutes | 23 (1.1%) | 52 (2.0%) |
| 30 to 34 Minutes | 133 (6.7%) | 33 (1.2%) |
| 35 to 39 Minutes | 23 (1.1%) | 0 (0.0%) |
| 40 to 44 Minutes | 54 (2.7%) | 70 (2.6%) |
| 45 to 59 Minutes | 72 (3.6%) | 41 (1.5%) |
| 60 to 89 Minutes | 43 (2.2%) | 0 (0.0%) |
| 90 or more Minutes | 24 (1.2%) | 16 (0.6%) |
Time of Departure to Work by Sex in Bloomsburg
The most frequent times of departure to work in Bloomsburg are 7:00 AM to 7:29 AM (491, 24.6%) for males and 4:00 PM to 11:59 PM (481, 18.1%) for females.
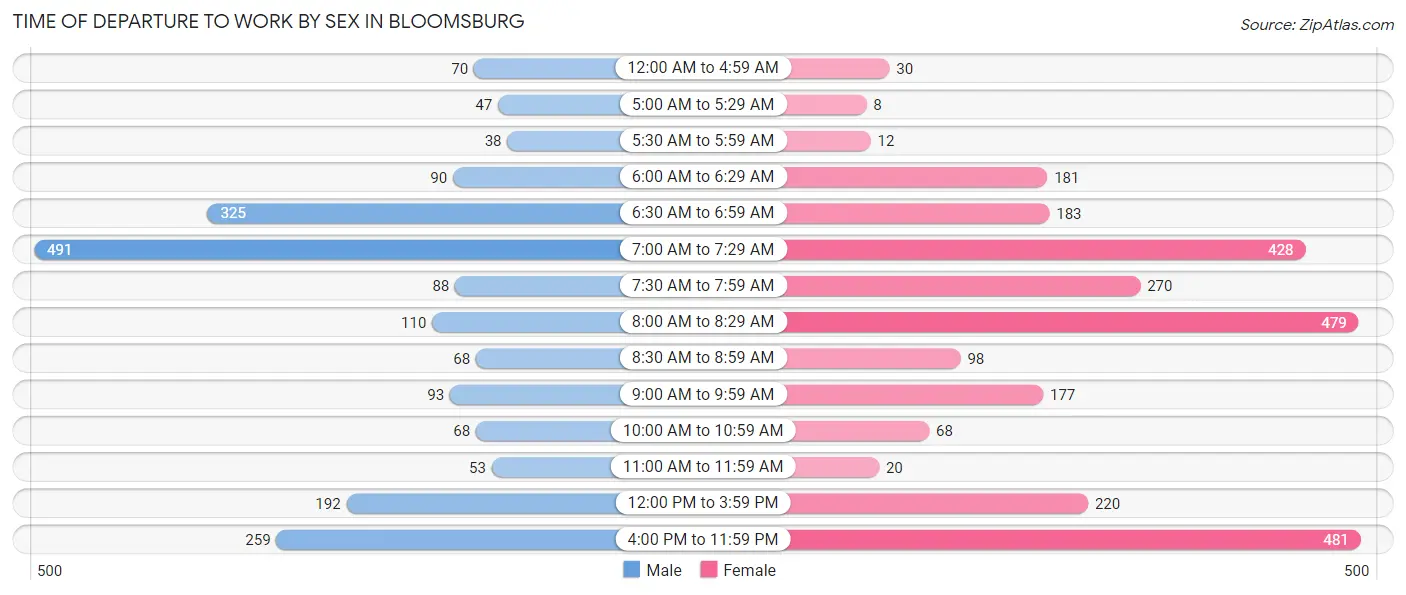
| Time of Departure | Male | Female |
| 12:00 AM to 4:59 AM | 70 (3.5%) | 30 (1.1%) |
| 5:00 AM to 5:29 AM | 47 (2.4%) | 8 (0.3%) |
| 5:30 AM to 5:59 AM | 38 (1.9%) | 12 (0.4%) |
| 6:00 AM to 6:29 AM | 90 (4.5%) | 181 (6.8%) |
| 6:30 AM to 6:59 AM | 325 (16.3%) | 183 (6.9%) |
| 7:00 AM to 7:29 AM | 491 (24.6%) | 428 (16.1%) |
| 7:30 AM to 7:59 AM | 88 (4.4%) | 270 (10.2%) |
| 8:00 AM to 8:29 AM | 110 (5.5%) | 479 (18.0%) |
| 8:30 AM to 8:59 AM | 68 (3.4%) | 98 (3.7%) |
| 9:00 AM to 9:59 AM | 93 (4.7%) | 177 (6.7%) |
| 10:00 AM to 10:59 AM | 68 (3.4%) | 68 (2.6%) |
| 11:00 AM to 11:59 AM | 53 (2.7%) | 20 (0.7%) |
| 12:00 PM to 3:59 PM | 192 (9.6%) | 220 (8.3%) |
| 4:00 PM to 11:59 PM | 259 (13.0%) | 481 (18.1%) |
| Total | 1,992 (100.0%) | 2,655 (100.0%) |
Housing Occupancy in Bloomsburg
Occupancy by Ownership in Bloomsburg
Of the total 4,191 dwellings in Bloomsburg, owner-occupied units account for 1,584 (37.8%), while renter-occupied units make up 2,607 (62.2%).
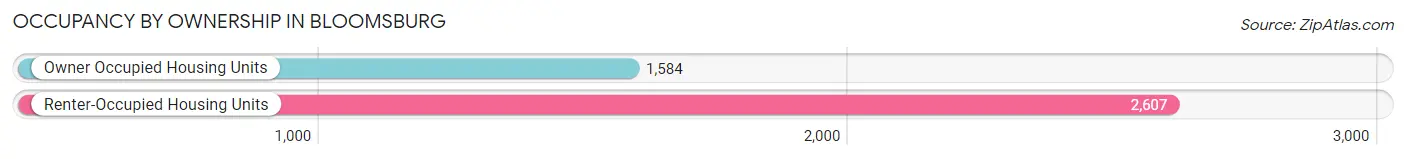
| Occupancy | # Housing Units | % Housing Units |
| Owner Occupied Housing Units | 1,584 | 37.8% |
| Renter-Occupied Housing Units | 2,607 | 62.2% |
| Total Occupied Housing Units | 4,191 | 100.0% |
Occupancy by Household Size in Bloomsburg
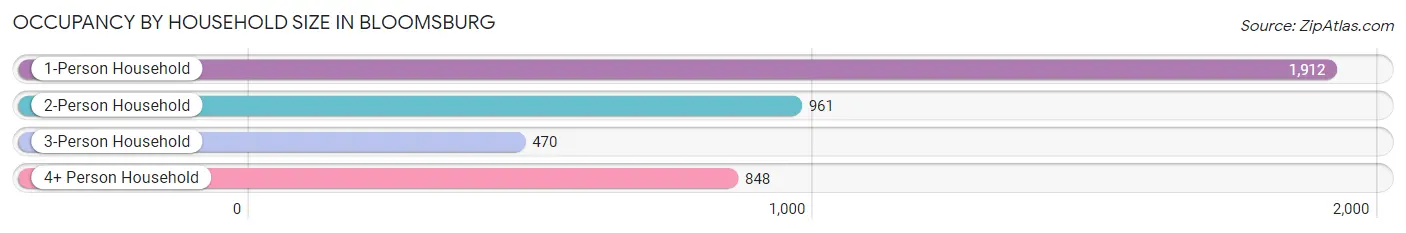
| Household Size | # Housing Units | % Housing Units |
| 1-Person Household | 1,912 | 45.6% |
| 2-Person Household | 961 | 22.9% |
| 3-Person Household | 470 | 11.2% |
| 4+ Person Household | 848 | 20.2% |
| Total Housing Units | 4,191 | 100.0% |
Occupancy by Ownership by Household Size in Bloomsburg
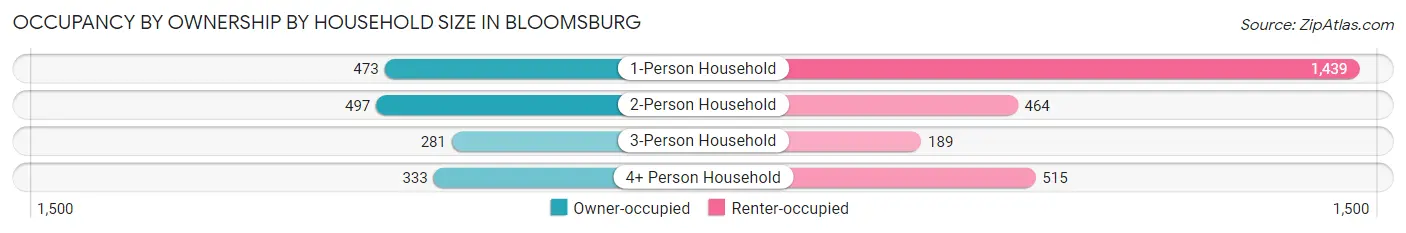
| Household Size | Owner-occupied | Renter-occupied |
| 1-Person Household | 473 (24.7%) | 1,439 (75.3%) |
| 2-Person Household | 497 (51.7%) | 464 (48.3%) |
| 3-Person Household | 281 (59.8%) | 189 (40.2%) |
| 4+ Person Household | 333 (39.3%) | 515 (60.7%) |
| Total Housing Units | 1,584 (37.8%) | 2,607 (62.2%) |
Occupancy by Educational Attainment in Bloomsburg
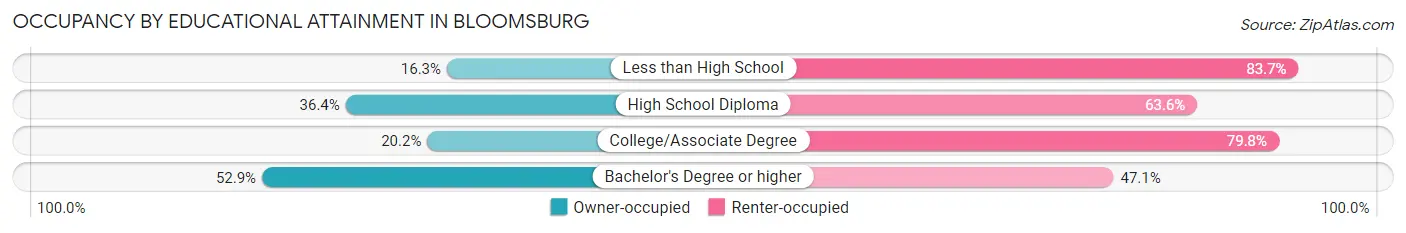
| Household Size | Owner-occupied | Renter-occupied |
| Less than High School | 21 (16.3%) | 108 (83.7%) |
| High School Diploma | 544 (36.4%) | 952 (63.6%) |
| College/Associate Degree | 209 (20.2%) | 827 (79.8%) |
| Bachelor's Degree or higher | 810 (52.9%) | 720 (47.1%) |
Occupancy by Age of Householder in Bloomsburg
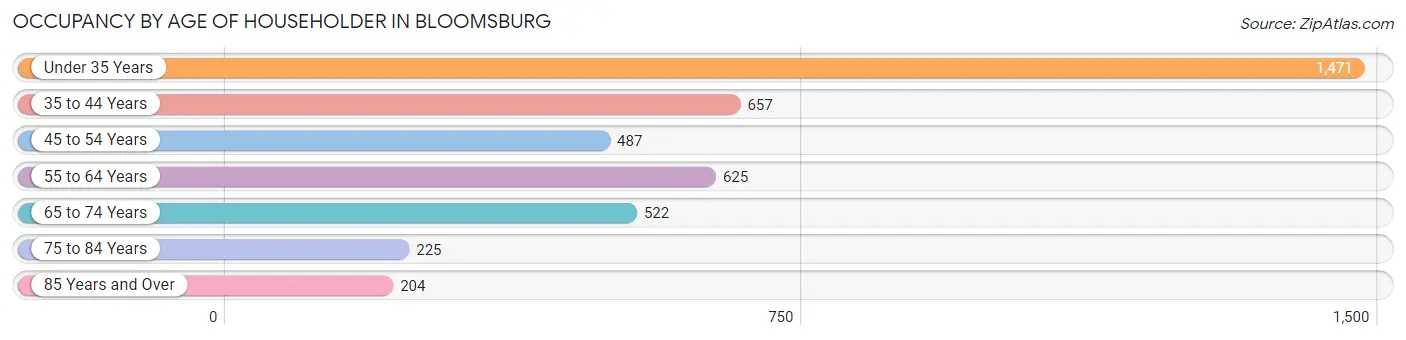
| Age Bracket | # Households | % Households |
| Under 35 Years | 1,471 | 35.1% |
| 35 to 44 Years | 657 | 15.7% |
| 45 to 54 Years | 487 | 11.6% |
| 55 to 64 Years | 625 | 14.9% |
| 65 to 74 Years | 522 | 12.5% |
| 75 to 84 Years | 225 | 5.4% |
| 85 Years and Over | 204 | 4.9% |
| Total | 4,191 | 100.0% |
Housing Finances in Bloomsburg
Median Income by Occupancy in Bloomsburg
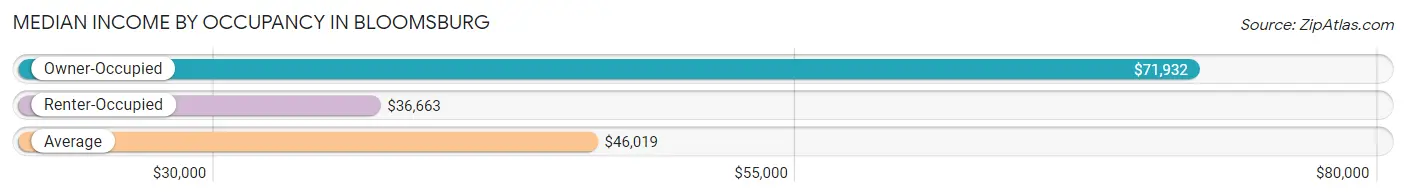
| Occupancy Type | # Households | Median Income |
| Owner-Occupied | 1,584 (37.8%) | $71,932 |
| Renter-Occupied | 2,607 (62.2%) | $36,663 |
| Average | 4,191 (100.0%) | $46,019 |
Occupancy by Householder Income Bracket in Bloomsburg
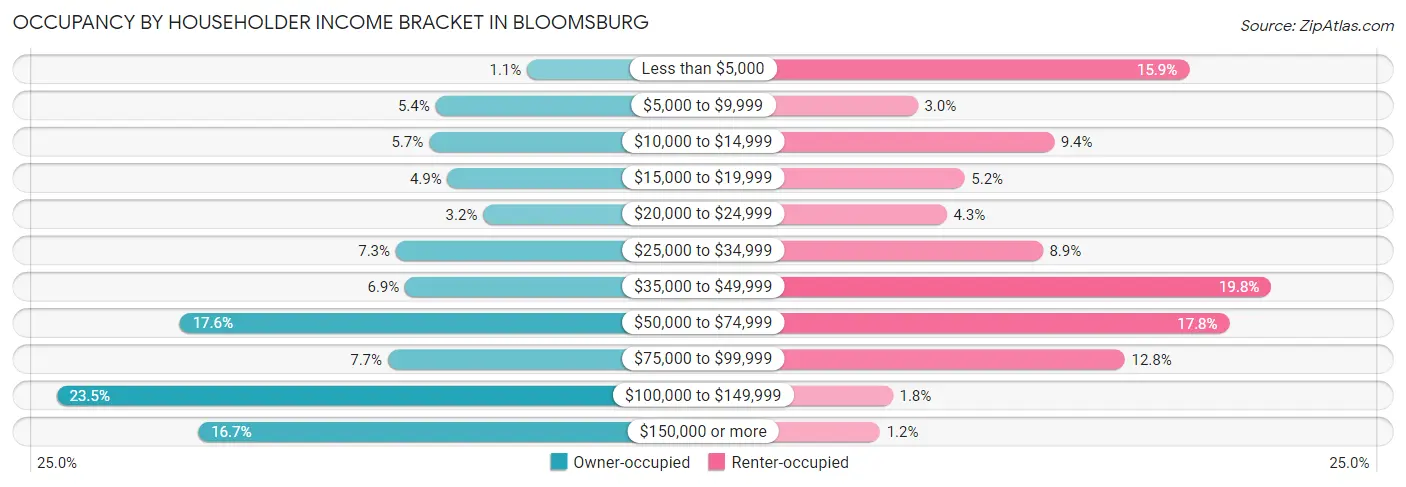
| Income Bracket | Owner-occupied | Renter-occupied |
| Less than $5,000 | 17 (1.1%) | 414 (15.9%) |
| $5,000 to $9,999 | 86 (5.4%) | 77 (2.9%) |
| $10,000 to $14,999 | 91 (5.7%) | 246 (9.4%) |
| $15,000 to $19,999 | 77 (4.9%) | 135 (5.2%) |
| $20,000 to $24,999 | 50 (3.2%) | 113 (4.3%) |
| $25,000 to $34,999 | 116 (7.3%) | 232 (8.9%) |
| $35,000 to $49,999 | 109 (6.9%) | 516 (19.8%) |
| $50,000 to $74,999 | 279 (17.6%) | 464 (17.8%) |
| $75,000 to $99,999 | 122 (7.7%) | 334 (12.8%) |
| $100,000 to $149,999 | 372 (23.5%) | 46 (1.8%) |
| $150,000 or more | 265 (16.7%) | 30 (1.1%) |
| Total | 1,584 (100.0%) | 2,607 (100.0%) |
Monthly Housing Cost Tiers in Bloomsburg
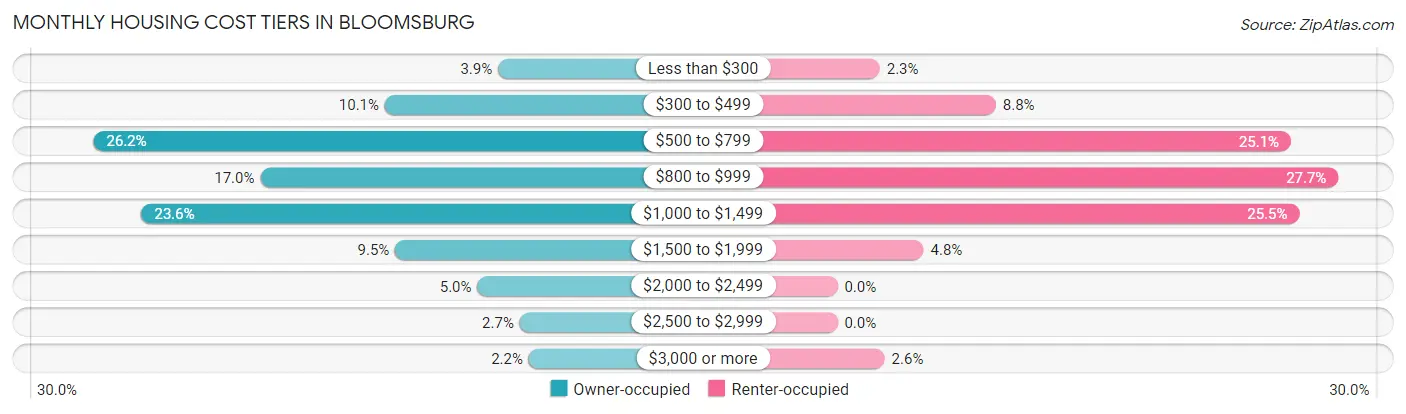
| Monthly Cost | Owner-occupied | Renter-occupied |
| Less than $300 | 61 (3.8%) | 61 (2.3%) |
| $300 to $499 | 160 (10.1%) | 228 (8.7%) |
| $500 to $799 | 415 (26.2%) | 653 (25.1%) |
| $800 to $999 | 269 (17.0%) | 721 (27.7%) |
| $1,000 to $1,499 | 373 (23.5%) | 665 (25.5%) |
| $1,500 to $1,999 | 151 (9.5%) | 124 (4.8%) |
| $2,000 to $2,499 | 79 (5.0%) | 0 (0.0%) |
| $2,500 to $2,999 | 42 (2.6%) | 0 (0.0%) |
| $3,000 or more | 34 (2.1%) | 68 (2.6%) |
| Total | 1,584 (100.0%) | 2,607 (100.0%) |
Physical Housing Characteristics in Bloomsburg
Housing Structures in Bloomsburg
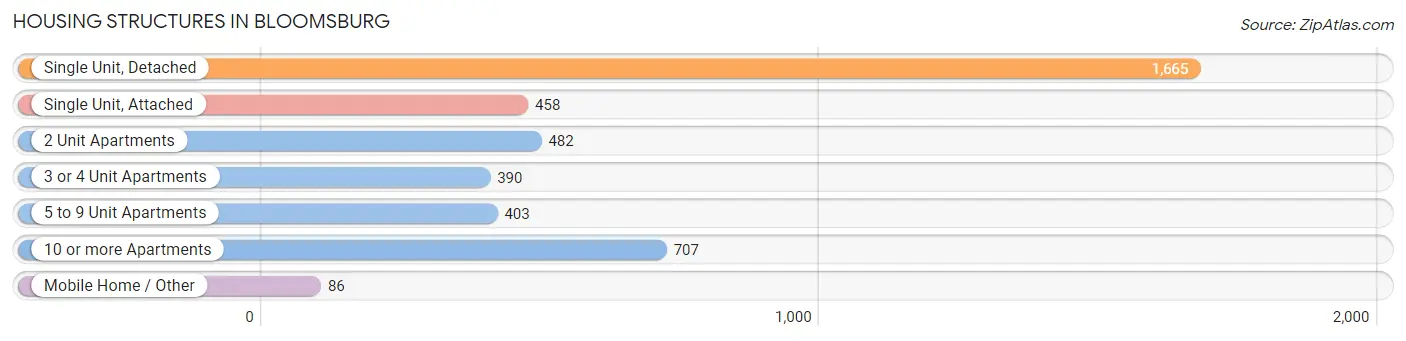
| Structure Type | # Housing Units | % Housing Units |
| Single Unit, Detached | 1,665 | 39.7% |
| Single Unit, Attached | 458 | 10.9% |
| 2 Unit Apartments | 482 | 11.5% |
| 3 or 4 Unit Apartments | 390 | 9.3% |
| 5 to 9 Unit Apartments | 403 | 9.6% |
| 10 or more Apartments | 707 | 16.9% |
| Mobile Home / Other | 86 | 2.1% |
| Total | 4,191 | 100.0% |
Housing Structures by Occupancy in Bloomsburg
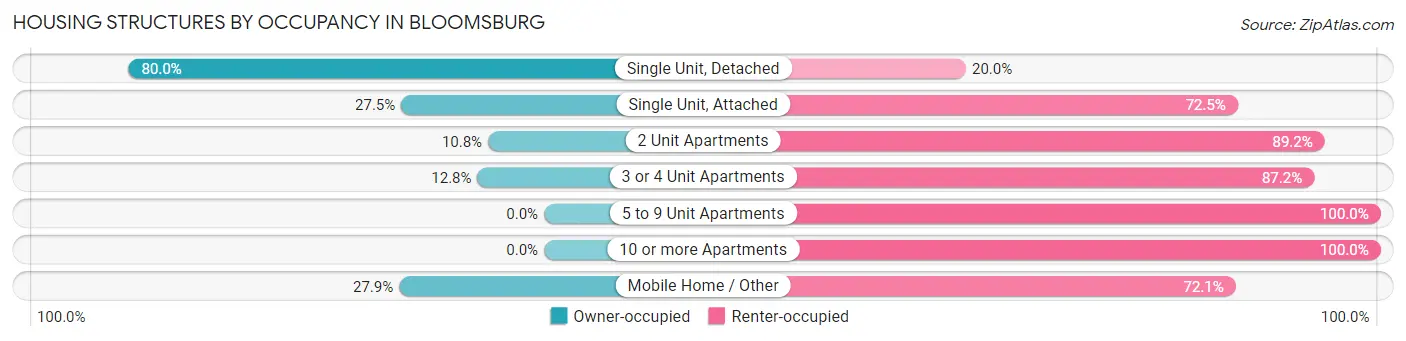
| Structure Type | Owner-occupied | Renter-occupied |
| Single Unit, Detached | 1,332 (80.0%) | 333 (20.0%) |
| Single Unit, Attached | 126 (27.5%) | 332 (72.5%) |
| 2 Unit Apartments | 52 (10.8%) | 430 (89.2%) |
| 3 or 4 Unit Apartments | 50 (12.8%) | 340 (87.2%) |
| 5 to 9 Unit Apartments | 0 (0.0%) | 403 (100.0%) |
| 10 or more Apartments | 0 (0.0%) | 707 (100.0%) |
| Mobile Home / Other | 24 (27.9%) | 62 (72.1%) |
| Total | 1,584 (37.8%) | 2,607 (62.2%) |
Housing Structures by Number of Rooms in Bloomsburg
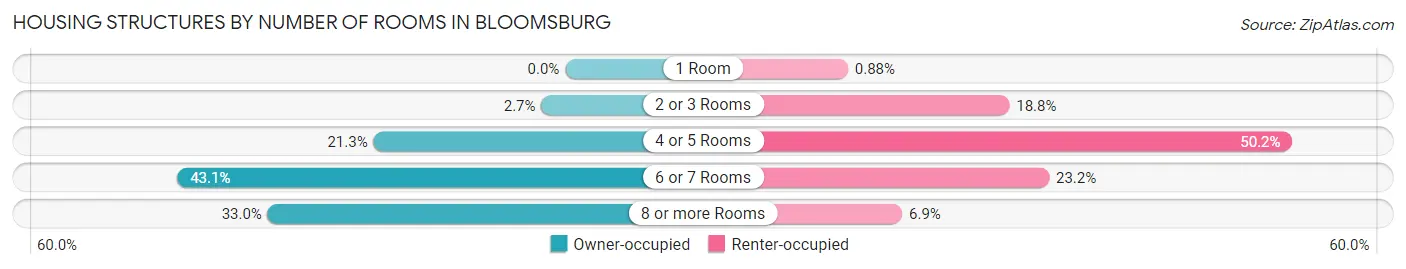
| Number of Rooms | Owner-occupied | Renter-occupied |
| 1 Room | 0 (0.0%) | 23 (0.9%) |
| 2 or 3 Rooms | 42 (2.6%) | 490 (18.8%) |
| 4 or 5 Rooms | 337 (21.3%) | 1,309 (50.2%) |
| 6 or 7 Rooms | 682 (43.1%) | 605 (23.2%) |
| 8 or more Rooms | 523 (33.0%) | 180 (6.9%) |
| Total | 1,584 (100.0%) | 2,607 (100.0%) |
Housing Structure by Heating Type in Bloomsburg
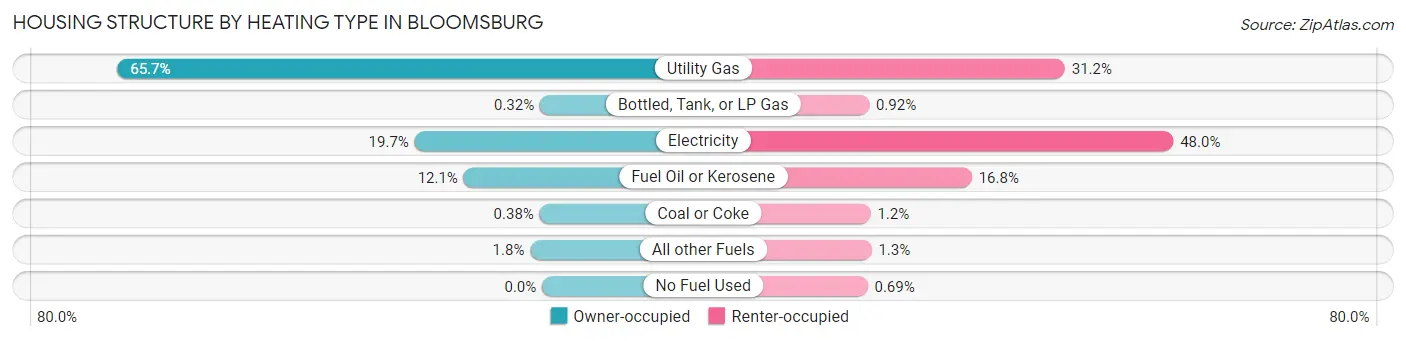
| Heating Type | Owner-occupied | Renter-occupied |
| Utility Gas | 1,040 (65.7%) | 813 (31.2%) |
| Bottled, Tank, or LP Gas | 5 (0.3%) | 24 (0.9%) |
| Electricity | 312 (19.7%) | 1,250 (47.9%) |
| Fuel Oil or Kerosene | 192 (12.1%) | 438 (16.8%) |
| Coal or Coke | 6 (0.4%) | 30 (1.1%) |
| All other Fuels | 29 (1.8%) | 34 (1.3%) |
| No Fuel Used | 0 (0.0%) | 18 (0.7%) |
| Total | 1,584 (100.0%) | 2,607 (100.0%) |
Household Vehicle Usage in Bloomsburg
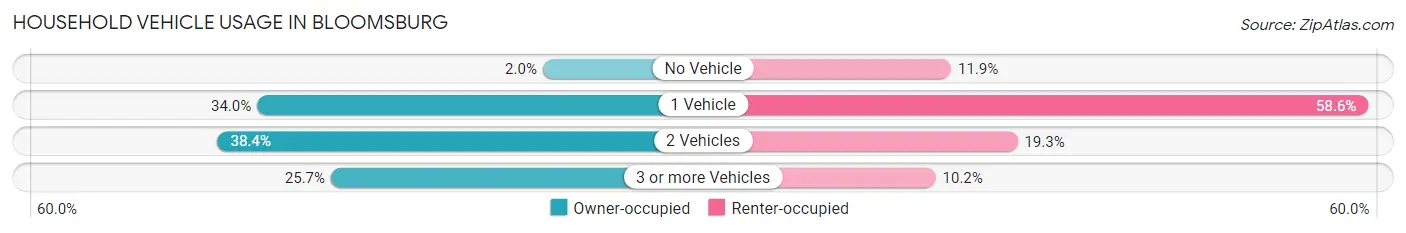
| Vehicles per Household | Owner-occupied | Renter-occupied |
| No Vehicle | 31 (2.0%) | 310 (11.9%) |
| 1 Vehicle | 538 (34.0%) | 1,528 (58.6%) |
| 2 Vehicles | 608 (38.4%) | 504 (19.3%) |
| 3 or more Vehicles | 407 (25.7%) | 265 (10.2%) |
| Total | 1,584 (100.0%) | 2,607 (100.0%) |
Real Estate & Mortgages in Bloomsburg
Real Estate and Mortgage Overview in Bloomsburg
| Characteristic | Without Mortgage | With Mortgage |
| Housing Units | 559 | 1,025 |
| Median Property Value | $166,100 | $180,300 |
| Median Household Income | $49,830 | $247 |
| Monthly Housing Costs | $572 | $34 |
| Real Estate Taxes | $2,419 | $0 |
Property Value by Mortgage Status in Bloomsburg
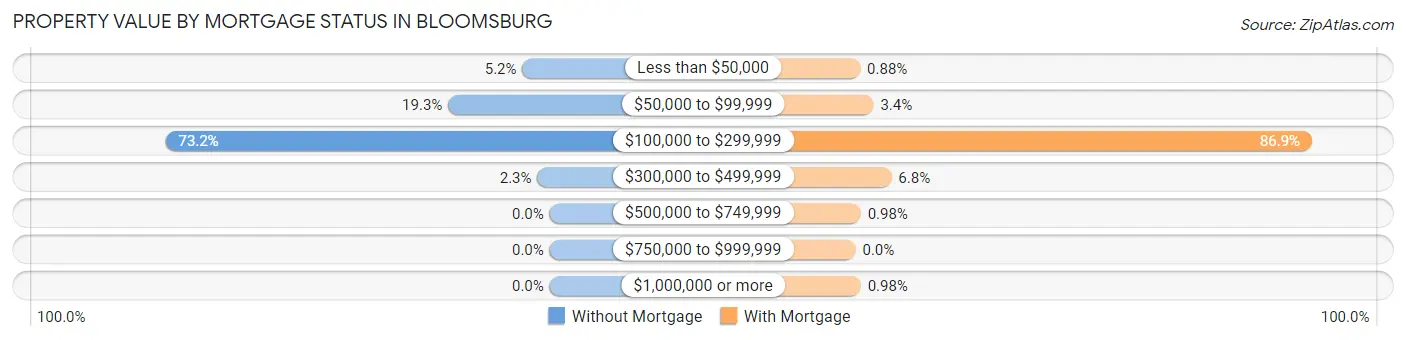
| Property Value | Without Mortgage | With Mortgage |
| Less than $50,000 | 29 (5.2%) | 9 (0.9%) |
| $50,000 to $99,999 | 108 (19.3%) | 35 (3.4%) |
| $100,000 to $299,999 | 409 (73.2%) | 891 (86.9%) |
| $300,000 to $499,999 | 13 (2.3%) | 70 (6.8%) |
| $500,000 to $749,999 | 0 (0.0%) | 10 (1.0%) |
| $750,000 to $999,999 | 0 (0.0%) | 0 (0.0%) |
| $1,000,000 or more | 0 (0.0%) | 10 (1.0%) |
| Total | 559 (100.0%) | 1,025 (100.0%) |
Household Income by Mortgage Status in Bloomsburg
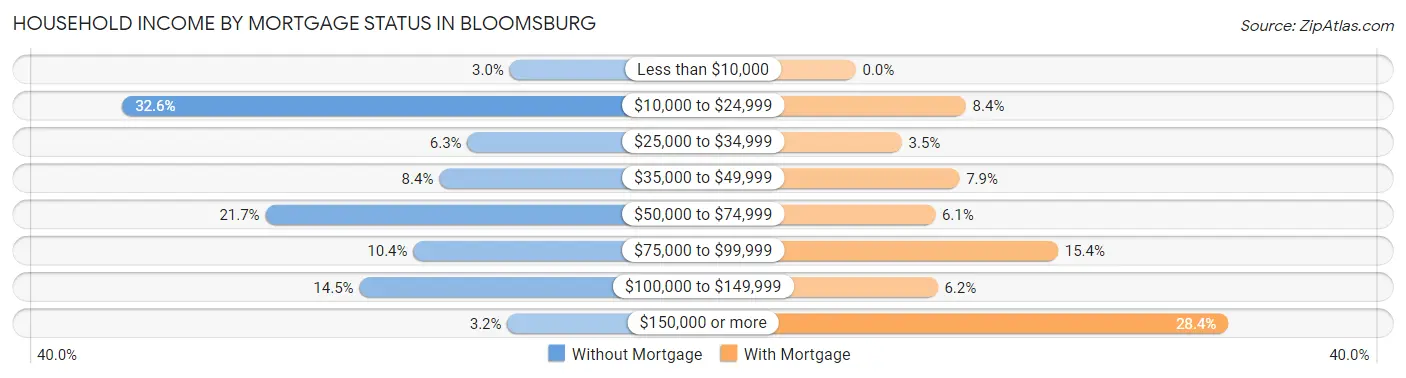
| Household Income | Without Mortgage | With Mortgage |
| Less than $10,000 | 17 (3.0%) | 0 (0.0%) |
| $10,000 to $24,999 | 182 (32.6%) | 86 (8.4%) |
| $25,000 to $34,999 | 35 (6.3%) | 36 (3.5%) |
| $35,000 to $49,999 | 47 (8.4%) | 81 (7.9%) |
| $50,000 to $74,999 | 121 (21.6%) | 62 (6.0%) |
| $75,000 to $99,999 | 58 (10.4%) | 158 (15.4%) |
| $100,000 to $149,999 | 81 (14.5%) | 64 (6.2%) |
| $150,000 or more | 18 (3.2%) | 291 (28.4%) |
| Total | 559 (100.0%) | 1,025 (100.0%) |
Property Value to Household Income Ratio in Bloomsburg
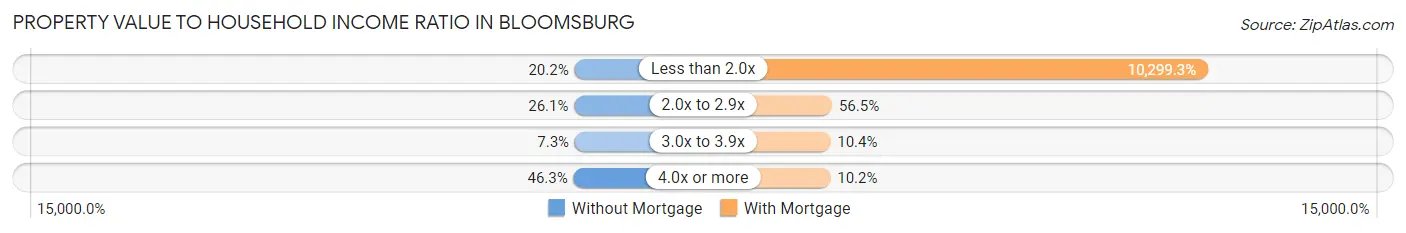
| Value-to-Income Ratio | Without Mortgage | With Mortgage |
| Less than 2.0x | 113 (20.2%) | 105,568 (10,299.3%) |
| 2.0x to 2.9x | 146 (26.1%) | 579 (56.5%) |
| 3.0x to 3.9x | 41 (7.3%) | 107 (10.4%) |
| 4.0x or more | 259 (46.3%) | 105 (10.2%) |
| Total | 559 (100.0%) | 1,025 (100.0%) |
Real Estate Taxes by Mortgage Status in Bloomsburg
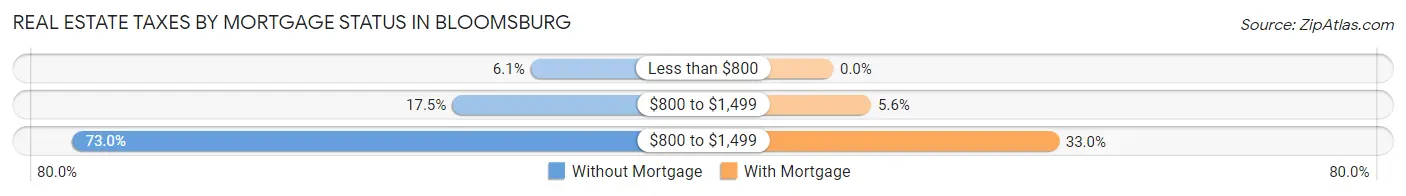
| Property Taxes | Without Mortgage | With Mortgage |
| Less than $800 | 34 (6.1%) | 0 (0.0%) |
| $800 to $1,499 | 98 (17.5%) | 57 (5.6%) |
| $800 to $1,499 | 408 (73.0%) | 338 (33.0%) |
| Total | 559 (100.0%) | 1,025 (100.0%) |
Health & Disability in Bloomsburg
Health Insurance Coverage by Age in Bloomsburg
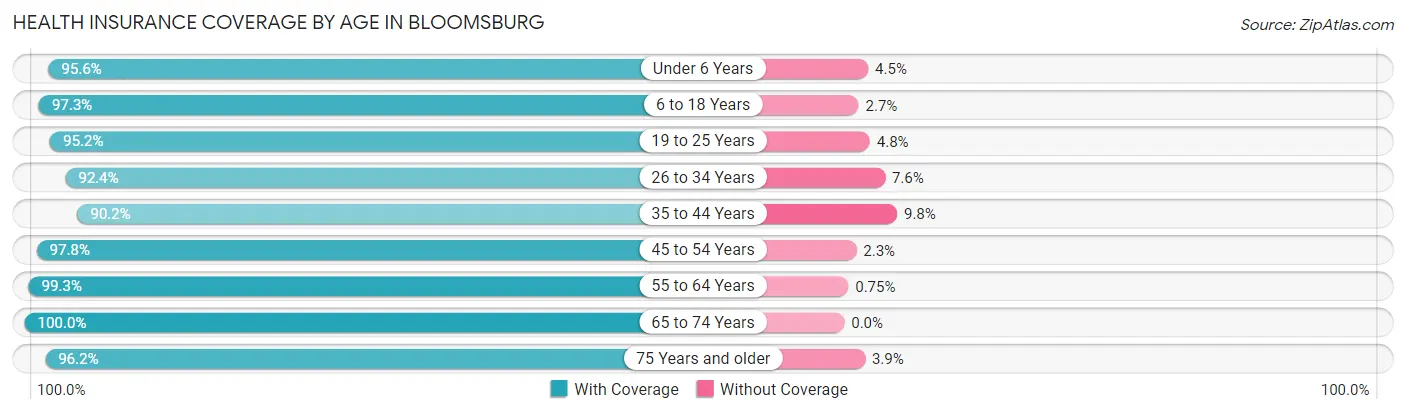
| Age Bracket | With Coverage | Without Coverage |
| Under 6 Years | 515 (95.6%) | 24 (4.4%) |
| 6 to 18 Years | 2,186 (97.3%) | 60 (2.7%) |
| 19 to 25 Years | 4,158 (95.2%) | 208 (4.8%) |
| 26 to 34 Years | 1,059 (92.4%) | 87 (7.6%) |
| 35 to 44 Years | 999 (90.2%) | 109 (9.8%) |
| 45 to 54 Years | 740 (97.8%) | 17 (2.2%) |
| 55 to 64 Years | 924 (99.3%) | 7 (0.7%) |
| 65 to 74 Years | 794 (100.0%) | 0 (0.0%) |
| 75 Years and older | 599 (96.2%) | 24 (3.8%) |
| Total | 11,974 (95.7%) | 536 (4.3%) |
Health Insurance Coverage by Citizenship Status in Bloomsburg
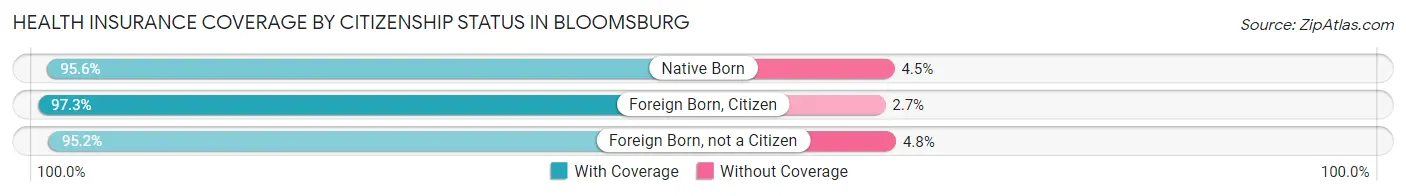
| Citizenship Status | With Coverage | Without Coverage |
| Native Born | 515 (95.6%) | 24 (4.4%) |
| Foreign Born, Citizen | 2,186 (97.3%) | 60 (2.7%) |
| Foreign Born, not a Citizen | 4,158 (95.2%) | 208 (4.8%) |
Health Insurance Coverage by Household Income in Bloomsburg
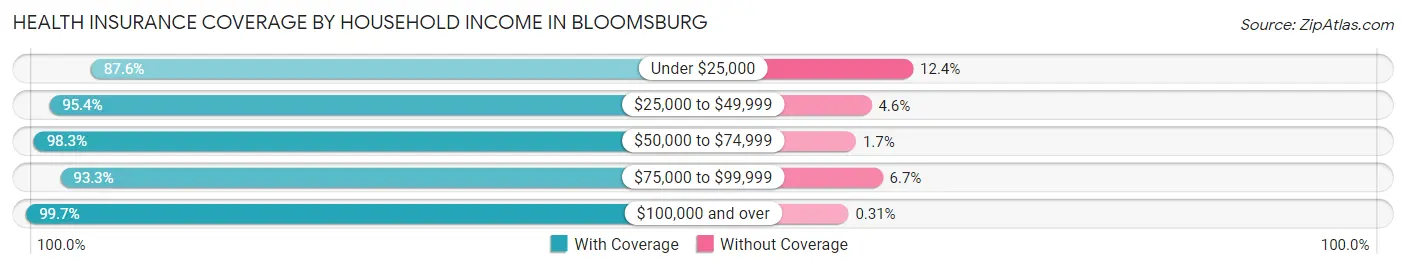
| Household Income | With Coverage | Without Coverage |
| Under $25,000 | 2,212 (87.6%) | 314 (12.4%) |
| $25,000 to $49,999 | 1,506 (95.4%) | 73 (4.6%) |
| $50,000 to $74,999 | 1,596 (98.3%) | 28 (1.7%) |
| $75,000 to $99,999 | 1,181 (93.3%) | 85 (6.7%) |
| $100,000 and over | 2,279 (99.7%) | 7 (0.3%) |
Public vs Private Health Insurance Coverage by Age in Bloomsburg
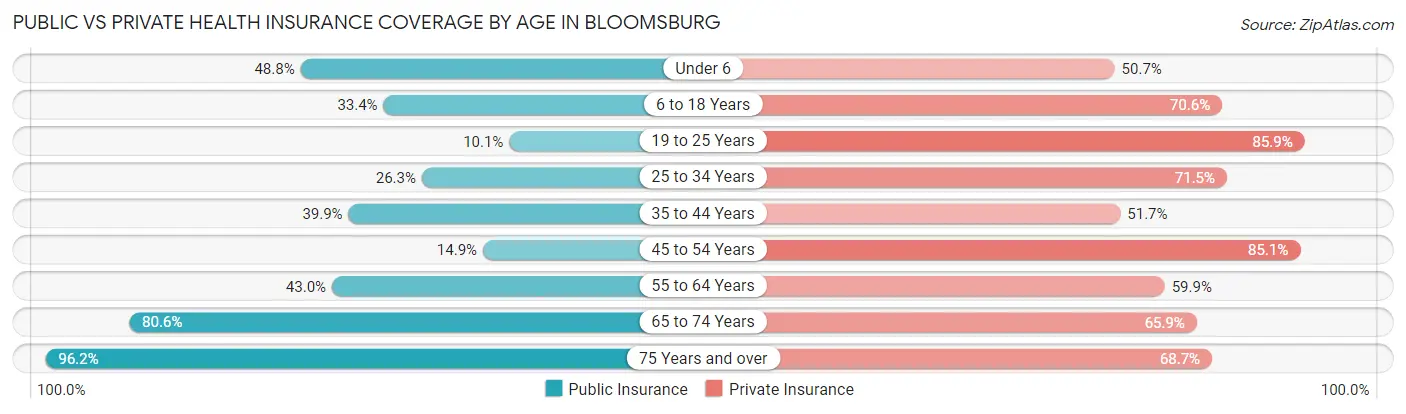
| Age Bracket | Public Insurance | Private Insurance |
| Under 6 | 263 (48.8%) | 273 (50.6%) |
| 6 to 18 Years | 750 (33.4%) | 1,585 (70.6%) |
| 19 to 25 Years | 439 (10.1%) | 3,750 (85.9%) |
| 25 to 34 Years | 301 (26.3%) | 819 (71.5%) |
| 35 to 44 Years | 442 (39.9%) | 573 (51.7%) |
| 45 to 54 Years | 113 (14.9%) | 644 (85.1%) |
| 55 to 64 Years | 400 (43.0%) | 558 (59.9%) |
| 65 to 74 Years | 640 (80.6%) | 523 (65.9%) |
| 75 Years and over | 599 (96.2%) | 428 (68.7%) |
| Total | 3,947 (31.6%) | 9,153 (73.2%) |
Disability Status by Sex by Age in Bloomsburg
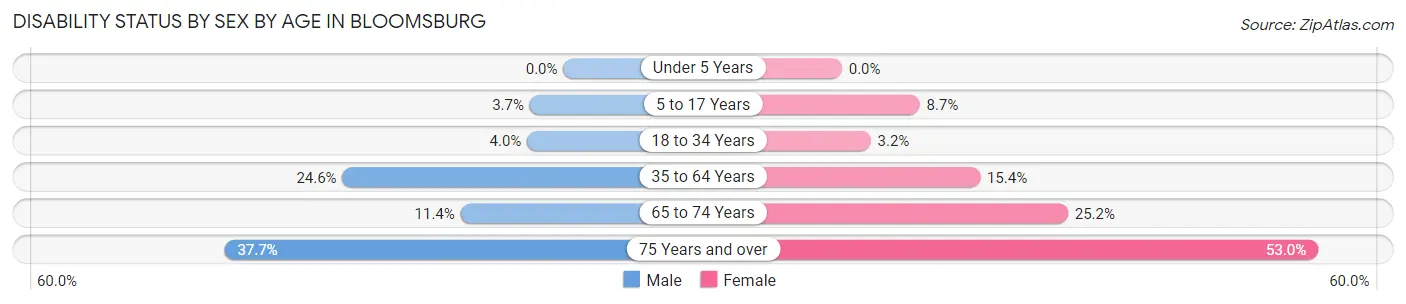
| Age Bracket | Male | Female |
| Under 5 Years | 0 (0.0%) | 0 (0.0%) |
| 5 to 17 Years | 22 (3.7%) | 38 (8.7%) |
| 18 to 34 Years | 127 (4.0%) | 116 (3.2%) |
| 35 to 64 Years | 293 (24.6%) | 247 (15.4%) |
| 65 to 74 Years | 39 (11.4%) | 114 (25.2%) |
| 75 Years and over | 80 (37.7%) | 218 (53.0%) |
Disability Class by Sex by Age in Bloomsburg
Disability Class: Hearing Difficulty
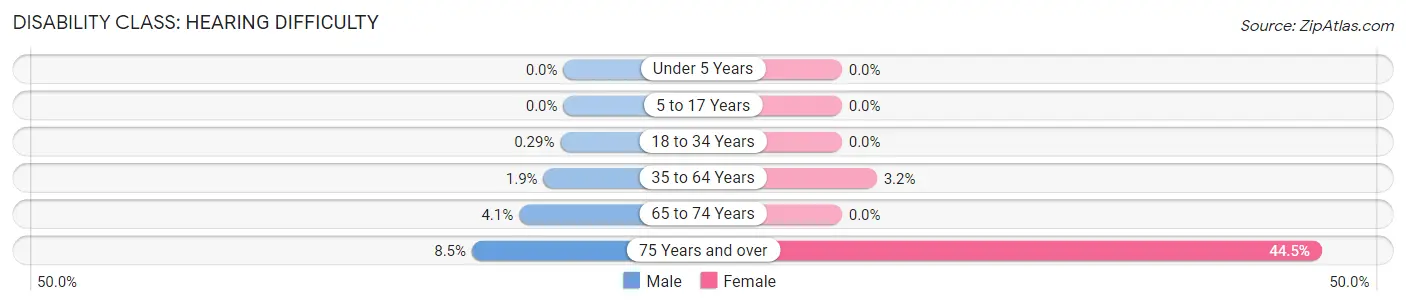
| Age Bracket | Male | Female |
| Under 5 Years | 0 (0.0%) | 0 (0.0%) |
| 5 to 17 Years | 0 (0.0%) | 0 (0.0%) |
| 18 to 34 Years | 9 (0.3%) | 0 (0.0%) |
| 35 to 64 Years | 22 (1.8%) | 52 (3.2%) |
| 65 to 74 Years | 14 (4.1%) | 0 (0.0%) |
| 75 Years and over | 18 (8.5%) | 183 (44.5%) |
Disability Class: Vision Difficulty
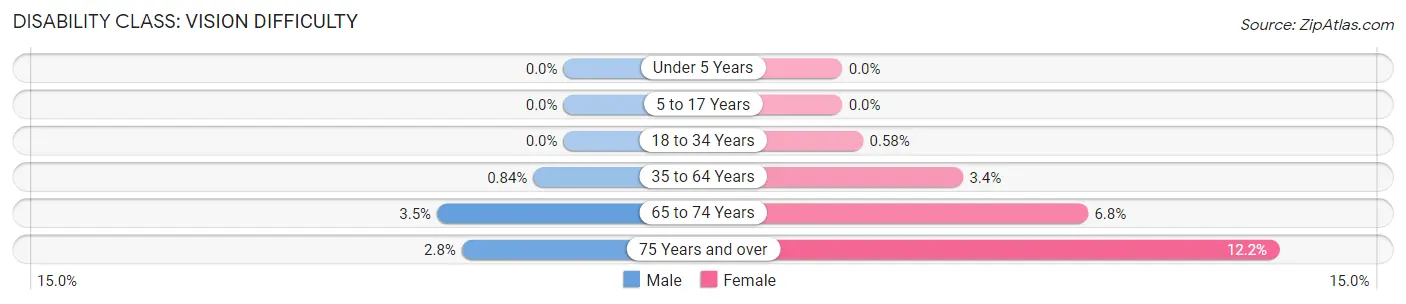
| Age Bracket | Male | Female |
| Under 5 Years | 0 (0.0%) | 0 (0.0%) |
| 5 to 17 Years | 0 (0.0%) | 0 (0.0%) |
| 18 to 34 Years | 0 (0.0%) | 21 (0.6%) |
| 35 to 64 Years | 10 (0.8%) | 54 (3.4%) |
| 65 to 74 Years | 12 (3.5%) | 31 (6.8%) |
| 75 Years and over | 6 (2.8%) | 50 (12.2%) |
Disability Class: Cognitive Difficulty
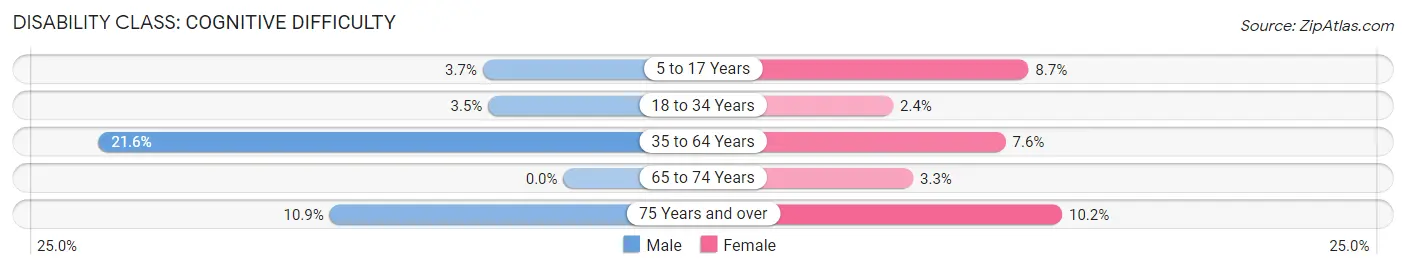
| Age Bracket | Male | Female |
| 5 to 17 Years | 22 (3.7%) | 38 (8.7%) |
| 18 to 34 Years | 110 (3.5%) | 86 (2.4%) |
| 35 to 64 Years | 257 (21.6%) | 122 (7.6%) |
| 65 to 74 Years | 0 (0.0%) | 15 (3.3%) |
| 75 Years and over | 23 (10.8%) | 42 (10.2%) |
Disability Class: Ambulatory Difficulty
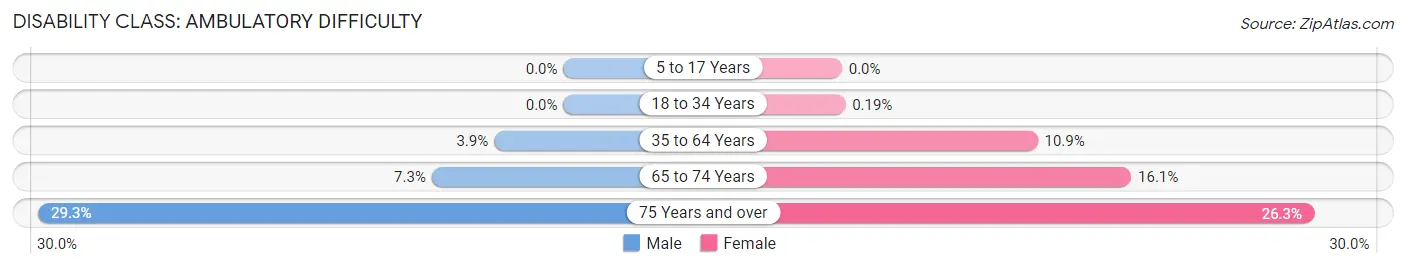
| Age Bracket | Male | Female |
| 5 to 17 Years | 0 (0.0%) | 0 (0.0%) |
| 18 to 34 Years | 0 (0.0%) | 7 (0.2%) |
| 35 to 64 Years | 46 (3.9%) | 175 (10.9%) |
| 65 to 74 Years | 25 (7.3%) | 73 (16.1%) |
| 75 Years and over | 62 (29.2%) | 108 (26.3%) |
Disability Class: Self-Care Difficulty
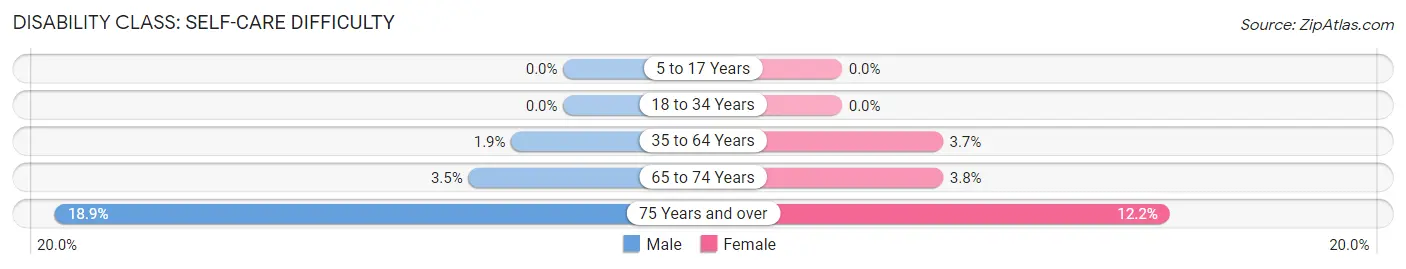
| Age Bracket | Male | Female |
| 5 to 17 Years | 0 (0.0%) | 0 (0.0%) |
| 18 to 34 Years | 0 (0.0%) | 0 (0.0%) |
| 35 to 64 Years | 23 (1.9%) | 60 (3.7%) |
| 65 to 74 Years | 12 (3.5%) | 17 (3.7%) |
| 75 Years and over | 40 (18.9%) | 50 (12.2%) |
Technology Access in Bloomsburg
Computing Device Access in Bloomsburg
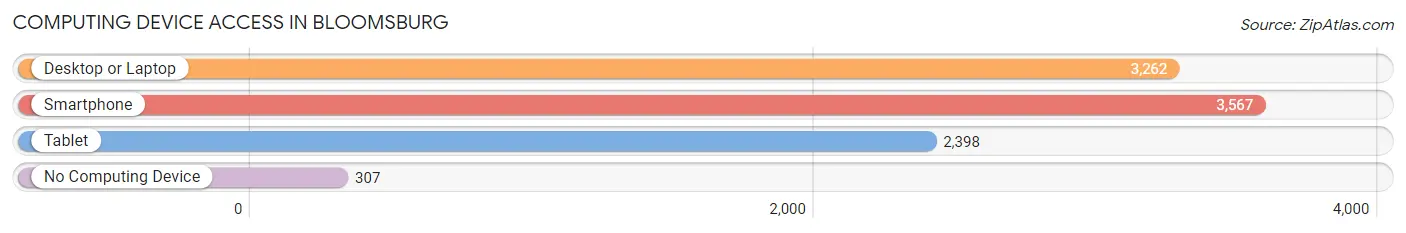
| Device Type | # Households | % Households |
| Desktop or Laptop | 3,262 | 77.8% |
| Smartphone | 3,567 | 85.1% |
| Tablet | 2,398 | 57.2% |
| No Computing Device | 307 | 7.3% |
| Total | 4,191 | 100.0% |
Internet Access in Bloomsburg
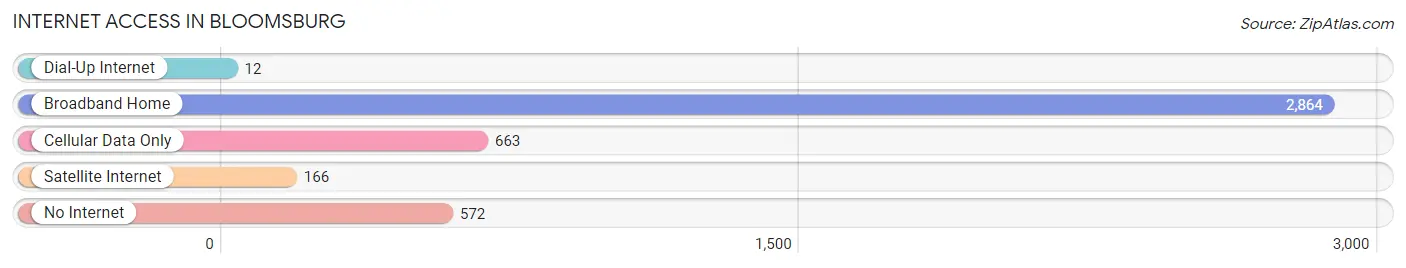
| Internet Type | # Households | % Households |
| Dial-Up Internet | 12 | 0.3% |
| Broadband Home | 2,864 | 68.3% |
| Cellular Data Only | 663 | 15.8% |
| Satellite Internet | 166 | 4.0% |
| No Internet | 572 | 13.7% |
| Total | 4,191 | 100.0% |
Bloomsburg Summary
Bloomsburg, Pennsylvania is a small town located in the northeastern part of the state, in Columbia County. It is situated along the Susquehanna River, and is the county seat of Columbia County. The town has a population of 14,855, according to the 2010 census.
History
Bloomsburg was founded in 1772 by a group of German settlers led by Johann Conrad Beissel. The town was originally known as “Bloom’s Town”, after the first settler, Jacob Bloom. The town was incorporated in 1802, and was named the county seat of Columbia County in 1813.
In the 19th century, Bloomsburg was an important center for the lumber industry, and the town was home to several sawmills and gristmills. The town was also a major stop on the Susquehanna and Tidewater Canal, which connected the Susquehanna River to the Chesapeake Bay.
In the late 19th century, Bloomsburg became an important center for the coal mining industry. The town was home to several coal mines, and the coal industry was the main source of employment for the town’s residents.
Geography
Bloomsburg is located in the northeastern part of Pennsylvania, in Columbia County. The town is situated along the Susquehanna River, and is located about 30 miles south of Wilkes-Barre. The town is located in the Ridge and Valley region of the Appalachian Mountains, and is surrounded by rolling hills and valleys.
The climate in Bloomsburg is humid continental, with cold winters and hot, humid summers. The average annual temperature is 48°F, and the average annual precipitation is 40 inches.
Economy
The economy of Bloomsburg is largely based on education and healthcare. The town is home to Bloomsburg University of Pennsylvania, which is the largest employer in the town. The university employs over 2,000 people, and has an annual economic impact of over $400 million.
The town is also home to several healthcare facilities, including Geisinger Bloomsburg Hospital and Bloomsburg Health Care Center. These facilities employ over 1,000 people, and provide healthcare services to the residents of Bloomsburg and the surrounding area.
The town is also home to several manufacturing companies, including Bloomsburg Mills, which produces textiles, and Bloomsburg Metal Works, which produces metal products.
Demographics
According to the 2010 census, the population of Bloomsburg was 14,855. The racial makeup of the town was 94.3% White, 2.3% African American, 0.4% Native American, 0.9% Asian, 0.1% Pacific Islander, and 1.9% from other races. The median household income was $37,945, and the median family income was $48,919.
Bloomsburg is a small town with a rich history and a diverse economy. The town is home to a large university, several healthcare facilities, and several manufacturing companies. The town has a population of 14,855, and the median household income is $37,945.
Common Questions
What is Per Capita Income in Bloomsburg?
Per Capita income in Bloomsburg is $21,313.
What is the Median Family Income in Bloomsburg?
Median Family Income in Bloomsburg is $70,775.
What is the Median Household income in Bloomsburg?
Median Household Income in Bloomsburg is $46,019.
What is Income or Wage Gap in Bloomsburg?
Income or Wage Gap in Bloomsburg is 44.0%.
Women in Bloomsburg earn 56.0 cents for every dollar earned by a man.
What is Inequality or Gini Index in Bloomsburg?
Inequality or Gini Index in Bloomsburg is 0.50.
What is the Total Population of Bloomsburg?
Total Population of Bloomsburg is 12,836.
What is the Total Male Population of Bloomsburg?
Total Male Population of Bloomsburg is 5,869.
What is the Total Female Population of Bloomsburg?
Total Female Population of Bloomsburg is 6,967.
What is the Ratio of Males per 100 Females in Bloomsburg?
There are 84.24 Males per 100 Females in Bloomsburg.
What is the Ratio of Females per 100 Males in Bloomsburg?
There are 118.71 Females per 100 Males in Bloomsburg.
What is the Median Population Age in Bloomsburg?
Median Population Age in Bloomsburg is 23.1 Years.
What is the Average Family Size in Bloomsburg
Average Family Size in Bloomsburg is 3.0 People.
What is the Average Household Size in Bloomsburg
Average Household Size in Bloomsburg is 2.2 People.
How Large is the Labor Force in Bloomsburg?
There are 5,679 People in the Labor Forcein in Bloomsburg.
What is the Percentage of People in the Labor Force in Bloomsburg?
49.3% of People are in the Labor Force in Bloomsburg.
What is the Unemployment Rate in Bloomsburg?
Unemployment Rate in Bloomsburg is 5.4%.