New Kingstown, PA Map & Demographics
New Kingstown Map
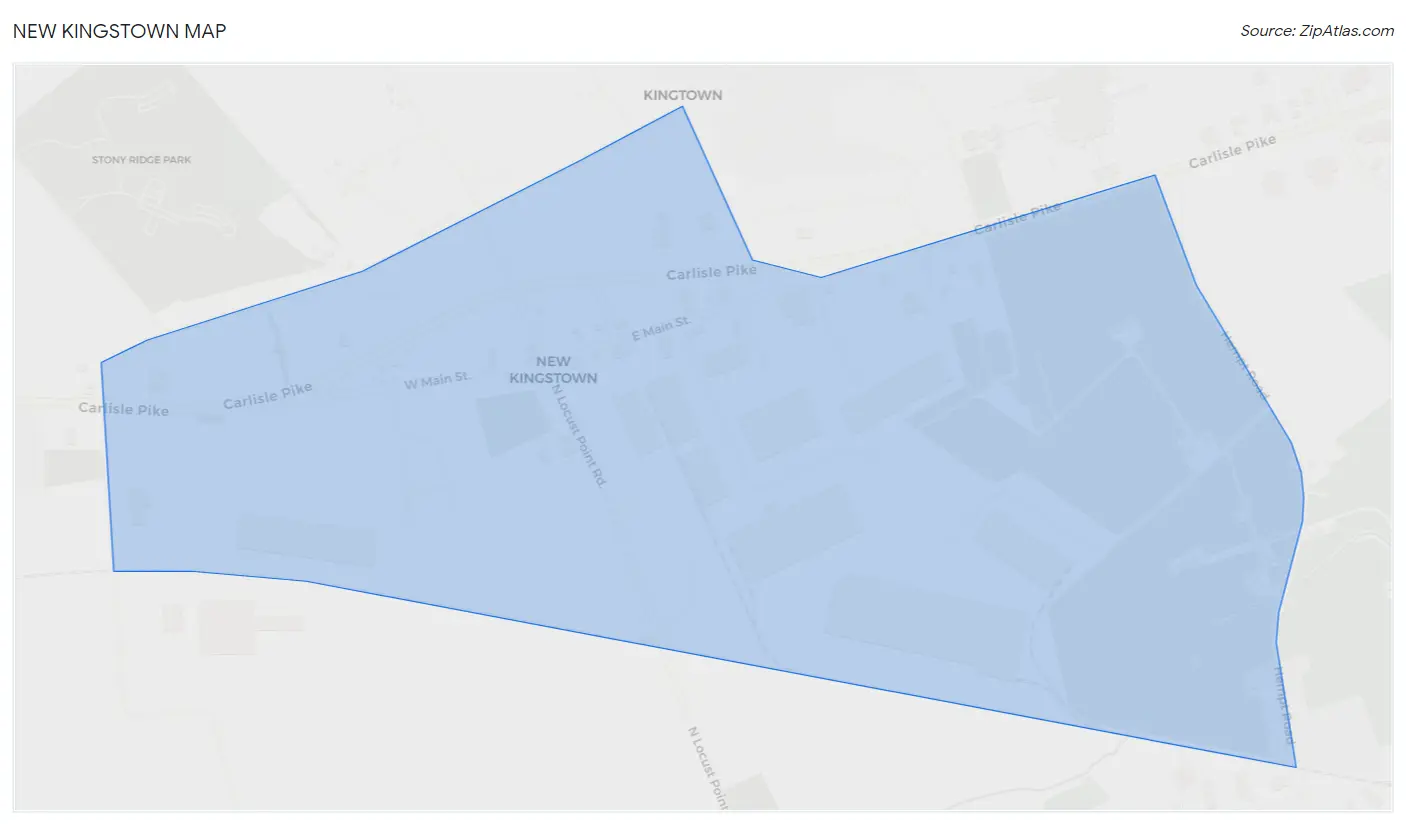
New Kingstown Overview
$22,030
PER CAPITA INCOME
$107,548
AVG FAMILY INCOME
0.59
INEQUALITY / GINI INDEX
715
TOTAL POPULATION
365
MALE POPULATION
350
FEMALE POPULATION
104.29
MALES / 100 FEMALES
95.89
FEMALES / 100 MALES
44.0
MEDIAN AGE
3.5
AVG FAMILY SIZE
2.0
AVG HOUSEHOLD SIZE
356
LABOR FORCE [ PEOPLE ]
61.6%
PERCENT IN LABOR FORCE
16.9%
UNEMPLOYMENT RATE
New Kingstown Area Codes
Income in New Kingstown
Income Overview in New Kingstown
| Characteristic | Number | Measure |
| Per Capita Income | 715 | $22,030 |
| Median Family Income | 132 | $107,548 |
| Mean Family Income | 132 | $82,377 |
| Median Household Income | 353 | $0 |
| Mean Household Income | 353 | $44,461 |
| Income Deficit | 132 | $0 |
| Wage / Income Gap (%) | 715 | 0.00% |
| Wage / Income Gap ($) | 715 | 100.00¢ per $1 |
| Gini / Inequality Index | 715 | 0.59 |
Earnings by Sex in New Kingstown
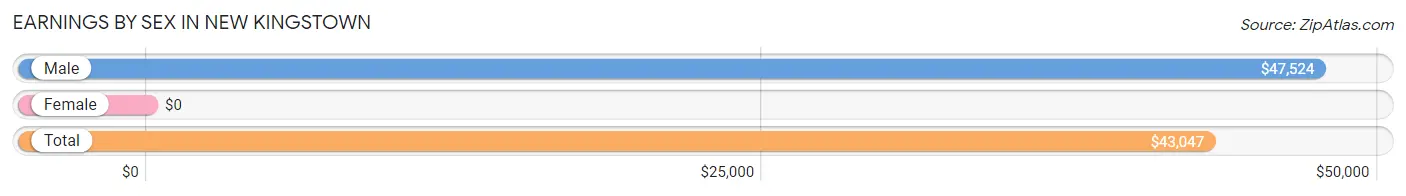
| Sex | Number | Average Earnings |
| Male | 167 (56.4%) | $47,524 |
| Female | 129 (43.6%) | $0 |
| Total | 296 (100.0%) | $43,047 |
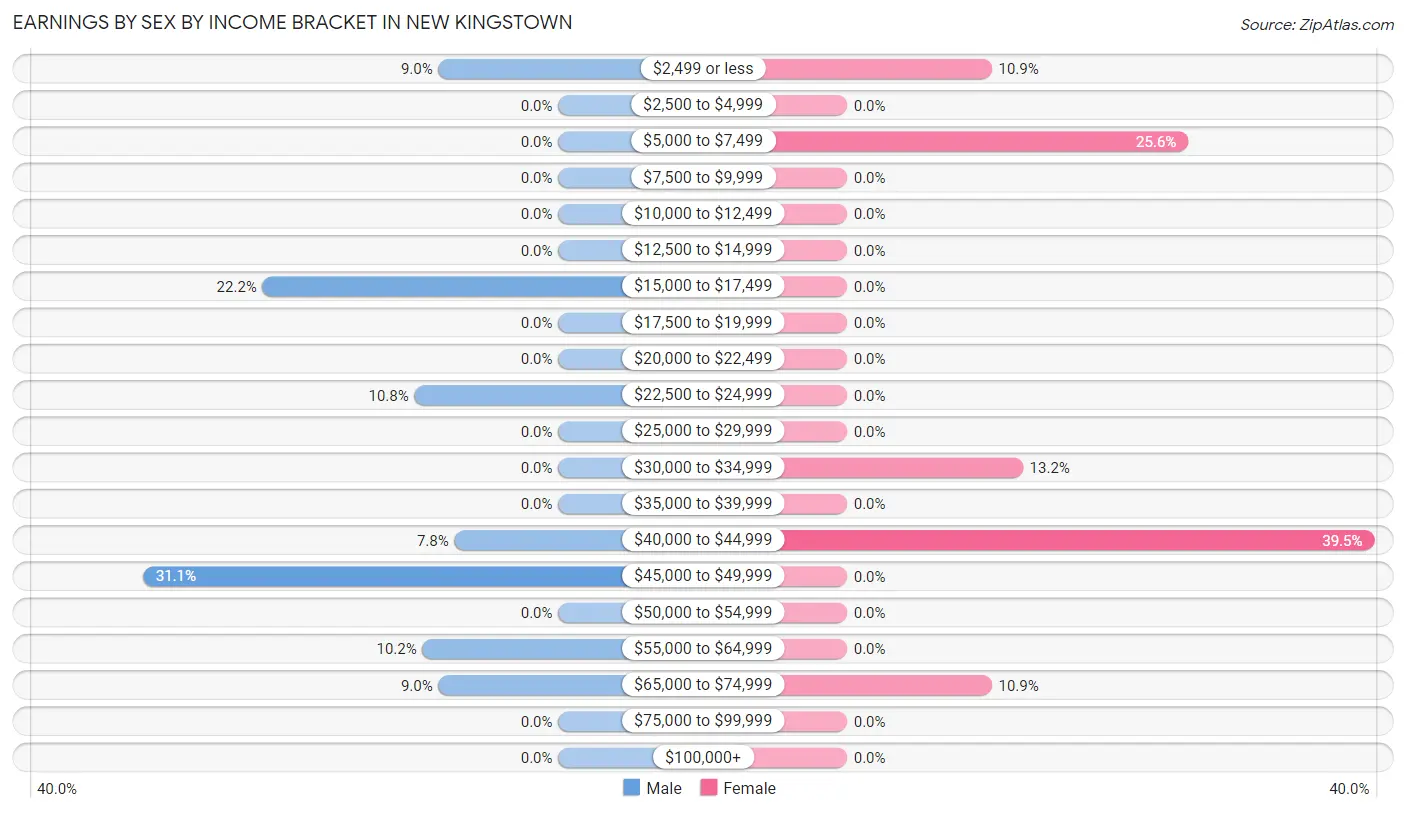
Earnings by Sex by Income Bracket in New Kingstown
The most common earnings brackets in New Kingstown are $45,000 to $49,999 for men (52 | 31.1%) and $40,000 to $44,999 for women (51 | 39.5%).
| Income | Male | Female |
| $2,499 or less | 15 (9.0%) | 14 (10.8%) |
| $2,500 to $4,999 | 0 (0.0%) | 0 (0.0%) |
| $5,000 to $7,499 | 0 (0.0%) | 33 (25.6%) |
| $7,500 to $9,999 | 0 (0.0%) | 0 (0.0%) |
| $10,000 to $12,499 | 0 (0.0%) | 0 (0.0%) |
| $12,500 to $14,999 | 0 (0.0%) | 0 (0.0%) |
| $15,000 to $17,499 | 37 (22.2%) | 0 (0.0%) |
| $17,500 to $19,999 | 0 (0.0%) | 0 (0.0%) |
| $20,000 to $22,499 | 0 (0.0%) | 0 (0.0%) |
| $22,500 to $24,999 | 18 (10.8%) | 0 (0.0%) |
| $25,000 to $29,999 | 0 (0.0%) | 0 (0.0%) |
| $30,000 to $34,999 | 0 (0.0%) | 17 (13.2%) |
| $35,000 to $39,999 | 0 (0.0%) | 0 (0.0%) |
| $40,000 to $44,999 | 13 (7.8%) | 51 (39.5%) |
| $45,000 to $49,999 | 52 (31.1%) | 0 (0.0%) |
| $50,000 to $54,999 | 0 (0.0%) | 0 (0.0%) |
| $55,000 to $64,999 | 17 (10.2%) | 0 (0.0%) |
| $65,000 to $74,999 | 15 (9.0%) | 14 (10.8%) |
| $75,000 to $99,999 | 0 (0.0%) | 0 (0.0%) |
| $100,000+ | 0 (0.0%) | 0 (0.0%) |
| Total | 167 (100.0%) | 129 (100.0%) |
Earnings by Sex by Educational Attainment in New Kingstown
| Educational Attainment | Male Income | Female Income |
| Less than High School | - | - |
| High School Diploma | - | - |
| College or Associate's Degree | - | - |
| Bachelor's Degree | - | - |
| Graduate Degree | - | - |
| Total | $47,524 | $0 |
Family Income in New Kingstown
Family Income Brackets in New Kingstown
According to the New Kingstown family income data, there are 67 families falling into the $100,000 to $149,999 income range, which is the most common income bracket and makes up 50.8% of all families.
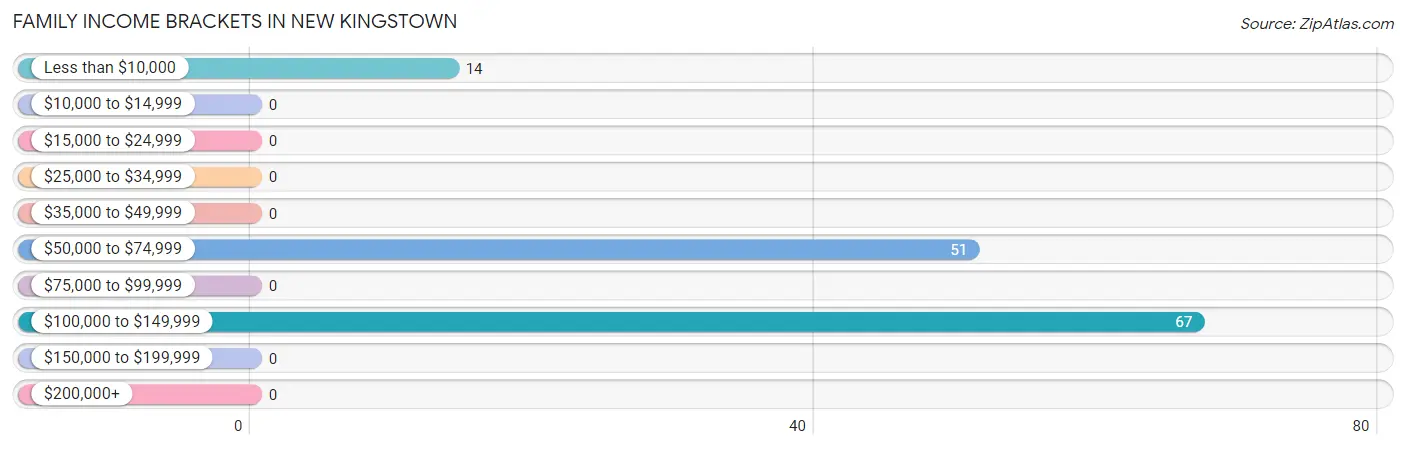
| Income Bracket | # Families | % Families |
| Less than $10,000 | 14 | 10.6% |
| $10,000 to $14,999 | 0 | 0.0% |
| $15,000 to $24,999 | 0 | 0.0% |
| $25,000 to $34,999 | 0 | 0.0% |
| $35,000 to $49,999 | 0 | 0.0% |
| $50,000 to $74,999 | 51 | 38.6% |
| $75,000 to $99,999 | 0 | 0.0% |
| $100,000 to $149,999 | 67 | 50.8% |
| $150,000 to $199,999 | 0 | 0.0% |
| $200,000+ | 0 | 0.0% |
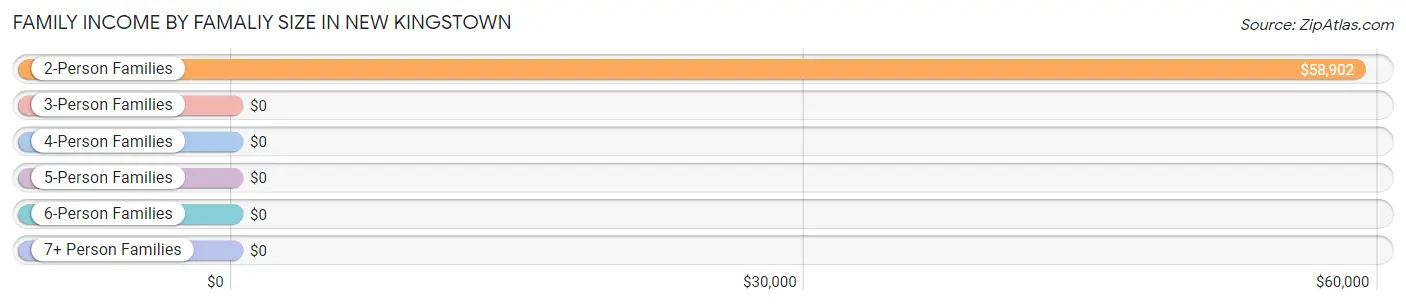
Family Income by Famaliy Size in New Kingstown
2-person families (65 | 49.2%) account for the highest median family income in New Kingstown with $58,902 per family, while 2-person families (65 | 49.2%) have the highest median income of $29,451 per family member.
| Income Bracket | # Families | Median Income |
| 2-Person Families | 65 (49.2%) | $58,902 |
| 3-Person Families | 0 (0.0%) | $0 |
| 4-Person Families | 52 (39.4%) | $0 |
| 5-Person Families | 0 (0.0%) | $0 |
| 6-Person Families | 0 (0.0%) | $0 |
| 7+ Person Families | 15 (11.4%) | $0 |
| Total | 132 (100.0%) | $107,548 |
Family Income by Number of Earners in New Kingstown
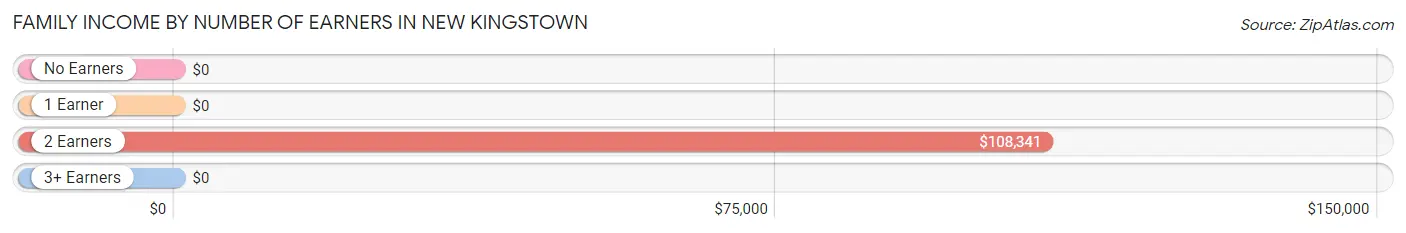
| Number of Earners | # Families | Median Income |
| No Earners | 33 (25.0%) | $0 |
| 1 Earner | 0 (0.0%) | $0 |
| 2 Earners | 99 (75.0%) | $108,341 |
| 3+ Earners | 0 (0.0%) | $0 |
| Total | 132 (100.0%) | $107,548 |
Household Income in New Kingstown
Household Income Brackets in New Kingstown
With 142 households falling in the category, the less than $10,000 income range is the most frequent in New Kingstown, accounting for 40.2% of all households.
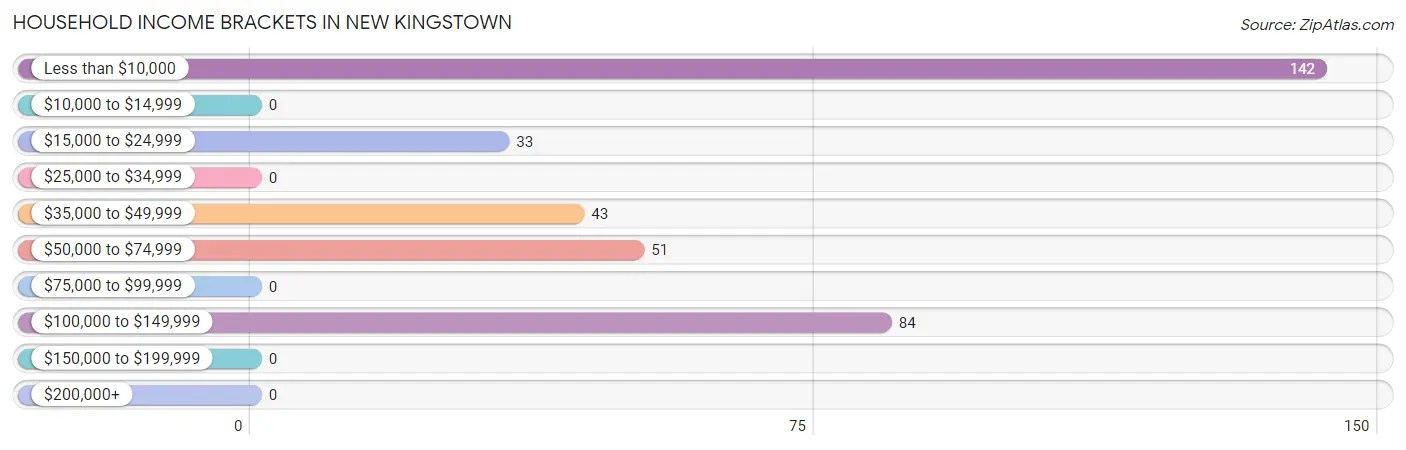
| Income Bracket | # Households | % Households |
| Less than $10,000 | 142 | 40.2% |
| $10,000 to $14,999 | 0 | 0.0% |
| $15,000 to $24,999 | 33 | 9.3% |
| $25,000 to $34,999 | 0 | 0.0% |
| $35,000 to $49,999 | 43 | 12.2% |
| $50,000 to $74,999 | 51 | 14.4% |
| $75,000 to $99,999 | 0 | 0.0% |
| $100,000 to $149,999 | 84 | 23.8% |
| $150,000 to $199,999 | 0 | 0.0% |
| $200,000+ | 0 | 0.0% |
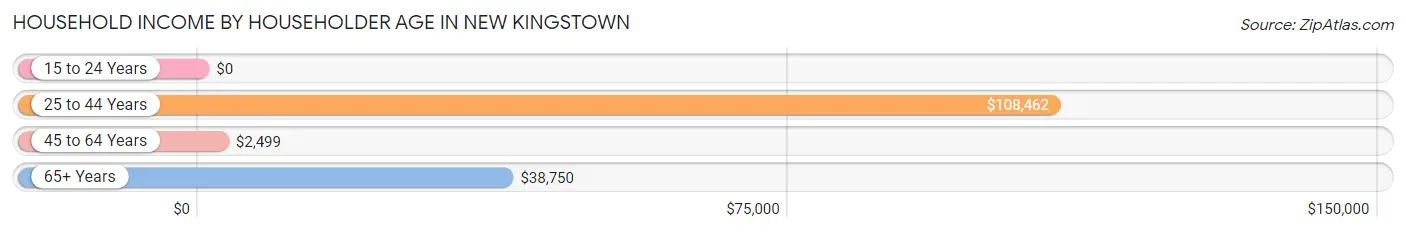
Household Income by Householder Age in New Kingstown
The median household income in New Kingstown is $0, with the highest median household income of $108,462 found in the 25 to 44 years age bracket for the primary householder. A total of 94 households (26.6%) fall into this category.
| Income Bracket | # Households | Median Income |
| 15 to 24 Years | 0 (0.0%) | $0 |
| 25 to 44 Years | 94 (26.6%) | $108,462 |
| 45 to 64 Years | 163 (46.2%) | $2,499 |
| 65+ Years | 96 (27.2%) | $38,750 |
| Total | 353 (100.0%) | $0 |
Poverty in New Kingstown
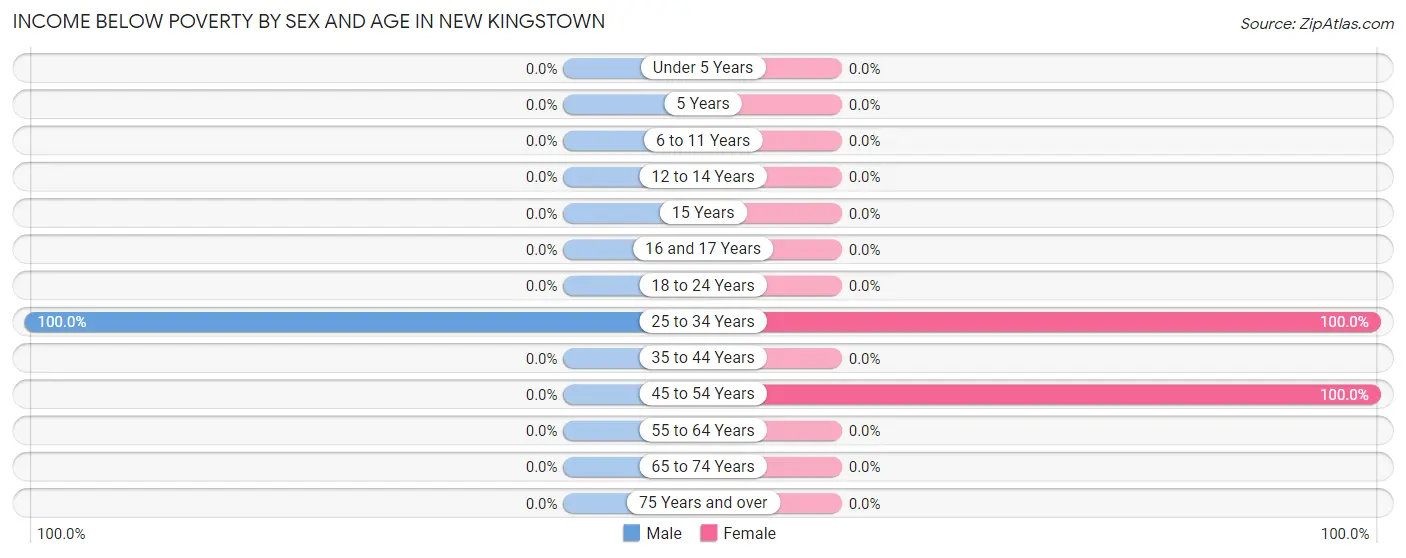
Income Below Poverty by Sex and Age in New Kingstown
With 4.1% poverty level for males and 40.6% for females among the residents of New Kingstown, 25 to 34 year old males and 25 to 34 year old females are the most vulnerable to poverty, with 15 males (100.0%) and 14 females (100.0%) in their respective age groups living below the poverty level.
| Age Bracket | Male | Female |
| Under 5 Years | 0 (0.0%) | 0 (0.0%) |
| 5 Years | 0 (0.0%) | 0 (0.0%) |
| 6 to 11 Years | 0 (0.0%) | 0 (0.0%) |
| 12 to 14 Years | 0 (0.0%) | 0 (0.0%) |
| 15 Years | 0 (0.0%) | 0 (0.0%) |
| 16 and 17 Years | 0 (0.0%) | 0 (0.0%) |
| 18 to 24 Years | 0 (0.0%) | 0 (0.0%) |
| 25 to 34 Years | 15 (100.0%) | 14 (100.0%) |
| 35 to 44 Years | 0 (0.0%) | 0 (0.0%) |
| 45 to 54 Years | 0 (0.0%) | 128 (100.0%) |
| 55 to 64 Years | 0 (0.0%) | 0 (0.0%) |
| 65 to 74 Years | 0 (0.0%) | 0 (0.0%) |
| 75 Years and over | 0 (0.0%) | 0 (0.0%) |
| Total | 15 (4.1%) | 142 (40.6%) |
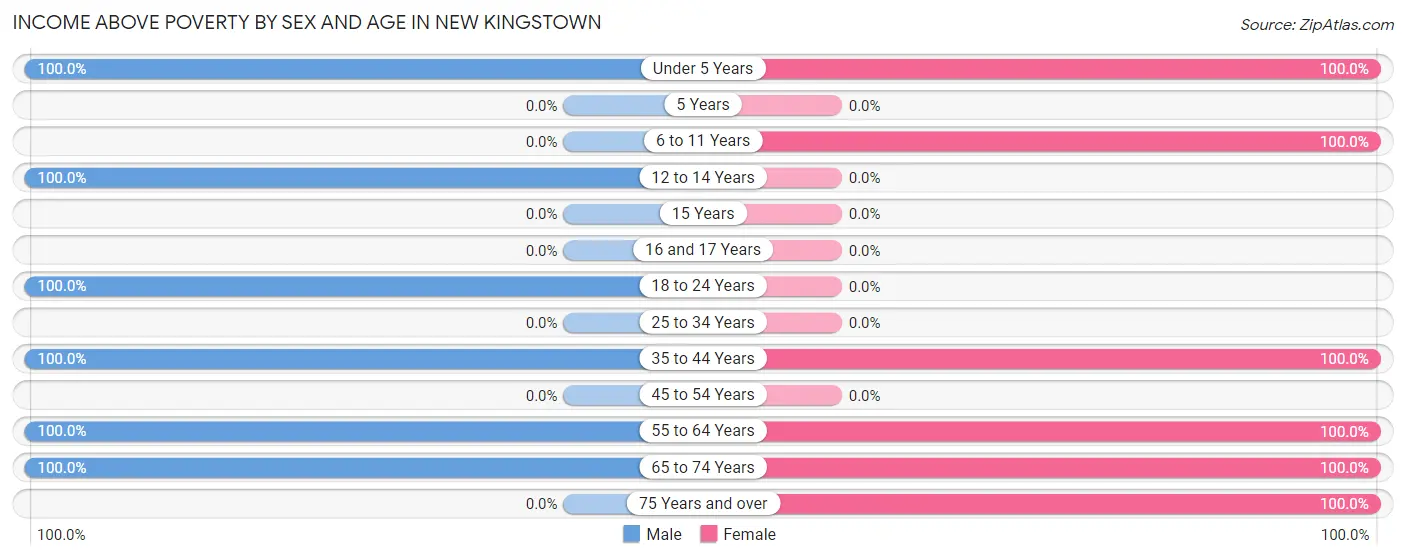
Income Above Poverty by Sex and Age in New Kingstown
According to the poverty statistics in New Kingstown, males aged under 5 years and females aged under 5 years are the age groups that are most secure financially, with 100.0% of males and 100.0% of females in these age groups living above the poverty line.
| Age Bracket | Male | Female |
| Under 5 Years | 74 (100.0%) | 16 (100.0%) |
| 5 Years | 0 (0.0%) | 0 (0.0%) |
| 6 to 11 Years | 0 (0.0%) | 16 (100.0%) |
| 12 to 14 Years | 31 (100.0%) | 0 (0.0%) |
| 15 Years | 0 (0.0%) | 0 (0.0%) |
| 16 and 17 Years | 0 (0.0%) | 0 (0.0%) |
| 18 to 24 Years | 60 (100.0%) | 0 (0.0%) |
| 25 to 34 Years | 0 (0.0%) | 0 (0.0%) |
| 35 to 44 Years | 80 (100.0%) | 65 (100.0%) |
| 45 to 54 Years | 0 (0.0%) | 0 (0.0%) |
| 55 to 64 Years | 72 (100.0%) | 17 (100.0%) |
| 65 to 74 Years | 33 (100.0%) | 61 (100.0%) |
| 75 Years and over | 0 (0.0%) | 33 (100.0%) |
| Total | 350 (95.9%) | 208 (59.4%) |
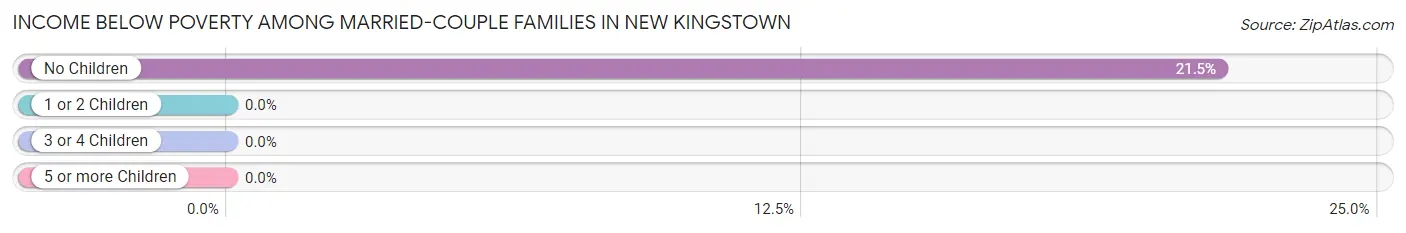
Income Below Poverty Among Married-Couple Families in New Kingstown
The poverty statistics for married-couple families in New Kingstown show that 10.6% or 14 of the total 132 families live below the poverty line. Families with no children have the highest poverty rate of 21.5%, comprising of 14 families. On the other hand, families with 1 or 2 children have the lowest poverty rate of 0.0%, which includes 0 families.
| Children | Above Poverty | Below Poverty |
| No Children | 51 (78.5%) | 14 (21.5%) |
| 1 or 2 Children | 52 (100.0%) | 0 (0.0%) |
| 3 or 4 Children | 0 (0.0%) | 0 (0.0%) |
| 5 or more Children | 15 (100.0%) | 0 (0.0%) |
| Total | 118 (89.4%) | 14 (10.6%) |
Income Below Poverty Among Single-Parent Households in New Kingstown
| Children | Single Father | Single Mother |
| No Children | 0 (0.0%) | 0 (0.0%) |
| 1 or 2 Children | 0 (0.0%) | 0 (0.0%) |
| 3 or 4 Children | 0 (0.0%) | 0 (0.0%) |
| 5 or more Children | 0 (0.0%) | 0 (0.0%) |
| Total | 0 (0.0%) | 0 (0.0%) |
Income Below Poverty Among Married-Couple vs Single-Parent Households in New Kingstown
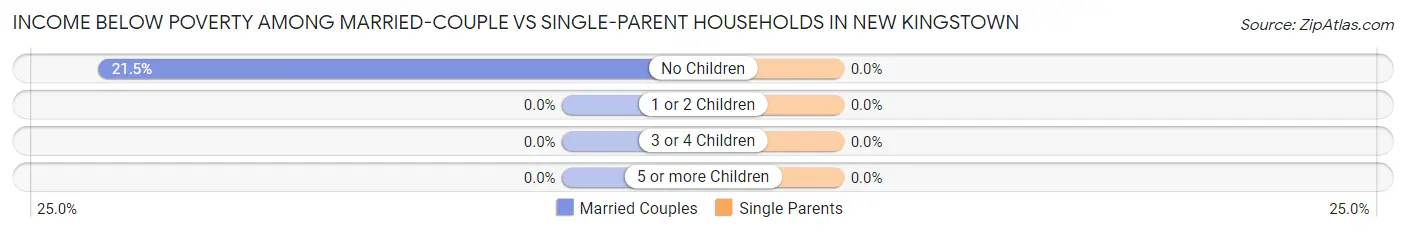
| Children | Married-Couple Families | Single-Parent Households |
| No Children | 14 (21.5%) | 0 (0.0%) |
| 1 or 2 Children | 0 (0.0%) | 0 (0.0%) |
| 3 or 4 Children | 0 (0.0%) | 0 (0.0%) |
| 5 or more Children | 0 (0.0%) | 0 (0.0%) |
| Total | 14 (10.6%) | 0 (0.0%) |
Race in New Kingstown
The most populous races in New Kingstown are White / Caucasian (702 | 98.2%), and Asian (13 | 1.8%).
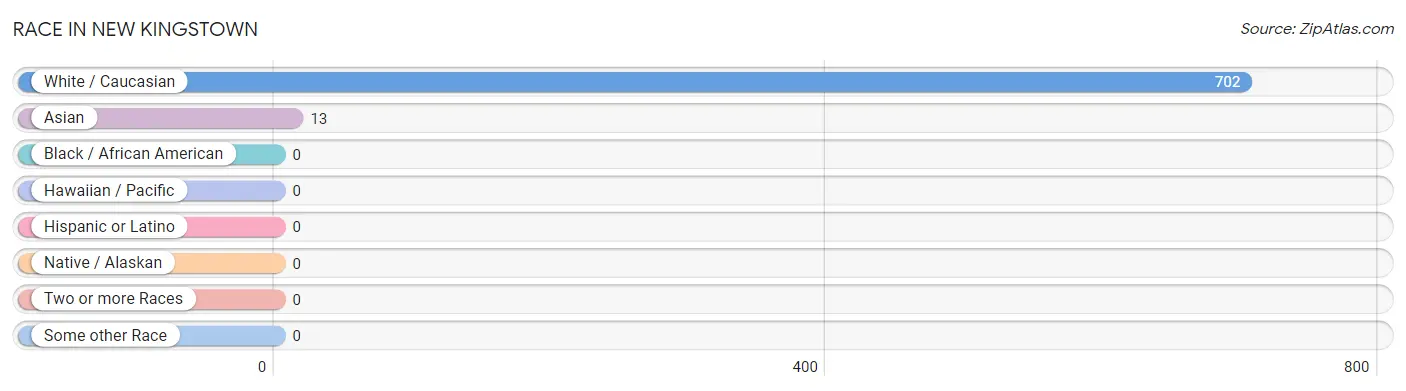
| Race | # Population | % Population |
| Asian | 13 | 1.8% |
| Black / African American | 0 | 0.0% |
| Hawaiian / Pacific | 0 | 0.0% |
| Hispanic or Latino | 0 | 0.0% |
| Native / Alaskan | 0 | 0.0% |
| White / Caucasian | 702 | 98.2% |
| Two or more Races | 0 | 0.0% |
| Some other Race | 0 | 0.0% |
| Total | 715 | 100.0% |
Ancestry in New Kingstown
The most populous ancestries reported in New Kingstown are German (209 | 29.2%), Scottish (128 | 17.9%), American (35 | 4.9%), Dutch (33 | 4.6%), and English (31 | 4.3%), together accounting for 61.0% of all New Kingstown residents.
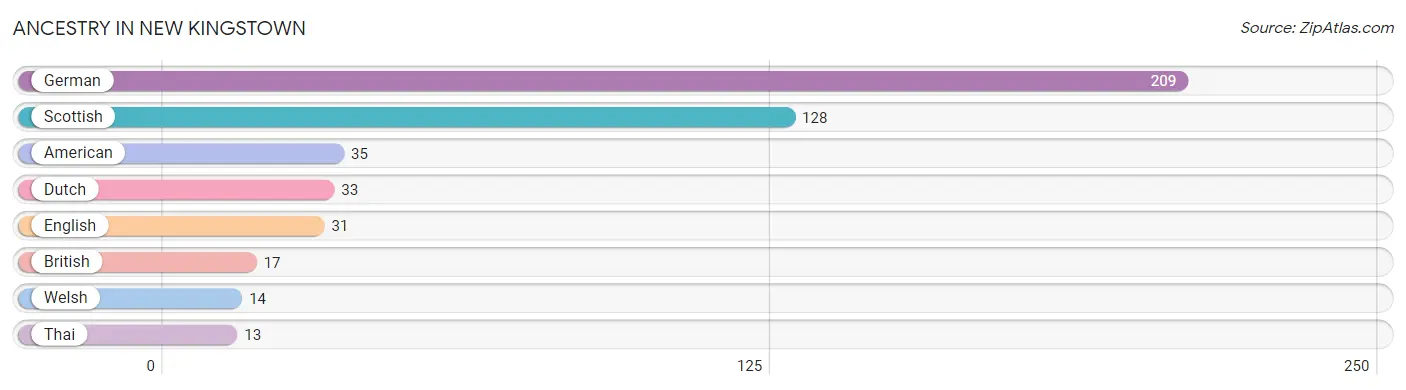
| Ancestry | # Population | % Population |
| American | 35 | 4.9% |
| British | 17 | 2.4% |
| Dutch | 33 | 4.6% |
| English | 31 | 4.3% |
| German | 209 | 29.2% |
| Scottish | 128 | 17.9% |
| Thai | 13 | 1.8% |
| Welsh | 14 | 2.0% | View All 8 Rows |
Immigrants in New Kingstown
The most numerous immigrant groups reported in New Kingstown came from Asia (13 | 1.8%), India (13 | 1.8%), and South Central Asia (13 | 1.8%), together accounting for 5.5% of all New Kingstown residents.
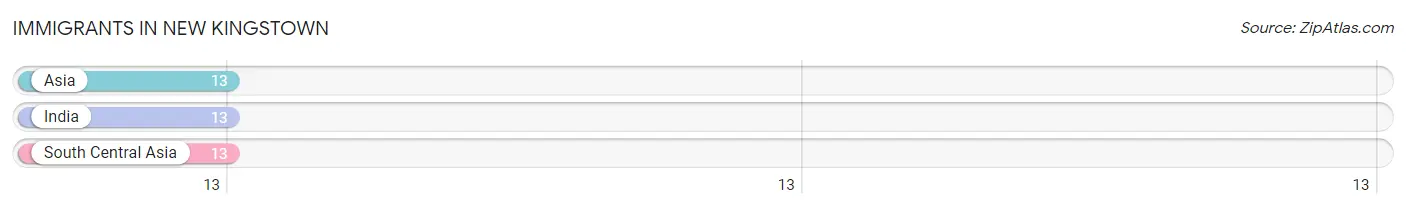
| Immigration Origin | # Population | % Population |
| Asia | 13 | 1.8% |
| India | 13 | 1.8% |
| South Central Asia | 13 | 1.8% | View All 3 Rows |
Sex and Age in New Kingstown
Sex and Age in New Kingstown
The most populous age groups in New Kingstown are 40 to 44 Years (80 | 21.9%) for men and 50 to 54 Years (128 | 36.6%) for women.
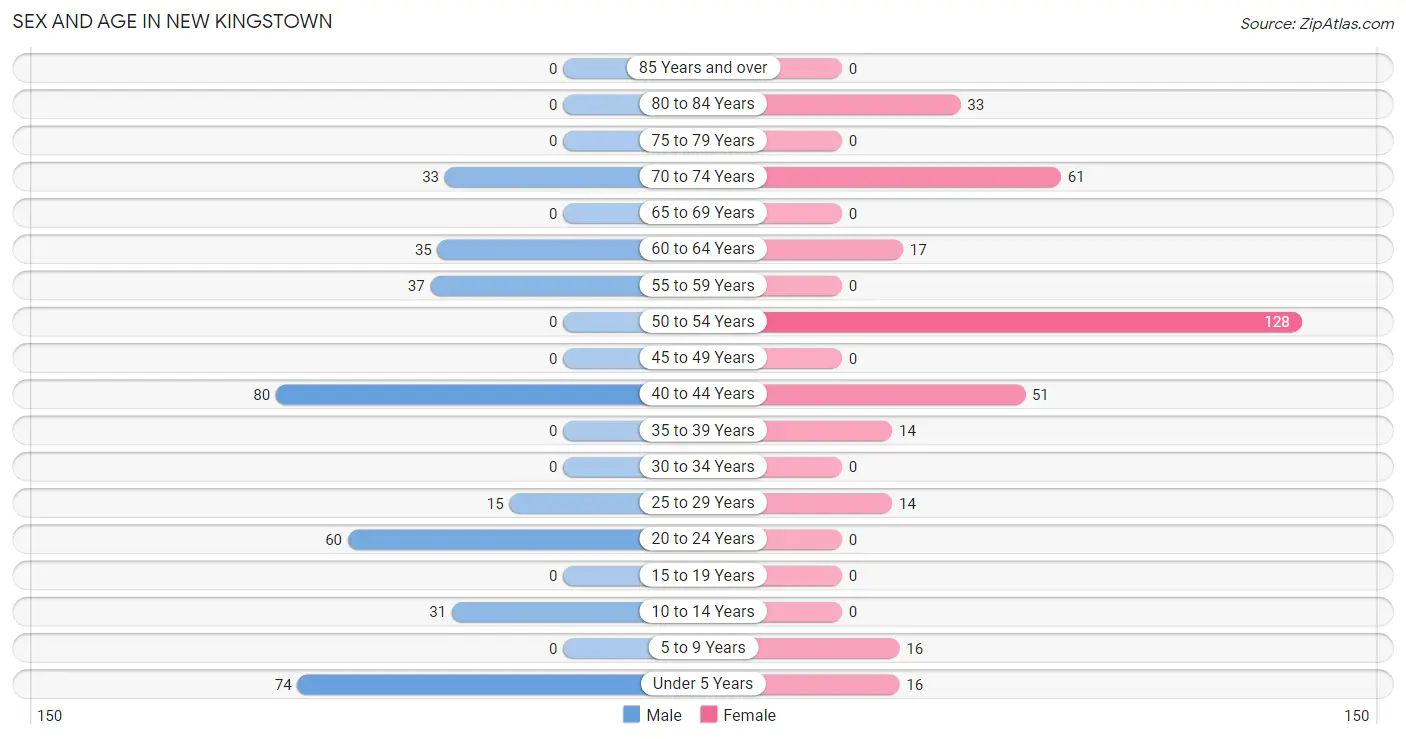
| Age Bracket | Male | Female |
| Under 5 Years | 74 (20.3%) | 16 (4.6%) |
| 5 to 9 Years | 0 (0.0%) | 16 (4.6%) |
| 10 to 14 Years | 31 (8.5%) | 0 (0.0%) |
| 15 to 19 Years | 0 (0.0%) | 0 (0.0%) |
| 20 to 24 Years | 60 (16.4%) | 0 (0.0%) |
| 25 to 29 Years | 15 (4.1%) | 14 (4.0%) |
| 30 to 34 Years | 0 (0.0%) | 0 (0.0%) |
| 35 to 39 Years | 0 (0.0%) | 14 (4.0%) |
| 40 to 44 Years | 80 (21.9%) | 51 (14.6%) |
| 45 to 49 Years | 0 (0.0%) | 0 (0.0%) |
| 50 to 54 Years | 0 (0.0%) | 128 (36.6%) |
| 55 to 59 Years | 37 (10.1%) | 0 (0.0%) |
| 60 to 64 Years | 35 (9.6%) | 17 (4.9%) |
| 65 to 69 Years | 0 (0.0%) | 0 (0.0%) |
| 70 to 74 Years | 33 (9.0%) | 61 (17.4%) |
| 75 to 79 Years | 0 (0.0%) | 0 (0.0%) |
| 80 to 84 Years | 0 (0.0%) | 33 (9.4%) |
| 85 Years and over | 0 (0.0%) | 0 (0.0%) |
| Total | 365 (100.0%) | 350 (100.0%) |
Families and Households in New Kingstown
Median Family Size in New Kingstown
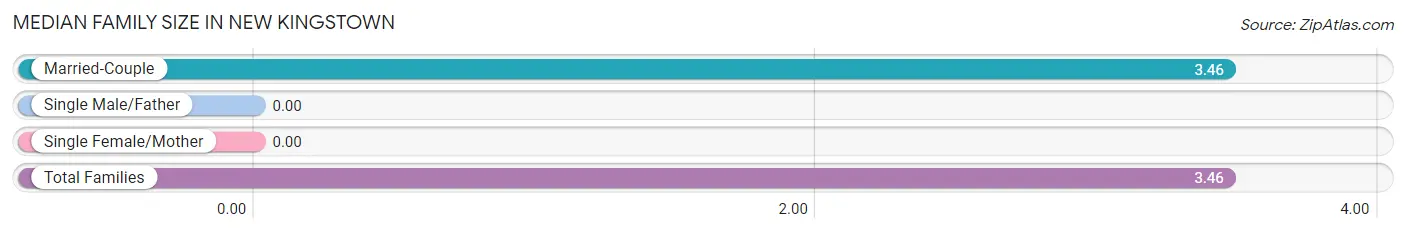
| Family Type | # Families | Family Size |
| Married-Couple | 132 (100.0%) | 3.46 |
| Single Male/Father | 0 (0.0%) | - |
| Single Female/Mother | 0 (0.0%) | - |
| Total Families | 132 (100.0%) | 3.46 |
Median Household Size in New Kingstown
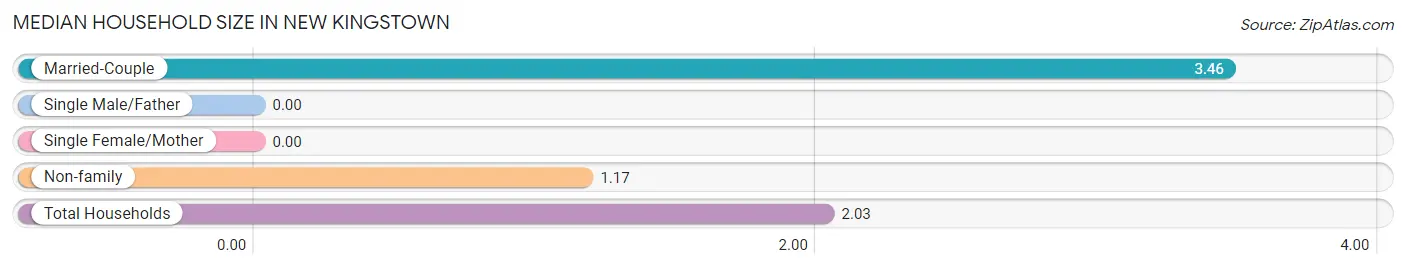
| Household Type | # Households | Household Size |
| Married-Couple | 132 (37.4%) | 3.46 |
| Single Male/Father | 0 (0.0%) | - |
| Single Female/Mother | 0 (0.0%) | - |
| Non-family | 221 (62.6%) | 1.17 |
| Total Households | 353 (100.0%) | 2.03 |
Household Size by Marriage Status in New Kingstown
Out of a total of 353 households in New Kingstown, 132 (37.4%) are family households, while 221 (62.6%) are nonfamily households. The most numerous type of family households are 2-person households, comprising 65, and the most common type of nonfamily households are 1-person households, comprising 191.
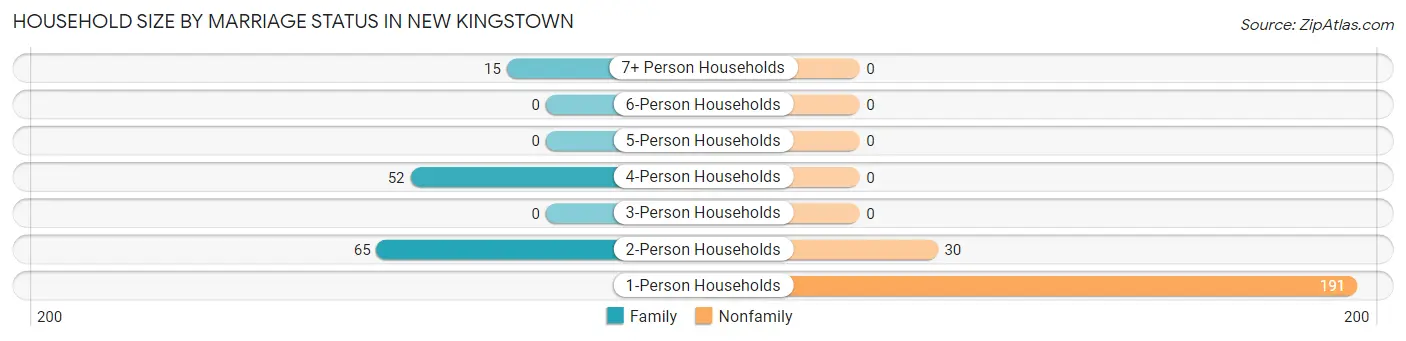
| Household Size | Family Households | Nonfamily Households |
| 1-Person Households | - | 191 (54.1%) |
| 2-Person Households | 65 (18.4%) | 30 (8.5%) |
| 3-Person Households | 0 (0.0%) | 0 (0.0%) |
| 4-Person Households | 52 (14.7%) | 0 (0.0%) |
| 5-Person Households | 0 (0.0%) | 0 (0.0%) |
| 6-Person Households | 0 (0.0%) | 0 (0.0%) |
| 7+ Person Households | 15 (4.3%) | 0 (0.0%) |
| Total | 132 (37.4%) | 221 (62.6%) |
Female Fertility in New Kingstown
Fertility by Age in New Kingstown
Average fertility rate in New Kingstown is 68.0 births per 1,000 women. Women in the age bracket of 35 to 50 years have the highest fertility rate with 73.0 births per 1,000 women. Women in the age bracket of 35 to 50 years acount for 100.0% of all women with births.
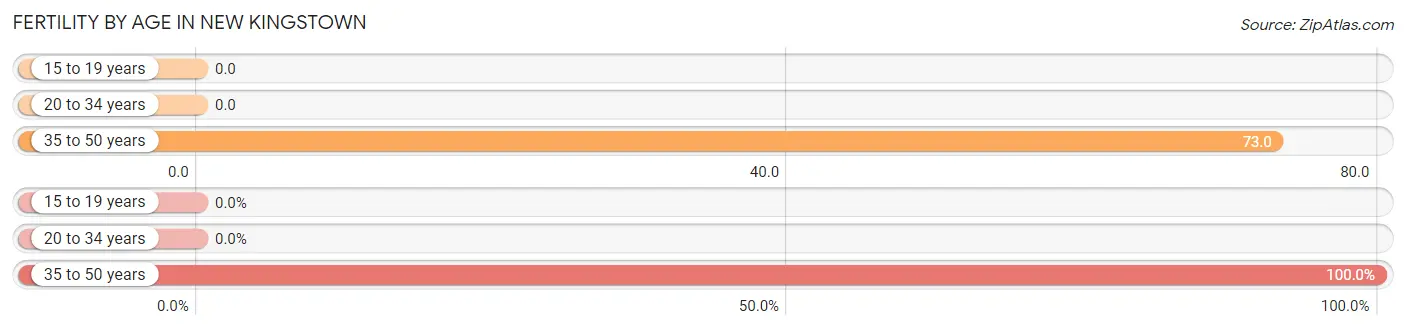
| Age Bracket | Women with Births | Births / 1,000 Women |
| 15 to 19 years | 0 (0.0%) | 0.0 |
| 20 to 34 years | 0 (0.0%) | 0.0 |
| 35 to 50 years | 14 (100.0%) | 73.0 |
| Total | 14 (100.0%) | 68.0 |
Fertility by Age by Marriage Status in New Kingstown
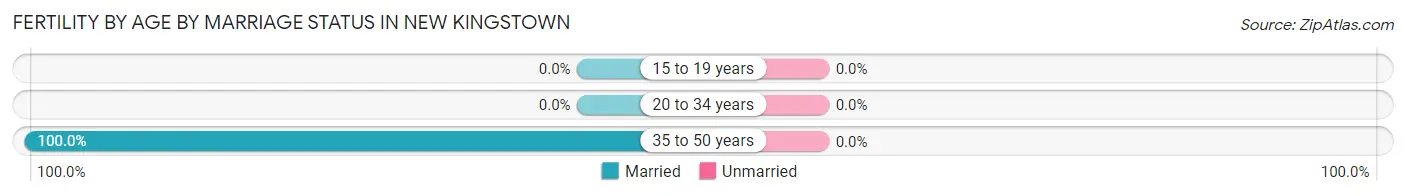
| Age Bracket | Married | Unmarried |
| 15 to 19 years | 0 (0.0%) | 0 (0.0%) |
| 20 to 34 years | 0 (0.0%) | 0 (0.0%) |
| 35 to 50 years | 14 (100.0%) | 0 (0.0%) |
| Total | 14 (100.0%) | 0 (0.0%) |
Fertility by Education in New Kingstown
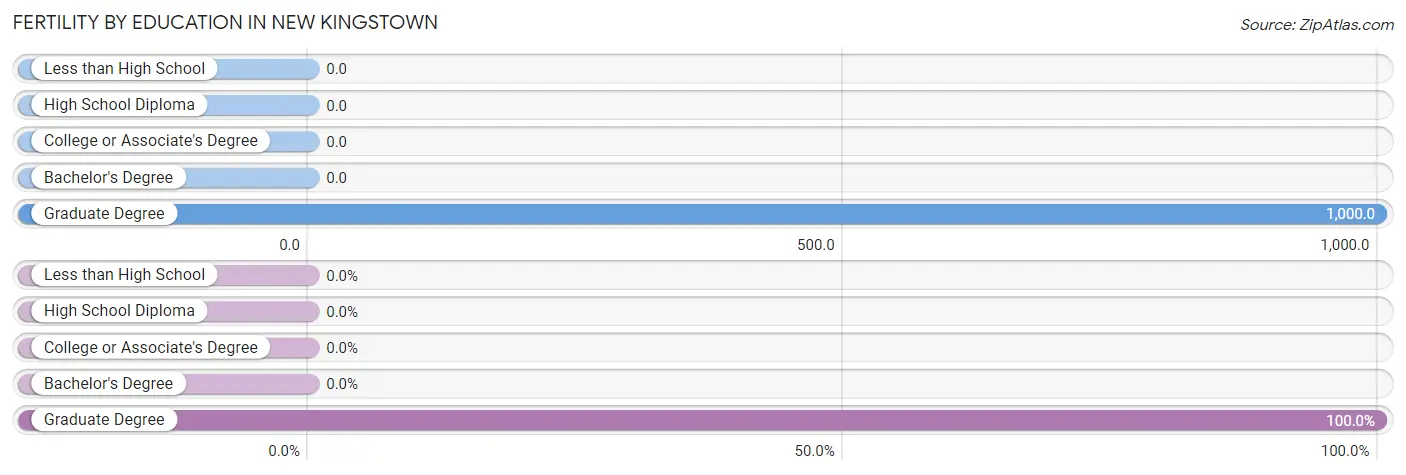
| Educational Attainment | Women with Births | Births / 1,000 Women |
| Less than High School | 0 (0.0%) | 0.0 |
| High School Diploma | 0 (0.0%) | 0.0 |
| College or Associate's Degree | 0 (0.0%) | 0.0 |
| Bachelor's Degree | 0 (0.0%) | 0.0 |
| Graduate Degree | 14 (100.0%) | 1,000.0 |
| Total | 14 (100.0%) | 68.0 |
Fertility by Education by Marriage Status in New Kingstown
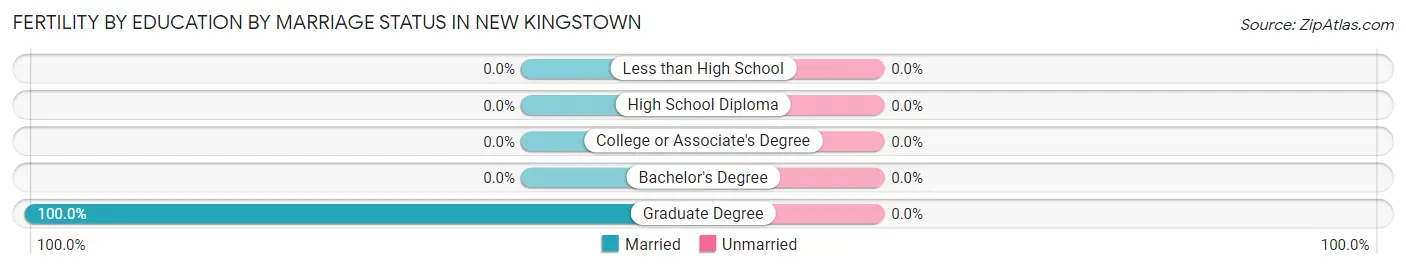
| Educational Attainment | Married | Unmarried |
| Less than High School | 0 (0.0%) | 0 (0.0%) |
| High School Diploma | 0 (0.0%) | 0 (0.0%) |
| College or Associate's Degree | 0 (0.0%) | 0 (0.0%) |
| Bachelor's Degree | 0 (0.0%) | 0 (0.0%) |
| Graduate Degree | 14 (100.0%) | 0 (0.0%) |
| Total | 14 (100.0%) | 0 (0.0%) |
Employment Characteristics in New Kingstown
Employment by Class of Employer in New Kingstown
Among the 296 employed individuals in New Kingstown, private company employees (250 | 84.5%), not-for-profit organizations (17 | 5.7%), and state government employees (15 | 5.1%) make up the most common classes of employment.
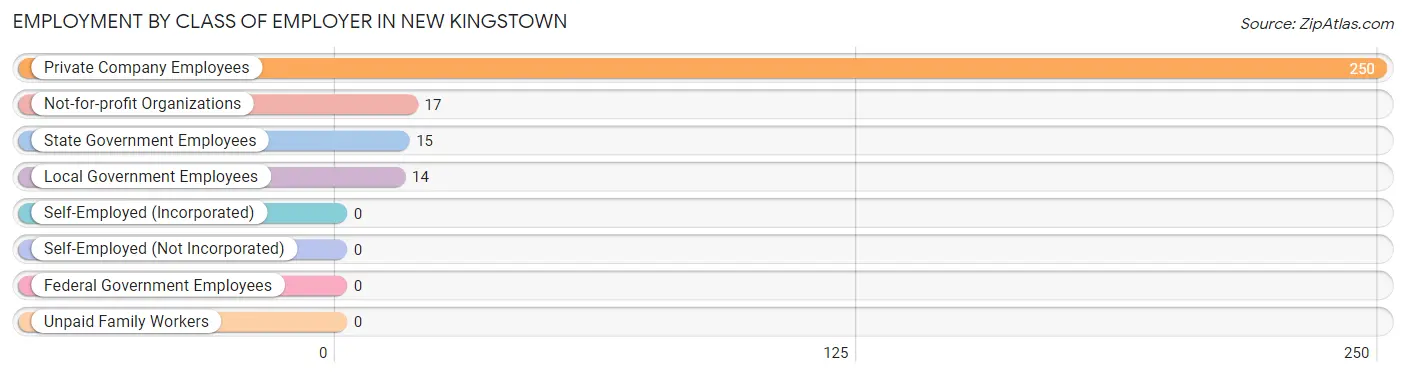
| Employer Class | # Employees | % Employees |
| Private Company Employees | 250 | 84.5% |
| Self-Employed (Incorporated) | 0 | 0.0% |
| Self-Employed (Not Incorporated) | 0 | 0.0% |
| Not-for-profit Organizations | 17 | 5.7% |
| Local Government Employees | 14 | 4.7% |
| State Government Employees | 15 | 5.1% |
| Federal Government Employees | 0 | 0.0% |
| Unpaid Family Workers | 0 | 0.0% |
| Total | 296 | 100.0% |
Employment Status by Age in New Kingstown
According to the labor force statistics for New Kingstown, out of the total population over 16 years of age (578), 61.6% or 356 individuals are in the labor force, with 16.9% or 60 of them unemployed. The age group with the highest labor force participation rate is 20 to 24 years, with 100.0% or 60 individuals in the labor force. Within the labor force, the 20 to 24 years age range has the highest percentage of unemployed individuals, with 100.0% or 60 of them being unemployed.
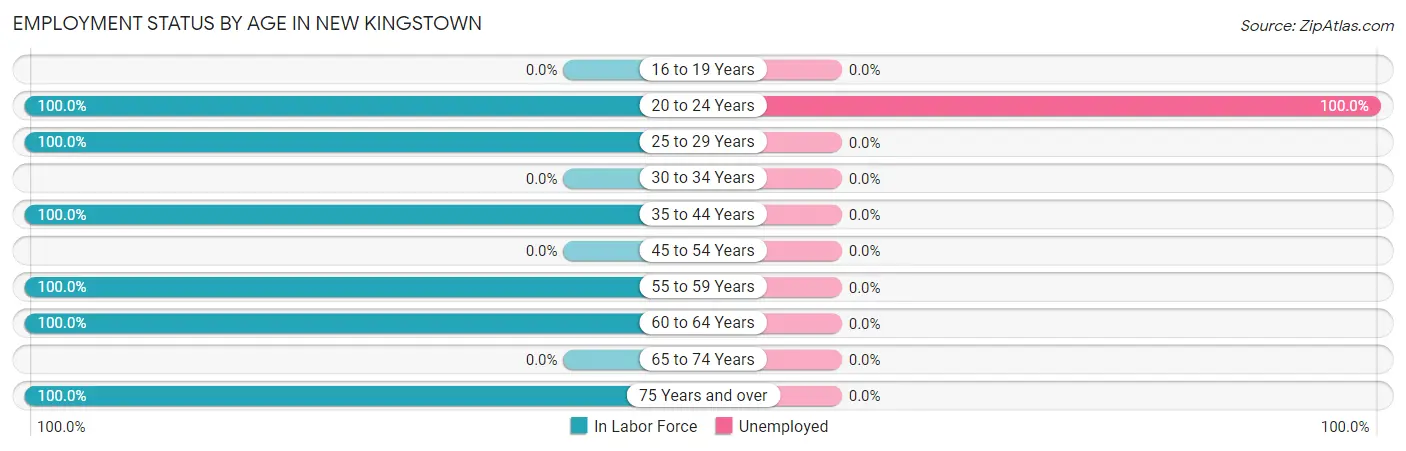
| Age Bracket | In Labor Force | Unemployed |
| 16 to 19 Years | 0 (0.0%) | 0 (0.0%) |
| 20 to 24 Years | 60 (100.0%) | 60 (100.0%) |
| 25 to 29 Years | 29 (100.0%) | 0 (0.0%) |
| 30 to 34 Years | 0 (0.0%) | 0 (0.0%) |
| 35 to 44 Years | 145 (100.0%) | 0 (0.0%) |
| 45 to 54 Years | 0 (0.0%) | 0 (0.0%) |
| 55 to 59 Years | 37 (100.0%) | 0 (0.0%) |
| 60 to 64 Years | 52 (100.0%) | 0 (0.0%) |
| 65 to 74 Years | 0 (0.0%) | 0 (0.0%) |
| 75 Years and over | 33 (100.0%) | 0 (0.0%) |
| Total | 356 (61.6%) | 60 (16.9%) |
Employment Status by Educational Attainment in New Kingstown
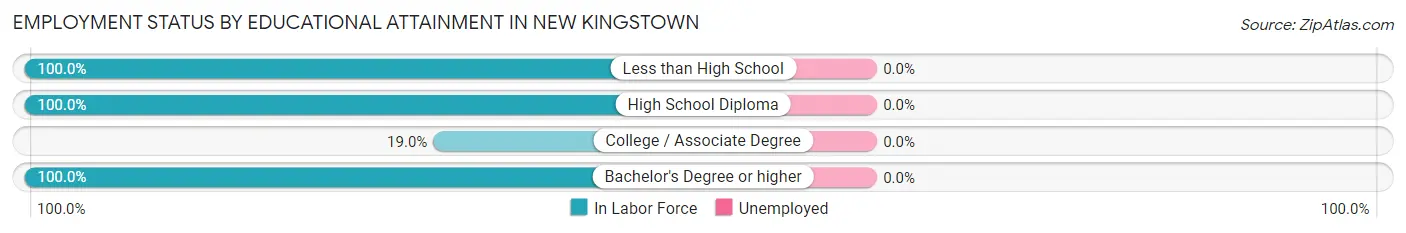
| Educational Attainment | In Labor Force | Unemployed |
| Less than High School | 15 (100.0%) | 0 (0.0%) |
| High School Diploma | 175 (100.0%) | 0 (0.0%) |
| College / Associate Degree | 30 (19.0%) | 0 (0.0%) |
| Bachelor's Degree or higher | 43 (100.0%) | 0 (0.0%) |
| Total | 263 (67.3%) | 0 (0.0%) |
Employment Occupations by Sex in New Kingstown
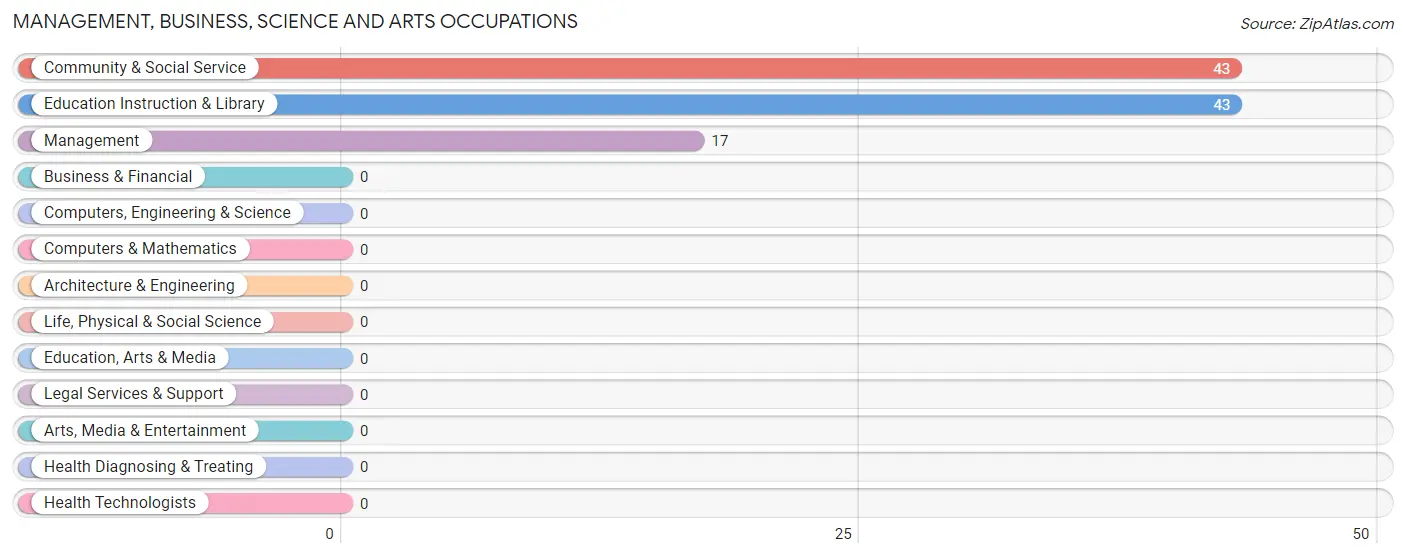
Management, Business, Science and Arts Occupations
The most common Management, Business, Science and Arts occupations in New Kingstown are Community & Social Service (43 | 14.5%), Education Instruction & Library (43 | 14.5%), and Management (17 | 5.7%).
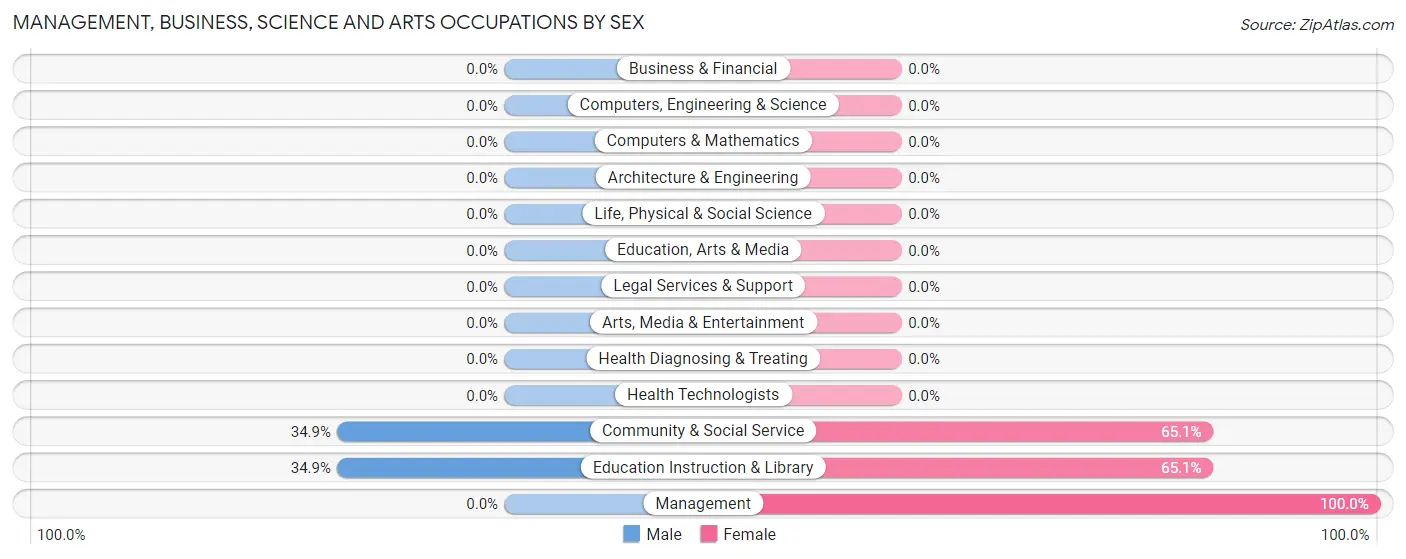
Management, Business, Science and Arts Occupations by Sex
Within the Management, Business, Science and Arts occupations in New Kingstown, the most male-oriented occupations are Community & Social Service (34.9%), and Education Instruction & Library (34.9%), while the most female-oriented occupations are Management (100.0%), Community & Social Service (65.1%), and Education Instruction & Library (65.1%).
| Occupation | Male | Female |
| Management | 0 (0.0%) | 17 (100.0%) |
| Business & Financial | 0 (0.0%) | 0 (0.0%) |
| Computers, Engineering & Science | 0 (0.0%) | 0 (0.0%) |
| Computers & Mathematics | 0 (0.0%) | 0 (0.0%) |
| Architecture & Engineering | 0 (0.0%) | 0 (0.0%) |
| Life, Physical & Social Science | 0 (0.0%) | 0 (0.0%) |
| Community & Social Service | 15 (34.9%) | 28 (65.1%) |
| Education, Arts & Media | 0 (0.0%) | 0 (0.0%) |
| Legal Services & Support | 0 (0.0%) | 0 (0.0%) |
| Education Instruction & Library | 15 (34.9%) | 28 (65.1%) |
| Arts, Media & Entertainment | 0 (0.0%) | 0 (0.0%) |
| Health Diagnosing & Treating | 0 (0.0%) | 0 (0.0%) |
| Health Technologists | 0 (0.0%) | 0 (0.0%) |
| Total (Category) | 15 (25.0%) | 45 (75.0%) |
| Total (Overall) | 167 (56.4%) | 129 (43.6%) |
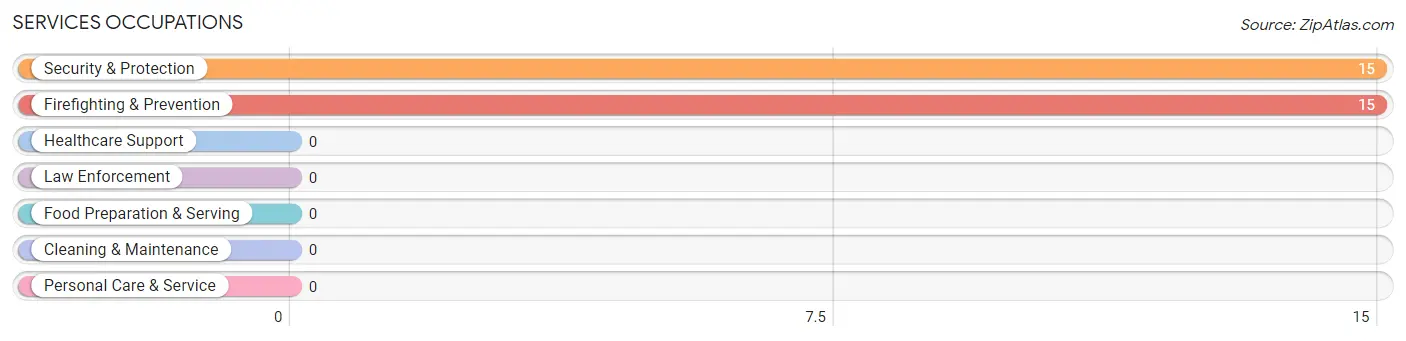
Services Occupations
The most common Services occupations in New Kingstown are Security & Protection (15 | 5.1%), and Firefighting & Prevention (15 | 5.1%).
Services Occupations by Sex
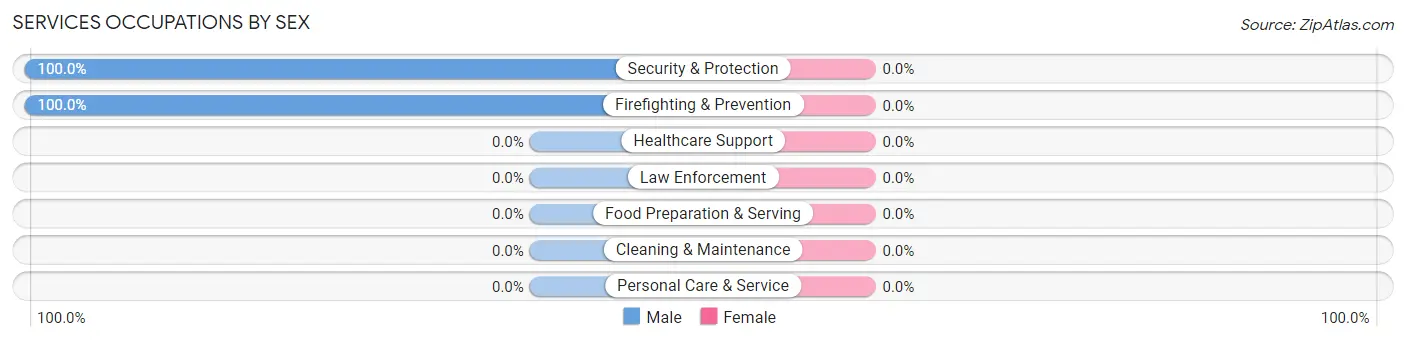
| Occupation | Male | Female |
| Healthcare Support | 0 (0.0%) | 0 (0.0%) |
| Security & Protection | 15 (100.0%) | 0 (0.0%) |
| Firefighting & Prevention | 15 (100.0%) | 0 (0.0%) |
| Law Enforcement | 0 (0.0%) | 0 (0.0%) |
| Food Preparation & Serving | 0 (0.0%) | 0 (0.0%) |
| Cleaning & Maintenance | 0 (0.0%) | 0 (0.0%) |
| Personal Care & Service | 0 (0.0%) | 0 (0.0%) |
| Total (Category) | 15 (100.0%) | 0 (0.0%) |
| Total (Overall) | 167 (56.4%) | 129 (43.6%) |
Sales and Office Occupations
The most common Sales and Office occupations in New Kingstown are , and Office & Administration (157 | 53.0%).
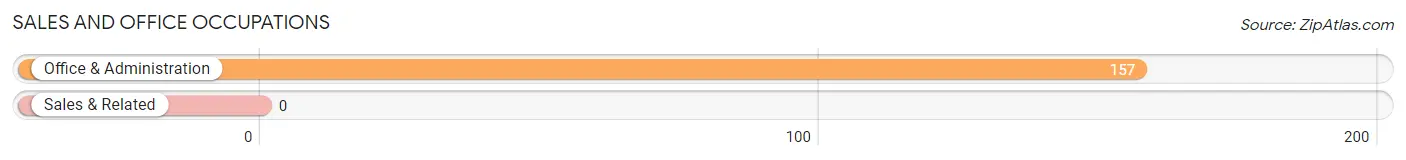
Sales and Office Occupations by Sex
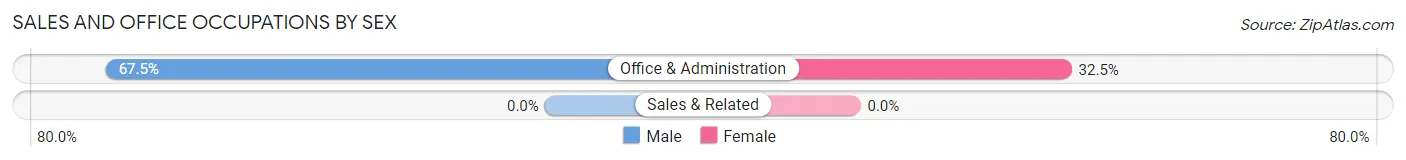
| Occupation | Male | Female |
| Sales & Related | 0 (0.0%) | 0 (0.0%) |
| Office & Administration | 106 (67.5%) | 51 (32.5%) |
| Total (Category) | 106 (67.5%) | 51 (32.5%) |
| Total (Overall) | 167 (56.4%) | 129 (43.6%) |
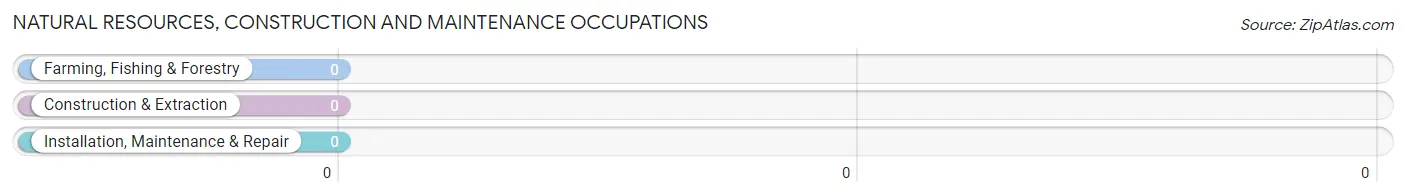
Natural Resources, Construction and Maintenance Occupations
Natural Resources, Construction and Maintenance Occupations by Sex
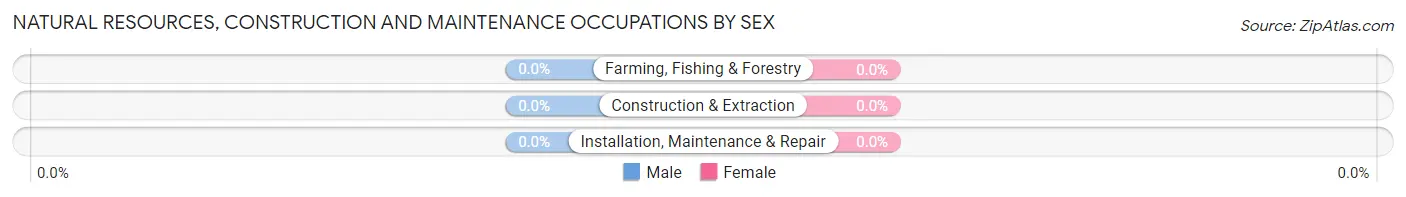
| Occupation | Male | Female |
| Farming, Fishing & Forestry | 0 (0.0%) | 0 (0.0%) |
| Construction & Extraction | 0 (0.0%) | 0 (0.0%) |
| Installation, Maintenance & Repair | 0 (0.0%) | 0 (0.0%) |
| Total (Category) | 0 (0.0%) | 0 (0.0%) |
| Total (Overall) | 167 (56.4%) | 129 (43.6%) |
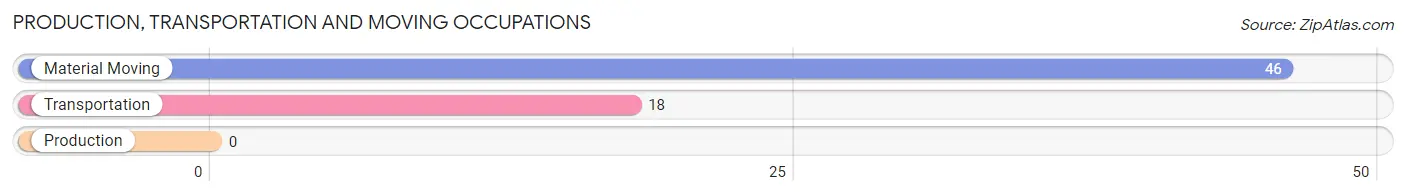
Production, Transportation and Moving Occupations
The most common Production, Transportation and Moving occupations in New Kingstown are Material Moving (46 | 15.5%), and Transportation (18 | 6.1%).
Production, Transportation and Moving Occupations by Sex
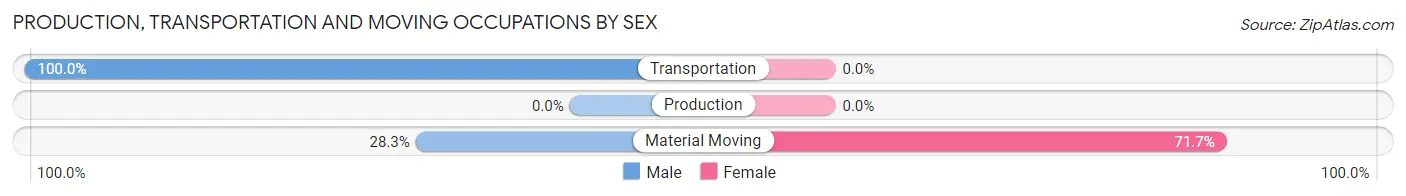
| Occupation | Male | Female |
| Production | 0 (0.0%) | 0 (0.0%) |
| Transportation | 18 (100.0%) | 0 (0.0%) |
| Material Moving | 13 (28.3%) | 33 (71.7%) |
| Total (Category) | 31 (48.4%) | 33 (51.6%) |
| Total (Overall) | 167 (56.4%) | 129 (43.6%) |
Employment Industries by Sex in New Kingstown
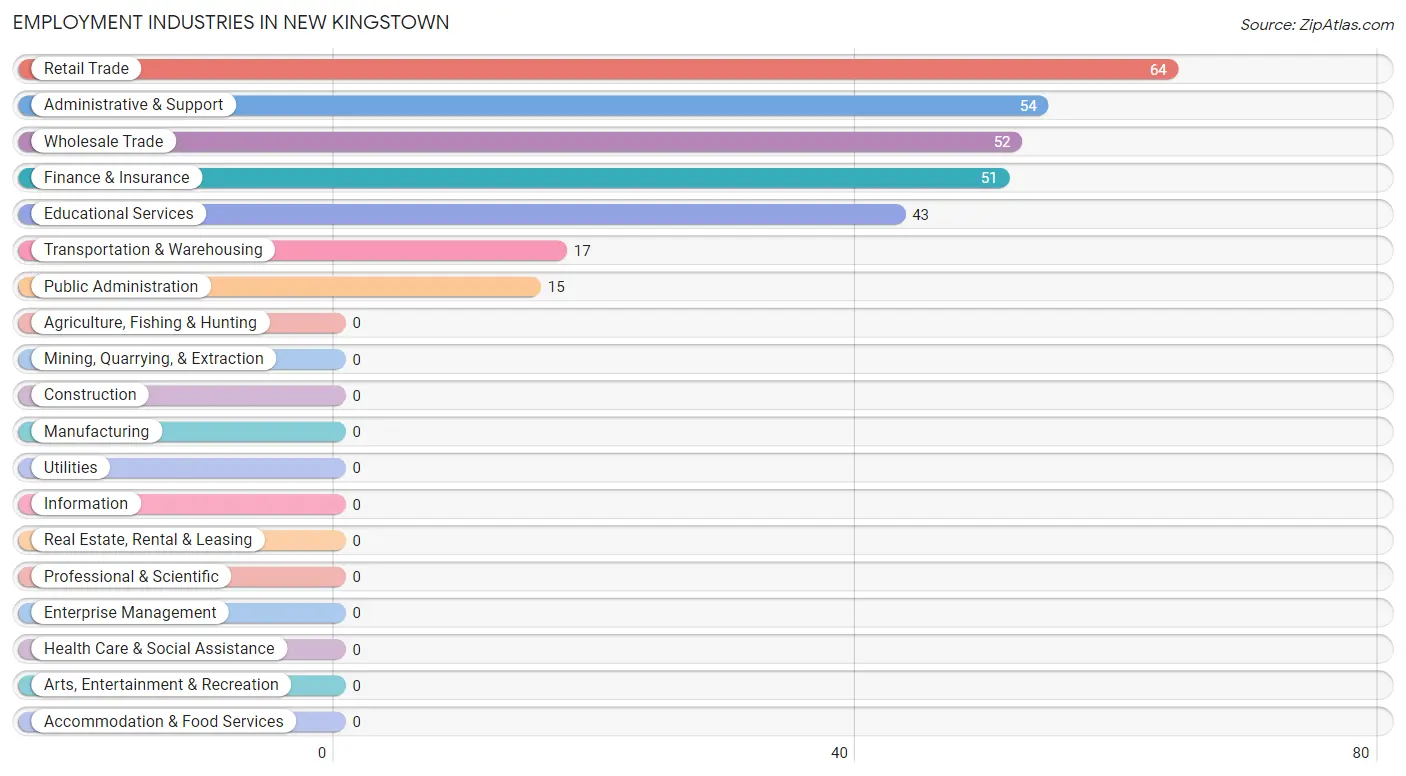
Employment Industries in New Kingstown
The major employment industries in New Kingstown include Retail Trade (64 | 21.6%), Administrative & Support (54 | 18.2%), Wholesale Trade (52 | 17.6%), Finance & Insurance (51 | 17.2%), and Educational Services (43 | 14.5%).
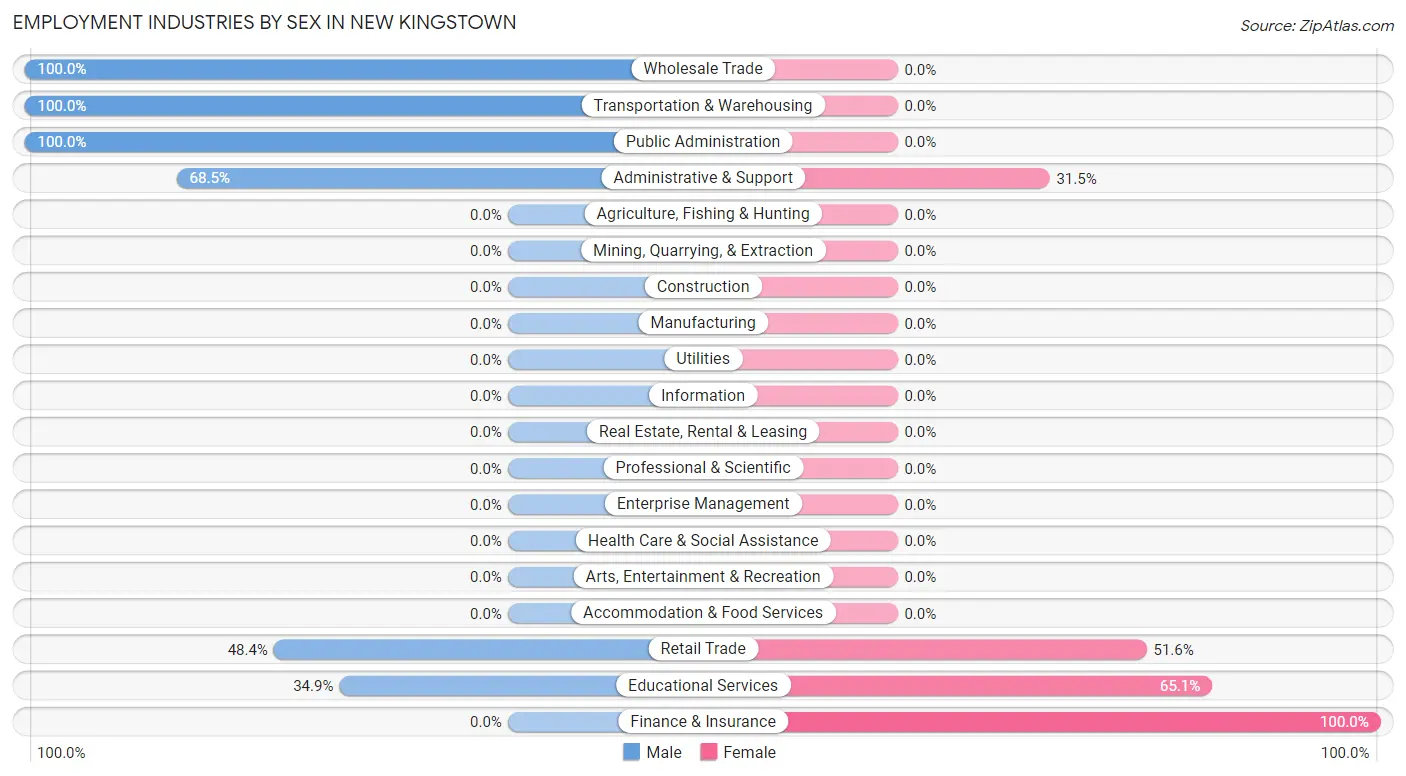
Employment Industries by Sex in New Kingstown
The New Kingstown industries that see more men than women are Wholesale Trade (100.0%), Transportation & Warehousing (100.0%), and Public Administration (100.0%), whereas the industries that tend to have a higher number of women are Finance & Insurance (100.0%), Educational Services (65.1%), and Retail Trade (51.6%).
| Industry | Male | Female |
| Agriculture, Fishing & Hunting | 0 (0.0%) | 0 (0.0%) |
| Mining, Quarrying, & Extraction | 0 (0.0%) | 0 (0.0%) |
| Construction | 0 (0.0%) | 0 (0.0%) |
| Manufacturing | 0 (0.0%) | 0 (0.0%) |
| Wholesale Trade | 52 (100.0%) | 0 (0.0%) |
| Retail Trade | 31 (48.4%) | 33 (51.6%) |
| Transportation & Warehousing | 17 (100.0%) | 0 (0.0%) |
| Utilities | 0 (0.0%) | 0 (0.0%) |
| Information | 0 (0.0%) | 0 (0.0%) |
| Finance & Insurance | 0 (0.0%) | 51 (100.0%) |
| Real Estate, Rental & Leasing | 0 (0.0%) | 0 (0.0%) |
| Professional & Scientific | 0 (0.0%) | 0 (0.0%) |
| Enterprise Management | 0 (0.0%) | 0 (0.0%) |
| Administrative & Support | 37 (68.5%) | 17 (31.5%) |
| Educational Services | 15 (34.9%) | 28 (65.1%) |
| Health Care & Social Assistance | 0 (0.0%) | 0 (0.0%) |
| Arts, Entertainment & Recreation | 0 (0.0%) | 0 (0.0%) |
| Accommodation & Food Services | 0 (0.0%) | 0 (0.0%) |
| Public Administration | 15 (100.0%) | 0 (0.0%) |
| Total | 167 (56.4%) | 129 (43.6%) |
Education in New Kingstown
School Enrollment in New Kingstown
The most common levels of schooling among the 77 students in New Kingstown are middle school (31 | 40.3%), nursery / preschool (16 | 20.8%), and elementary school (16 | 20.8%).
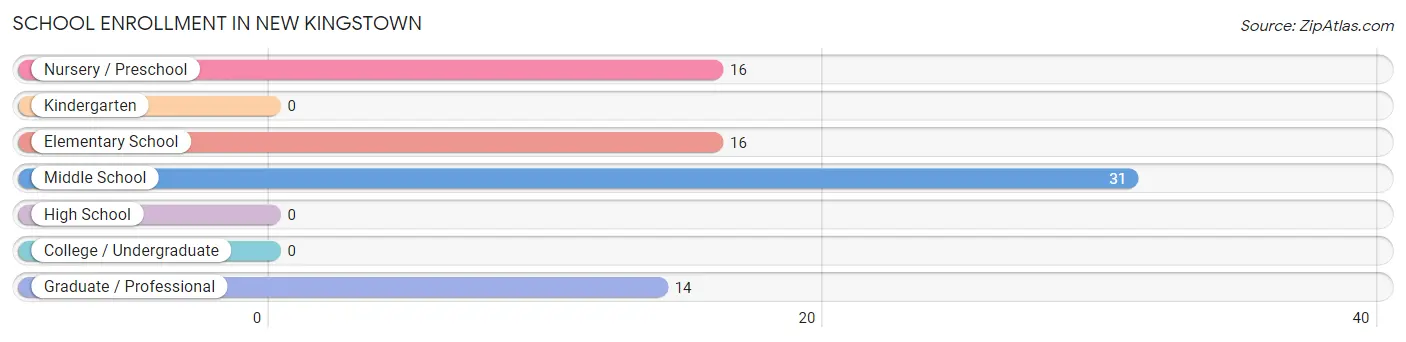
| School Level | # Students | % Students |
| Nursery / Preschool | 16 | 20.8% |
| Kindergarten | 0 | 0.0% |
| Elementary School | 16 | 20.8% |
| Middle School | 31 | 40.3% |
| High School | 0 | 0.0% |
| College / Undergraduate | 0 | 0.0% |
| Graduate / Professional | 14 | 18.2% |
| Total | 77 | 100.0% |
School Enrollment by Age by Funding Source in New Kingstown
Out of a total of 77 students who are enrolled in schools in New Kingstown, 16 (20.8%) attend a private institution, while the remaining 61 (79.2%) are enrolled in public schools. The age group of 3 to 4 year olds has the highest likelihood of being enrolled in private schools, with 16 (100.0% in the age bracket) enrolled. Conversely, the age group of 5 to 9 year old has the lowest likelihood of being enrolled in a private school, with 16 (100.0% in the age bracket) attending a public institution.
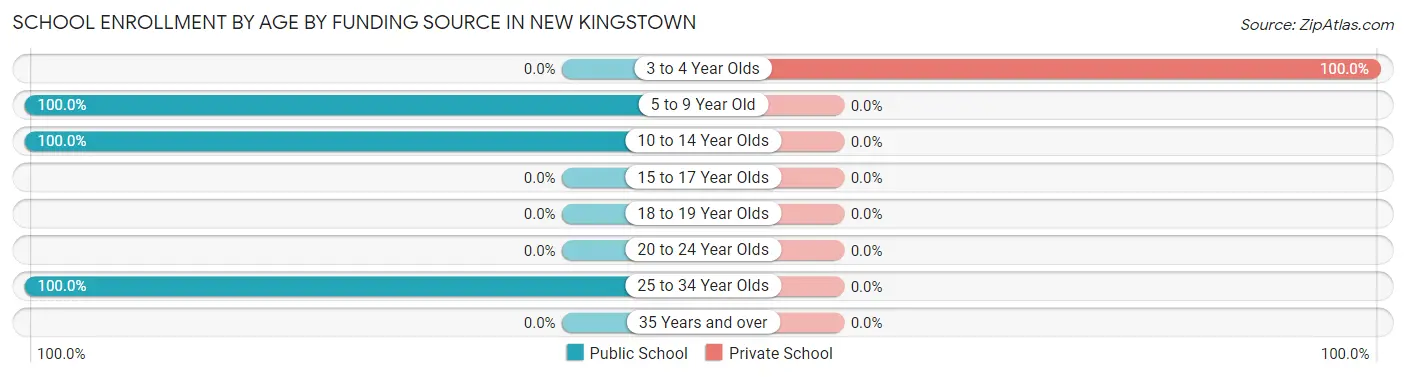
| Age Bracket | Public School | Private School |
| 3 to 4 Year Olds | 0 (0.0%) | 16 (100.0%) |
| 5 to 9 Year Old | 16 (100.0%) | 0 (0.0%) |
| 10 to 14 Year Olds | 31 (100.0%) | 0 (0.0%) |
| 15 to 17 Year Olds | 0 (0.0%) | 0 (0.0%) |
| 18 to 19 Year Olds | 0 (0.0%) | 0 (0.0%) |
| 20 to 24 Year Olds | 0 (0.0%) | 0 (0.0%) |
| 25 to 34 Year Olds | 14 (100.0%) | 0 (0.0%) |
| 35 Years and over | 0 (0.0%) | 0 (0.0%) |
| Total | 61 (79.2%) | 16 (20.8%) |
Educational Attainment by Field of Study in New Kingstown
Science & technology (15 | 34.9%), psychology (14 | 32.6%), and education (14 | 32.6%) are the most common fields of study among 43 individuals in New Kingstown who have obtained a bachelor's degree or higher.
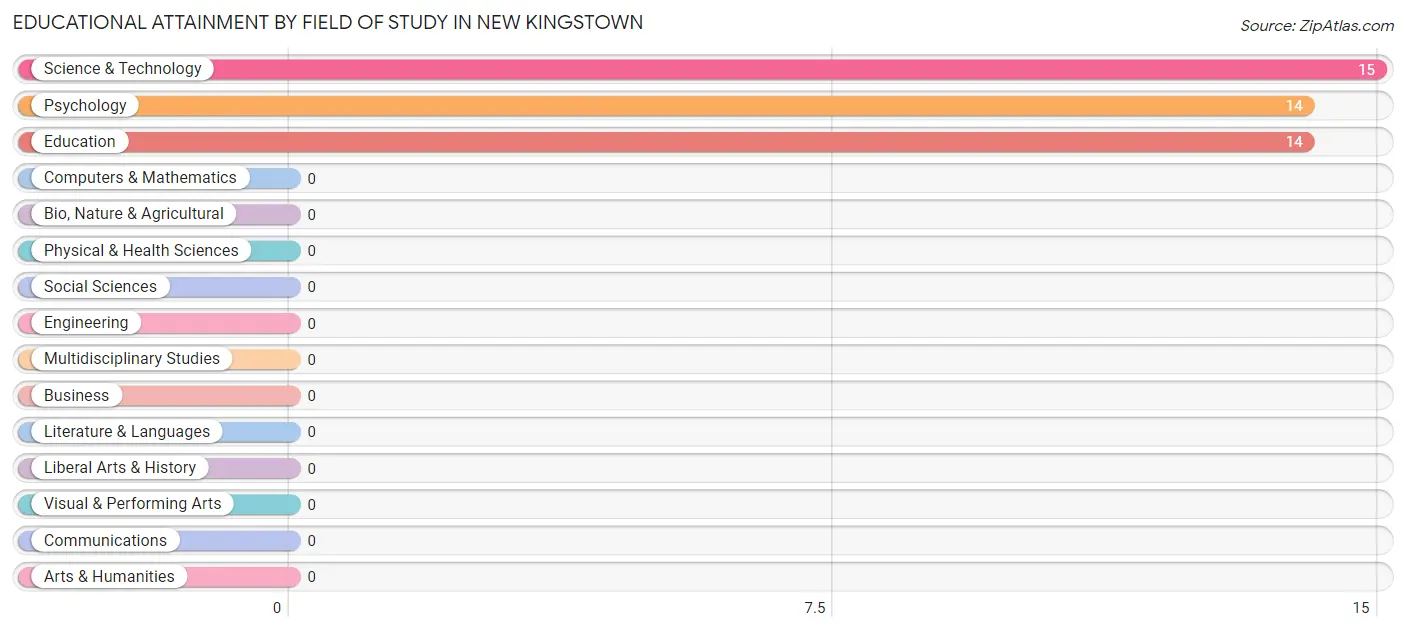
| Field of Study | # Graduates | % Graduates |
| Computers & Mathematics | 0 | 0.0% |
| Bio, Nature & Agricultural | 0 | 0.0% |
| Physical & Health Sciences | 0 | 0.0% |
| Psychology | 14 | 32.6% |
| Social Sciences | 0 | 0.0% |
| Engineering | 0 | 0.0% |
| Multidisciplinary Studies | 0 | 0.0% |
| Science & Technology | 15 | 34.9% |
| Business | 0 | 0.0% |
| Education | 14 | 32.6% |
| Literature & Languages | 0 | 0.0% |
| Liberal Arts & History | 0 | 0.0% |
| Visual & Performing Arts | 0 | 0.0% |
| Communications | 0 | 0.0% |
| Arts & Humanities | 0 | 0.0% |
| Total | 43 | 100.0% |
Transportation & Commute in New Kingstown
Vehicle Availability by Sex in New Kingstown
The most prevalent vehicle ownership categories in New Kingstown are males with 3 vehicles (98, accounting for 58.7%) and females with 3 vehicles (82, making up 76.0%).
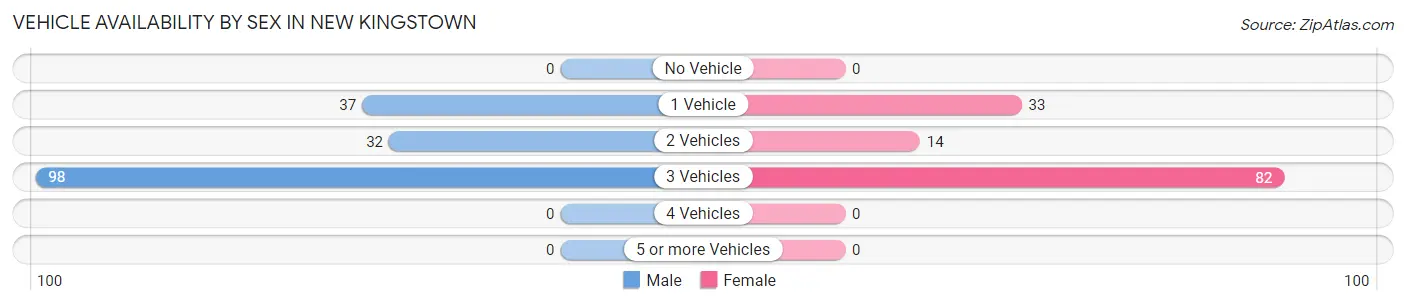
| Vehicles Available | Male | Female |
| No Vehicle | 0 (0.0%) | 0 (0.0%) |
| 1 Vehicle | 37 (22.2%) | 33 (25.6%) |
| 2 Vehicles | 32 (19.2%) | 14 (10.8%) |
| 3 Vehicles | 98 (58.7%) | 82 (63.6%) |
| 4 Vehicles | 0 (0.0%) | 0 (0.0%) |
| 5 or more Vehicles | 0 (0.0%) | 0 (0.0%) |
| Total | 167 (100.0%) | 129 (100.0%) |
Commute Time in New Kingstown
The most frequently occuring commute durations in New Kingstown are 20 to 24 minutes (182 commuters, 61.5%), 45 to 59 minutes (37 commuters, 12.5%), and 5 to 9 minutes (32 commuters, 10.8%).
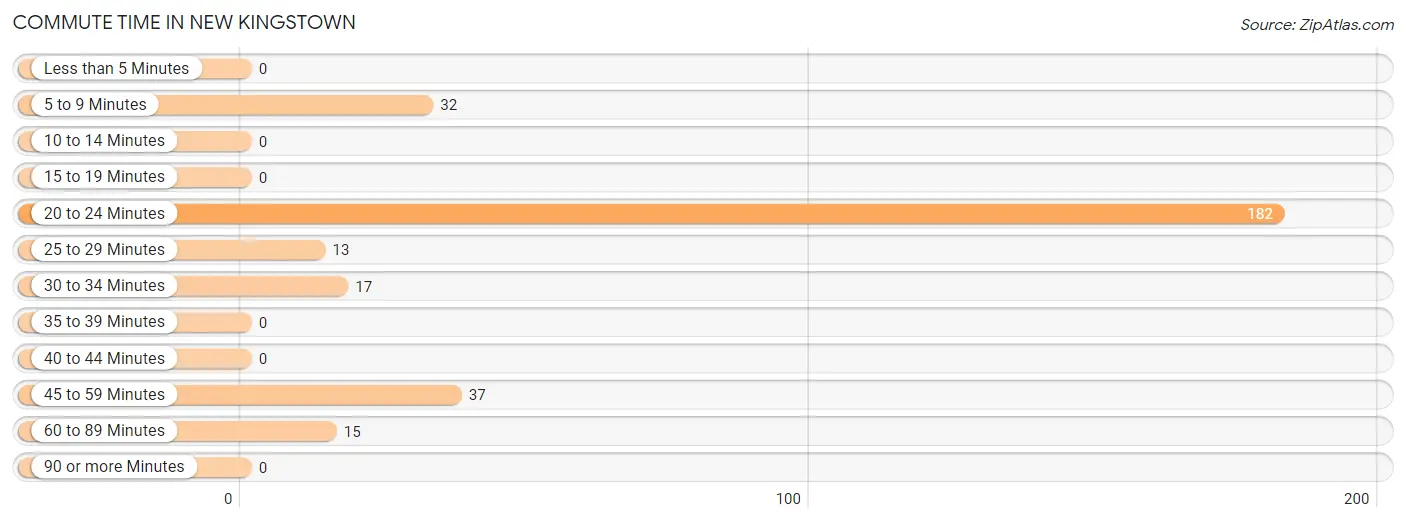
| Commute Time | # Commuters | % Commuters |
| Less than 5 Minutes | 0 | 0.0% |
| 5 to 9 Minutes | 32 | 10.8% |
| 10 to 14 Minutes | 0 | 0.0% |
| 15 to 19 Minutes | 0 | 0.0% |
| 20 to 24 Minutes | 182 | 61.5% |
| 25 to 29 Minutes | 13 | 4.4% |
| 30 to 34 Minutes | 17 | 5.7% |
| 35 to 39 Minutes | 0 | 0.0% |
| 40 to 44 Minutes | 0 | 0.0% |
| 45 to 59 Minutes | 37 | 12.5% |
| 60 to 89 Minutes | 15 | 5.1% |
| 90 or more Minutes | 0 | 0.0% |
Commute Time by Sex in New Kingstown
The most common commute times in New Kingstown are 20 to 24 minutes (67 commuters, 40.1%) for males and 20 to 24 minutes (115 commuters, 89.1%) for females.
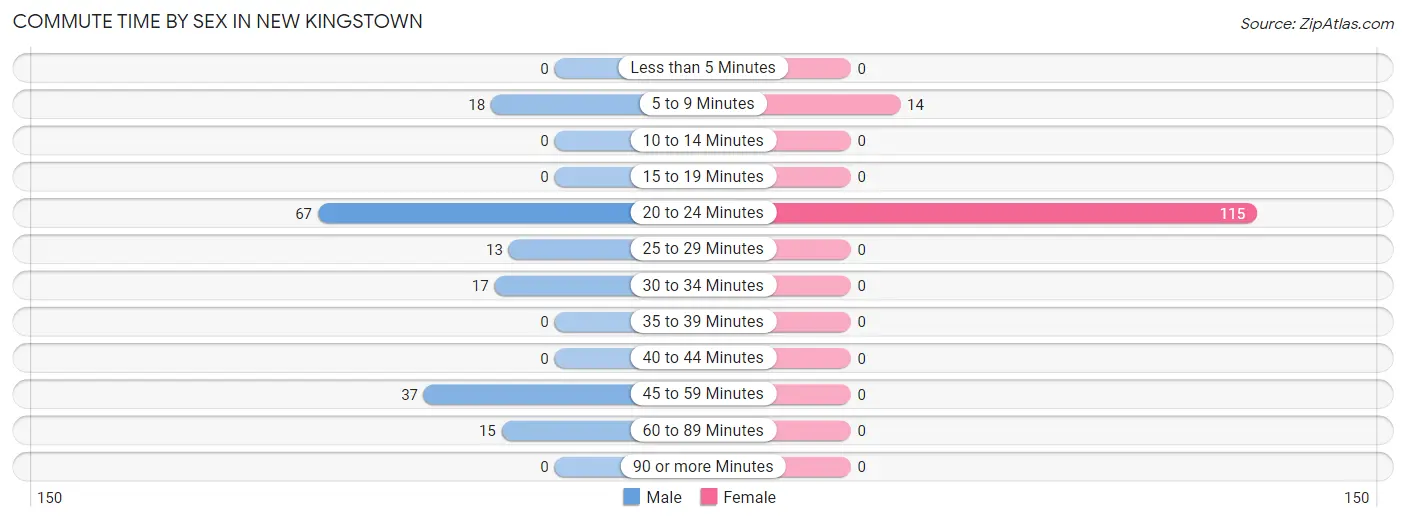
| Commute Time | Male | Female |
| Less than 5 Minutes | 0 (0.0%) | 0 (0.0%) |
| 5 to 9 Minutes | 18 (10.8%) | 14 (10.8%) |
| 10 to 14 Minutes | 0 (0.0%) | 0 (0.0%) |
| 15 to 19 Minutes | 0 (0.0%) | 0 (0.0%) |
| 20 to 24 Minutes | 67 (40.1%) | 115 (89.1%) |
| 25 to 29 Minutes | 13 (7.8%) | 0 (0.0%) |
| 30 to 34 Minutes | 17 (10.2%) | 0 (0.0%) |
| 35 to 39 Minutes | 0 (0.0%) | 0 (0.0%) |
| 40 to 44 Minutes | 0 (0.0%) | 0 (0.0%) |
| 45 to 59 Minutes | 37 (22.2%) | 0 (0.0%) |
| 60 to 89 Minutes | 15 (9.0%) | 0 (0.0%) |
| 90 or more Minutes | 0 (0.0%) | 0 (0.0%) |
Time of Departure to Work by Sex in New Kingstown
The most frequent times of departure to work in New Kingstown are 7:30 AM to 7:59 AM (106, 63.5%) for males and 5:00 AM to 5:29 AM (51, 39.5%) for females.
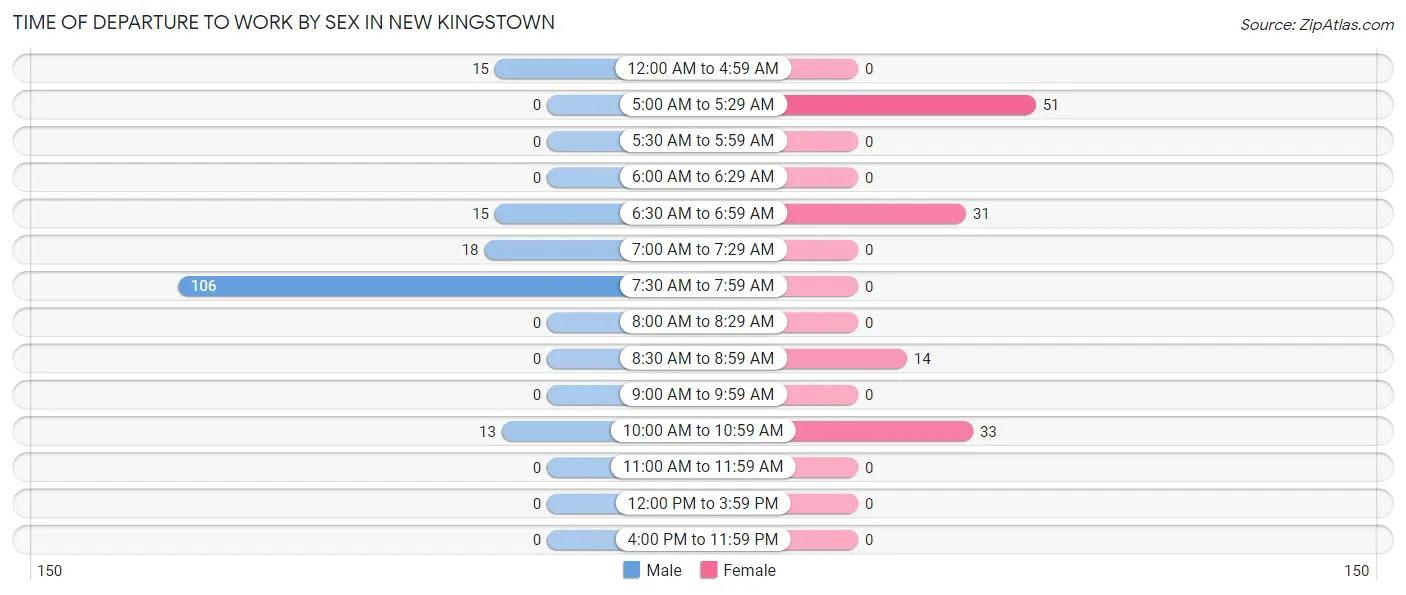
| Time of Departure | Male | Female |
| 12:00 AM to 4:59 AM | 15 (9.0%) | 0 (0.0%) |
| 5:00 AM to 5:29 AM | 0 (0.0%) | 51 (39.5%) |
| 5:30 AM to 5:59 AM | 0 (0.0%) | 0 (0.0%) |
| 6:00 AM to 6:29 AM | 0 (0.0%) | 0 (0.0%) |
| 6:30 AM to 6:59 AM | 15 (9.0%) | 31 (24.0%) |
| 7:00 AM to 7:29 AM | 18 (10.8%) | 0 (0.0%) |
| 7:30 AM to 7:59 AM | 106 (63.5%) | 0 (0.0%) |
| 8:00 AM to 8:29 AM | 0 (0.0%) | 0 (0.0%) |
| 8:30 AM to 8:59 AM | 0 (0.0%) | 14 (10.8%) |
| 9:00 AM to 9:59 AM | 0 (0.0%) | 0 (0.0%) |
| 10:00 AM to 10:59 AM | 13 (7.8%) | 33 (25.6%) |
| 11:00 AM to 11:59 AM | 0 (0.0%) | 0 (0.0%) |
| 12:00 PM to 3:59 PM | 0 (0.0%) | 0 (0.0%) |
| 4:00 PM to 11:59 PM | 0 (0.0%) | 0 (0.0%) |
| Total | 167 (100.0%) | 129 (100.0%) |
Housing Occupancy in New Kingstown
Occupancy by Ownership in New Kingstown
Of the total 353 dwellings in New Kingstown, owner-occupied units account for 143 (40.5%), while renter-occupied units make up 210 (59.5%).
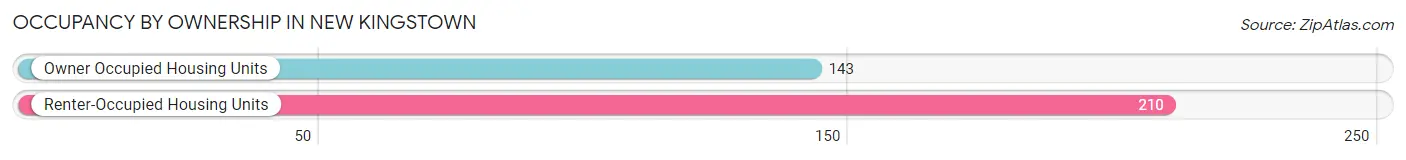
| Occupancy | # Housing Units | % Housing Units |
| Owner Occupied Housing Units | 143 | 40.5% |
| Renter-Occupied Housing Units | 210 | 59.5% |
| Total Occupied Housing Units | 353 | 100.0% |
Occupancy by Household Size in New Kingstown
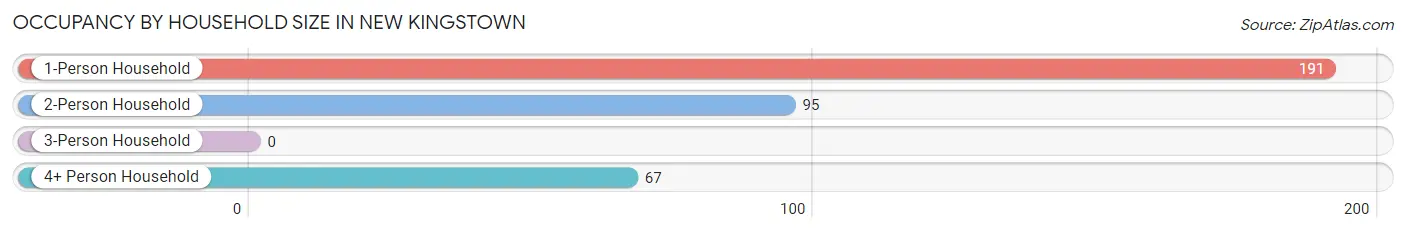
| Household Size | # Housing Units | % Housing Units |
| 1-Person Household | 191 | 54.1% |
| 2-Person Household | 95 | 26.9% |
| 3-Person Household | 0 | 0.0% |
| 4+ Person Household | 67 | 19.0% |
| Total Housing Units | 353 | 100.0% |
Occupancy by Ownership by Household Size in New Kingstown
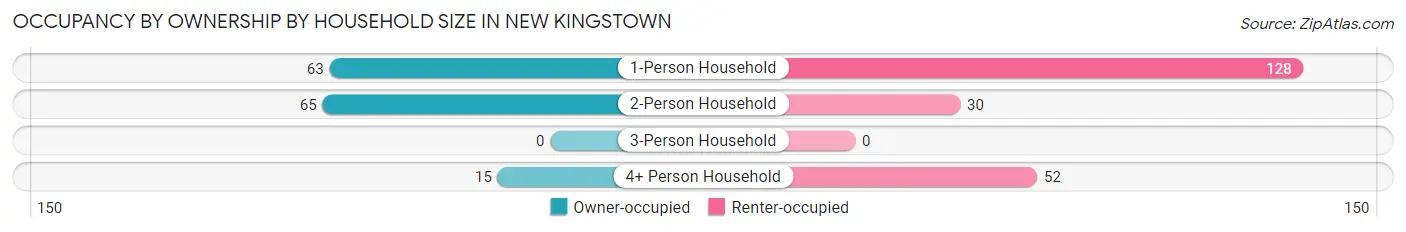
| Household Size | Owner-occupied | Renter-occupied |
| 1-Person Household | 63 (33.0%) | 128 (67.0%) |
| 2-Person Household | 65 (68.4%) | 30 (31.6%) |
| 3-Person Household | 0 (0.0%) | 0 (0.0%) |
| 4+ Person Household | 15 (22.4%) | 52 (77.6%) |
| Total Housing Units | 143 (40.5%) | 210 (59.5%) |
Occupancy by Educational Attainment in New Kingstown
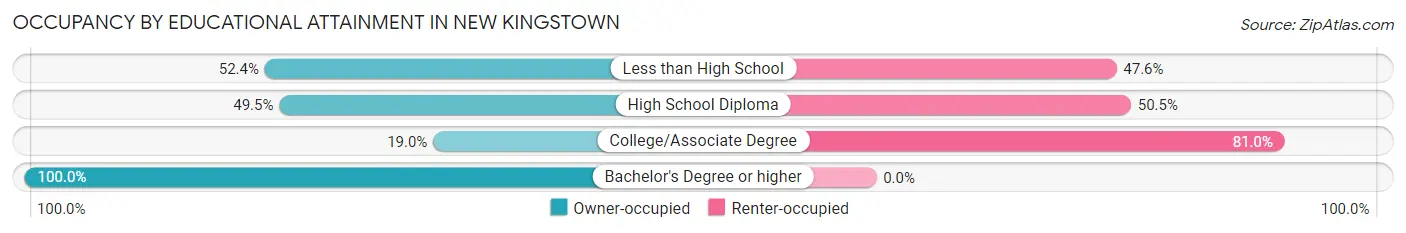
| Household Size | Owner-occupied | Renter-occupied |
| Less than High School | 33 (52.4%) | 30 (47.6%) |
| High School Diploma | 51 (49.5%) | 52 (50.5%) |
| College/Associate Degree | 30 (19.0%) | 128 (81.0%) |
| Bachelor's Degree or higher | 29 (100.0%) | 0 (0.0%) |
Occupancy by Age of Householder in New Kingstown
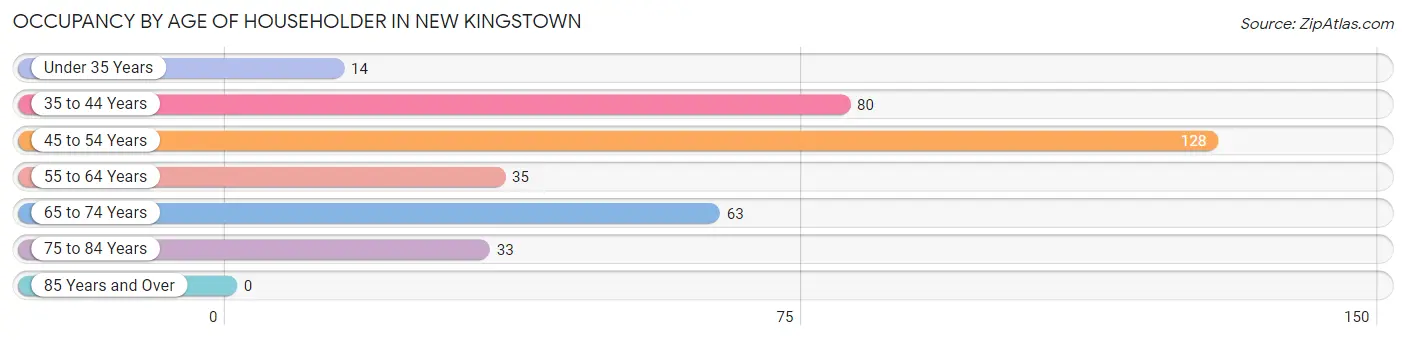
| Age Bracket | # Households | % Households |
| Under 35 Years | 14 | 4.0% |
| 35 to 44 Years | 80 | 22.7% |
| 45 to 54 Years | 128 | 36.3% |
| 55 to 64 Years | 35 | 9.9% |
| 65 to 74 Years | 63 | 17.8% |
| 75 to 84 Years | 33 | 9.3% |
| 85 Years and Over | 0 | 0.0% |
| Total | 353 | 100.0% |
Housing Finances in New Kingstown
Median Income by Occupancy in New Kingstown
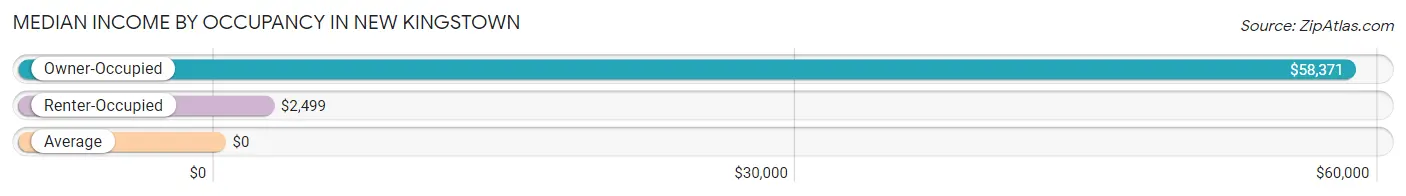
| Occupancy Type | # Households | Median Income |
| Owner-Occupied | 143 (40.5%) | $58,371 |
| Renter-Occupied | 210 (59.5%) | $2,499 |
| Average | 353 (100.0%) | $0 |
Occupancy by Householder Income Bracket in New Kingstown
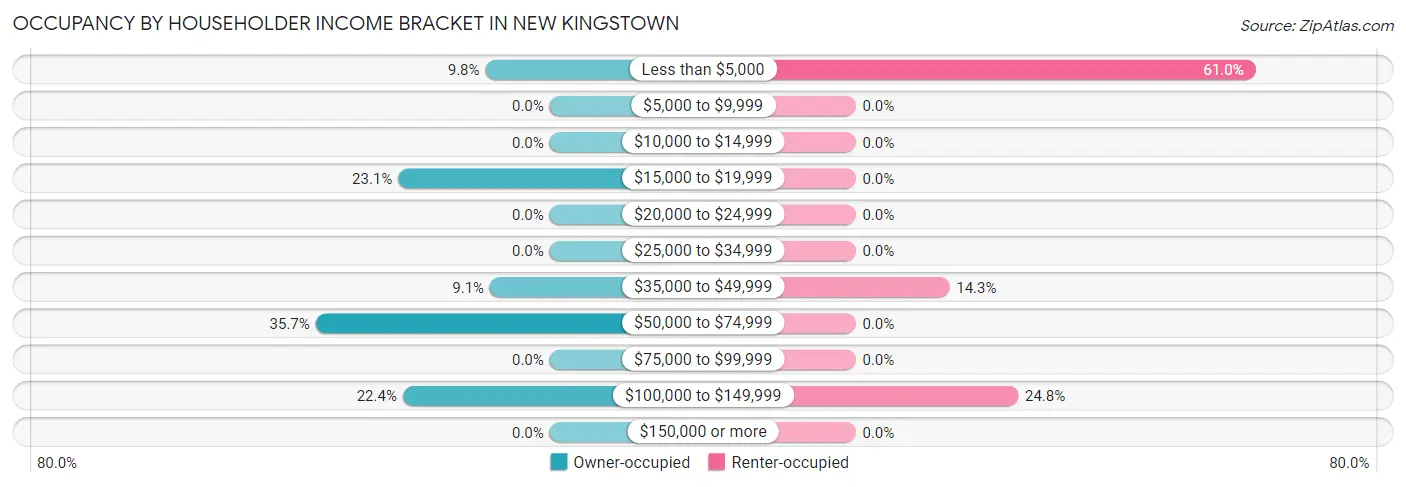
| Income Bracket | Owner-occupied | Renter-occupied |
| Less than $5,000 | 14 (9.8%) | 128 (61.0%) |
| $5,000 to $9,999 | 0 (0.0%) | 0 (0.0%) |
| $10,000 to $14,999 | 0 (0.0%) | 0 (0.0%) |
| $15,000 to $19,999 | 33 (23.1%) | 0 (0.0%) |
| $20,000 to $24,999 | 0 (0.0%) | 0 (0.0%) |
| $25,000 to $34,999 | 0 (0.0%) | 0 (0.0%) |
| $35,000 to $49,999 | 13 (9.1%) | 30 (14.3%) |
| $50,000 to $74,999 | 51 (35.7%) | 0 (0.0%) |
| $75,000 to $99,999 | 0 (0.0%) | 0 (0.0%) |
| $100,000 to $149,999 | 32 (22.4%) | 52 (24.8%) |
| $150,000 or more | 0 (0.0%) | 0 (0.0%) |
| Total | 143 (100.0%) | 210 (100.0%) |
Monthly Housing Cost Tiers in New Kingstown
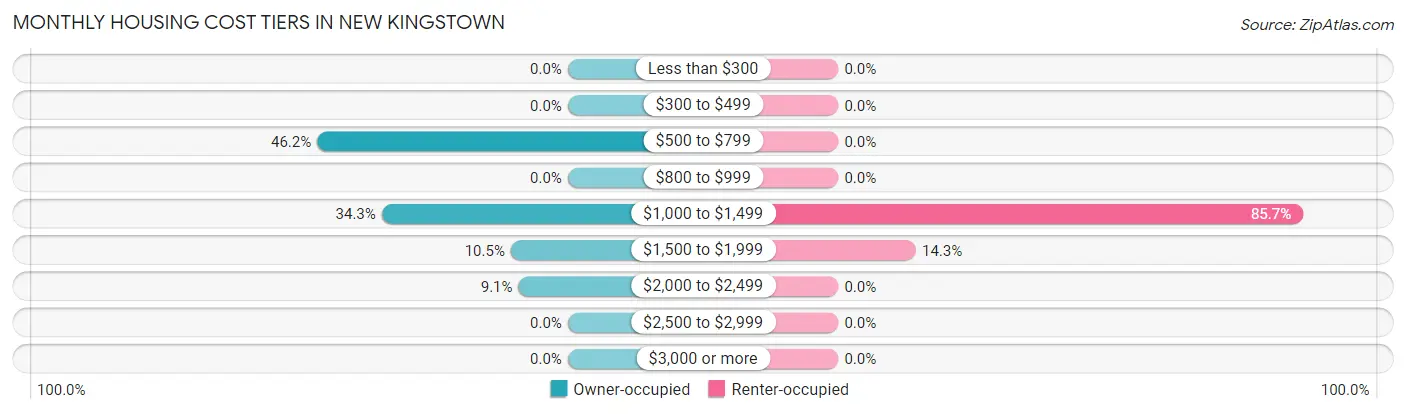
| Monthly Cost | Owner-occupied | Renter-occupied |
| Less than $300 | 0 (0.0%) | 0 (0.0%) |
| $300 to $499 | 0 (0.0%) | 0 (0.0%) |
| $500 to $799 | 66 (46.2%) | 0 (0.0%) |
| $800 to $999 | 0 (0.0%) | 0 (0.0%) |
| $1,000 to $1,499 | 49 (34.3%) | 180 (85.7%) |
| $1,500 to $1,999 | 15 (10.5%) | 30 (14.3%) |
| $2,000 to $2,499 | 13 (9.1%) | 0 (0.0%) |
| $2,500 to $2,999 | 0 (0.0%) | 0 (0.0%) |
| $3,000 or more | 0 (0.0%) | 0 (0.0%) |
| Total | 143 (100.0%) | 210 (100.0%) |
Physical Housing Characteristics in New Kingstown
Housing Structures in New Kingstown
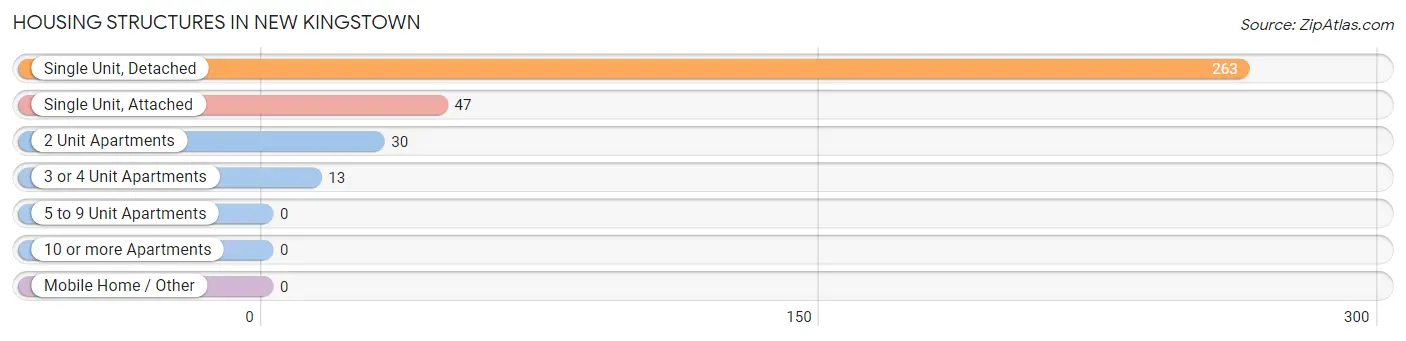
| Structure Type | # Housing Units | % Housing Units |
| Single Unit, Detached | 263 | 74.5% |
| Single Unit, Attached | 47 | 13.3% |
| 2 Unit Apartments | 30 | 8.5% |
| 3 or 4 Unit Apartments | 13 | 3.7% |
| 5 to 9 Unit Apartments | 0 | 0.0% |
| 10 or more Apartments | 0 | 0.0% |
| Mobile Home / Other | 0 | 0.0% |
| Total | 353 | 100.0% |
Housing Structures by Occupancy in New Kingstown
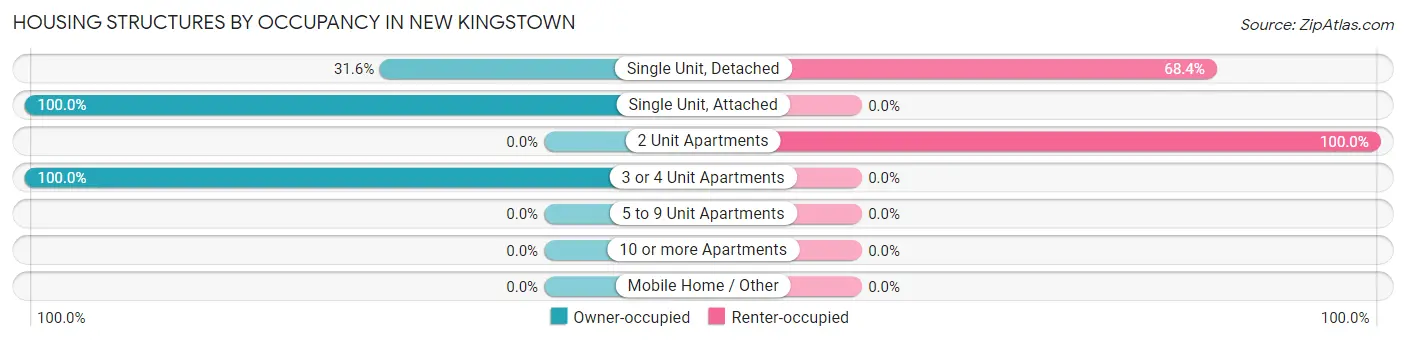
| Structure Type | Owner-occupied | Renter-occupied |
| Single Unit, Detached | 83 (31.6%) | 180 (68.4%) |
| Single Unit, Attached | 47 (100.0%) | 0 (0.0%) |
| 2 Unit Apartments | 0 (0.0%) | 30 (100.0%) |
| 3 or 4 Unit Apartments | 13 (100.0%) | 0 (0.0%) |
| 5 to 9 Unit Apartments | 0 (0.0%) | 0 (0.0%) |
| 10 or more Apartments | 0 (0.0%) | 0 (0.0%) |
| Mobile Home / Other | 0 (0.0%) | 0 (0.0%) |
| Total | 143 (40.5%) | 210 (59.5%) |
Housing Structures by Number of Rooms in New Kingstown
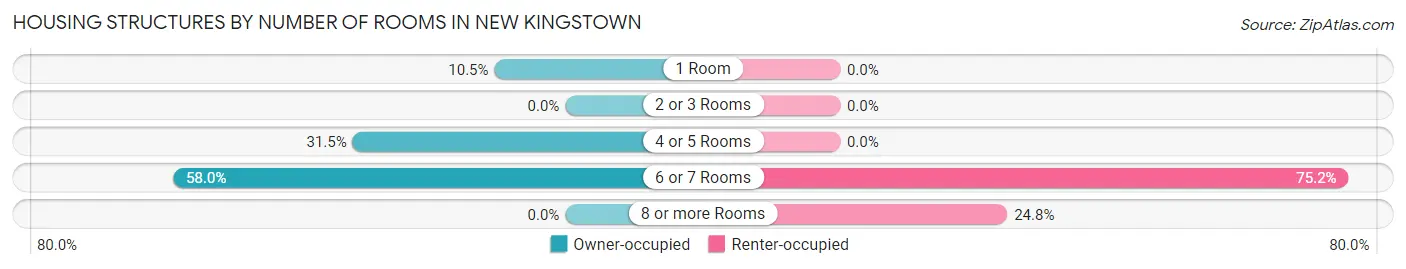
| Number of Rooms | Owner-occupied | Renter-occupied |
| 1 Room | 15 (10.5%) | 0 (0.0%) |
| 2 or 3 Rooms | 0 (0.0%) | 0 (0.0%) |
| 4 or 5 Rooms | 45 (31.5%) | 0 (0.0%) |
| 6 or 7 Rooms | 83 (58.0%) | 158 (75.2%) |
| 8 or more Rooms | 0 (0.0%) | 52 (24.8%) |
| Total | 143 (100.0%) | 210 (100.0%) |
Housing Structure by Heating Type in New Kingstown
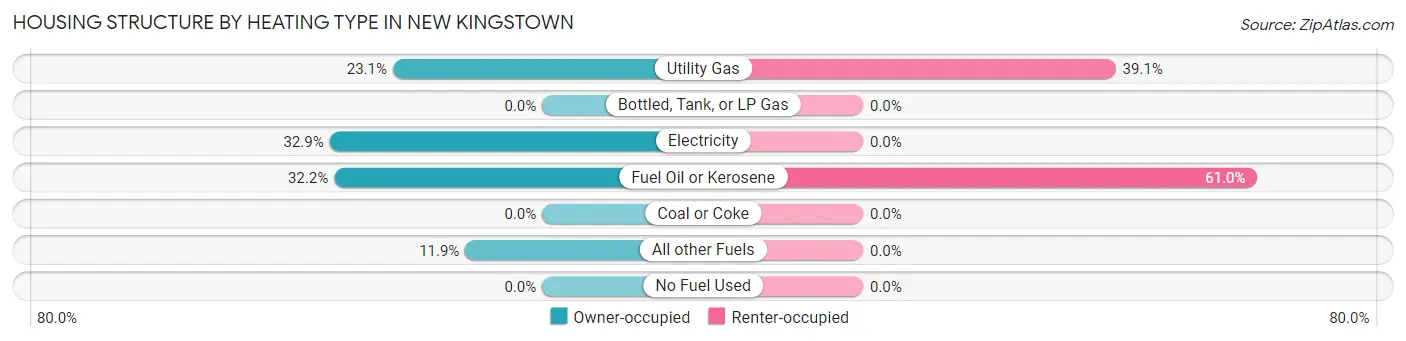
| Heating Type | Owner-occupied | Renter-occupied |
| Utility Gas | 33 (23.1%) | 82 (39.1%) |
| Bottled, Tank, or LP Gas | 0 (0.0%) | 0 (0.0%) |
| Electricity | 47 (32.9%) | 0 (0.0%) |
| Fuel Oil or Kerosene | 46 (32.2%) | 128 (61.0%) |
| Coal or Coke | 0 (0.0%) | 0 (0.0%) |
| All other Fuels | 17 (11.9%) | 0 (0.0%) |
| No Fuel Used | 0 (0.0%) | 0 (0.0%) |
| Total | 143 (100.0%) | 210 (100.0%) |
Household Vehicle Usage in New Kingstown
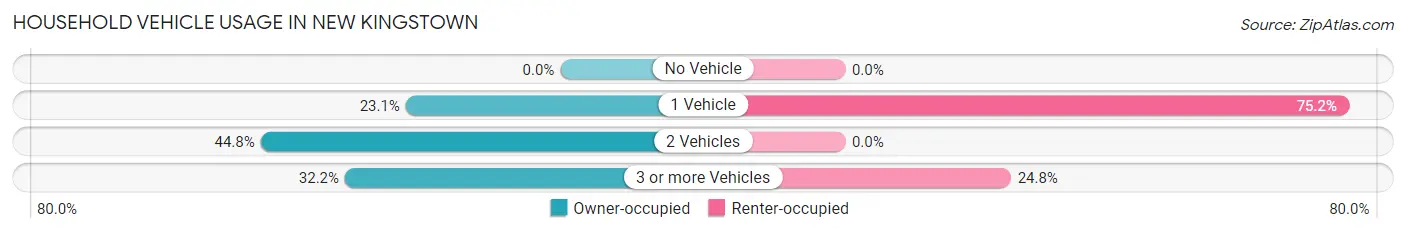
| Vehicles per Household | Owner-occupied | Renter-occupied |
| No Vehicle | 0 (0.0%) | 0 (0.0%) |
| 1 Vehicle | 33 (23.1%) | 158 (75.2%) |
| 2 Vehicles | 64 (44.8%) | 0 (0.0%) |
| 3 or more Vehicles | 46 (32.2%) | 52 (24.8%) |
| Total | 143 (100.0%) | 210 (100.0%) |
Real Estate & Mortgages in New Kingstown
Real Estate and Mortgage Overview in New Kingstown
| Characteristic | Without Mortgage | With Mortgage |
| Housing Units | 66 | 77 |
| Median Property Value | - | - |
| Median Household Income | - | - |
| Monthly Housing Costs | - | - |
| Real Estate Taxes | - | - |
Property Value by Mortgage Status in New Kingstown
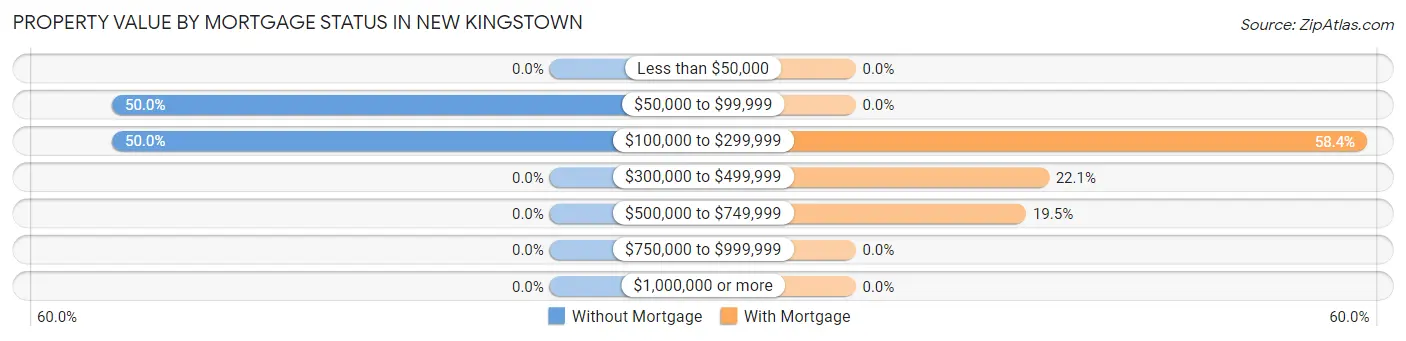
| Property Value | Without Mortgage | With Mortgage |
| Less than $50,000 | 0 (0.0%) | 0 (0.0%) |
| $50,000 to $99,999 | 33 (50.0%) | 0 (0.0%) |
| $100,000 to $299,999 | 33 (50.0%) | 45 (58.4%) |
| $300,000 to $499,999 | 0 (0.0%) | 17 (22.1%) |
| $500,000 to $749,999 | 0 (0.0%) | 15 (19.5%) |
| $750,000 to $999,999 | 0 (0.0%) | 0 (0.0%) |
| $1,000,000 or more | 0 (0.0%) | 0 (0.0%) |
| Total | 66 (100.0%) | 77 (100.0%) |
Household Income by Mortgage Status in New Kingstown
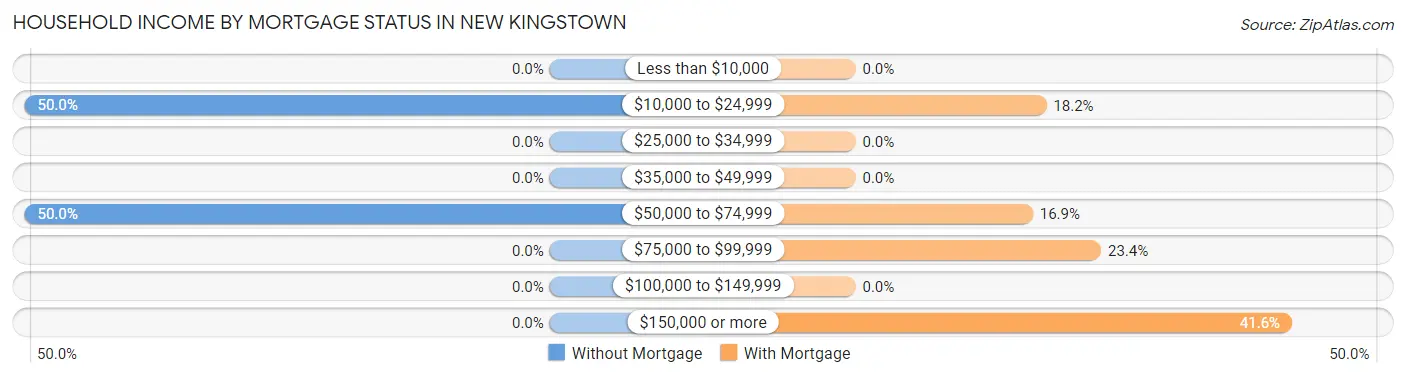
| Household Income | Without Mortgage | With Mortgage |
| Less than $10,000 | 0 (0.0%) | 0 (0.0%) |
| $10,000 to $24,999 | 33 (50.0%) | 14 (18.2%) |
| $25,000 to $34,999 | 0 (0.0%) | 0 (0.0%) |
| $35,000 to $49,999 | 0 (0.0%) | 0 (0.0%) |
| $50,000 to $74,999 | 33 (50.0%) | 13 (16.9%) |
| $75,000 to $99,999 | 0 (0.0%) | 18 (23.4%) |
| $100,000 to $149,999 | 0 (0.0%) | 0 (0.0%) |
| $150,000 or more | 0 (0.0%) | 32 (41.6%) |
| Total | 66 (100.0%) | 77 (100.0%) |
Property Value to Household Income Ratio in New Kingstown
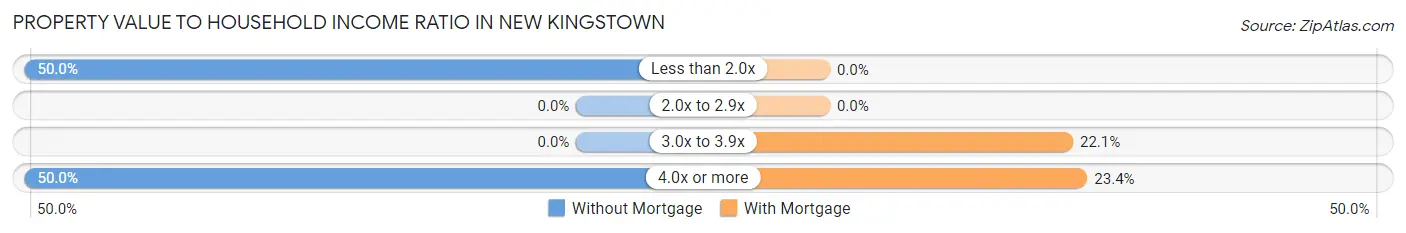
| Value-to-Income Ratio | Without Mortgage | With Mortgage |
| Less than 2.0x | 33 (50.0%) | 0 (0.0%) |
| 2.0x to 2.9x | 0 (0.0%) | 0 (0.0%) |
| 3.0x to 3.9x | 0 (0.0%) | 17 (22.1%) |
| 4.0x or more | 33 (50.0%) | 18 (23.4%) |
| Total | 66 (100.0%) | 77 (100.0%) |
Real Estate Taxes by Mortgage Status in New Kingstown
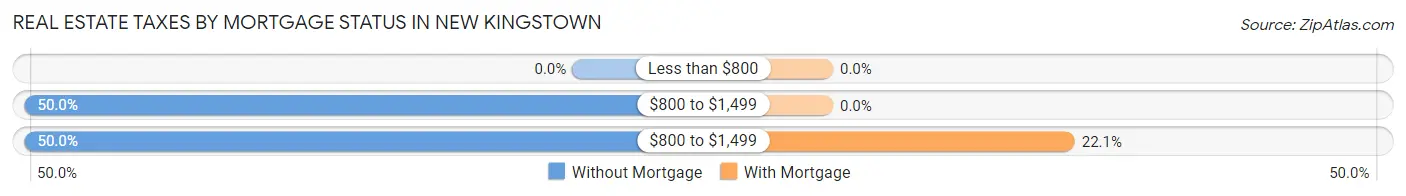
| Property Taxes | Without Mortgage | With Mortgage |
| Less than $800 | 0 (0.0%) | 0 (0.0%) |
| $800 to $1,499 | 33 (50.0%) | 0 (0.0%) |
| $800 to $1,499 | 33 (50.0%) | 17 (22.1%) |
| Total | 66 (100.0%) | 77 (100.0%) |
Health & Disability in New Kingstown
Health Insurance Coverage by Age in New Kingstown
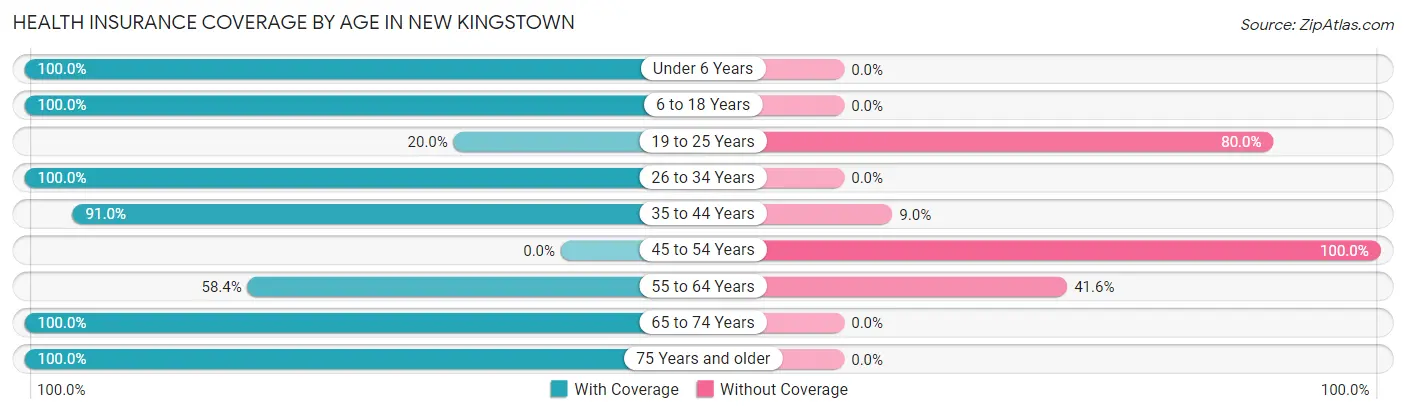
| Age Bracket | With Coverage | Without Coverage |
| Under 6 Years | 90 (100.0%) | 0 (0.0%) |
| 6 to 18 Years | 47 (100.0%) | 0 (0.0%) |
| 19 to 25 Years | 15 (20.0%) | 60 (80.0%) |
| 26 to 34 Years | 14 (100.0%) | 0 (0.0%) |
| 35 to 44 Years | 132 (91.0%) | 13 (9.0%) |
| 45 to 54 Years | 0 (0.0%) | 128 (100.0%) |
| 55 to 64 Years | 52 (58.4%) | 37 (41.6%) |
| 65 to 74 Years | 94 (100.0%) | 0 (0.0%) |
| 75 Years and older | 33 (100.0%) | 0 (0.0%) |
| Total | 477 (66.7%) | 238 (33.3%) |
Health Insurance Coverage by Citizenship Status in New Kingstown
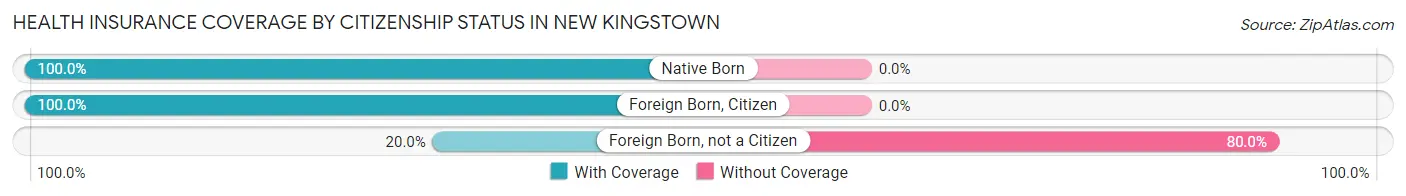
| Citizenship Status | With Coverage | Without Coverage |
| Native Born | 90 (100.0%) | 0 (0.0%) |
| Foreign Born, Citizen | 47 (100.0%) | 0 (0.0%) |
| Foreign Born, not a Citizen | 15 (20.0%) | 60 (80.0%) |
Health Insurance Coverage by Household Income in New Kingstown
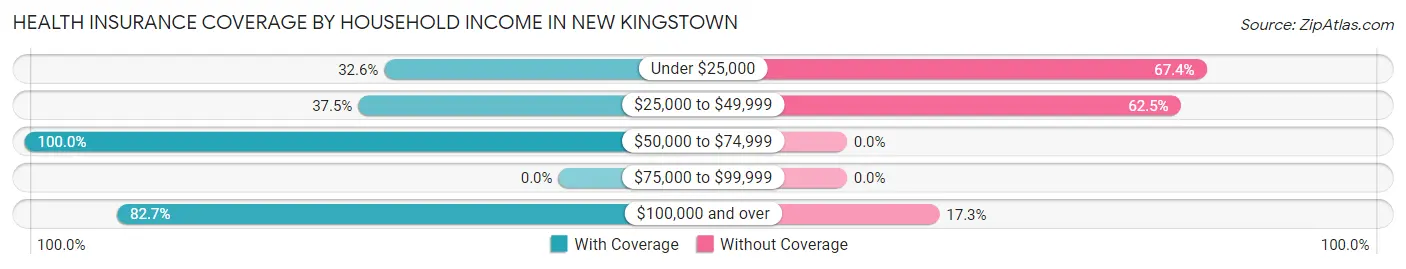
| Household Income | With Coverage | Without Coverage |
| Under $25,000 | 62 (32.6%) | 128 (67.4%) |
| $25,000 to $49,999 | 30 (37.5%) | 50 (62.5%) |
| $50,000 to $74,999 | 99 (100.0%) | 0 (0.0%) |
| $75,000 to $99,999 | 0 (0.0%) | 0 (0.0%) |
| $100,000 and over | 286 (82.7%) | 60 (17.3%) |
Public vs Private Health Insurance Coverage by Age in New Kingstown
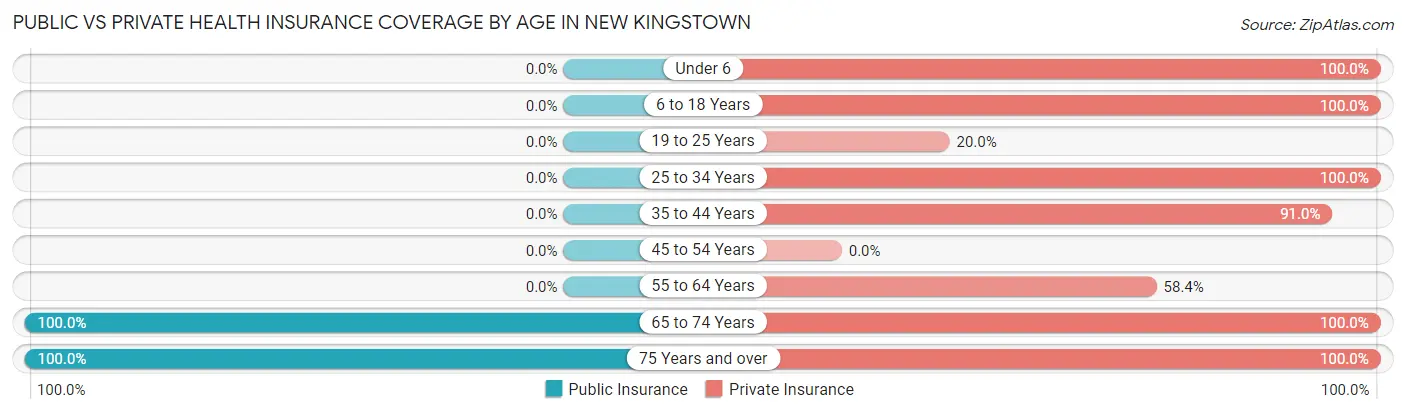
| Age Bracket | Public Insurance | Private Insurance |
| Under 6 | 0 (0.0%) | 90 (100.0%) |
| 6 to 18 Years | 0 (0.0%) | 47 (100.0%) |
| 19 to 25 Years | 0 (0.0%) | 15 (20.0%) |
| 25 to 34 Years | 0 (0.0%) | 14 (100.0%) |
| 35 to 44 Years | 0 (0.0%) | 132 (91.0%) |
| 45 to 54 Years | 0 (0.0%) | 0 (0.0%) |
| 55 to 64 Years | 0 (0.0%) | 52 (58.4%) |
| 65 to 74 Years | 94 (100.0%) | 94 (100.0%) |
| 75 Years and over | 33 (100.0%) | 33 (100.0%) |
| Total | 127 (17.8%) | 477 (66.7%) |
Disability Status by Sex by Age in New Kingstown
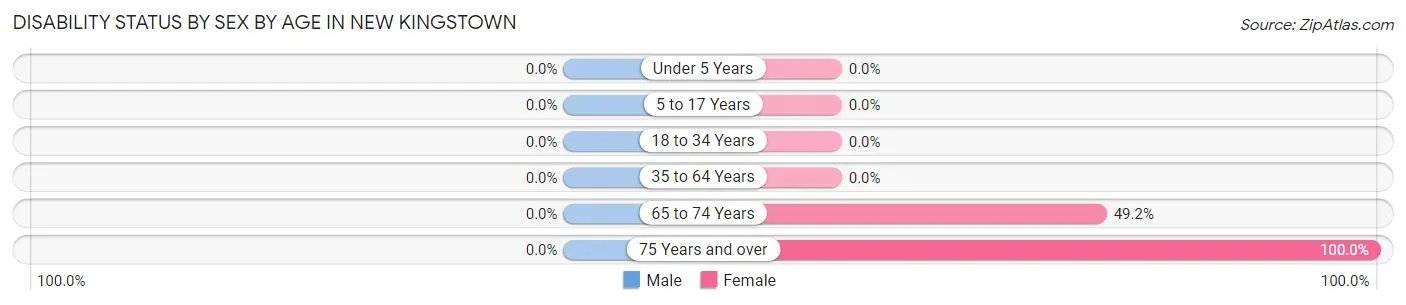
| Age Bracket | Male | Female |
| Under 5 Years | 0 (0.0%) | 0 (0.0%) |
| 5 to 17 Years | 0 (0.0%) | 0 (0.0%) |
| 18 to 34 Years | 0 (0.0%) | 0 (0.0%) |
| 35 to 64 Years | 0 (0.0%) | 0 (0.0%) |
| 65 to 74 Years | 0 (0.0%) | 30 (49.2%) |
| 75 Years and over | 0 (0.0%) | 33 (100.0%) |
Disability Class by Sex by Age in New Kingstown
Disability Class: Hearing Difficulty
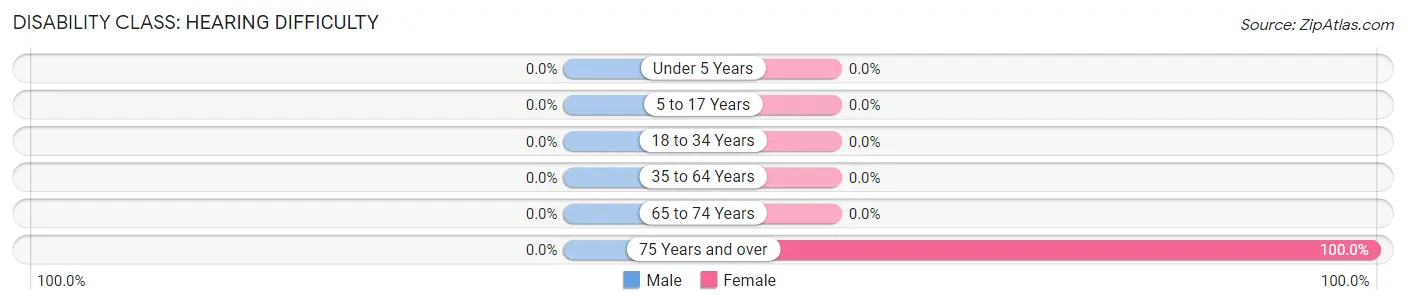
| Age Bracket | Male | Female |
| Under 5 Years | 0 (0.0%) | 0 (0.0%) |
| 5 to 17 Years | 0 (0.0%) | 0 (0.0%) |
| 18 to 34 Years | 0 (0.0%) | 0 (0.0%) |
| 35 to 64 Years | 0 (0.0%) | 0 (0.0%) |
| 65 to 74 Years | 0 (0.0%) | 0 (0.0%) |
| 75 Years and over | 0 (0.0%) | 33 (100.0%) |
Disability Class: Vision Difficulty
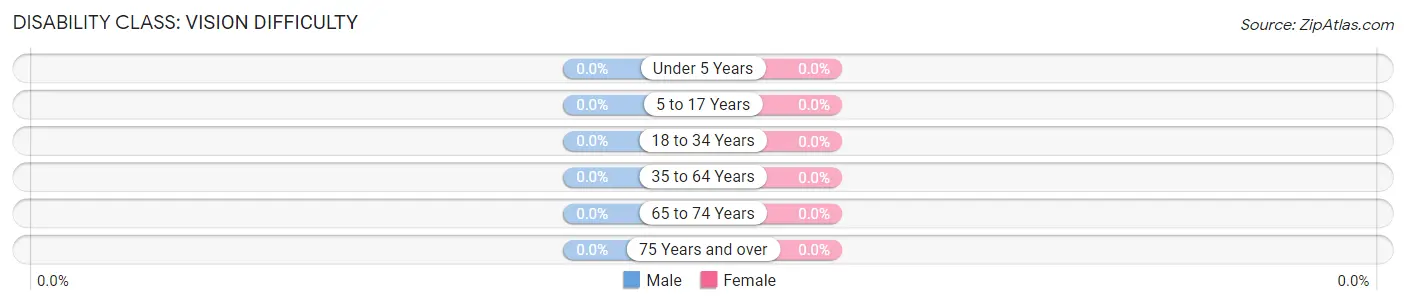
| Age Bracket | Male | Female |
| Under 5 Years | 0 (0.0%) | 0 (0.0%) |
| 5 to 17 Years | 0 (0.0%) | 0 (0.0%) |
| 18 to 34 Years | 0 (0.0%) | 0 (0.0%) |
| 35 to 64 Years | 0 (0.0%) | 0 (0.0%) |
| 65 to 74 Years | 0 (0.0%) | 0 (0.0%) |
| 75 Years and over | 0 (0.0%) | 0 (0.0%) |
Disability Class: Cognitive Difficulty
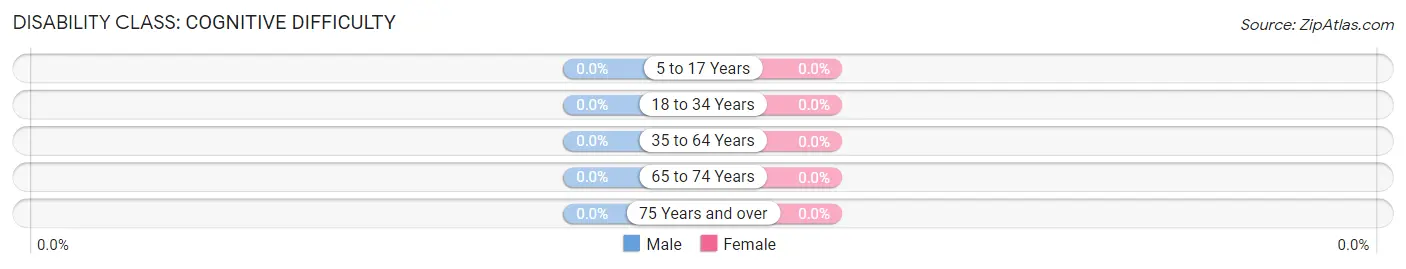
| Age Bracket | Male | Female |
| 5 to 17 Years | 0 (0.0%) | 0 (0.0%) |
| 18 to 34 Years | 0 (0.0%) | 0 (0.0%) |
| 35 to 64 Years | 0 (0.0%) | 0 (0.0%) |
| 65 to 74 Years | 0 (0.0%) | 0 (0.0%) |
| 75 Years and over | 0 (0.0%) | 0 (0.0%) |
Disability Class: Ambulatory Difficulty
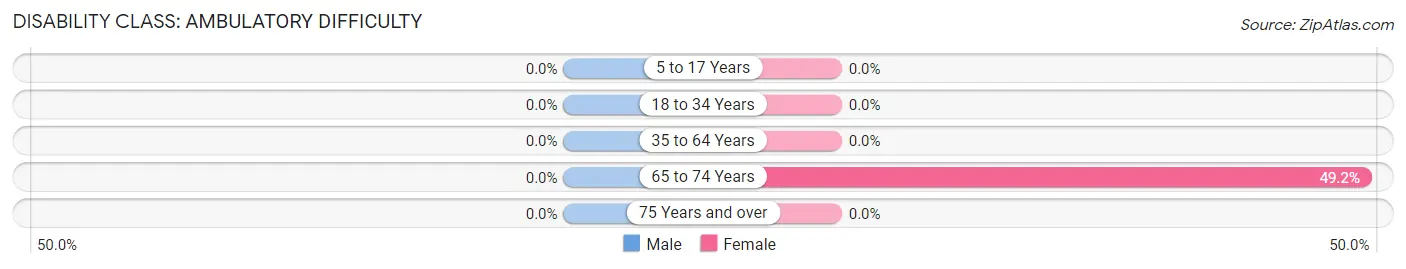
| Age Bracket | Male | Female |
| 5 to 17 Years | 0 (0.0%) | 0 (0.0%) |
| 18 to 34 Years | 0 (0.0%) | 0 (0.0%) |
| 35 to 64 Years | 0 (0.0%) | 0 (0.0%) |
| 65 to 74 Years | 0 (0.0%) | 30 (49.2%) |
| 75 Years and over | 0 (0.0%) | 0 (0.0%) |
Disability Class: Self-Care Difficulty
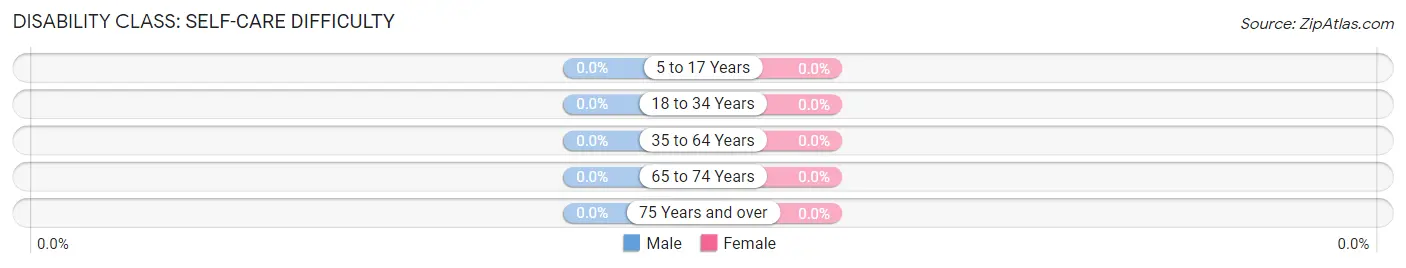
| Age Bracket | Male | Female |
| 5 to 17 Years | 0 (0.0%) | 0 (0.0%) |
| 18 to 34 Years | 0 (0.0%) | 0 (0.0%) |
| 35 to 64 Years | 0 (0.0%) | 0 (0.0%) |
| 65 to 74 Years | 0 (0.0%) | 0 (0.0%) |
| 75 Years and over | 0 (0.0%) | 0 (0.0%) |
Technology Access in New Kingstown
Computing Device Access in New Kingstown
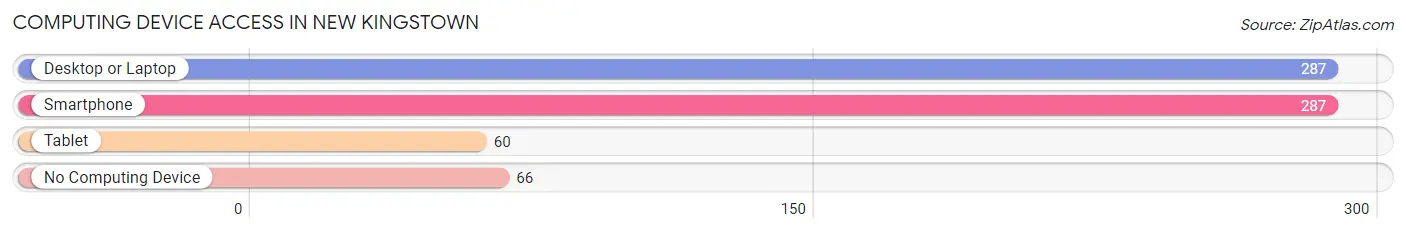
| Device Type | # Households | % Households |
| Desktop or Laptop | 287 | 81.3% |
| Smartphone | 287 | 81.3% |
| Tablet | 60 | 17.0% |
| No Computing Device | 66 | 18.7% |
| Total | 353 | 100.0% |
Internet Access in New Kingstown
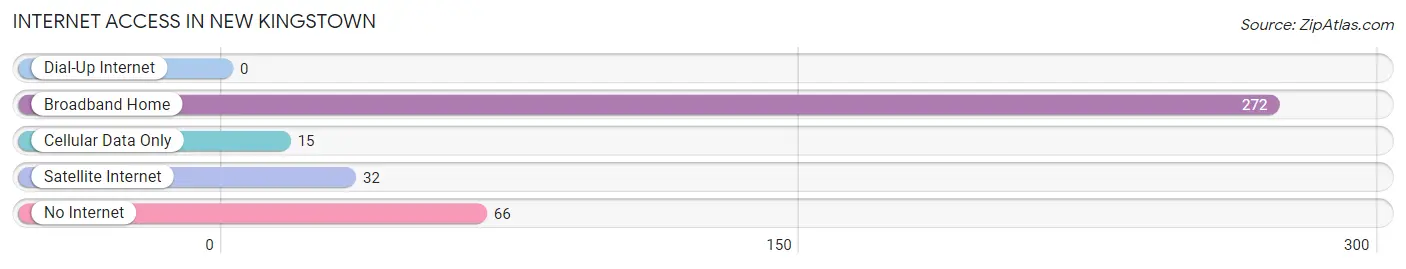
| Internet Type | # Households | % Households |
| Dial-Up Internet | 0 | 0.0% |
| Broadband Home | 272 | 77.0% |
| Cellular Data Only | 15 | 4.3% |
| Satellite Internet | 32 | 9.1% |
| No Internet | 66 | 18.7% |
| Total | 353 | 100.0% |
New Kingstown Summary
Kingstown, Pennsylvania is a small borough located in the heart of Lancaster County. It is situated in the southeastern corner of the county, just north of the Susquehanna River. The borough was founded in 1790 and is the oldest borough in Lancaster County. The population of Kingstown was 1,845 as of the 2010 census.
History
Kingstown was founded in 1790 by a group of settlers from the nearby town of Lancaster. The settlers were led by John King, who was a Quaker and a prominent figure in the area. The town was originally known as Kingstown, but the name was changed to New Kingstown in 1820 to distinguish it from the original Kingstown in Lancaster County.
The town was originally a farming community, but it soon developed into a small industrial center. The first industry in the town was a grist mill, which was built in 1810. This was followed by a sawmill, a tannery, and a woolen mill. The town also had a blacksmith shop, a general store, and a post office.
The town grew steadily throughout the 19th century, and by the turn of the century, it had become a bustling little town. The population peaked in 1910 at 2,072.
Geography
New Kingstown is located in the southeastern corner of Lancaster County, just north of the Susquehanna River. The borough is bordered by the townships of East Hempfield, West Hempfield, and East Donegal. The borough is situated on a hillside, with the Susquehanna River to the south and the Conestoga River to the east.
The borough covers an area of 0.8 square miles, all of which is land. The terrain is mostly flat, with some rolling hills. The climate is humid continental, with hot summers and cold winters.
Economy
The economy of New Kingstown is largely based on agriculture and manufacturing. The town is home to several small businesses, including a grocery store, a hardware store, and a few restaurants. The town also has a few small industrial parks, which are home to a variety of light manufacturing businesses.
The town is also home to a few large employers, including a poultry processing plant and a plastics manufacturing plant. The town also has a few small retail stores, including a few antique shops.
Demographics
As of the 2010 census, the population of New Kingstown was 1,845. The racial makeup of the town was 95.3% White, 1.2% African American, 0.3% Native American, 0.7% Asian, 0.1% Pacific Islander, and 2.4% from other races. Hispanic or Latino of any race were 3.2% of the population.
The median household income in New Kingstown was $45,938, and the median family income was $51,938. The per capita income was $20,938. About 8.3% of families and 10.2% of the population were below the poverty line, including 14.2% of those under age 18 and 6.2% of those age 65 or over.
Common Questions
What is Per Capita Income in New Kingstown?
Per Capita income in New Kingstown is $22,030.
What is the Median Family Income in New Kingstown?
Median Family Income in New Kingstown is $107,548.
What is Inequality or Gini Index in New Kingstown?
Inequality or Gini Index in New Kingstown is 0.59.
What is the Total Population of New Kingstown?
Total Population of New Kingstown is 715.
What is the Total Male Population of New Kingstown?
Total Male Population of New Kingstown is 365.
What is the Total Female Population of New Kingstown?
Total Female Population of New Kingstown is 350.
What is the Ratio of Males per 100 Females in New Kingstown?
There are 104.29 Males per 100 Females in New Kingstown.
What is the Ratio of Females per 100 Males in New Kingstown?
There are 95.89 Females per 100 Males in New Kingstown.
What is the Median Population Age in New Kingstown?
Median Population Age in New Kingstown is 44.0 Years.
What is the Average Family Size in New Kingstown
Average Family Size in New Kingstown is 3.5 People.
What is the Average Household Size in New Kingstown
Average Household Size in New Kingstown is 2.0 People.
How Large is the Labor Force in New Kingstown?
There are 356 People in the Labor Forcein in New Kingstown.
What is the Percentage of People in the Labor Force in New Kingstown?
61.6% of People are in the Labor Force in New Kingstown.
What is the Unemployment Rate in New Kingstown?
Unemployment Rate in New Kingstown is 16.9%.