Vineland, NJ Map & Demographics
Vineland Map
Vineland Overview
$32,195
PER CAPITA INCOME
$80,110
AVG FAMILY INCOME
$63,468
AVG HOUSEHOLD INCOME
26.5%
WAGE / INCOME GAP [ % ]
73.5¢/ $1
WAGE / INCOME GAP [ $ ]
$9,019
FAMILY INCOME DEFICIT
0.46
INEQUALITY / GINI INDEX
60,796
TOTAL POPULATION
29,752
MALE POPULATION
31,044
FEMALE POPULATION
95.84
MALES / 100 FEMALES
104.34
FEMALES / 100 MALES
38.6
MEDIAN AGE
3.3
AVG FAMILY SIZE
2.7
AVG HOUSEHOLD SIZE
28,782
LABOR FORCE [ PEOPLE ]
60.2%
PERCENT IN LABOR FORCE
8.3%
UNEMPLOYMENT RATE
Income in Vineland
Income Overview in Vineland
Per Capita Income in Vineland is $32,195, while median incomes of families and households are $80,110 and $63,468 respectively.
| Characteristic | Number | Measure |
| Per Capita Income | 60,796 | $32,195 |
| Median Family Income | 15,089 | $80,110 |
| Mean Family Income | 15,089 | $101,127 |
| Median Household Income | 21,572 | $63,468 |
| Mean Household Income | 21,572 | $87,972 |
| Income Deficit | 15,089 | $9,019 |
| Wage / Income Gap (%) | 60,796 | 26.52% |
| Wage / Income Gap ($) | 60,796 | 73.48¢ per $1 |
| Gini / Inequality Index | 60,796 | 0.46 |
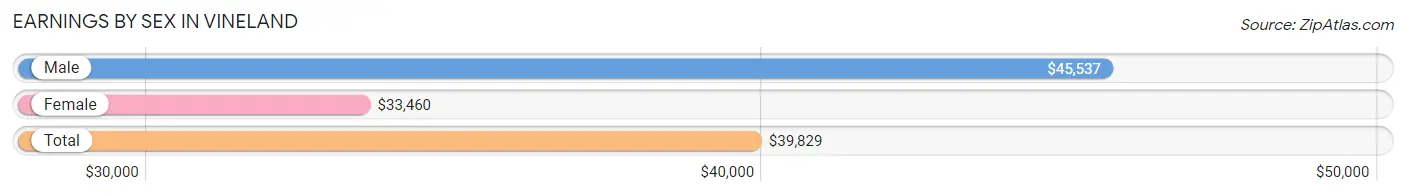
Earnings by Sex in Vineland
Average Earnings in Vineland are $39,829, $45,537 for men and $33,460 for women, a difference of 26.5%.
| Sex | Number | Average Earnings |
| Male | 15,061 (51.8%) | $45,537 |
| Female | 13,989 (48.1%) | $33,460 |
| Total | 29,050 (100.0%) | $39,829 |
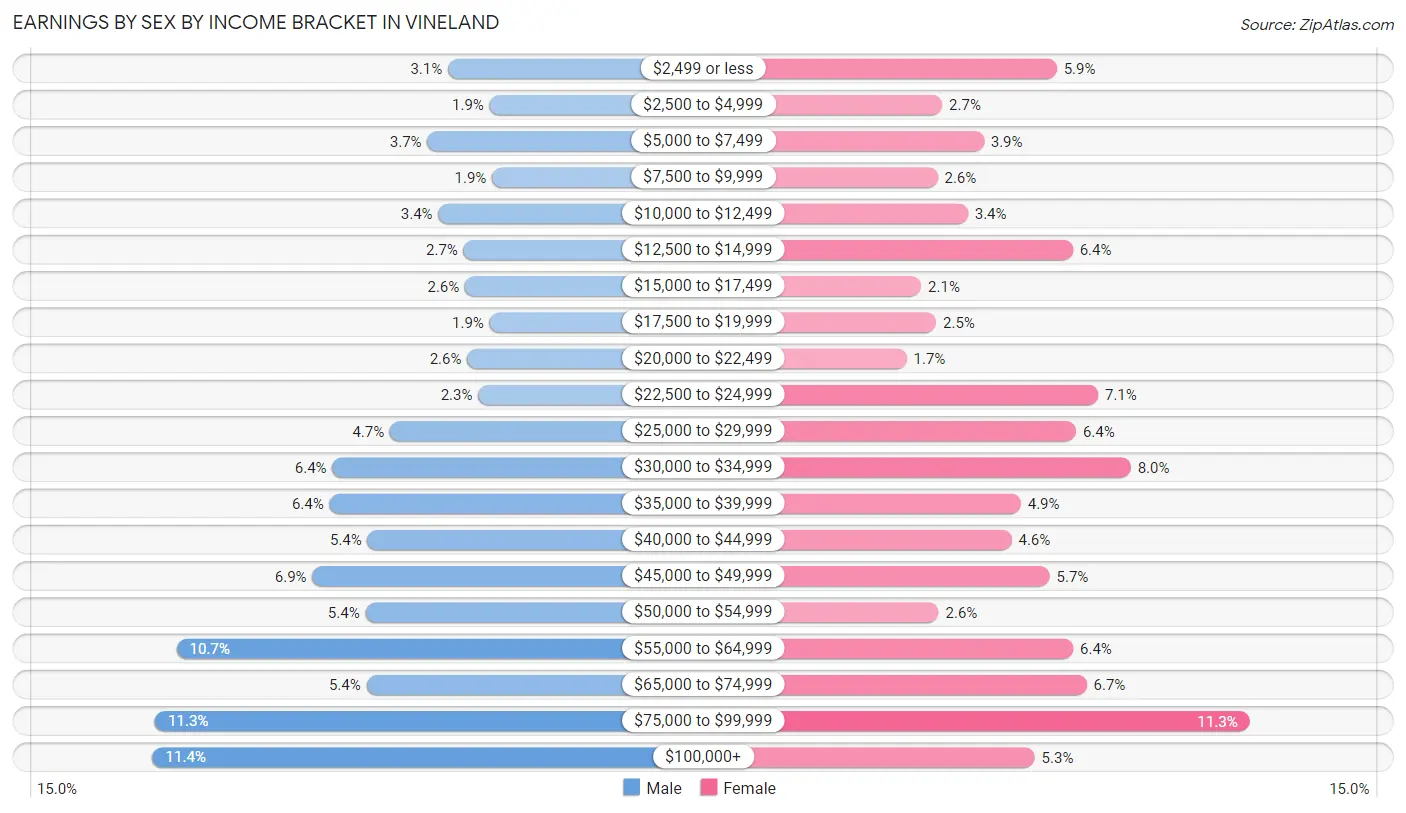
Earnings by Sex by Income Bracket in Vineland
The most common earnings brackets in Vineland are $100,000+ for men (1,717 | 11.4%) and $75,000 to $99,999 for women (1,584 | 11.3%).
| Income | Male | Female |
| $2,499 or less | 467 (3.1%) | 825 (5.9%) |
| $2,500 to $4,999 | 290 (1.9%) | 375 (2.7%) |
| $5,000 to $7,499 | 554 (3.7%) | 539 (3.8%) |
| $7,500 to $9,999 | 280 (1.9%) | 357 (2.5%) |
| $10,000 to $12,499 | 507 (3.4%) | 475 (3.4%) |
| $12,500 to $14,999 | 401 (2.7%) | 888 (6.4%) |
| $15,000 to $17,499 | 394 (2.6%) | 292 (2.1%) |
| $17,500 to $19,999 | 291 (1.9%) | 351 (2.5%) |
| $20,000 to $22,499 | 385 (2.6%) | 235 (1.7%) |
| $22,500 to $24,999 | 339 (2.2%) | 987 (7.1%) |
| $25,000 to $29,999 | 713 (4.7%) | 901 (6.4%) |
| $30,000 to $34,999 | 957 (6.4%) | 1,117 (8.0%) |
| $35,000 to $39,999 | 969 (6.4%) | 684 (4.9%) |
| $40,000 to $44,999 | 807 (5.4%) | 648 (4.6%) |
| $45,000 to $49,999 | 1,040 (6.9%) | 798 (5.7%) |
| $50,000 to $54,999 | 816 (5.4%) | 361 (2.6%) |
| $55,000 to $64,999 | 1,616 (10.7%) | 890 (6.4%) |
| $65,000 to $74,999 | 812 (5.4%) | 943 (6.7%) |
| $75,000 to $99,999 | 1,706 (11.3%) | 1,584 (11.3%) |
| $100,000+ | 1,717 (11.4%) | 739 (5.3%) |
| Total | 15,061 (100.0%) | 13,989 (100.0%) |
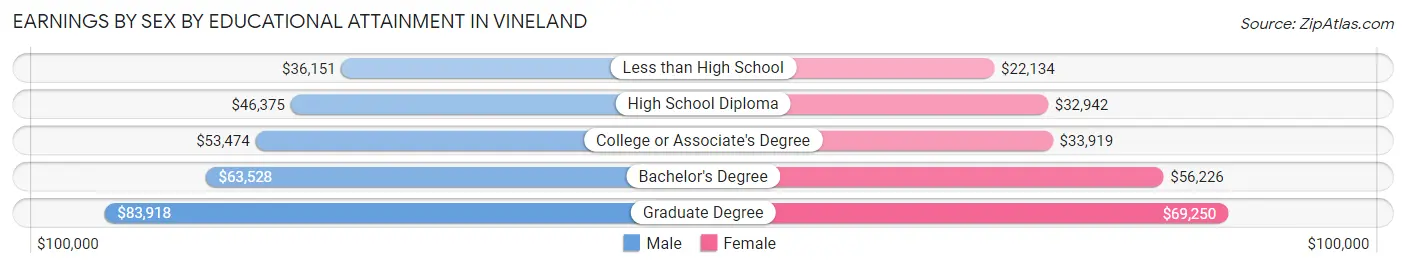
Earnings by Sex by Educational Attainment in Vineland
Average earnings in Vineland are $50,232 for men and $39,325 for women, a difference of 21.7%. Men with an educational attainment of graduate degree enjoy the highest average annual earnings of $83,918, while those with less than high school education earn the least with $36,151. Women with an educational attainment of graduate degree earn the most with the average annual earnings of $69,250, while those with less than high school education have the smallest earnings of $22,134.
| Educational Attainment | Male Income | Female Income |
| Less than High School | $36,151 | $22,134 |
| High School Diploma | $46,375 | $32,942 |
| College or Associate's Degree | $53,474 | $33,919 |
| Bachelor's Degree | $63,528 | $56,226 |
| Graduate Degree | $83,918 | $69,250 |
| Total | $50,232 | $39,325 |
Family Income in Vineland
Family Income Brackets in Vineland
According to the Vineland family income data, there are 3,048 families falling into the $100,000 to $149,999 income range, which is the most common income bracket and makes up 20.2% of all families. Conversely, the $10,000 to $14,999 income bracket is the least frequent group with only 347 families (2.3%) belonging to this category.
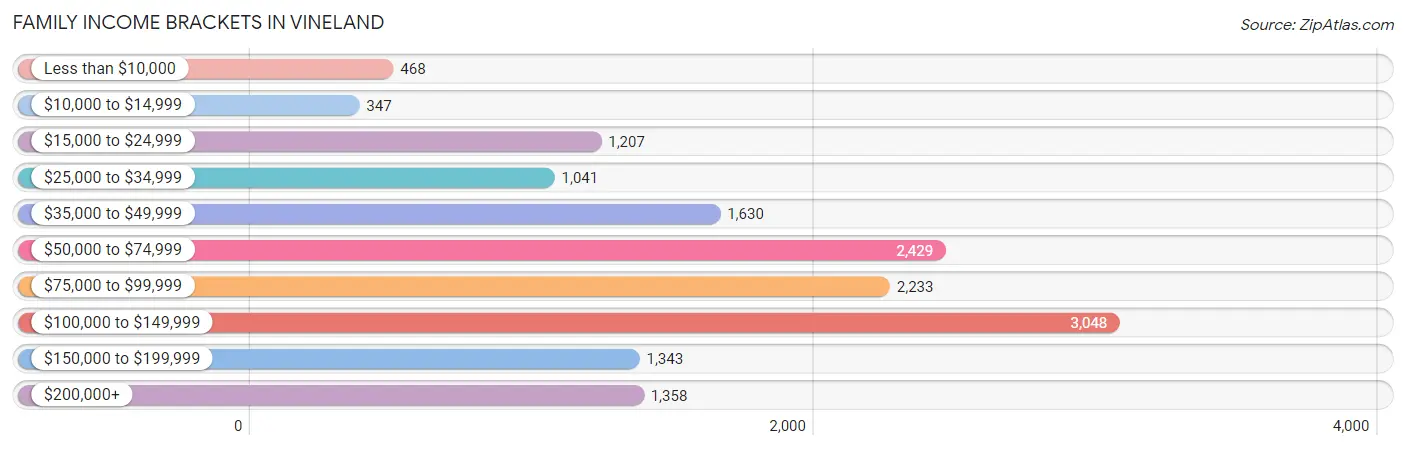
| Income Bracket | # Families | % Families |
| Less than $10,000 | 468 | 3.1% |
| $10,000 to $14,999 | 347 | 2.3% |
| $15,000 to $24,999 | 1,207 | 8.0% |
| $25,000 to $34,999 | 1,041 | 6.9% |
| $35,000 to $49,999 | 1,630 | 10.8% |
| $50,000 to $74,999 | 2,429 | 16.1% |
| $75,000 to $99,999 | 2,233 | 14.8% |
| $100,000 to $149,999 | 3,048 | 20.2% |
| $150,000 to $199,999 | 1,343 | 8.9% |
| $200,000+ | 1,358 | 9.0% |
Family Income by Famaliy Size in Vineland
7+ person families (290 | 1.9%) account for the highest median family income in Vineland with $122,500 per family, while 2-person families (6,396 | 42.4%) have the highest median income of $33,389 per family member.
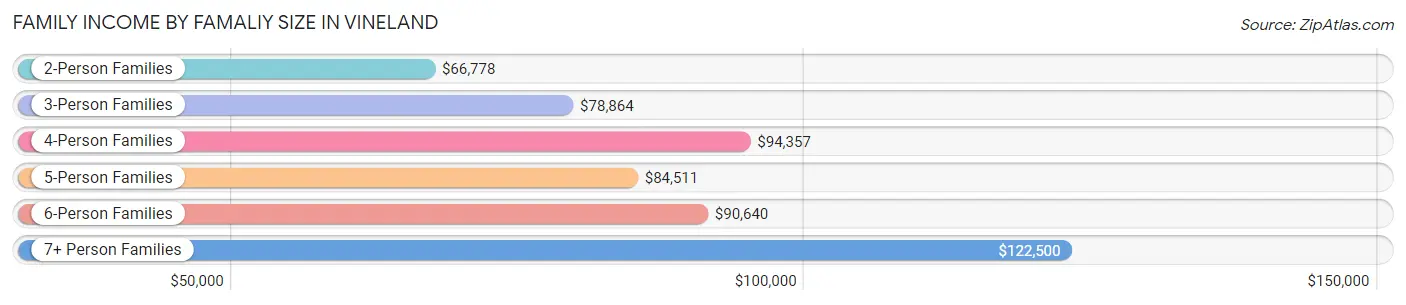
| Income Bracket | # Families | Median Income |
| 2-Person Families | 6,396 (42.4%) | $66,778 |
| 3-Person Families | 3,476 (23.0%) | $78,864 |
| 4-Person Families | 2,968 (19.7%) | $94,357 |
| 5-Person Families | 1,529 (10.1%) | $84,511 |
| 6-Person Families | 430 (2.9%) | $90,640 |
| 7+ Person Families | 290 (1.9%) | $122,500 |
| Total | 15,089 (100.0%) | $80,110 |
Family Income by Number of Earners in Vineland
The median family income in Vineland is $80,110, with families comprising 3+ earners (1,865) having the highest median family income of $126,639, while families with no earners (2,255) have the lowest median family income of $41,736, accounting for 12.4% and 14.9% of families, respectively.
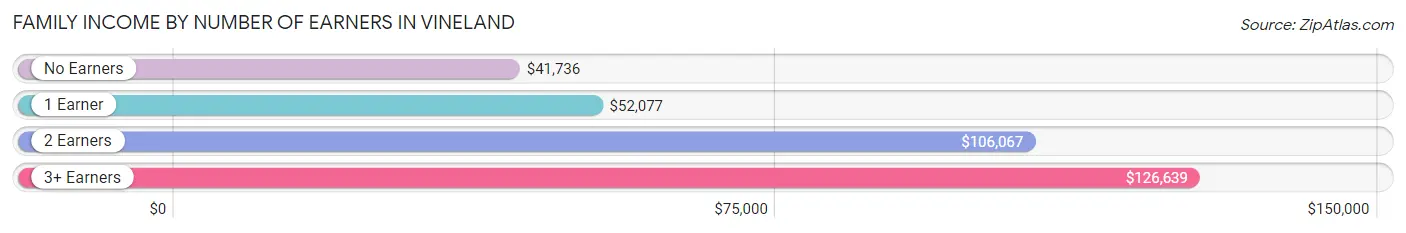
| Number of Earners | # Families | Median Income |
| No Earners | 2,255 (14.9%) | $41,736 |
| 1 Earner | 5,430 (36.0%) | $52,077 |
| 2 Earners | 5,539 (36.7%) | $106,067 |
| 3+ Earners | 1,865 (12.4%) | $126,639 |
| Total | 15,089 (100.0%) | $80,110 |
Household Income in Vineland
Household Income Brackets in Vineland
With 4,056 households falling in the category, the $50,000 to $74,999 income range is the most frequent in Vineland, accounting for 18.8% of all households. In contrast, only 1,014 households (4.7%) fall into the less than $10,000 income bracket, making it the least populous group.
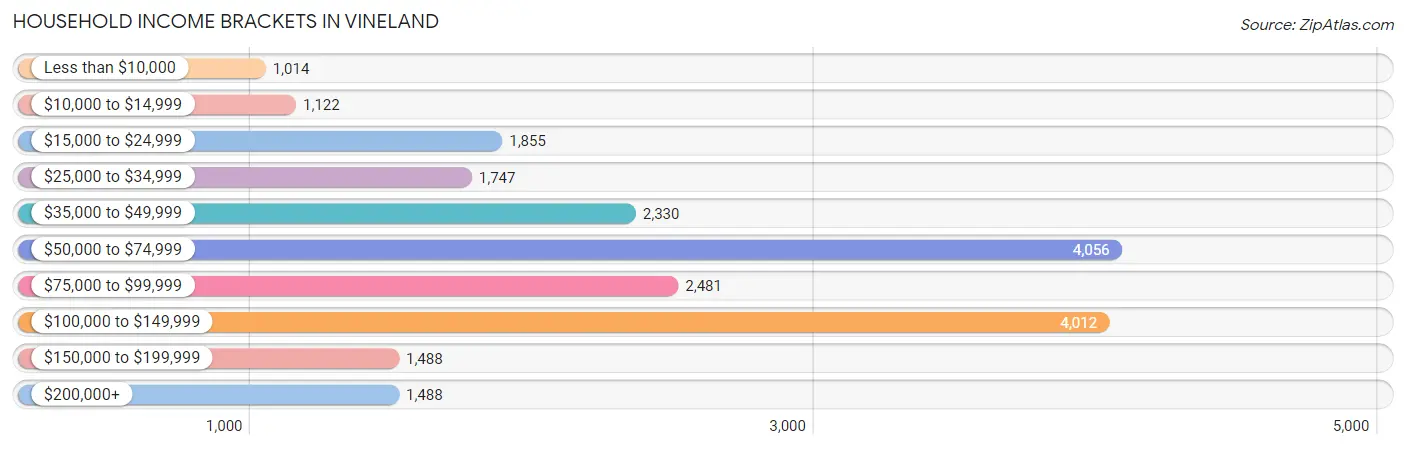
| Income Bracket | # Households | % Households |
| Less than $10,000 | 1,014 | 4.7% |
| $10,000 to $14,999 | 1,122 | 5.2% |
| $15,000 to $24,999 | 1,855 | 8.6% |
| $25,000 to $34,999 | 1,747 | 8.1% |
| $35,000 to $49,999 | 2,330 | 10.8% |
| $50,000 to $74,999 | 4,056 | 18.8% |
| $75,000 to $99,999 | 2,481 | 11.5% |
| $100,000 to $149,999 | 4,012 | 18.6% |
| $150,000 to $199,999 | 1,488 | 6.9% |
| $200,000+ | 1,488 | 6.9% |
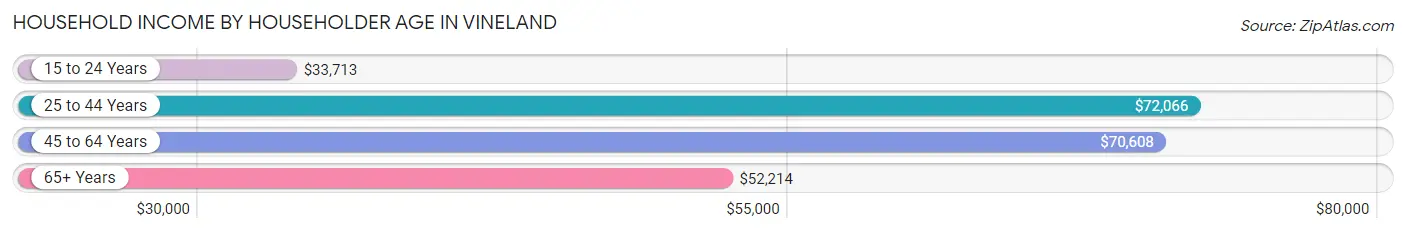
Household Income by Householder Age in Vineland
The median household income in Vineland is $63,468, with the highest median household income of $72,066 found in the 25 to 44 years age bracket for the primary householder. A total of 6,322 households (29.3%) fall into this category. Meanwhile, the 15 to 24 years age bracket for the primary householder has the lowest median household income of $33,713, with 605 households (2.8%) in this group.
| Income Bracket | # Households | Median Income |
| 15 to 24 Years | 605 (2.8%) | $33,713 |
| 25 to 44 Years | 6,322 (29.3%) | $72,066 |
| 45 to 64 Years | 8,540 (39.6%) | $70,608 |
| 65+ Years | 6,105 (28.3%) | $52,214 |
| Total | 21,572 (100.0%) | $63,468 |
Poverty in Vineland
Income Below Poverty by Sex and Age in Vineland
With 11.8% poverty level for males and 15.2% for females among the residents of Vineland, 15 year old males and 15 year old females are the most vulnerable to poverty, with 149 males (37.6%) and 143 females (39.4%) in their respective age groups living below the poverty level.
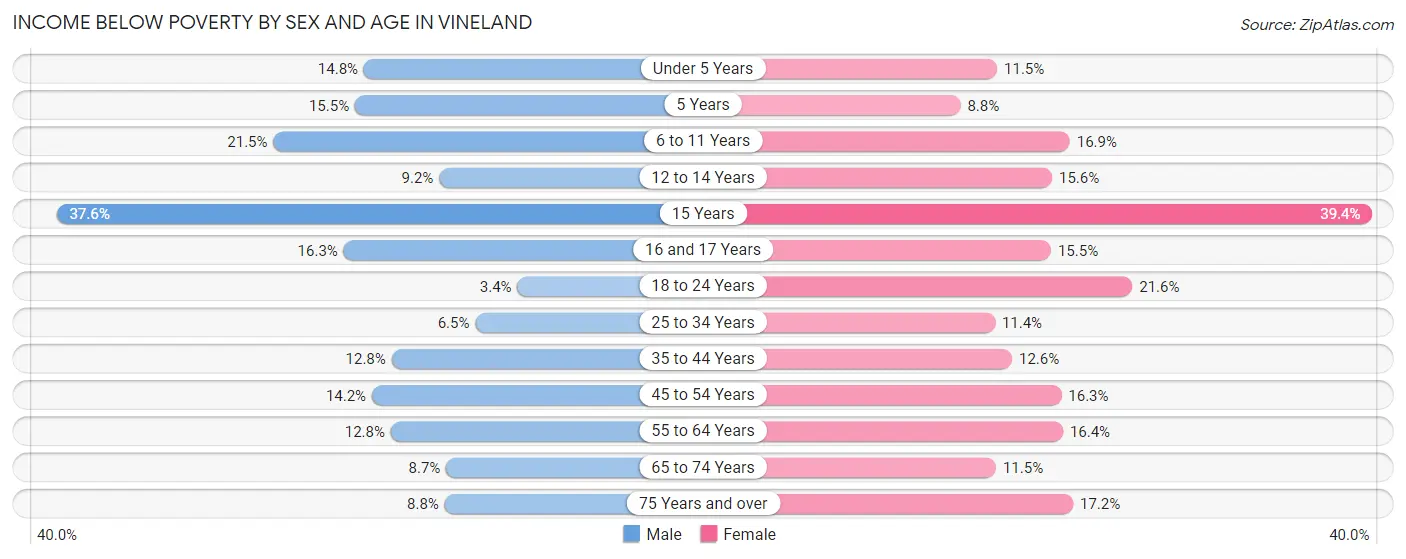
| Age Bracket | Male | Female |
| Under 5 Years | 255 (14.8%) | 225 (11.5%) |
| 5 Years | 93 (15.5%) | 37 (8.8%) |
| 6 to 11 Years | 626 (21.5%) | 395 (16.9%) |
| 12 to 14 Years | 93 (9.2%) | 195 (15.6%) |
| 15 Years | 149 (37.6%) | 143 (39.4%) |
| 16 and 17 Years | 121 (16.3%) | 114 (15.5%) |
| 18 to 24 Years | 115 (3.4%) | 506 (21.6%) |
| 25 to 34 Years | 254 (6.5%) | 391 (11.4%) |
| 35 to 44 Years | 446 (12.8%) | 500 (12.6%) |
| 45 to 54 Years | 481 (14.2%) | 668 (16.3%) |
| 55 to 64 Years | 467 (12.8%) | 690 (16.4%) |
| 65 to 74 Years | 236 (8.7%) | 339 (11.5%) |
| 75 Years and over | 136 (8.8%) | 427 (17.2%) |
| Total | 3,472 (11.8%) | 4,630 (15.2%) |
Income Above Poverty by Sex and Age in Vineland
According to the poverty statistics in Vineland, males aged 18 to 24 years and females aged 5 years are the age groups that are most secure financially, with 96.6% of males and 91.2% of females in these age groups living above the poverty line.
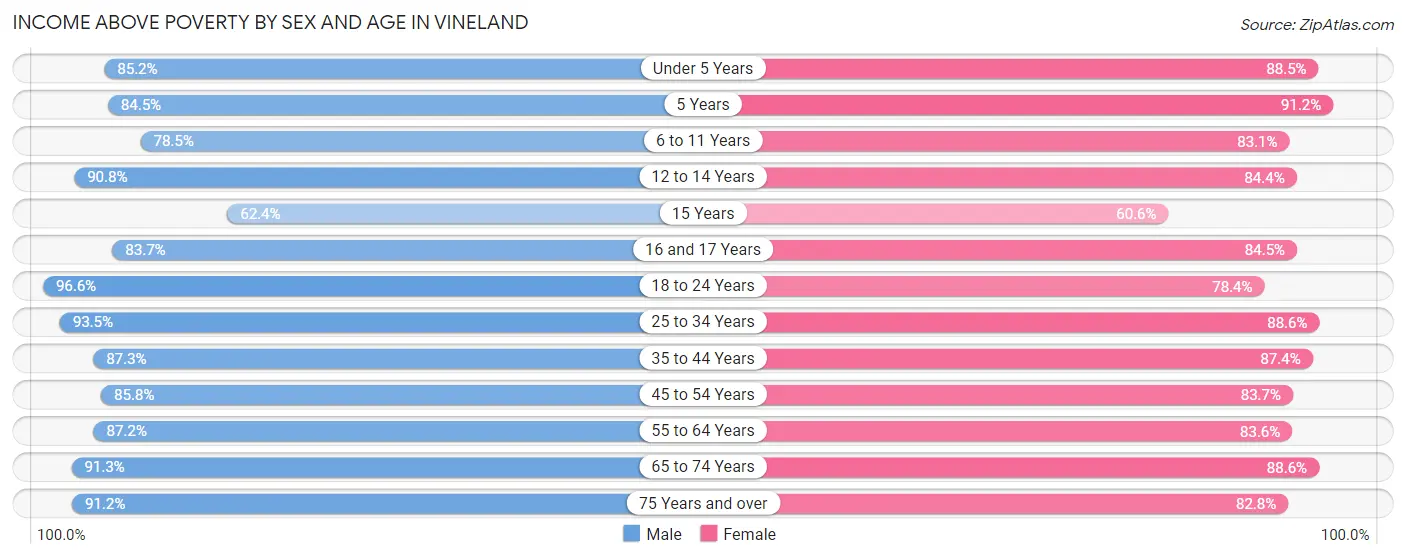
| Age Bracket | Male | Female |
| Under 5 Years | 1,467 (85.2%) | 1,727 (88.5%) |
| 5 Years | 508 (84.5%) | 383 (91.2%) |
| 6 to 11 Years | 2,281 (78.5%) | 1,938 (83.1%) |
| 12 to 14 Years | 916 (90.8%) | 1,054 (84.4%) |
| 15 Years | 247 (62.4%) | 220 (60.6%) |
| 16 and 17 Years | 621 (83.7%) | 620 (84.5%) |
| 18 to 24 Years | 3,256 (96.6%) | 1,840 (78.4%) |
| 25 to 34 Years | 3,627 (93.5%) | 3,049 (88.6%) |
| 35 to 44 Years | 3,051 (87.3%) | 3,455 (87.4%) |
| 45 to 54 Years | 2,903 (85.8%) | 3,431 (83.7%) |
| 55 to 64 Years | 3,179 (87.2%) | 3,512 (83.6%) |
| 65 to 74 Years | 2,477 (91.3%) | 2,621 (88.5%) |
| 75 Years and over | 1,407 (91.2%) | 2,060 (82.8%) |
| Total | 25,940 (88.2%) | 25,910 (84.8%) |
Income Below Poverty Among Married-Couple Families in Vineland
The poverty statistics for married-couple families in Vineland show that 5.4% or 530 of the total 9,785 families live below the poverty line. Families with no children have the highest poverty rate of 5.6%, comprising of 313 families. On the other hand, families with 5 or more children have the lowest poverty rate of 0.0%, which includes 0 families.
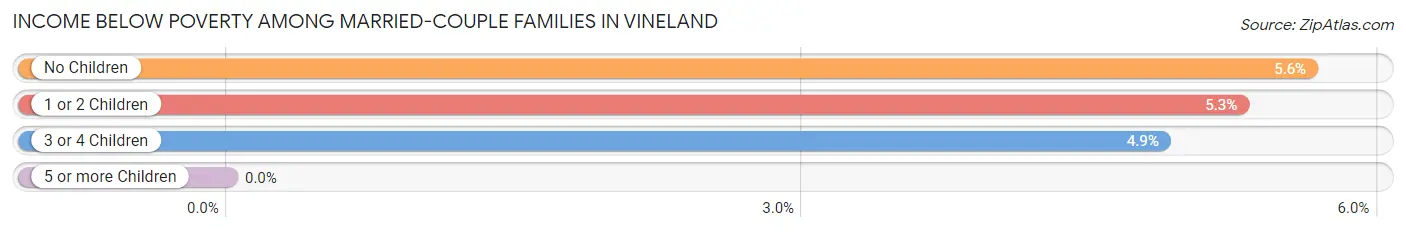
| Children | Above Poverty | Below Poverty |
| No Children | 5,241 (94.4%) | 313 (5.6%) |
| 1 or 2 Children | 3,138 (94.7%) | 175 (5.3%) |
| 3 or 4 Children | 821 (95.1%) | 42 (4.9%) |
| 5 or more Children | 55 (100.0%) | 0 (0.0%) |
| Total | 9,255 (94.6%) | 530 (5.4%) |
Income Below Poverty Among Single-Parent Households in Vineland
According to the poverty data in Vineland, 19.3% or 386 single-father households and 23.0% or 760 single-mother households are living below the poverty line. Among single-father households, those with 3 or 4 children have the highest poverty rate, with 106 households (39.3%) experiencing poverty. Likewise, among single-mother households, those with 3 or 4 children have the highest poverty rate, with 245 households (67.3%) falling below the poverty line.
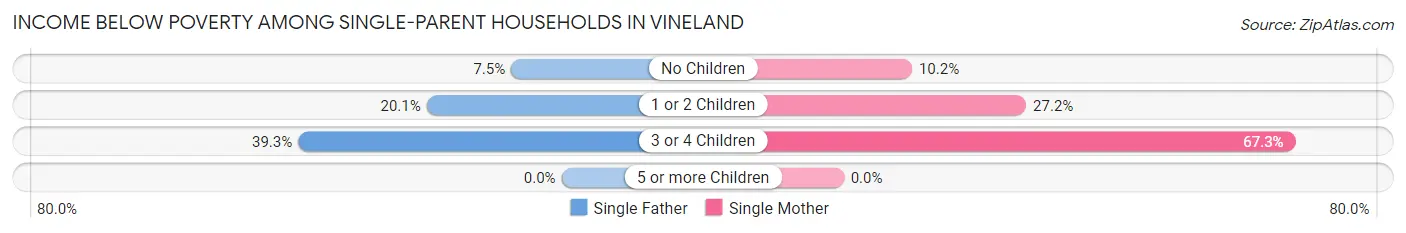
| Children | Single Father | Single Mother |
| No Children | 40 (7.5%) | 171 (10.2%) |
| 1 or 2 Children | 240 (20.1%) | 344 (27.2%) |
| 3 or 4 Children | 106 (39.3%) | 245 (67.3%) |
| 5 or more Children | 0 (0.0%) | 0 (0.0%) |
| Total | 386 (19.3%) | 760 (23.0%) |
Income Below Poverty Among Married-Couple vs Single-Parent Households in Vineland
The poverty data for Vineland shows that 530 of the married-couple family households (5.4%) and 1,146 of the single-parent households (21.6%) are living below the poverty level. Within the married-couple family households, those with no children have the highest poverty rate, with 313 households (5.6%) falling below the poverty line. Among the single-parent households, those with 3 or 4 children have the highest poverty rate, with 351 household (55.4%) living below poverty.
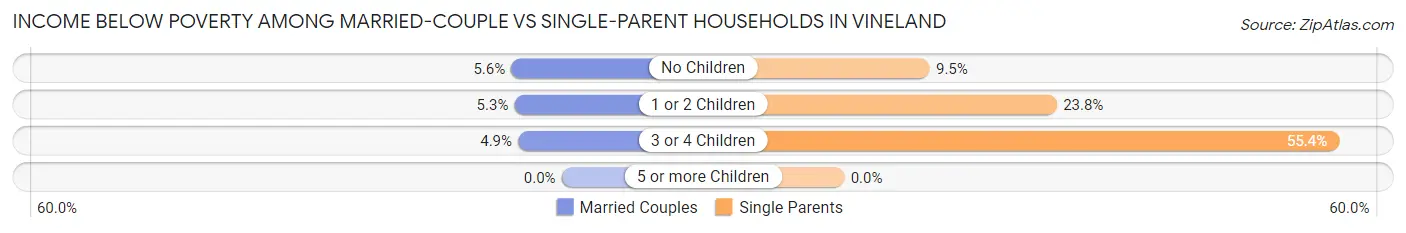
| Children | Married-Couple Families | Single-Parent Households |
| No Children | 313 (5.6%) | 211 (9.5%) |
| 1 or 2 Children | 175 (5.3%) | 584 (23.7%) |
| 3 or 4 Children | 42 (4.9%) | 351 (55.4%) |
| 5 or more Children | 0 (0.0%) | 0 (0.0%) |
| Total | 530 (5.4%) | 1,146 (21.6%) |
Race in Vineland
The most populous races in Vineland are White / Caucasian (34,084 | 56.1%), Hispanic or Latino (26,204 | 43.1%), and Some other Race (8,898 | 14.6%).
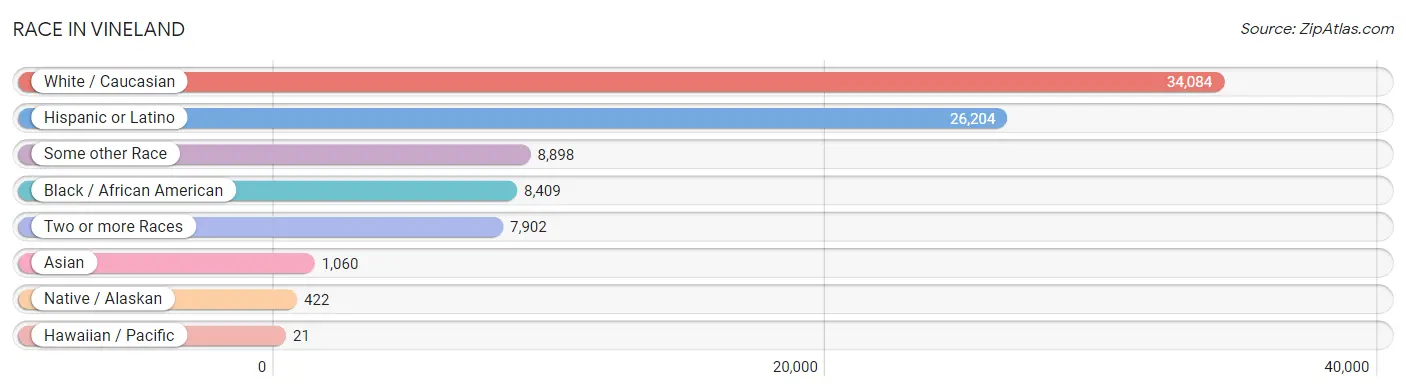
| Race | # Population | % Population |
| Asian | 1,060 | 1.7% |
| Black / African American | 8,409 | 13.8% |
| Hawaiian / Pacific | 21 | 0.0% |
| Hispanic or Latino | 26,204 | 43.1% |
| Native / Alaskan | 422 | 0.7% |
| White / Caucasian | 34,084 | 56.1% |
| Two or more Races | 7,902 | 13.0% |
| Some other Race | 8,898 | 14.6% |
| Total | 60,796 | 100.0% |
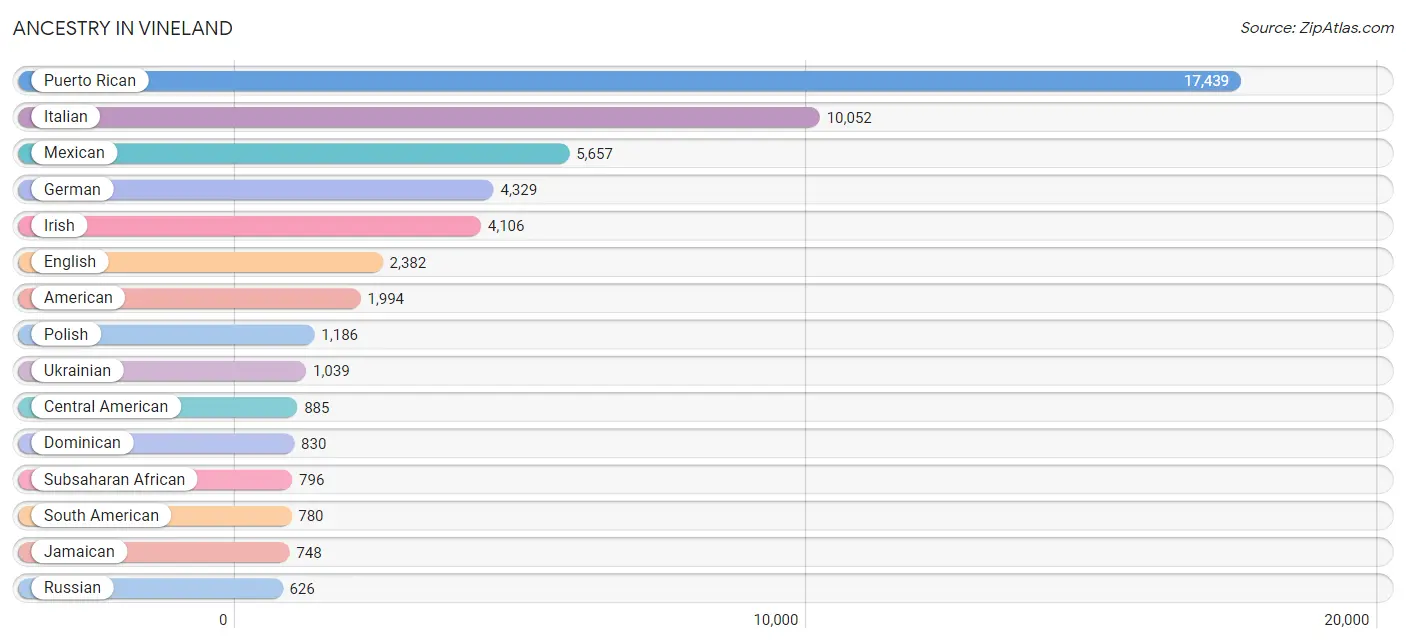
Ancestry in Vineland
The most populous ancestries reported in Vineland are Puerto Rican (17,439 | 28.7%), Italian (10,052 | 16.5%), Mexican (5,657 | 9.3%), German (4,329 | 7.1%), and Irish (4,106 | 6.8%), together accounting for 68.4% of all Vineland residents.
| Ancestry | # Population | % Population |
| African | 468 | 0.8% |
| American | 1,994 | 3.3% |
| Arab | 29 | 0.1% |
| Argentinean | 8 | 0.0% |
| Austrian | 221 | 0.4% |
| Belgian | 40 | 0.1% |
| Bermudan | 43 | 0.1% |
| Bhutanese | 98 | 0.2% |
| Blackfeet | 36 | 0.1% |
| Bolivian | 14 | 0.0% |
| Brazilian | 21 | 0.0% |
| British | 59 | 0.1% |
| Burmese | 9 | 0.0% |
| Canadian | 15 | 0.0% |
| Central American | 885 | 1.5% |
| Central American Indian | 582 | 1.0% |
| Cherokee | 13 | 0.0% |
| Colombian | 552 | 0.9% |
| Cuban | 265 | 0.4% |
| Czech | 45 | 0.1% |
| Czechoslovakian | 8 | 0.0% |
| Danish | 122 | 0.2% |
| Delaware | 227 | 0.4% |
| Dominican | 830 | 1.4% |
| Dutch | 166 | 0.3% |
| Eastern European | 31 | 0.1% |
| Ecuadorian | 206 | 0.3% |
| English | 2,382 | 3.9% |
| Ethiopian | 107 | 0.2% |
| European | 278 | 0.5% |
| French | 382 | 0.6% |
| French Canadian | 180 | 0.3% |
| German | 4,329 | 7.1% |
| Greek | 95 | 0.2% |
| Guamanian / Chamorro | 14 | 0.0% |
| Guatemalan | 379 | 0.6% |
| Guyanese | 118 | 0.2% |
| Haitian | 10 | 0.0% |
| Honduran | 5 | 0.0% |
| Hungarian | 252 | 0.4% |
| Indian (Asian) | 140 | 0.2% |
| Iranian | 16 | 0.0% |
| Irish | 4,106 | 6.8% |
| Israeli | 85 | 0.1% |
| Italian | 10,052 | 16.5% |
| Jamaican | 748 | 1.2% |
| Korean | 351 | 0.6% |
| Latvian | 80 | 0.1% |
| Lithuanian | 84 | 0.1% |
| Mexican | 5,657 | 9.3% |
| Mexican American Indian | 93 | 0.2% |
| Native Hawaiian | 21 | 0.0% |
| Nicaraguan | 144 | 0.2% |
| Nigerian | 221 | 0.4% |
| Northern European | 44 | 0.1% |
| Norwegian | 26 | 0.0% |
| Okinawan | 20 | 0.0% |
| Panamanian | 11 | 0.0% |
| Pennsylvania German | 8 | 0.0% |
| Polish | 1,186 | 1.9% |
| Puerto Rican | 17,439 | 28.7% |
| Russian | 626 | 1.0% |
| Salvadoran | 346 | 0.6% |
| Scandinavian | 11 | 0.0% |
| Scotch-Irish | 205 | 0.3% |
| Scottish | 267 | 0.4% |
| Serbian | 58 | 0.1% |
| Slovak | 51 | 0.1% |
| South American | 780 | 1.3% |
| South American Indian | 61 | 0.1% |
| Spaniard | 128 | 0.2% |
| Spanish | 83 | 0.1% |
| Subsaharan African | 796 | 1.3% |
| Swedish | 416 | 0.7% |
| Swiss | 30 | 0.1% |
| Thai | 542 | 0.9% |
| Trinidadian and Tobagonian | 32 | 0.1% |
| Turkish | 67 | 0.1% |
| Ukrainian | 1,039 | 1.7% |
| Vietnamese | 58 | 0.1% |
| Welsh | 149 | 0.3% |
| West Indian | 29 | 0.1% | View All 82 Rows |
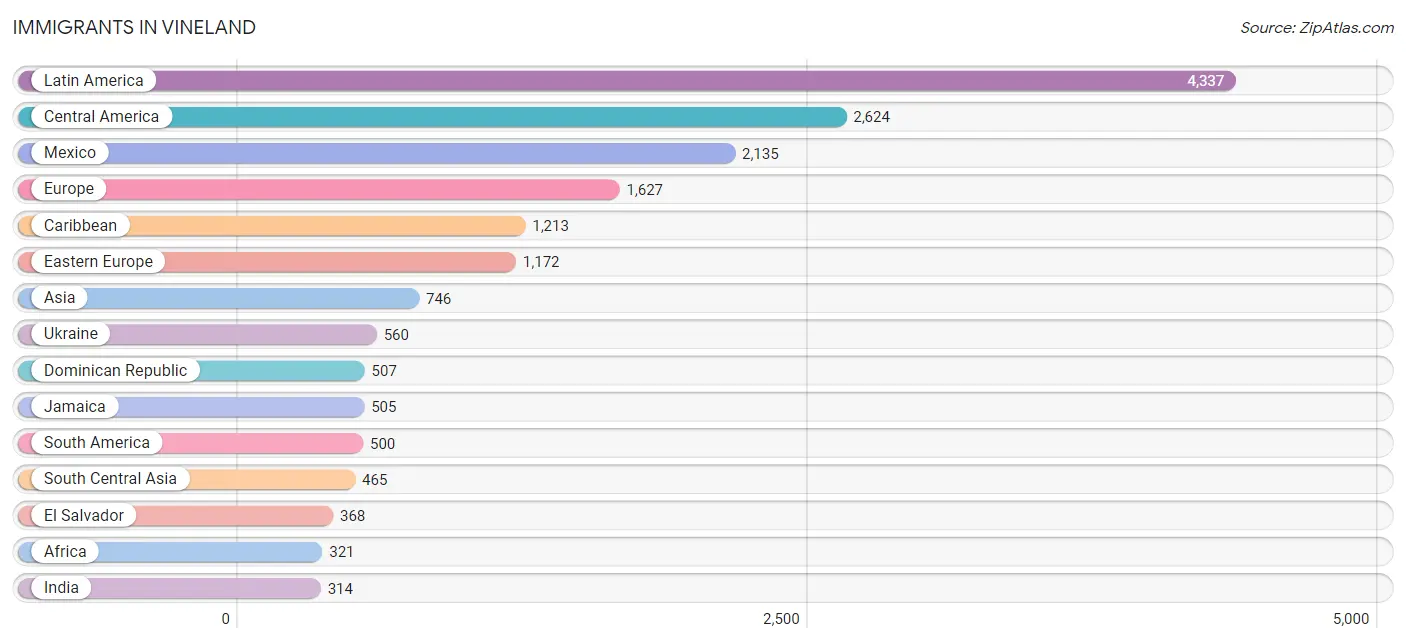
Immigrants in Vineland
The most numerous immigrant groups reported in Vineland came from Latin America (4,337 | 7.1%), Central America (2,624 | 4.3%), Mexico (2,135 | 3.5%), Europe (1,627 | 2.7%), and Caribbean (1,213 | 2.0%), together accounting for 19.6% of all Vineland residents.
| Immigration Origin | # Population | % Population |
| Africa | 321 | 0.5% |
| Asia | 746 | 1.2% |
| Australia | 6 | 0.0% |
| Bolivia | 14 | 0.0% |
| Brazil | 30 | 0.1% |
| Caribbean | 1,213 | 2.0% |
| Central America | 2,624 | 4.3% |
| China | 19 | 0.0% |
| Colombia | 161 | 0.3% |
| Cuba | 66 | 0.1% |
| Czechoslovakia | 29 | 0.1% |
| Dominican Republic | 507 | 0.8% |
| Eastern Africa | 64 | 0.1% |
| Eastern Asia | 28 | 0.1% |
| Eastern Europe | 1,172 | 1.9% |
| Ecuador | 295 | 0.5% |
| El Salvador | 368 | 0.6% |
| Ethiopia | 64 | 0.1% |
| Europe | 1,627 | 2.7% |
| France | 25 | 0.0% |
| Germany | 224 | 0.4% |
| Ghana | 56 | 0.1% |
| Greece | 45 | 0.1% |
| Guatemala | 105 | 0.2% |
| Haiti | 64 | 0.1% |
| Honduras | 5 | 0.0% |
| Hungary | 40 | 0.1% |
| India | 314 | 0.5% |
| Iran | 63 | 0.1% |
| Italy | 98 | 0.2% |
| Jamaica | 505 | 0.8% |
| Korea | 9 | 0.0% |
| Latin America | 4,337 | 7.1% |
| Latvia | 8 | 0.0% |
| Mexico | 2,135 | 3.5% |
| Morocco | 29 | 0.1% |
| Nigeria | 163 | 0.3% |
| Northern Africa | 29 | 0.1% |
| Northern Europe | 54 | 0.1% |
| Oceania | 6 | 0.0% |
| Pakistan | 87 | 0.1% |
| Panama | 11 | 0.0% |
| Philippines | 186 | 0.3% |
| Poland | 168 | 0.3% |
| Russia | 309 | 0.5% |
| Serbia | 58 | 0.1% |
| South America | 500 | 0.8% |
| South Central Asia | 465 | 0.8% |
| South Eastern Asia | 186 | 0.3% |
| Southern Europe | 152 | 0.3% |
| Spain | 9 | 0.0% |
| Sri Lanka | 1 | 0.0% |
| Sweden | 54 | 0.1% |
| Trinidad and Tobago | 71 | 0.1% |
| Turkey | 67 | 0.1% |
| Ukraine | 560 | 0.9% |
| Western Africa | 219 | 0.4% |
| Western Asia | 67 | 0.1% |
| Western Europe | 249 | 0.4% | View All 59 Rows |
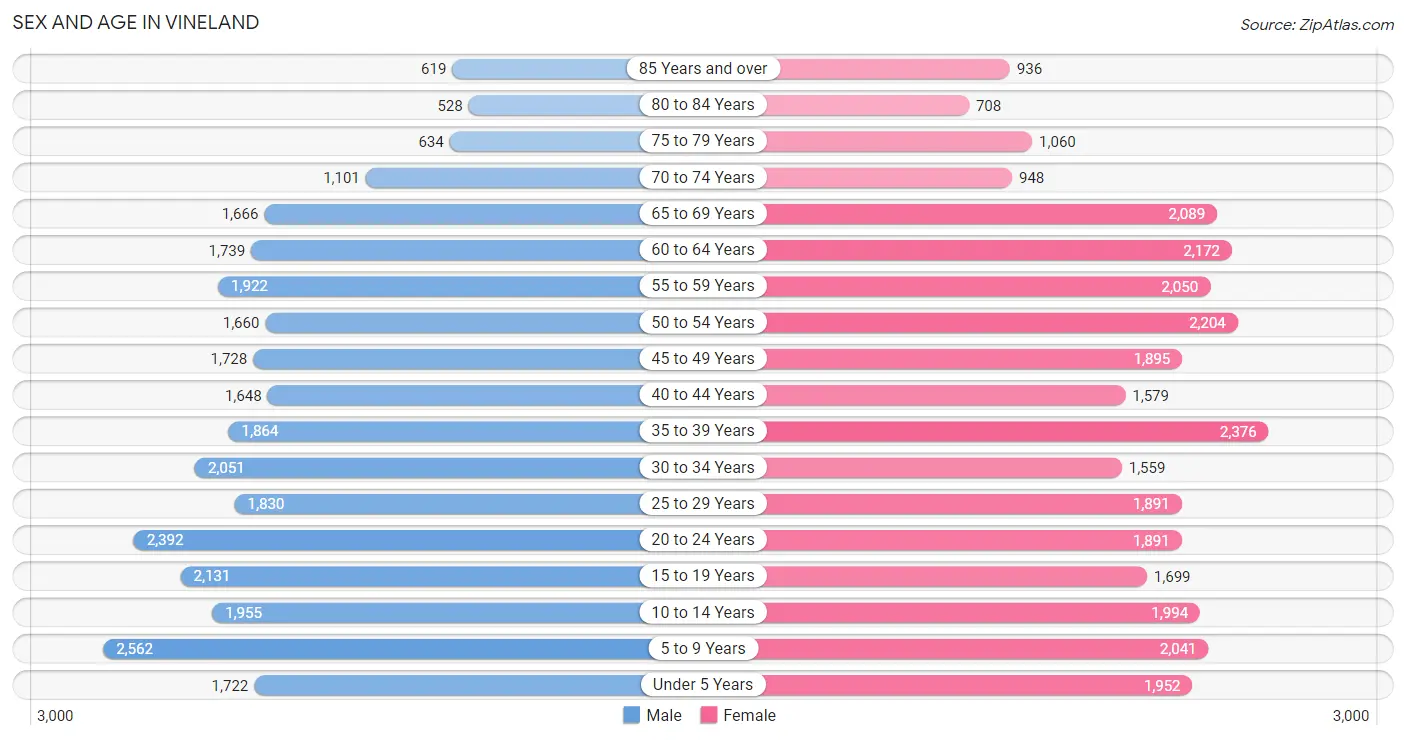
Sex and Age in Vineland
Sex and Age in Vineland
The most populous age groups in Vineland are 5 to 9 Years (2,562 | 8.6%) for men and 35 to 39 Years (2,376 | 7.6%) for women.
| Age Bracket | Male | Female |
| Under 5 Years | 1,722 (5.8%) | 1,952 (6.3%) |
| 5 to 9 Years | 2,562 (8.6%) | 2,041 (6.6%) |
| 10 to 14 Years | 1,955 (6.6%) | 1,994 (6.4%) |
| 15 to 19 Years | 2,131 (7.2%) | 1,699 (5.5%) |
| 20 to 24 Years | 2,392 (8.0%) | 1,891 (6.1%) |
| 25 to 29 Years | 1,830 (6.1%) | 1,891 (6.1%) |
| 30 to 34 Years | 2,051 (6.9%) | 1,559 (5.0%) |
| 35 to 39 Years | 1,864 (6.3%) | 2,376 (7.6%) |
| 40 to 44 Years | 1,648 (5.5%) | 1,579 (5.1%) |
| 45 to 49 Years | 1,728 (5.8%) | 1,895 (6.1%) |
| 50 to 54 Years | 1,660 (5.6%) | 2,204 (7.1%) |
| 55 to 59 Years | 1,922 (6.5%) | 2,050 (6.6%) |
| 60 to 64 Years | 1,739 (5.8%) | 2,172 (7.0%) |
| 65 to 69 Years | 1,666 (5.6%) | 2,089 (6.7%) |
| 70 to 74 Years | 1,101 (3.7%) | 948 (3.0%) |
| 75 to 79 Years | 634 (2.1%) | 1,060 (3.4%) |
| 80 to 84 Years | 528 (1.8%) | 708 (2.3%) |
| 85 Years and over | 619 (2.1%) | 936 (3.0%) |
| Total | 29,752 (100.0%) | 31,044 (100.0%) |
Families and Households in Vineland
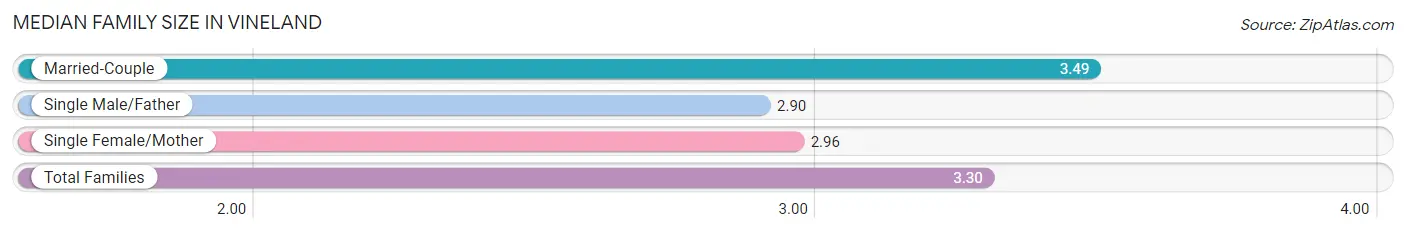
Median Family Size in Vineland
The median family size in Vineland is 3.30 persons per family, with married-couple families (9,785 | 64.8%) accounting for the largest median family size of 3.49 persons per family. On the other hand, single male/father families (1,996 | 13.2%) represent the smallest median family size with 2.90 persons per family.
| Family Type | # Families | Family Size |
| Married-Couple | 9,785 (64.8%) | 3.49 |
| Single Male/Father | 1,996 (13.2%) | 2.90 |
| Single Female/Mother | 3,308 (21.9%) | 2.96 |
| Total Families | 15,089 (100.0%) | 3.30 |
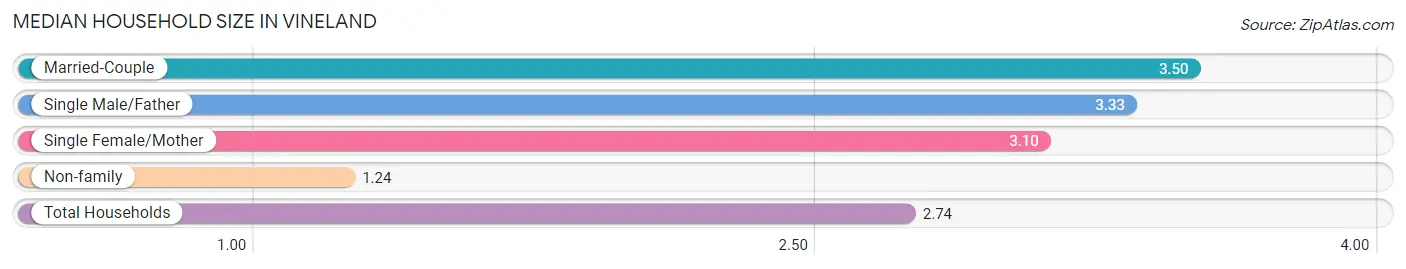
Median Household Size in Vineland
The median household size in Vineland is 2.74 persons per household, with married-couple households (9,785 | 45.4%) accounting for the largest median household size of 3.5 persons per household. non-family households (6,483 | 30.0%) represent the smallest median household size with 1.24 persons per household.
| Household Type | # Households | Household Size |
| Married-Couple | 9,785 (45.4%) | 3.50 |
| Single Male/Father | 1,996 (9.2%) | 3.33 |
| Single Female/Mother | 3,308 (15.3%) | 3.10 |
| Non-family | 6,483 (30.0%) | 1.24 |
| Total Households | 21,572 (100.0%) | 2.74 |
Household Size by Marriage Status in Vineland
Out of a total of 21,572 households in Vineland, 15,089 (70.0%) are family households, while 6,483 (30.0%) are nonfamily households. The most numerous type of family households are 2-person households, comprising 5,919, and the most common type of nonfamily households are 1-person households, comprising 4,983.
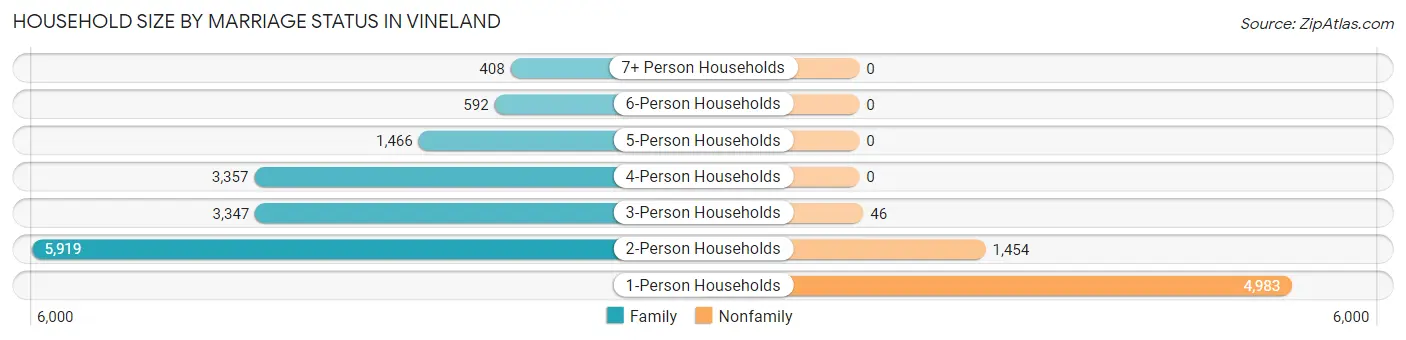
| Household Size | Family Households | Nonfamily Households |
| 1-Person Households | - | 4,983 (23.1%) |
| 2-Person Households | 5,919 (27.4%) | 1,454 (6.7%) |
| 3-Person Households | 3,347 (15.5%) | 46 (0.2%) |
| 4-Person Households | 3,357 (15.6%) | 0 (0.0%) |
| 5-Person Households | 1,466 (6.8%) | 0 (0.0%) |
| 6-Person Households | 592 (2.7%) | 0 (0.0%) |
| 7+ Person Households | 408 (1.9%) | 0 (0.0%) |
| Total | 15,089 (70.0%) | 6,483 (30.0%) |
Female Fertility in Vineland
Fertility by Age in Vineland
Average fertility rate in Vineland is 46.0 births per 1,000 women. Women in the age bracket of 20 to 34 years have the highest fertility rate with 80.0 births per 1,000 women. Women in the age bracket of 20 to 34 years acount for 70.4% of all women with births.
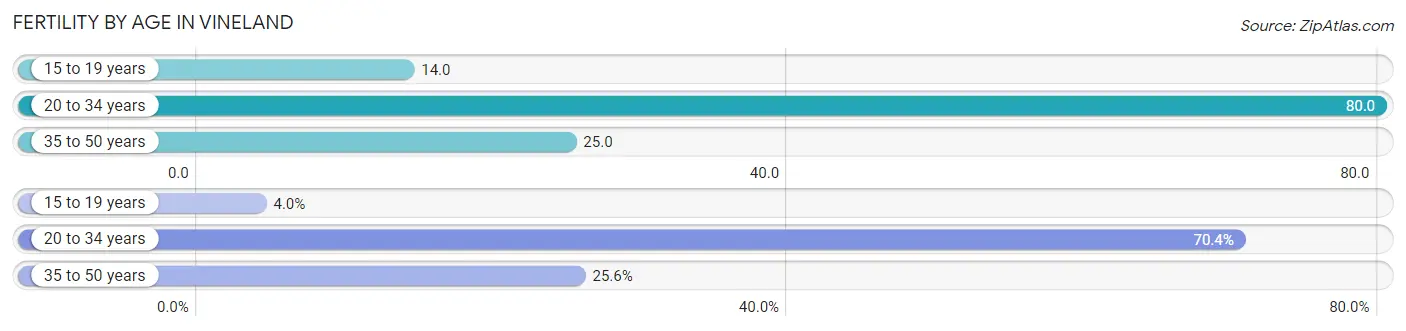
| Age Bracket | Women with Births | Births / 1,000 Women |
| 15 to 19 years | 24 (4.0%) | 14.0 |
| 20 to 34 years | 426 (70.4%) | 80.0 |
| 35 to 50 years | 155 (25.6%) | 25.0 |
| Total | 605 (100.0%) | 46.0 |
Fertility by Age by Marriage Status in Vineland
68.1% of women with births (605) in Vineland are married. The highest percentage of unmarried women with births falls into 20 to 34 years age bracket with 43.0% of them unmarried at the time of birth, while the lowest percentage of unmarried women with births belong to 15 to 19 years age bracket with 0.0% of them unmarried.
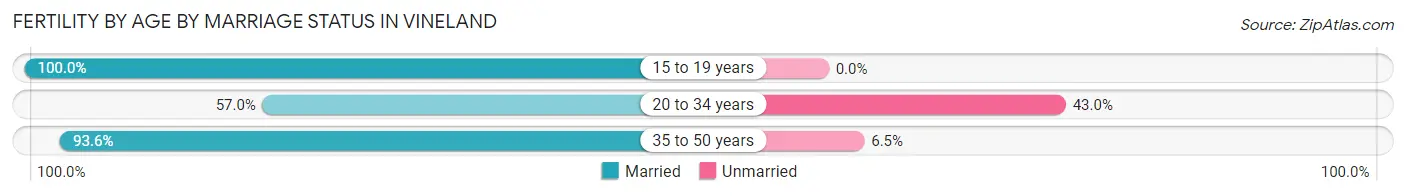
| Age Bracket | Married | Unmarried |
| 15 to 19 years | 24 (100.0%) | 0 (0.0%) |
| 20 to 34 years | 243 (57.0%) | 183 (43.0%) |
| 35 to 50 years | 145 (93.5%) | 10 (6.5%) |
| Total | 412 (68.1%) | 193 (31.9%) |
Fertility by Education in Vineland
Average fertility rate in Vineland is 46.0 births per 1,000 women. Women with the education attainment of graduate degree have the highest fertility rate of 71.0 births per 1,000 women, while women with the education attainment of college or associate's degree have the lowest fertility at 38.0 births per 1,000 women. Women with the education attainment of high school diploma represent 28.4% of all women with births.
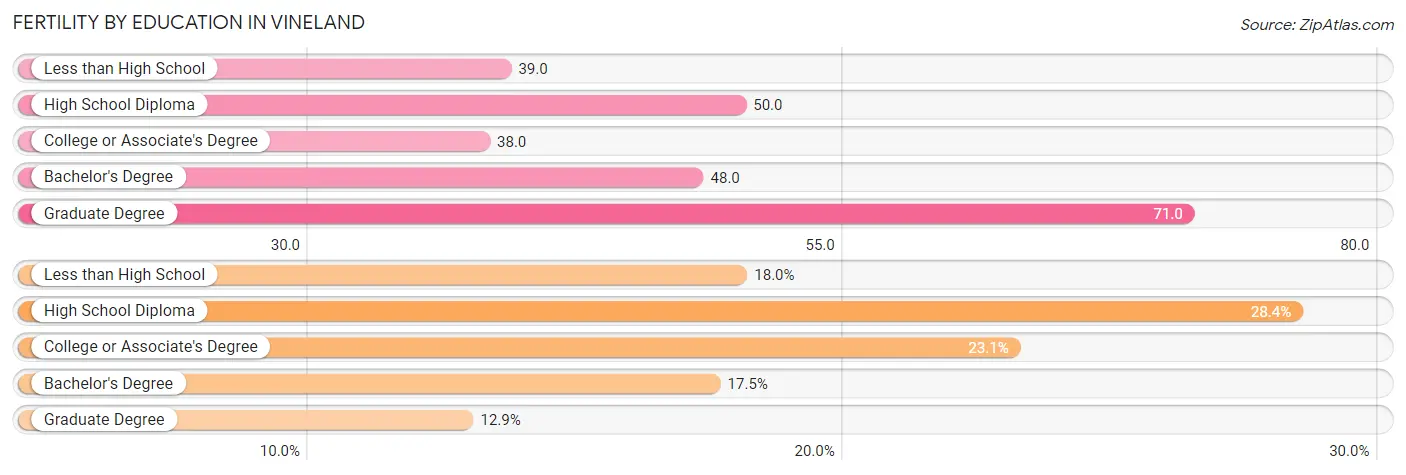
| Educational Attainment | Women with Births | Births / 1,000 Women |
| Less than High School | 109 (18.0%) | 39.0 |
| High School Diploma | 172 (28.4%) | 50.0 |
| College or Associate's Degree | 140 (23.1%) | 38.0 |
| Bachelor's Degree | 106 (17.5%) | 48.0 |
| Graduate Degree | 78 (12.9%) | 71.0 |
| Total | 605 (100.0%) | 46.0 |
Fertility by Education by Marriage Status in Vineland
31.9% of women with births in Vineland are unmarried. Women with the educational attainment of graduate degree are most likely to be married with 100.0% of them married at childbirth, while women with the educational attainment of less than high school are least likely to be married with 72.5% of them unmarried at childbirth.
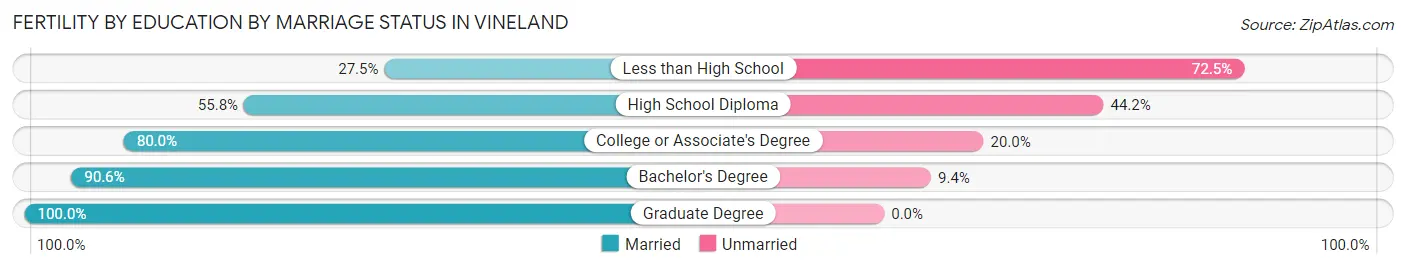
| Educational Attainment | Married | Unmarried |
| Less than High School | 30 (27.5%) | 79 (72.5%) |
| High School Diploma | 96 (55.8%) | 76 (44.2%) |
| College or Associate's Degree | 112 (80.0%) | 28 (20.0%) |
| Bachelor's Degree | 96 (90.6%) | 10 (9.4%) |
| Graduate Degree | 78 (100.0%) | 0 (0.0%) |
| Total | 412 (68.1%) | 193 (31.9%) |
Employment Characteristics in Vineland
Employment by Class of Employer in Vineland
Among the 25,167 employed individuals in Vineland, private company employees (16,584 | 65.9%), local government employees (2,880 | 11.4%), and not-for-profit organizations (2,095 | 8.3%) make up the most common classes of employment.
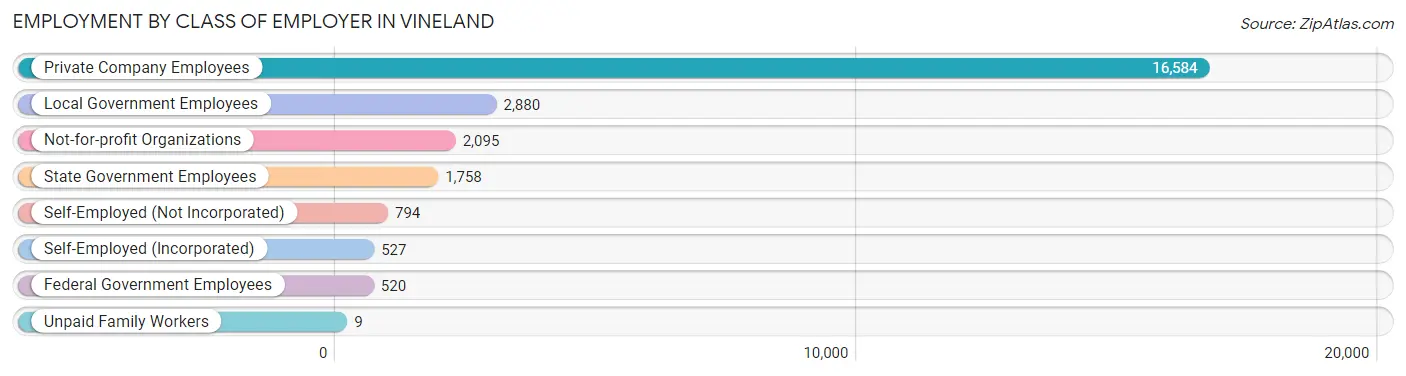
| Employer Class | # Employees | % Employees |
| Private Company Employees | 16,584 | 65.9% |
| Self-Employed (Incorporated) | 527 | 2.1% |
| Self-Employed (Not Incorporated) | 794 | 3.2% |
| Not-for-profit Organizations | 2,095 | 8.3% |
| Local Government Employees | 2,880 | 11.4% |
| State Government Employees | 1,758 | 7.0% |
| Federal Government Employees | 520 | 2.1% |
| Unpaid Family Workers | 9 | 0.0% |
| Total | 25,167 | 100.0% |
Employment Status by Age in Vineland
According to the labor force statistics for Vineland, out of the total population over 16 years of age (47,811), 60.2% or 28,782 individuals are in the labor force, with 8.3% or 2,389 of them unemployed. The age group with the highest labor force participation rate is 30 to 34 years, with 89.8% or 3,242 individuals in the labor force. Within the labor force, the 20 to 24 years age range has the highest percentage of unemployed individuals, with 22.7% or 787 of them being unemployed.
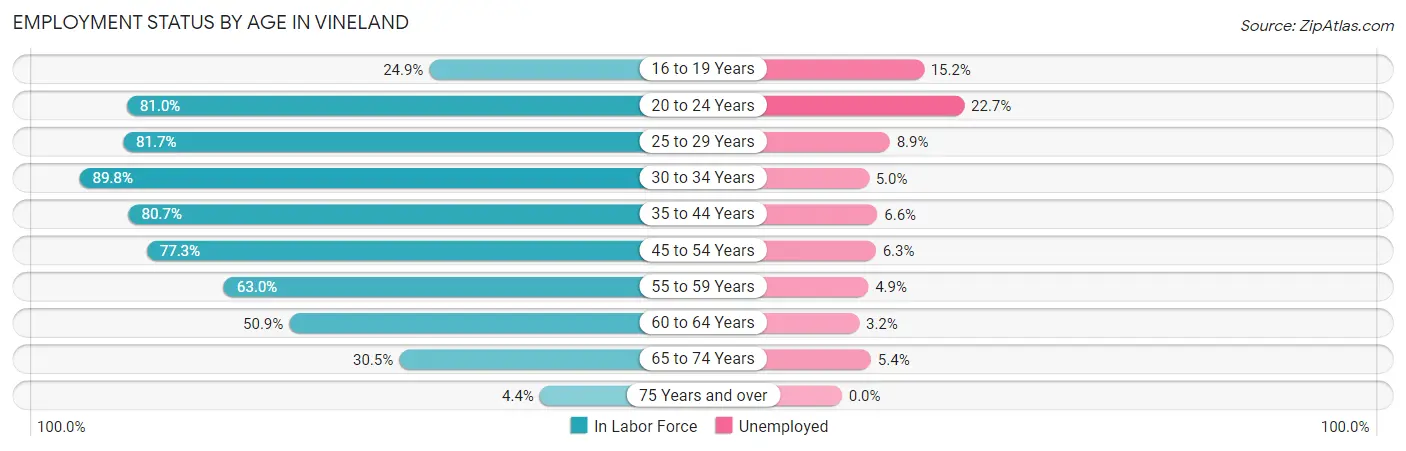
| Age Bracket | In Labor Force | Unemployed |
| 16 to 19 Years | 765 (24.9%) | 116 (15.2%) |
| 20 to 24 Years | 3,469 (81.0%) | 787 (22.7%) |
| 25 to 29 Years | 3,040 (81.7%) | 271 (8.9%) |
| 30 to 34 Years | 3,242 (89.8%) | 162 (5.0%) |
| 35 to 44 Years | 6,026 (80.7%) | 398 (6.6%) |
| 45 to 54 Years | 5,787 (77.3%) | 365 (6.3%) |
| 55 to 59 Years | 2,502 (63.0%) | 123 (4.9%) |
| 60 to 64 Years | 1,991 (50.9%) | 64 (3.2%) |
| 65 to 74 Years | 1,770 (30.5%) | 96 (5.4%) |
| 75 Years and over | 197 (4.4%) | 0 (0.0%) |
| Total | 28,782 (60.2%) | 2,389 (8.3%) |
Employment Status by Educational Attainment in Vineland
According to labor force statistics for Vineland, 74.9% of individuals (22,596) out of the total population between 25 and 64 years of age (30,168) are in the labor force, with 6.1% or 1,378 of them being unemployed. The group with the highest labor force participation rate are those with the educational attainment of bachelor's degree or higher, with 90.1% or 5,837 individuals in the labor force. Within the labor force, individuals with less than high school education have the highest percentage of unemployment, with 15.5% or 461 of them being unemployed.
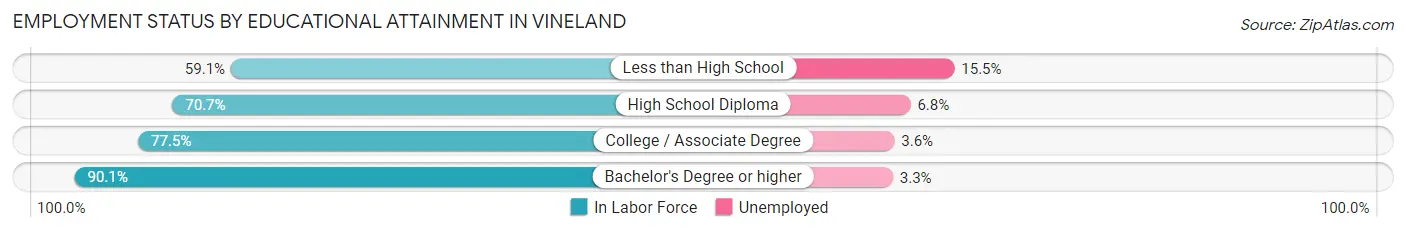
| Educational Attainment | In Labor Force | Unemployed |
| Less than High School | 2,976 (59.1%) | 781 (15.5%) |
| High School Diploma | 7,151 (70.7%) | 688 (6.8%) |
| College / Associate Degree | 6,618 (77.5%) | 307 (3.6%) |
| Bachelor's Degree or higher | 5,837 (90.1%) | 214 (3.3%) |
| Total | 22,596 (74.9%) | 1,840 (6.1%) |
Employment Occupations by Sex in Vineland
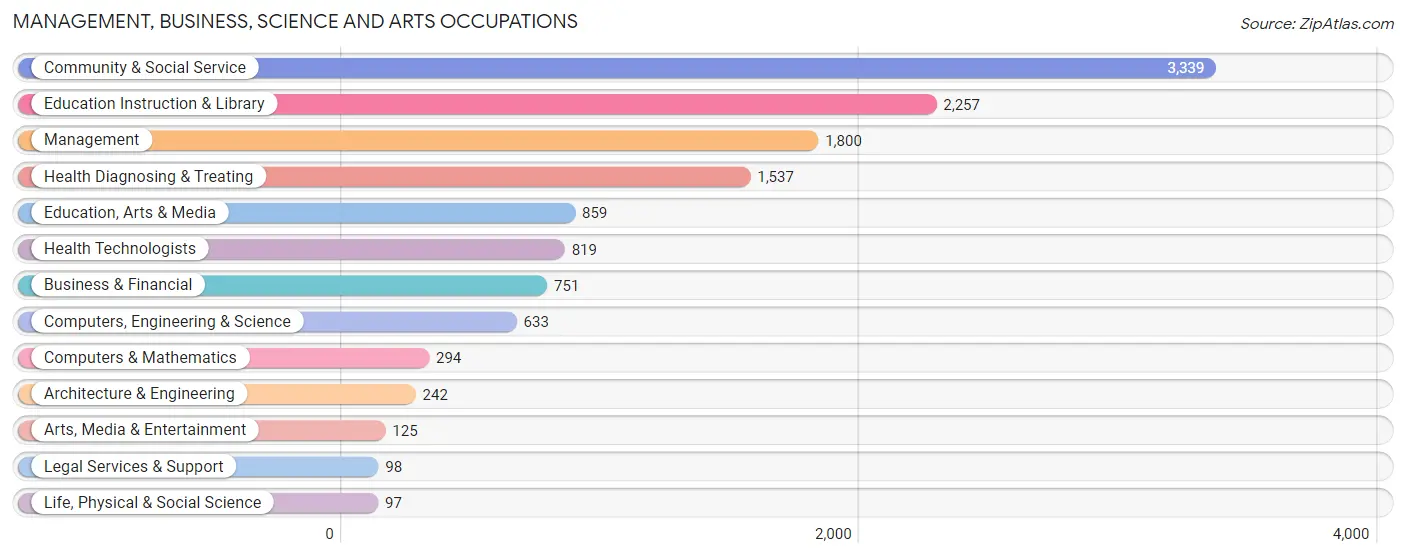
Management, Business, Science and Arts Occupations
The most common Management, Business, Science and Arts occupations in Vineland are Community & Social Service (3,339 | 12.7%), Education Instruction & Library (2,257 | 8.6%), Management (1,800 | 6.8%), Health Diagnosing & Treating (1,537 | 5.8%), and Education, Arts & Media (859 | 3.3%).
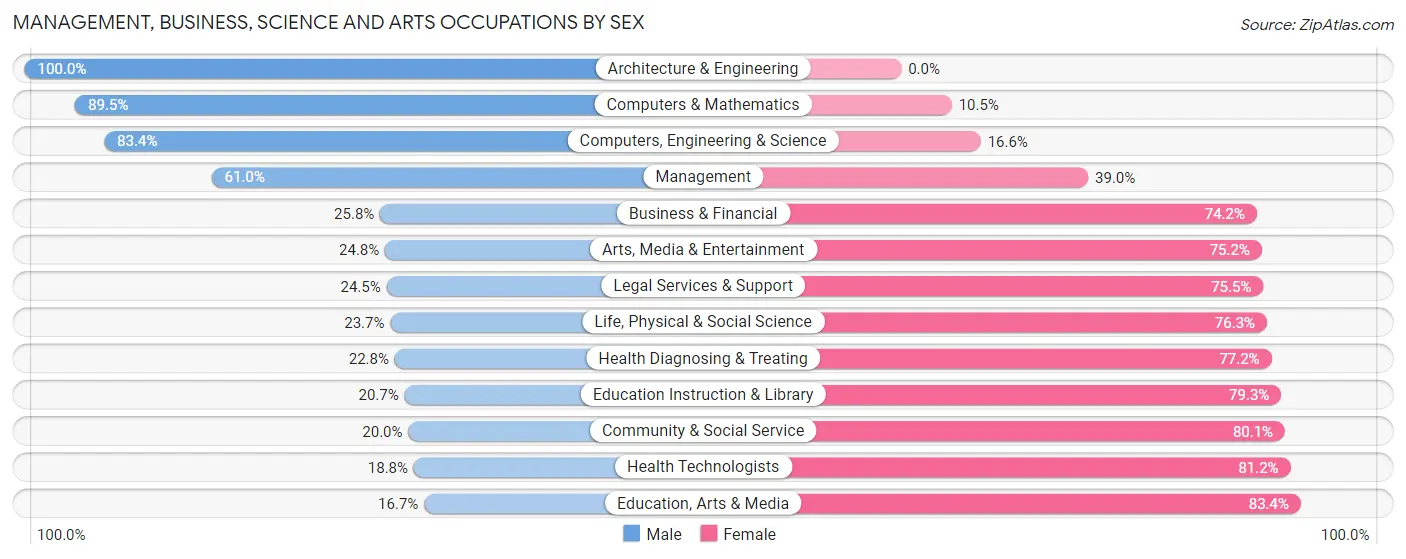
Management, Business, Science and Arts Occupations by Sex
Within the Management, Business, Science and Arts occupations in Vineland, the most male-oriented occupations are Architecture & Engineering (100.0%), Computers & Mathematics (89.5%), and Computers, Engineering & Science (83.4%), while the most female-oriented occupations are Education, Arts & Media (83.4%), Health Technologists (81.2%), and Community & Social Service (80.0%).
| Occupation | Male | Female |
| Management | 1,098 (61.0%) | 702 (39.0%) |
| Business & Financial | 194 (25.8%) | 557 (74.2%) |
| Computers, Engineering & Science | 528 (83.4%) | 105 (16.6%) |
| Computers & Mathematics | 263 (89.5%) | 31 (10.5%) |
| Architecture & Engineering | 242 (100.0%) | 0 (0.0%) |
| Life, Physical & Social Science | 23 (23.7%) | 74 (76.3%) |
| Community & Social Service | 666 (20.0%) | 2,673 (80.0%) |
| Education, Arts & Media | 143 (16.7%) | 716 (83.4%) |
| Legal Services & Support | 24 (24.5%) | 74 (75.5%) |
| Education Instruction & Library | 468 (20.7%) | 1,789 (79.3%) |
| Arts, Media & Entertainment | 31 (24.8%) | 94 (75.2%) |
| Health Diagnosing & Treating | 350 (22.8%) | 1,187 (77.2%) |
| Health Technologists | 154 (18.8%) | 665 (81.2%) |
| Total (Category) | 2,836 (35.2%) | 5,224 (64.8%) |
| Total (Overall) | 13,896 (52.7%) | 12,480 (47.3%) |
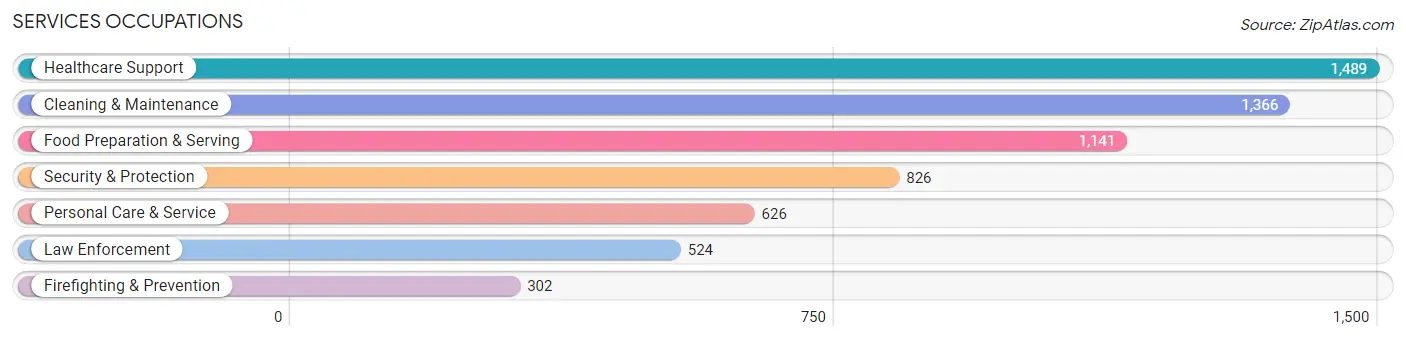
Services Occupations
The most common Services occupations in Vineland are Healthcare Support (1,489 | 5.7%), Cleaning & Maintenance (1,366 | 5.2%), Food Preparation & Serving (1,141 | 4.3%), Security & Protection (826 | 3.1%), and Personal Care & Service (626 | 2.4%).
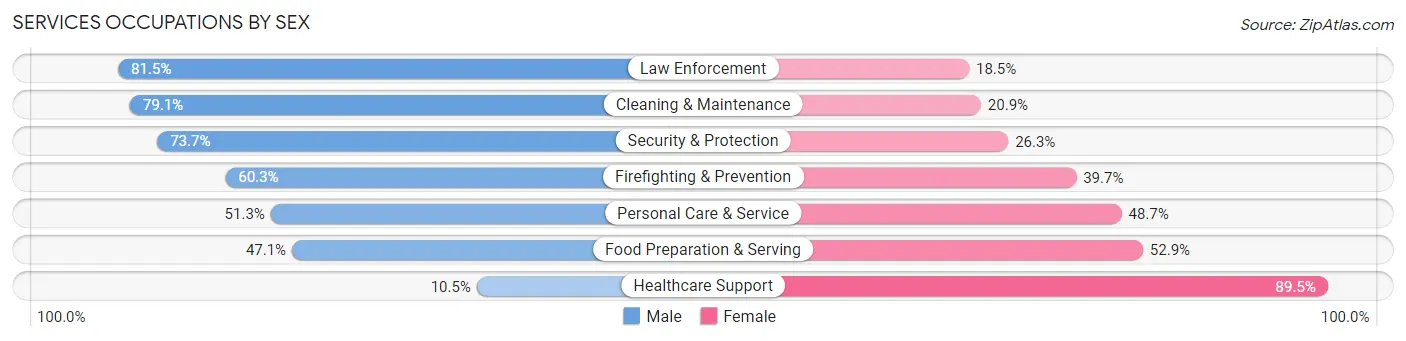
Services Occupations by Sex
Within the Services occupations in Vineland, the most male-oriented occupations are Law Enforcement (81.5%), Cleaning & Maintenance (79.1%), and Security & Protection (73.7%), while the most female-oriented occupations are Healthcare Support (89.5%), Food Preparation & Serving (52.9%), and Personal Care & Service (48.7%).
| Occupation | Male | Female |
| Healthcare Support | 156 (10.5%) | 1,333 (89.5%) |
| Security & Protection | 609 (73.7%) | 217 (26.3%) |
| Firefighting & Prevention | 182 (60.3%) | 120 (39.7%) |
| Law Enforcement | 427 (81.5%) | 97 (18.5%) |
| Food Preparation & Serving | 537 (47.1%) | 604 (52.9%) |
| Cleaning & Maintenance | 1,081 (79.1%) | 285 (20.9%) |
| Personal Care & Service | 321 (51.3%) | 305 (48.7%) |
| Total (Category) | 2,704 (49.6%) | 2,744 (50.4%) |
| Total (Overall) | 13,896 (52.7%) | 12,480 (47.3%) |
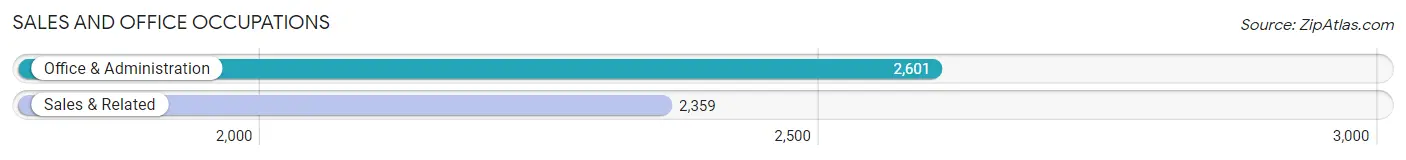
Sales and Office Occupations
The most common Sales and Office occupations in Vineland are Office & Administration (2,601 | 9.9%), and Sales & Related (2,359 | 8.9%).
Sales and Office Occupations by Sex
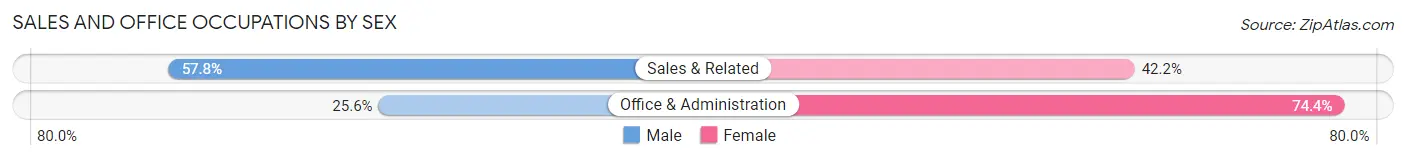
| Occupation | Male | Female |
| Sales & Related | 1,364 (57.8%) | 995 (42.2%) |
| Office & Administration | 665 (25.6%) | 1,936 (74.4%) |
| Total (Category) | 2,029 (40.9%) | 2,931 (59.1%) |
| Total (Overall) | 13,896 (52.7%) | 12,480 (47.3%) |
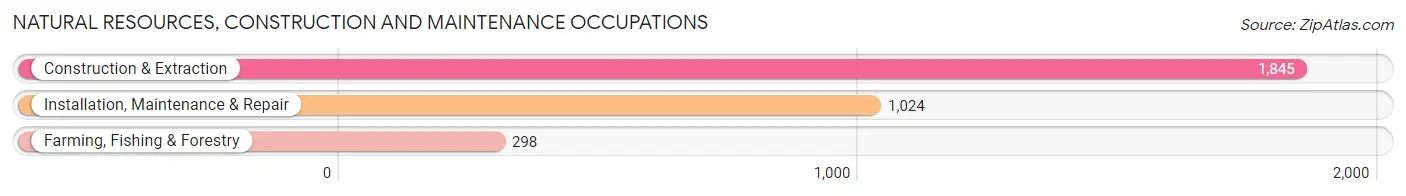
Natural Resources, Construction and Maintenance Occupations
The most common Natural Resources, Construction and Maintenance occupations in Vineland are Construction & Extraction (1,845 | 7.0%), Installation, Maintenance & Repair (1,024 | 3.9%), and Farming, Fishing & Forestry (298 | 1.1%).
Natural Resources, Construction and Maintenance Occupations by Sex
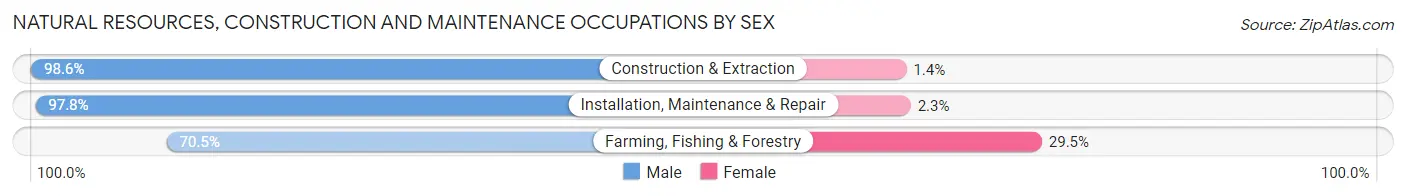
| Occupation | Male | Female |
| Farming, Fishing & Forestry | 210 (70.5%) | 88 (29.5%) |
| Construction & Extraction | 1,820 (98.6%) | 25 (1.4%) |
| Installation, Maintenance & Repair | 1,001 (97.8%) | 23 (2.2%) |
| Total (Category) | 3,031 (95.7%) | 136 (4.3%) |
| Total (Overall) | 13,896 (52.7%) | 12,480 (47.3%) |
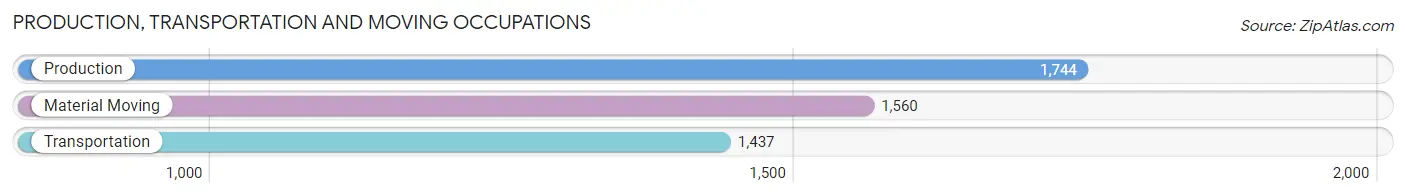
Production, Transportation and Moving Occupations
The most common Production, Transportation and Moving occupations in Vineland are Production (1,744 | 6.6%), Material Moving (1,560 | 5.9%), and Transportation (1,437 | 5.4%).
Production, Transportation and Moving Occupations by Sex
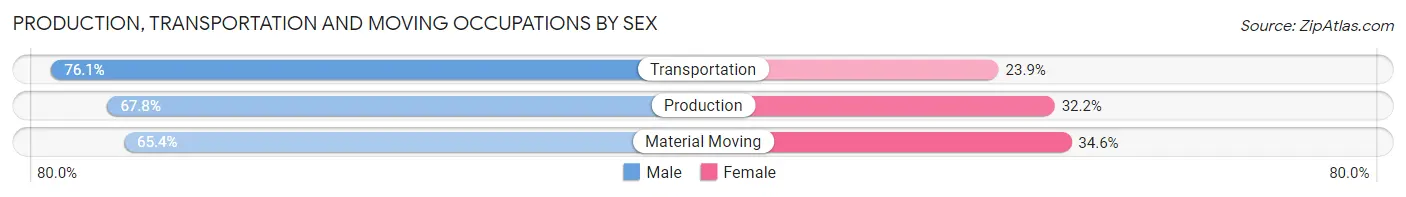
| Occupation | Male | Female |
| Production | 1,183 (67.8%) | 561 (32.2%) |
| Transportation | 1,093 (76.1%) | 344 (23.9%) |
| Material Moving | 1,020 (65.4%) | 540 (34.6%) |
| Total (Category) | 3,296 (69.5%) | 1,445 (30.5%) |
| Total (Overall) | 13,896 (52.7%) | 12,480 (47.3%) |
Employment Industries by Sex in Vineland
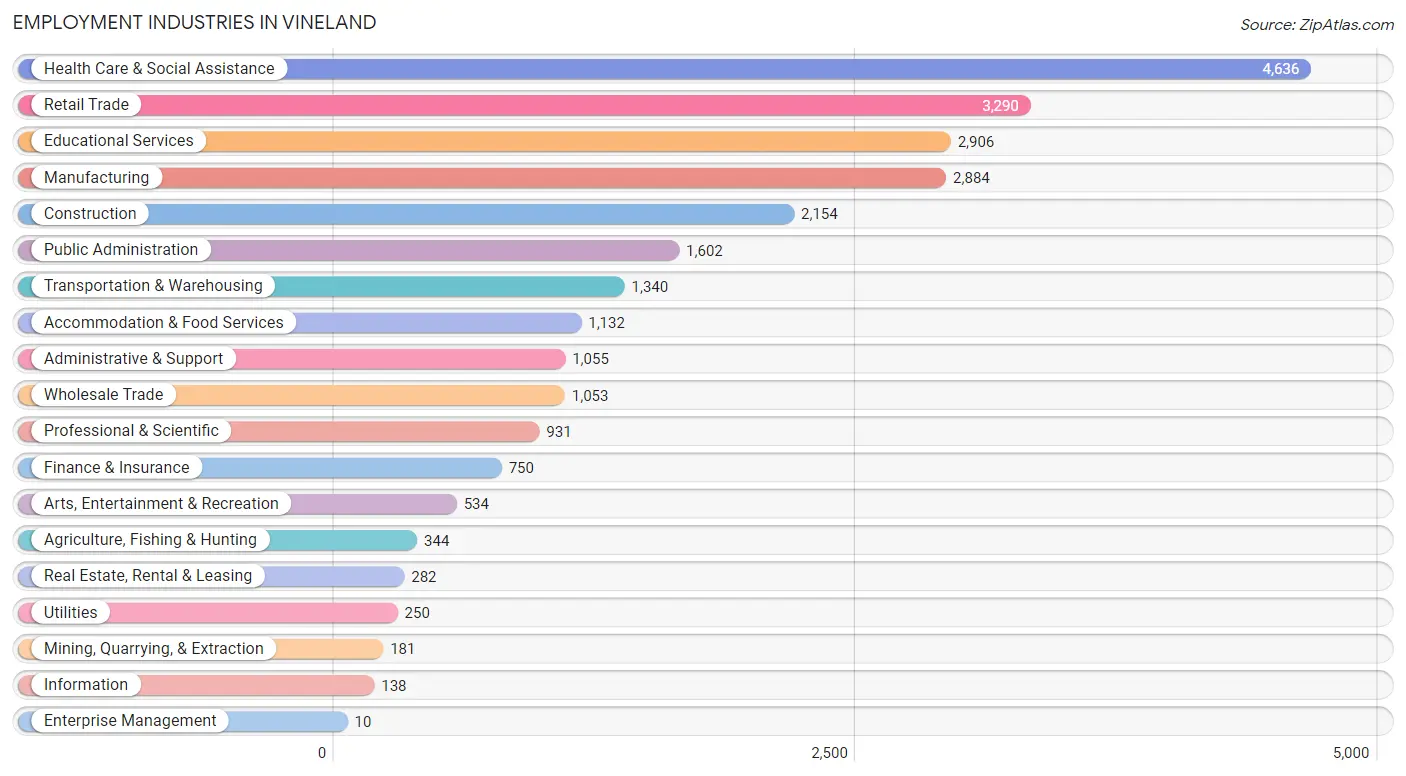
Employment Industries in Vineland
The major employment industries in Vineland include Health Care & Social Assistance (4,636 | 17.6%), Retail Trade (3,290 | 12.5%), Educational Services (2,906 | 11.0%), Manufacturing (2,884 | 10.9%), and Construction (2,154 | 8.2%).
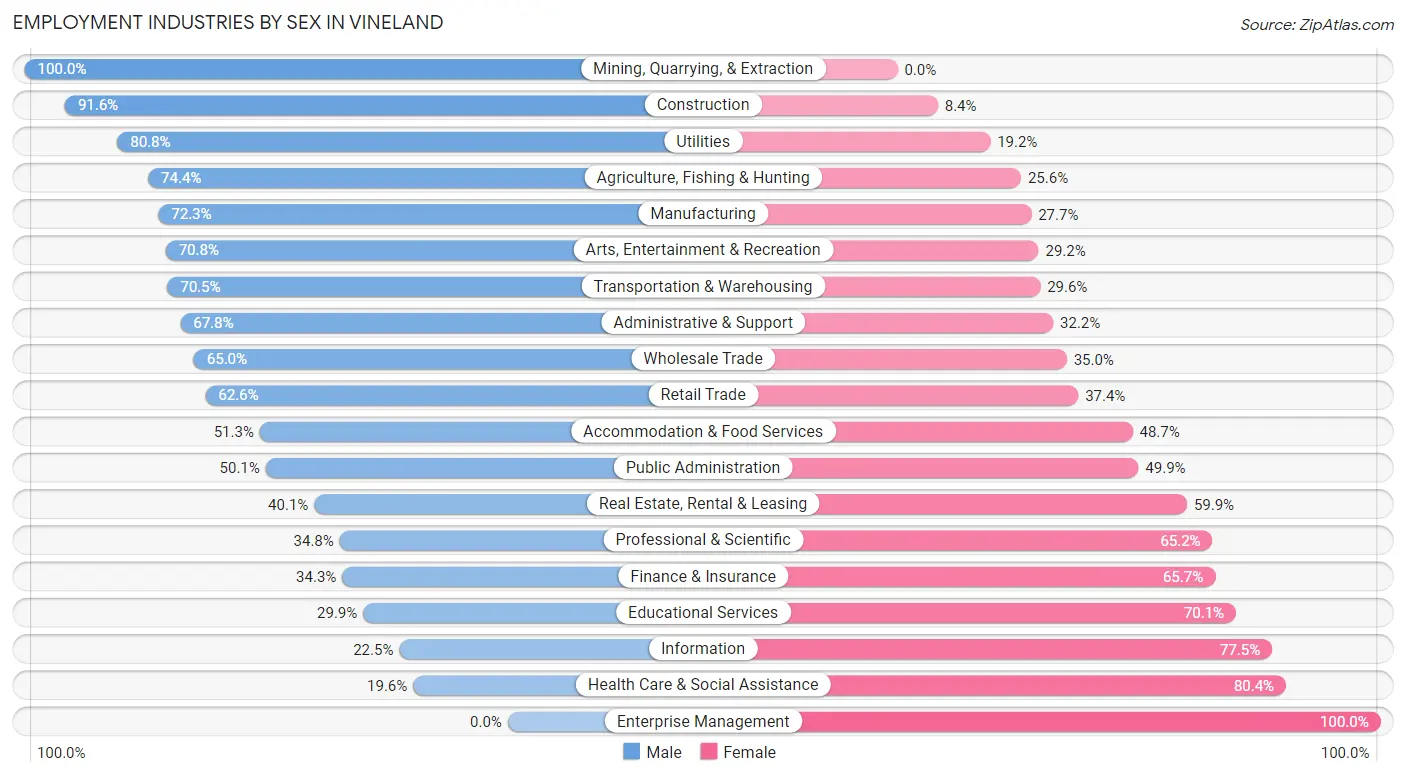
Employment Industries by Sex in Vineland
The Vineland industries that see more men than women are Mining, Quarrying, & Extraction (100.0%), Construction (91.6%), and Utilities (80.8%), whereas the industries that tend to have a higher number of women are Enterprise Management (100.0%), Health Care & Social Assistance (80.4%), and Information (77.5%).
| Industry | Male | Female |
| Agriculture, Fishing & Hunting | 256 (74.4%) | 88 (25.6%) |
| Mining, Quarrying, & Extraction | 181 (100.0%) | 0 (0.0%) |
| Construction | 1,974 (91.6%) | 180 (8.4%) |
| Manufacturing | 2,085 (72.3%) | 799 (27.7%) |
| Wholesale Trade | 684 (65.0%) | 369 (35.0%) |
| Retail Trade | 2,059 (62.6%) | 1,231 (37.4%) |
| Transportation & Warehousing | 944 (70.5%) | 396 (29.5%) |
| Utilities | 202 (80.8%) | 48 (19.2%) |
| Information | 31 (22.5%) | 107 (77.5%) |
| Finance & Insurance | 257 (34.3%) | 493 (65.7%) |
| Real Estate, Rental & Leasing | 113 (40.1%) | 169 (59.9%) |
| Professional & Scientific | 324 (34.8%) | 607 (65.2%) |
| Enterprise Management | 0 (0.0%) | 10 (100.0%) |
| Administrative & Support | 715 (67.8%) | 340 (32.2%) |
| Educational Services | 870 (29.9%) | 2,036 (70.1%) |
| Health Care & Social Assistance | 908 (19.6%) | 3,728 (80.4%) |
| Arts, Entertainment & Recreation | 378 (70.8%) | 156 (29.2%) |
| Accommodation & Food Services | 581 (51.3%) | 551 (48.7%) |
| Public Administration | 803 (50.1%) | 799 (49.9%) |
| Total | 13,896 (52.7%) | 12,480 (47.3%) |
Education in Vineland
School Enrollment in Vineland
The most common levels of schooling among the 15,230 students in Vineland are elementary school (3,381 | 22.2%), high school (3,266 | 21.4%), and middle school (3,137 | 20.6%).
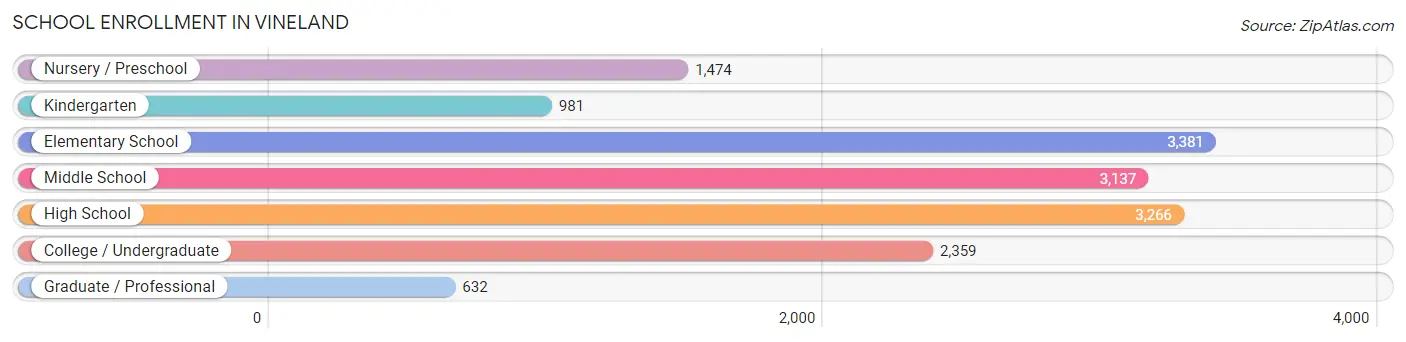
| School Level | # Students | % Students |
| Nursery / Preschool | 1,474 | 9.7% |
| Kindergarten | 981 | 6.4% |
| Elementary School | 3,381 | 22.2% |
| Middle School | 3,137 | 20.6% |
| High School | 3,266 | 21.4% |
| College / Undergraduate | 2,359 | 15.5% |
| Graduate / Professional | 632 | 4.2% |
| Total | 15,230 | 100.0% |
School Enrollment by Age by Funding Source in Vineland
Out of a total of 15,230 students who are enrolled in schools in Vineland, 2,269 (14.9%) attend a private institution, while the remaining 12,961 (85.1%) are enrolled in public schools. The age group of 20 to 24 year olds has the highest likelihood of being enrolled in private schools, with 402 (34.3% in the age bracket) enrolled. Conversely, the age group of 18 to 19 year olds has the lowest likelihood of being enrolled in a private school, with 779 (95.7% in the age bracket) attending a public institution.
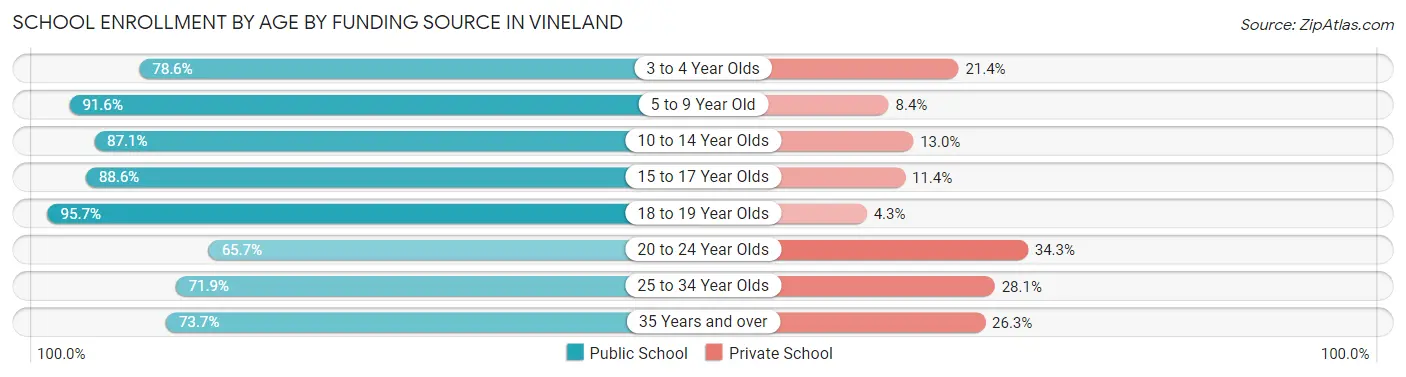
| Age Bracket | Public School | Private School |
| 3 to 4 Year Olds | 798 (78.6%) | 217 (21.4%) |
| 5 to 9 Year Old | 4,006 (91.6%) | 366 (8.4%) |
| 10 to 14 Year Olds | 3,396 (87.1%) | 505 (13.0%) |
| 15 to 17 Year Olds | 1,836 (88.6%) | 237 (11.4%) |
| 18 to 19 Year Olds | 779 (95.7%) | 35 (4.3%) |
| 20 to 24 Year Olds | 770 (65.7%) | 402 (34.3%) |
| 25 to 34 Year Olds | 641 (71.9%) | 251 (28.1%) |
| 35 Years and over | 730 (73.7%) | 261 (26.3%) |
| Total | 12,961 (85.1%) | 2,269 (14.9%) |
Educational Attainment by Field of Study in Vineland
Education (2,443 | 24.9%), business (1,248 | 12.7%), science & technology (1,142 | 11.7%), arts & humanities (838 | 8.6%), and psychology (681 | 7.0%) are the most common fields of study among 9,799 individuals in Vineland who have obtained a bachelor's degree or higher.
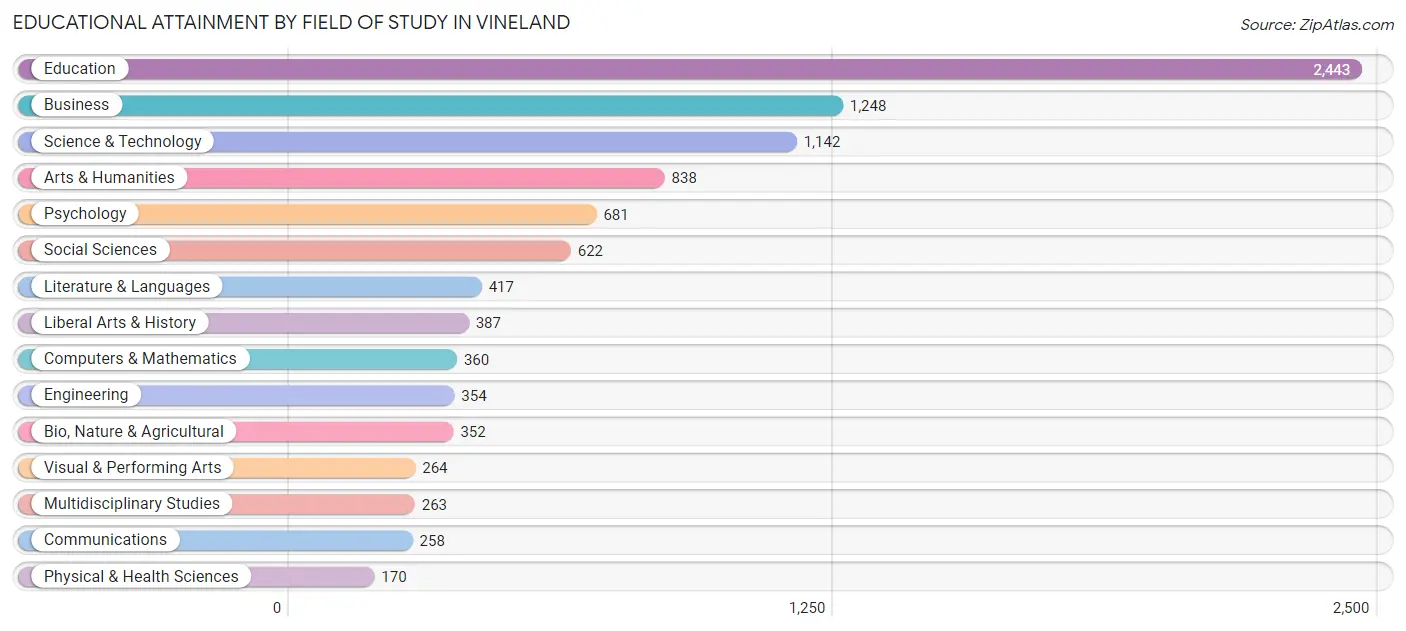
| Field of Study | # Graduates | % Graduates |
| Computers & Mathematics | 360 | 3.7% |
| Bio, Nature & Agricultural | 352 | 3.6% |
| Physical & Health Sciences | 170 | 1.7% |
| Psychology | 681 | 7.0% |
| Social Sciences | 622 | 6.4% |
| Engineering | 354 | 3.6% |
| Multidisciplinary Studies | 263 | 2.7% |
| Science & Technology | 1,142 | 11.7% |
| Business | 1,248 | 12.7% |
| Education | 2,443 | 24.9% |
| Literature & Languages | 417 | 4.3% |
| Liberal Arts & History | 387 | 4.0% |
| Visual & Performing Arts | 264 | 2.7% |
| Communications | 258 | 2.6% |
| Arts & Humanities | 838 | 8.6% |
| Total | 9,799 | 100.0% |
Transportation & Commute in Vineland
Vehicle Availability by Sex in Vineland
The most prevalent vehicle ownership categories in Vineland are males with 2 vehicles (5,908, accounting for 44.9%) and females with 2 vehicles (4,862, making up 49.7%).
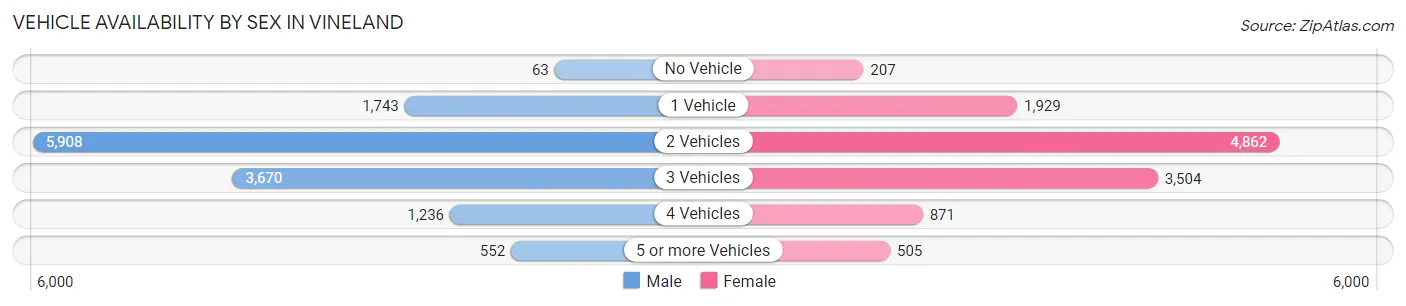
| Vehicles Available | Male | Female |
| No Vehicle | 63 (0.5%) | 207 (1.7%) |
| 1 Vehicle | 1,743 (13.2%) | 1,929 (16.2%) |
| 2 Vehicles | 5,908 (44.9%) | 4,862 (40.9%) |
| 3 Vehicles | 3,670 (27.9%) | 3,504 (29.5%) |
| 4 Vehicles | 1,236 (9.4%) | 871 (7.3%) |
| 5 or more Vehicles | 552 (4.2%) | 505 (4.3%) |
| Total | 13,172 (100.0%) | 11,878 (100.0%) |
Commute Time in Vineland
The most frequently occuring commute durations in Vineland are 5 to 9 minutes (4,470 commuters, 18.6%), 15 to 19 minutes (4,288 commuters, 17.9%), and 10 to 14 minutes (3,885 commuters, 16.2%).
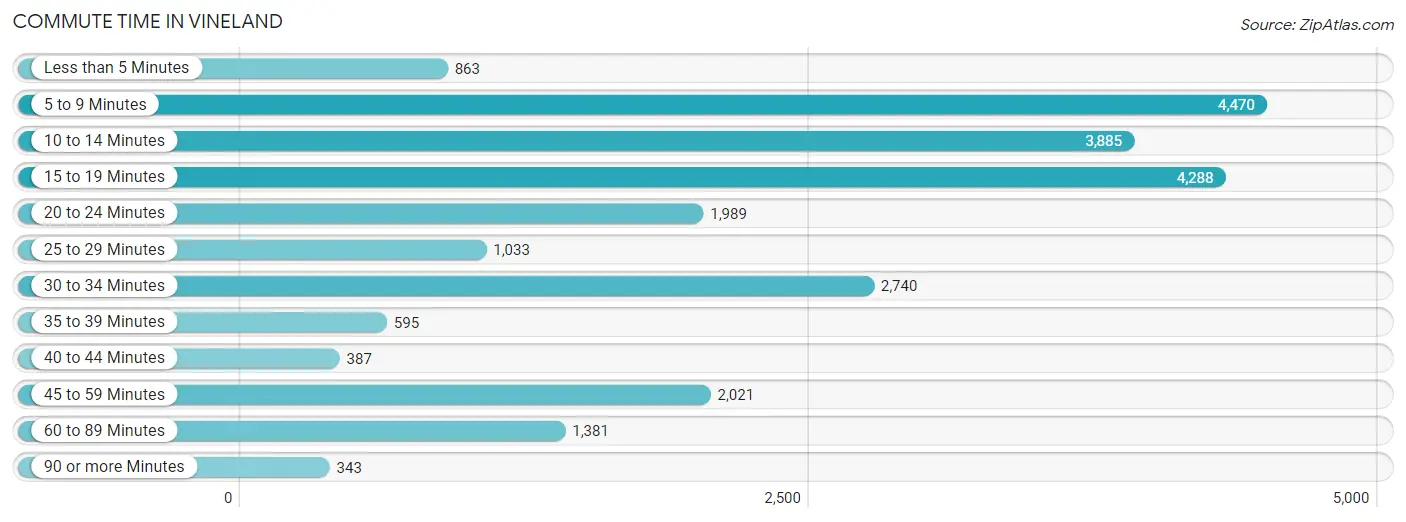
| Commute Time | # Commuters | % Commuters |
| Less than 5 Minutes | 863 | 3.6% |
| 5 to 9 Minutes | 4,470 | 18.6% |
| 10 to 14 Minutes | 3,885 | 16.2% |
| 15 to 19 Minutes | 4,288 | 17.9% |
| 20 to 24 Minutes | 1,989 | 8.3% |
| 25 to 29 Minutes | 1,033 | 4.3% |
| 30 to 34 Minutes | 2,740 | 11.4% |
| 35 to 39 Minutes | 595 | 2.5% |
| 40 to 44 Minutes | 387 | 1.6% |
| 45 to 59 Minutes | 2,021 | 8.4% |
| 60 to 89 Minutes | 1,381 | 5.8% |
| 90 or more Minutes | 343 | 1.4% |
Commute Time by Sex in Vineland
The most common commute times in Vineland are 15 to 19 minutes (2,350 commuters, 18.4%) for males and 5 to 9 minutes (2,252 commuters, 20.1%) for females.
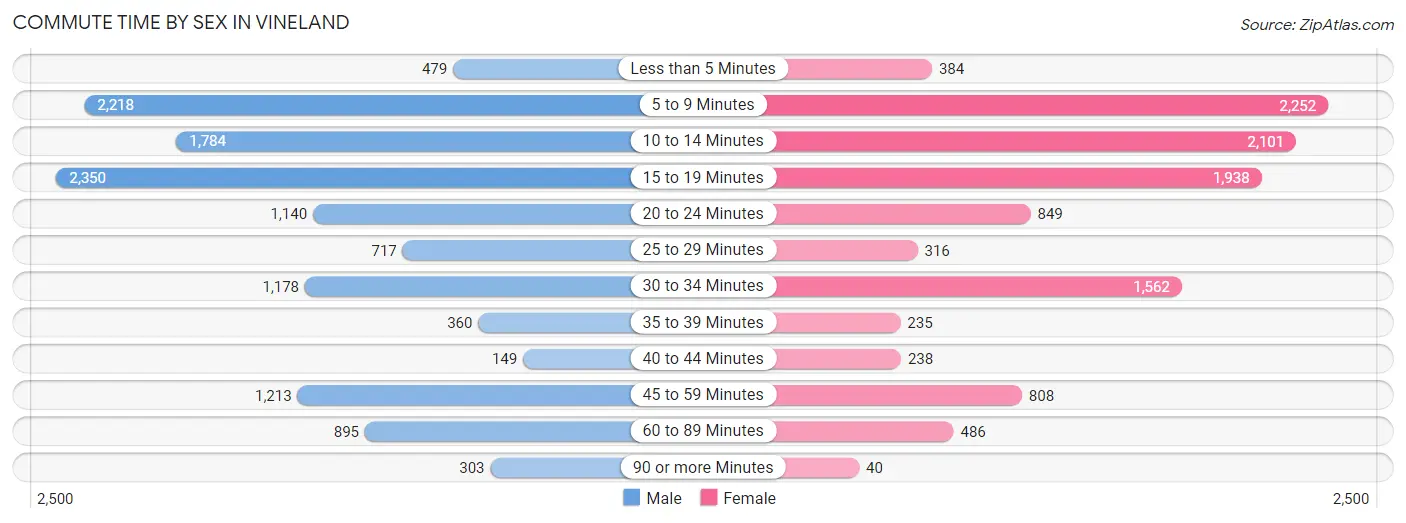
| Commute Time | Male | Female |
| Less than 5 Minutes | 479 (3.7%) | 384 (3.4%) |
| 5 to 9 Minutes | 2,218 (17.3%) | 2,252 (20.1%) |
| 10 to 14 Minutes | 1,784 (14.0%) | 2,101 (18.7%) |
| 15 to 19 Minutes | 2,350 (18.4%) | 1,938 (17.3%) |
| 20 to 24 Minutes | 1,140 (8.9%) | 849 (7.6%) |
| 25 to 29 Minutes | 717 (5.6%) | 316 (2.8%) |
| 30 to 34 Minutes | 1,178 (9.2%) | 1,562 (13.9%) |
| 35 to 39 Minutes | 360 (2.8%) | 235 (2.1%) |
| 40 to 44 Minutes | 149 (1.2%) | 238 (2.1%) |
| 45 to 59 Minutes | 1,213 (9.5%) | 808 (7.2%) |
| 60 to 89 Minutes | 895 (7.0%) | 486 (4.3%) |
| 90 or more Minutes | 303 (2.4%) | 40 (0.4%) |
Time of Departure to Work by Sex in Vineland
The most frequent times of departure to work in Vineland are 6:00 AM to 6:29 AM (1,751, 13.7%) for males and 7:30 AM to 7:59 AM (2,030, 18.1%) for females.
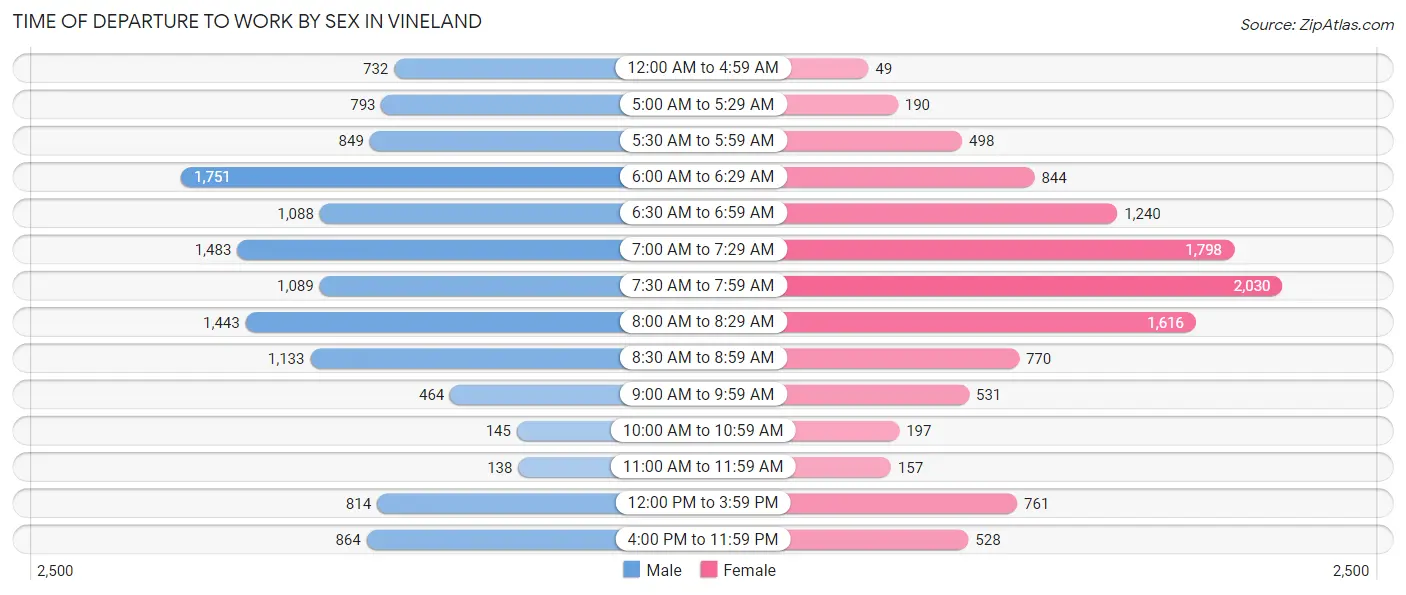
| Time of Departure | Male | Female |
| 12:00 AM to 4:59 AM | 732 (5.7%) | 49 (0.4%) |
| 5:00 AM to 5:29 AM | 793 (6.2%) | 190 (1.7%) |
| 5:30 AM to 5:59 AM | 849 (6.6%) | 498 (4.4%) |
| 6:00 AM to 6:29 AM | 1,751 (13.7%) | 844 (7.5%) |
| 6:30 AM to 6:59 AM | 1,088 (8.5%) | 1,240 (11.1%) |
| 7:00 AM to 7:29 AM | 1,483 (11.6%) | 1,798 (16.0%) |
| 7:30 AM to 7:59 AM | 1,089 (8.5%) | 2,030 (18.1%) |
| 8:00 AM to 8:29 AM | 1,443 (11.3%) | 1,616 (14.4%) |
| 8:30 AM to 8:59 AM | 1,133 (8.9%) | 770 (6.9%) |
| 9:00 AM to 9:59 AM | 464 (3.6%) | 531 (4.7%) |
| 10:00 AM to 10:59 AM | 145 (1.1%) | 197 (1.8%) |
| 11:00 AM to 11:59 AM | 138 (1.1%) | 157 (1.4%) |
| 12:00 PM to 3:59 PM | 814 (6.4%) | 761 (6.8%) |
| 4:00 PM to 11:59 PM | 864 (6.8%) | 528 (4.7%) |
| Total | 12,786 (100.0%) | 11,209 (100.0%) |
Housing Occupancy in Vineland
Occupancy by Ownership in Vineland
Of the total 21,572 dwellings in Vineland, owner-occupied units account for 14,845 (68.8%), while renter-occupied units make up 6,727 (31.2%).
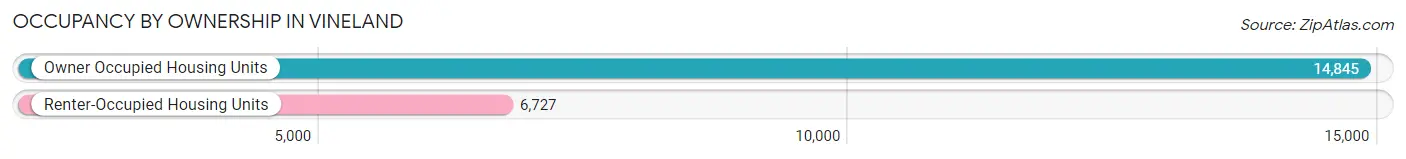
| Occupancy | # Housing Units | % Housing Units |
| Owner Occupied Housing Units | 14,845 | 68.8% |
| Renter-Occupied Housing Units | 6,727 | 31.2% |
| Total Occupied Housing Units | 21,572 | 100.0% |
Occupancy by Household Size in Vineland
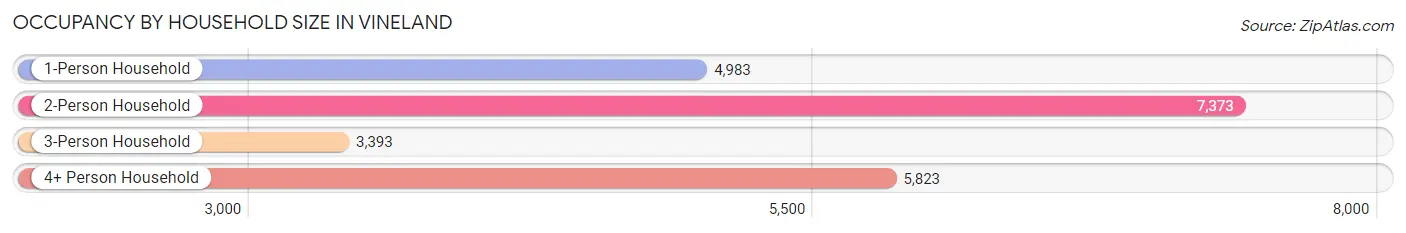
| Household Size | # Housing Units | % Housing Units |
| 1-Person Household | 4,983 | 23.1% |
| 2-Person Household | 7,373 | 34.2% |
| 3-Person Household | 3,393 | 15.7% |
| 4+ Person Household | 5,823 | 27.0% |
| Total Housing Units | 21,572 | 100.0% |
Occupancy by Ownership by Household Size in Vineland
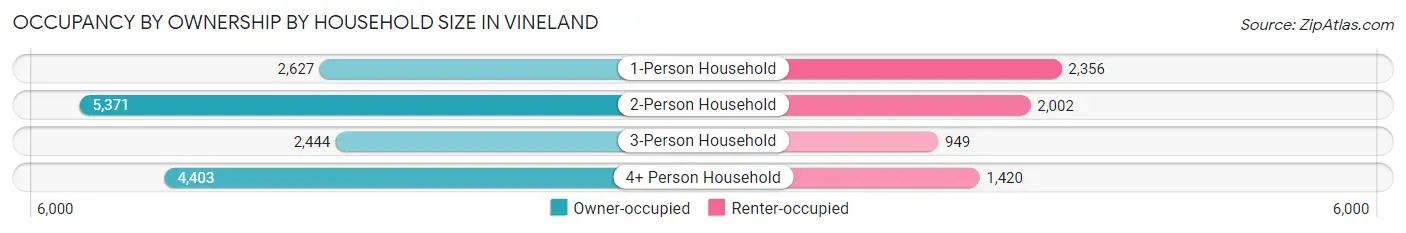
| Household Size | Owner-occupied | Renter-occupied |
| 1-Person Household | 2,627 (52.7%) | 2,356 (47.3%) |
| 2-Person Household | 5,371 (72.9%) | 2,002 (27.2%) |
| 3-Person Household | 2,444 (72.0%) | 949 (28.0%) |
| 4+ Person Household | 4,403 (75.6%) | 1,420 (24.4%) |
| Total Housing Units | 14,845 (68.8%) | 6,727 (31.2%) |
Occupancy by Educational Attainment in Vineland
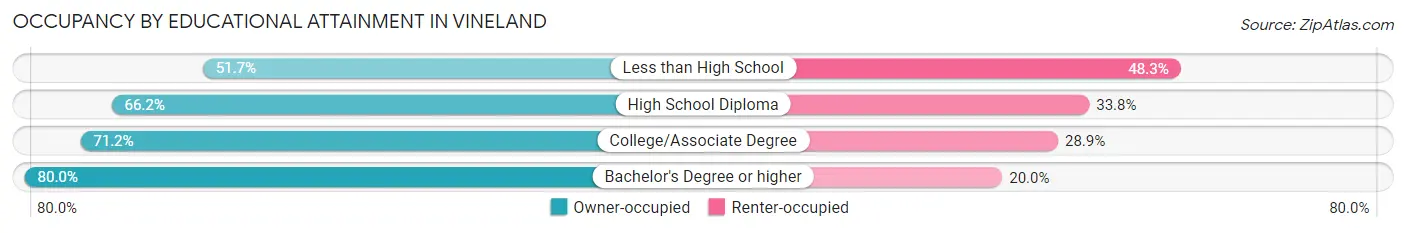
| Household Size | Owner-occupied | Renter-occupied |
| Less than High School | 1,839 (51.7%) | 1,715 (48.3%) |
| High School Diploma | 3,931 (66.2%) | 2,007 (33.8%) |
| College/Associate Degree | 4,733 (71.2%) | 1,919 (28.8%) |
| Bachelor's Degree or higher | 4,342 (80.0%) | 1,086 (20.0%) |
Occupancy by Age of Householder in Vineland
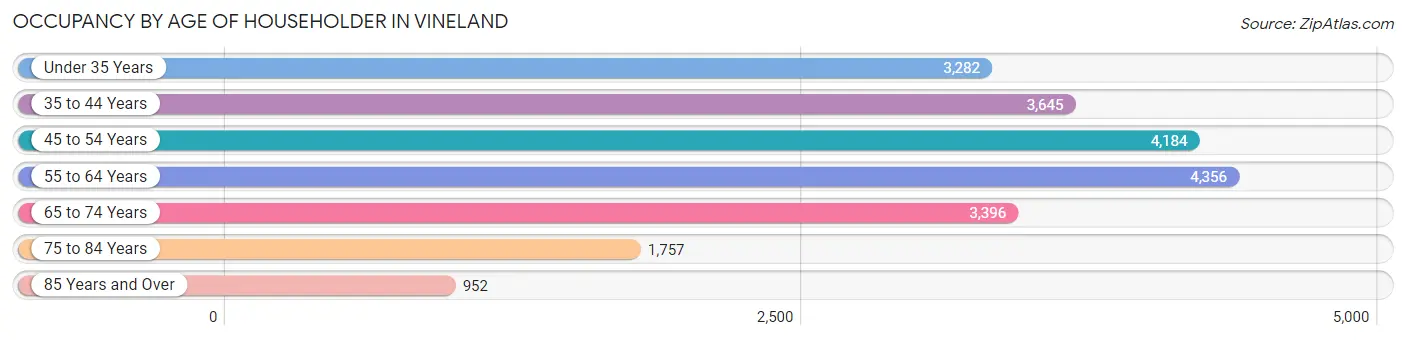
| Age Bracket | # Households | % Households |
| Under 35 Years | 3,282 | 15.2% |
| 35 to 44 Years | 3,645 | 16.9% |
| 45 to 54 Years | 4,184 | 19.4% |
| 55 to 64 Years | 4,356 | 20.2% |
| 65 to 74 Years | 3,396 | 15.7% |
| 75 to 84 Years | 1,757 | 8.1% |
| 85 Years and Over | 952 | 4.4% |
| Total | 21,572 | 100.0% |
Housing Finances in Vineland
Median Income by Occupancy in Vineland
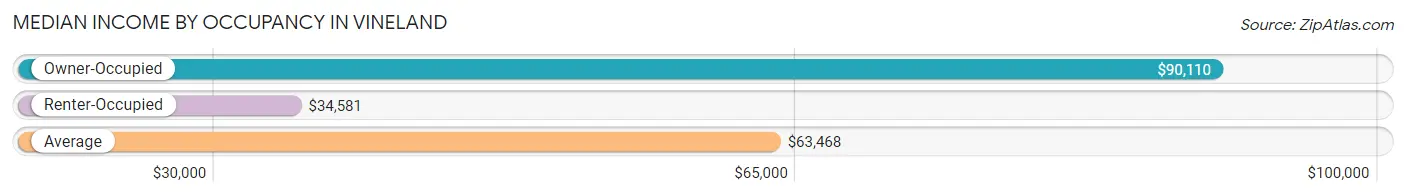
| Occupancy Type | # Households | Median Income |
| Owner-Occupied | 14,845 (68.8%) | $90,110 |
| Renter-Occupied | 6,727 (31.2%) | $34,581 |
| Average | 21,572 (100.0%) | $63,468 |
Occupancy by Householder Income Bracket in Vineland
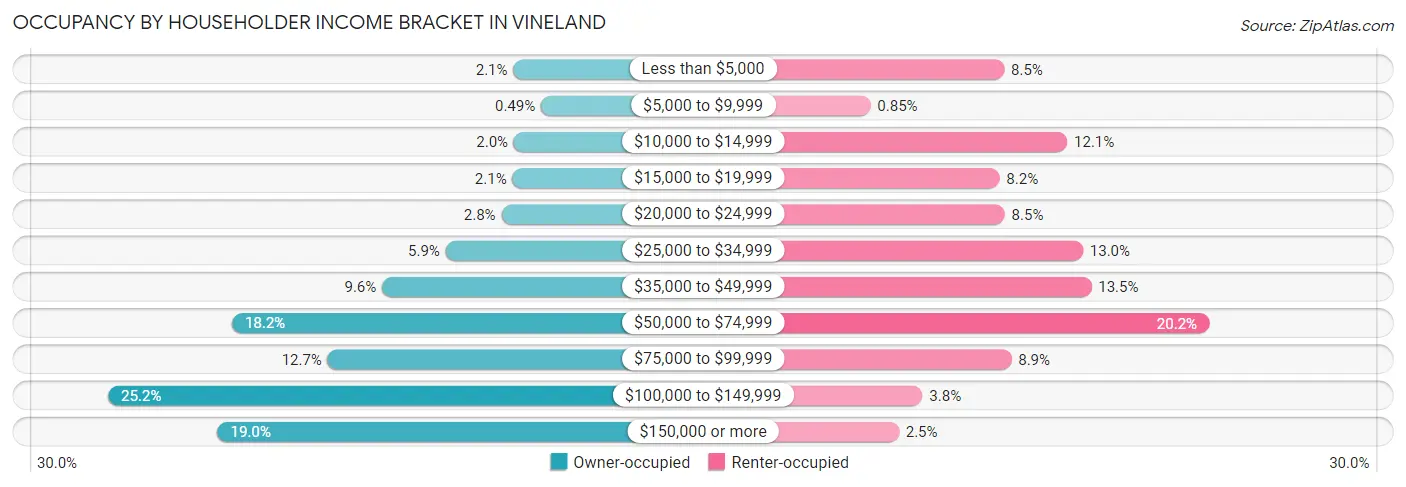
| Income Bracket | Owner-occupied | Renter-occupied |
| Less than $5,000 | 307 (2.1%) | 571 (8.5%) |
| $5,000 to $9,999 | 72 (0.5%) | 57 (0.9%) |
| $10,000 to $14,999 | 303 (2.0%) | 813 (12.1%) |
| $15,000 to $19,999 | 315 (2.1%) | 553 (8.2%) |
| $20,000 to $24,999 | 408 (2.8%) | 573 (8.5%) |
| $25,000 to $34,999 | 882 (5.9%) | 874 (13.0%) |
| $35,000 to $49,999 | 1,421 (9.6%) | 906 (13.5%) |
| $50,000 to $74,999 | 2,694 (18.1%) | 1,358 (20.2%) |
| $75,000 to $99,999 | 1,882 (12.7%) | 599 (8.9%) |
| $100,000 to $149,999 | 3,745 (25.2%) | 257 (3.8%) |
| $150,000 or more | 2,816 (19.0%) | 166 (2.5%) |
| Total | 14,845 (100.0%) | 6,727 (100.0%) |
Monthly Housing Cost Tiers in Vineland
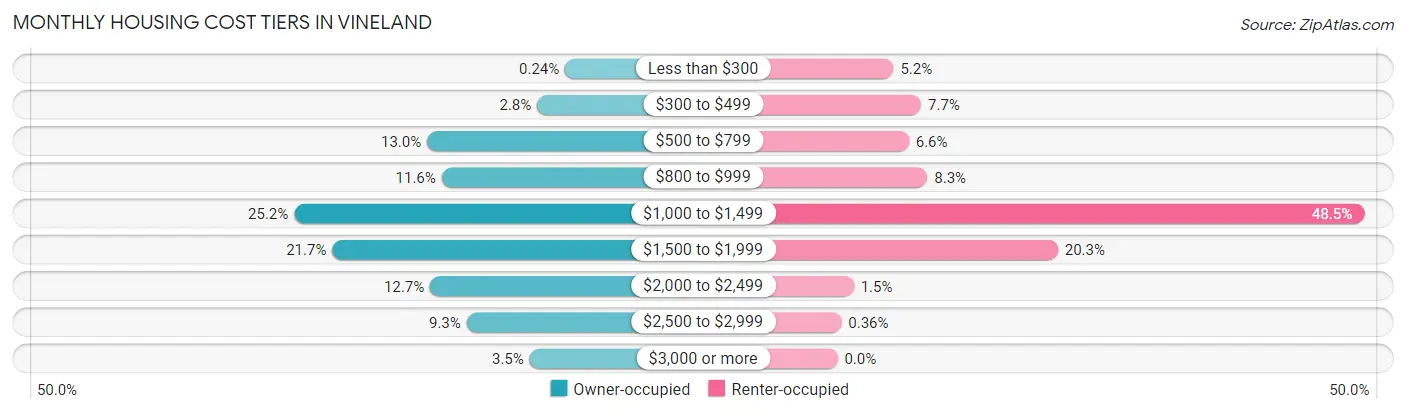
| Monthly Cost | Owner-occupied | Renter-occupied |
| Less than $300 | 36 (0.2%) | 347 (5.2%) |
| $300 to $499 | 419 (2.8%) | 518 (7.7%) |
| $500 to $799 | 1,922 (13.0%) | 442 (6.6%) |
| $800 to $999 | 1,724 (11.6%) | 557 (8.3%) |
| $1,000 to $1,499 | 3,739 (25.2%) | 3,261 (48.5%) |
| $1,500 to $1,999 | 3,219 (21.7%) | 1,365 (20.3%) |
| $2,000 to $2,499 | 1,883 (12.7%) | 101 (1.5%) |
| $2,500 to $2,999 | 1,382 (9.3%) | 24 (0.4%) |
| $3,000 or more | 521 (3.5%) | 0 (0.0%) |
| Total | 14,845 (100.0%) | 6,727 (100.0%) |
Physical Housing Characteristics in Vineland
Housing Structures in Vineland
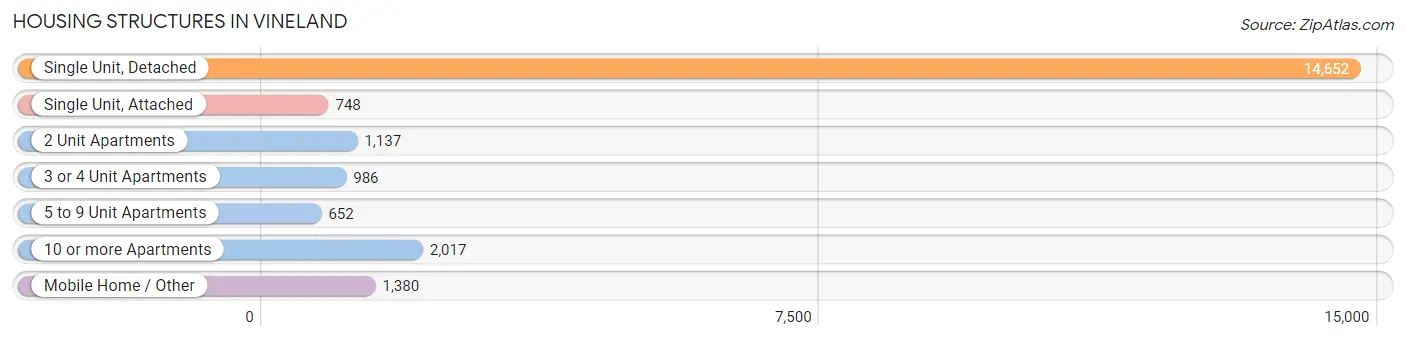
| Structure Type | # Housing Units | % Housing Units |
| Single Unit, Detached | 14,652 | 67.9% |
| Single Unit, Attached | 748 | 3.5% |
| 2 Unit Apartments | 1,137 | 5.3% |
| 3 or 4 Unit Apartments | 986 | 4.6% |
| 5 to 9 Unit Apartments | 652 | 3.0% |
| 10 or more Apartments | 2,017 | 9.3% |
| Mobile Home / Other | 1,380 | 6.4% |
| Total | 21,572 | 100.0% |
Housing Structures by Occupancy in Vineland
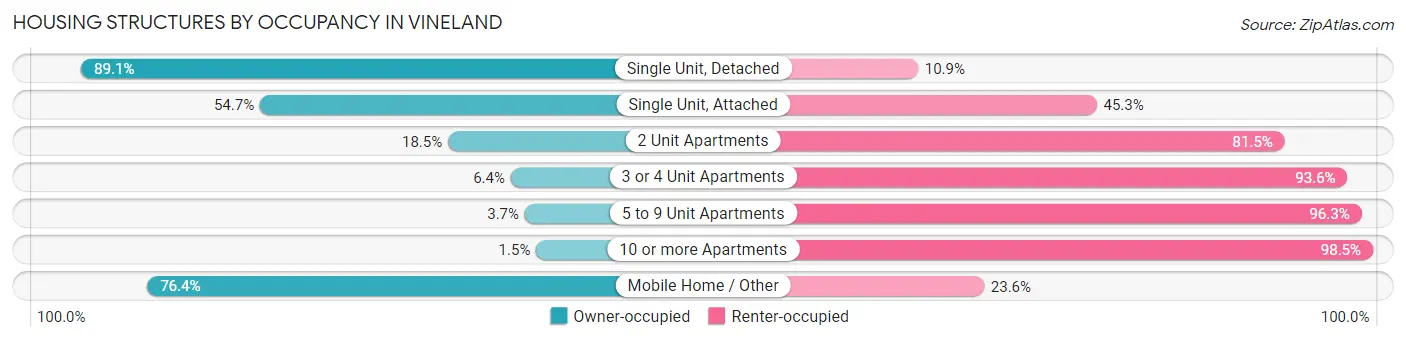
| Structure Type | Owner-occupied | Renter-occupied |
| Single Unit, Detached | 13,055 (89.1%) | 1,597 (10.9%) |
| Single Unit, Attached | 409 (54.7%) | 339 (45.3%) |
| 2 Unit Apartments | 210 (18.5%) | 927 (81.5%) |
| 3 or 4 Unit Apartments | 63 (6.4%) | 923 (93.6%) |
| 5 to 9 Unit Apartments | 24 (3.7%) | 628 (96.3%) |
| 10 or more Apartments | 30 (1.5%) | 1,987 (98.5%) |
| Mobile Home / Other | 1,054 (76.4%) | 326 (23.6%) |
| Total | 14,845 (68.8%) | 6,727 (31.2%) |
Housing Structures by Number of Rooms in Vineland
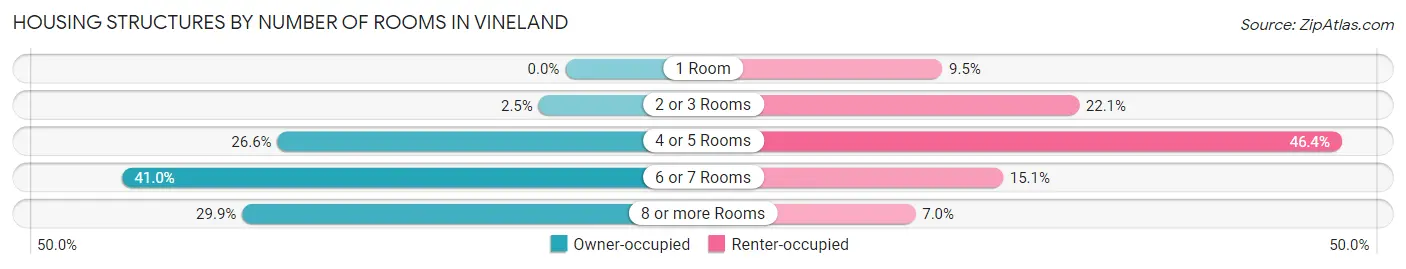
| Number of Rooms | Owner-occupied | Renter-occupied |
| 1 Room | 0 (0.0%) | 636 (9.5%) |
| 2 or 3 Rooms | 365 (2.5%) | 1,487 (22.1%) |
| 4 or 5 Rooms | 3,951 (26.6%) | 3,122 (46.4%) |
| 6 or 7 Rooms | 6,093 (41.0%) | 1,013 (15.1%) |
| 8 or more Rooms | 4,436 (29.9%) | 469 (7.0%) |
| Total | 14,845 (100.0%) | 6,727 (100.0%) |
Housing Structure by Heating Type in Vineland
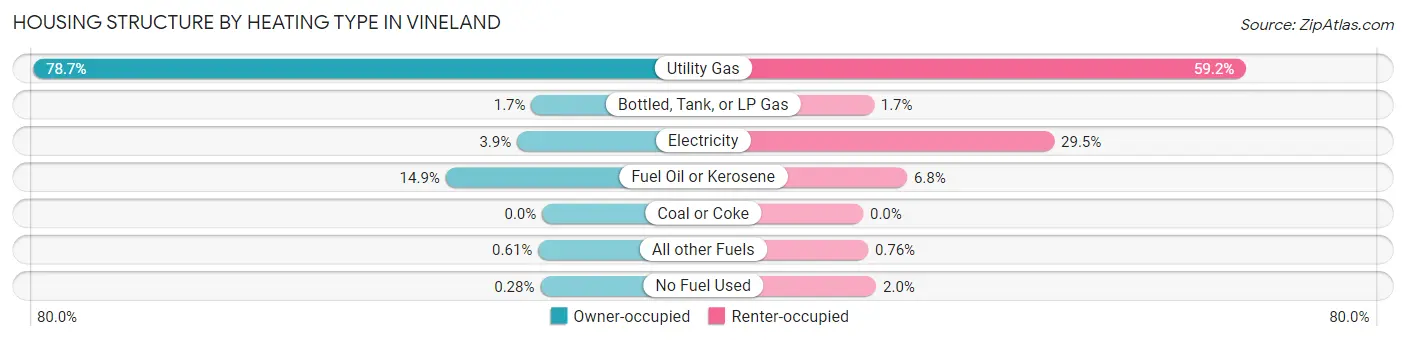
| Heating Type | Owner-occupied | Renter-occupied |
| Utility Gas | 11,680 (78.7%) | 3,984 (59.2%) |
| Bottled, Tank, or LP Gas | 246 (1.7%) | 112 (1.7%) |
| Electricity | 574 (3.9%) | 1,987 (29.5%) |
| Fuel Oil or Kerosene | 2,213 (14.9%) | 457 (6.8%) |
| Coal or Coke | 0 (0.0%) | 0 (0.0%) |
| All other Fuels | 90 (0.6%) | 51 (0.8%) |
| No Fuel Used | 42 (0.3%) | 136 (2.0%) |
| Total | 14,845 (100.0%) | 6,727 (100.0%) |
Household Vehicle Usage in Vineland
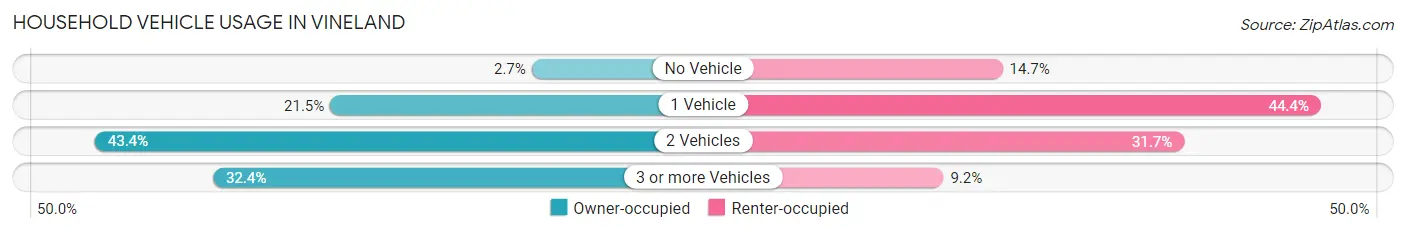
| Vehicles per Household | Owner-occupied | Renter-occupied |
| No Vehicle | 396 (2.7%) | 990 (14.7%) |
| 1 Vehicle | 3,189 (21.5%) | 2,988 (44.4%) |
| 2 Vehicles | 6,448 (43.4%) | 2,130 (31.7%) |
| 3 or more Vehicles | 4,812 (32.4%) | 619 (9.2%) |
| Total | 14,845 (100.0%) | 6,727 (100.0%) |
Real Estate & Mortgages in Vineland
Real Estate and Mortgage Overview in Vineland
| Characteristic | Without Mortgage | With Mortgage |
| Housing Units | 5,345 | 9,500 |
| Median Property Value | $197,300 | $209,300 |
| Median Household Income | $70,016 | $1,889 |
| Monthly Housing Costs | $869 | $513 |
| Real Estate Taxes | $4,873 | $376 |
Property Value by Mortgage Status in Vineland
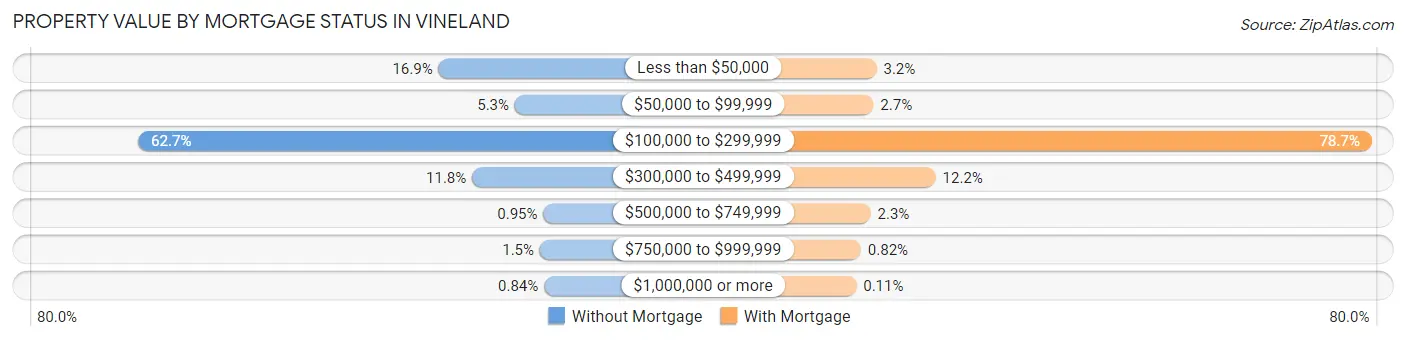
| Property Value | Without Mortgage | With Mortgage |
| Less than $50,000 | 905 (16.9%) | 304 (3.2%) |
| $50,000 to $99,999 | 283 (5.3%) | 258 (2.7%) |
| $100,000 to $299,999 | 3,351 (62.7%) | 7,472 (78.6%) |
| $300,000 to $499,999 | 631 (11.8%) | 1,160 (12.2%) |
| $500,000 to $749,999 | 51 (0.9%) | 218 (2.3%) |
| $750,000 to $999,999 | 79 (1.5%) | 78 (0.8%) |
| $1,000,000 or more | 45 (0.8%) | 10 (0.1%) |
| Total | 5,345 (100.0%) | 9,500 (100.0%) |
Household Income by Mortgage Status in Vineland
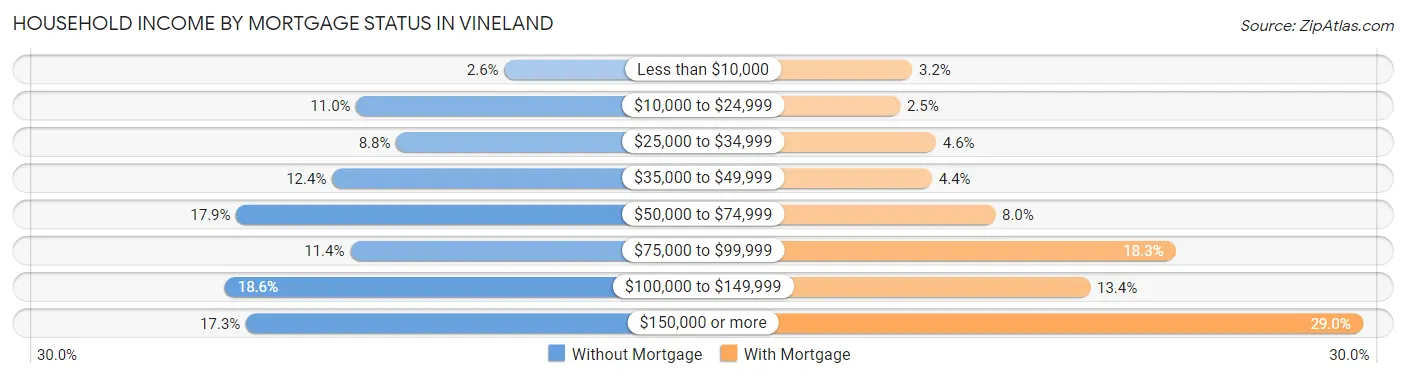
| Household Income | Without Mortgage | With Mortgage |
| Less than $10,000 | 138 (2.6%) | 307 (3.2%) |
| $10,000 to $24,999 | 590 (11.0%) | 241 (2.5%) |
| $25,000 to $34,999 | 468 (8.8%) | 436 (4.6%) |
| $35,000 to $49,999 | 664 (12.4%) | 414 (4.4%) |
| $50,000 to $74,999 | 957 (17.9%) | 757 (8.0%) |
| $75,000 to $99,999 | 609 (11.4%) | 1,737 (18.3%) |
| $100,000 to $149,999 | 992 (18.6%) | 1,273 (13.4%) |
| $150,000 or more | 927 (17.3%) | 2,753 (29.0%) |
| Total | 5,345 (100.0%) | 9,500 (100.0%) |
Property Value to Household Income Ratio in Vineland
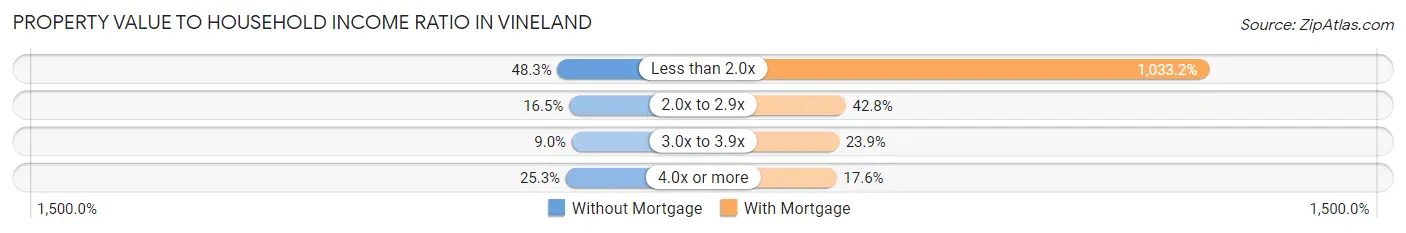
| Value-to-Income Ratio | Without Mortgage | With Mortgage |
| Less than 2.0x | 2,579 (48.2%) | 98,151 (1,033.2%) |
| 2.0x to 2.9x | 881 (16.5%) | 4,066 (42.8%) |
| 3.0x to 3.9x | 482 (9.0%) | 2,266 (23.8%) |
| 4.0x or more | 1,350 (25.3%) | 1,676 (17.6%) |
| Total | 5,345 (100.0%) | 9,500 (100.0%) |
Real Estate Taxes by Mortgage Status in Vineland
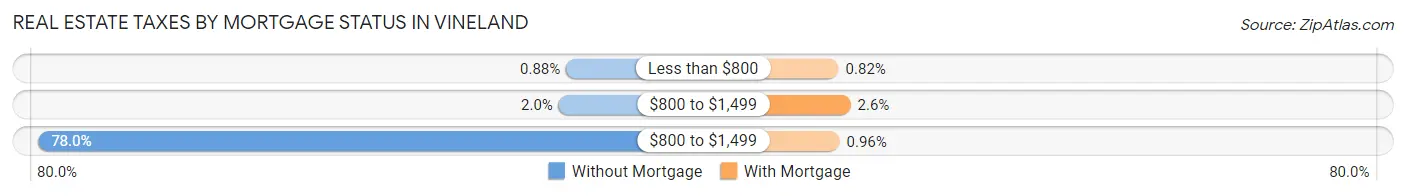
| Property Taxes | Without Mortgage | With Mortgage |
| Less than $800 | 47 (0.9%) | 78 (0.8%) |
| $800 to $1,499 | 105 (2.0%) | 244 (2.6%) |
| $800 to $1,499 | 4,169 (78.0%) | 91 (1.0%) |
| Total | 5,345 (100.0%) | 9,500 (100.0%) |
Health & Disability in Vineland
Health Insurance Coverage by Age in Vineland
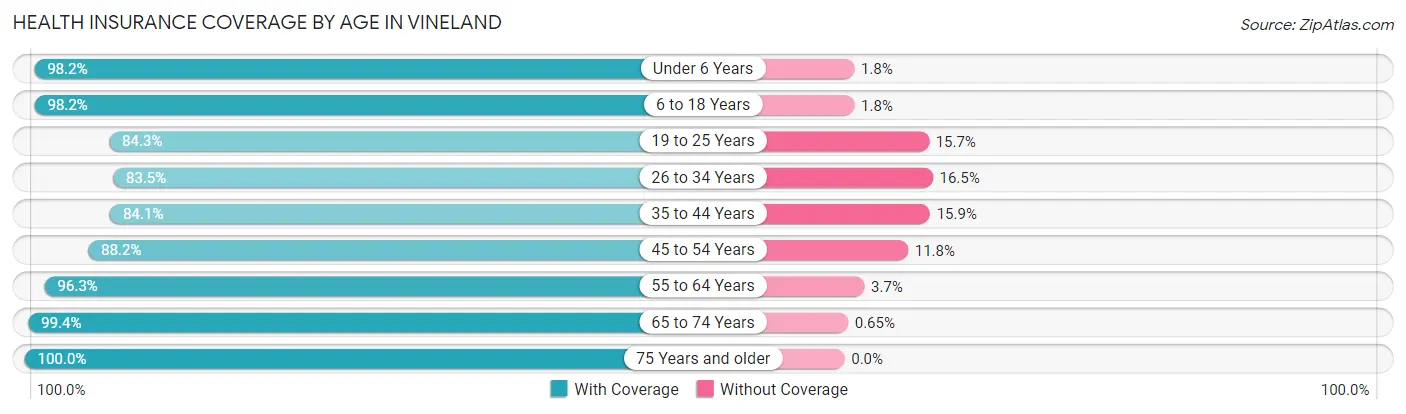
| Age Bracket | With Coverage | Without Coverage |
| Under 6 Years | 4,642 (98.2%) | 85 (1.8%) |
| 6 to 18 Years | 10,155 (98.2%) | 190 (1.8%) |
| 19 to 25 Years | 4,823 (84.3%) | 901 (15.7%) |
| 26 to 34 Years | 5,599 (83.5%) | 1,103 (16.5%) |
| 35 to 44 Years | 6,243 (84.1%) | 1,183 (15.9%) |
| 45 to 54 Years | 6,585 (88.2%) | 884 (11.8%) |
| 55 to 64 Years | 7,558 (96.3%) | 290 (3.7%) |
| 65 to 74 Years | 5,636 (99.4%) | 37 (0.6%) |
| 75 Years and older | 4,030 (100.0%) | 0 (0.0%) |
| Total | 55,271 (92.2%) | 4,673 (7.8%) |
Health Insurance Coverage by Citizenship Status in Vineland
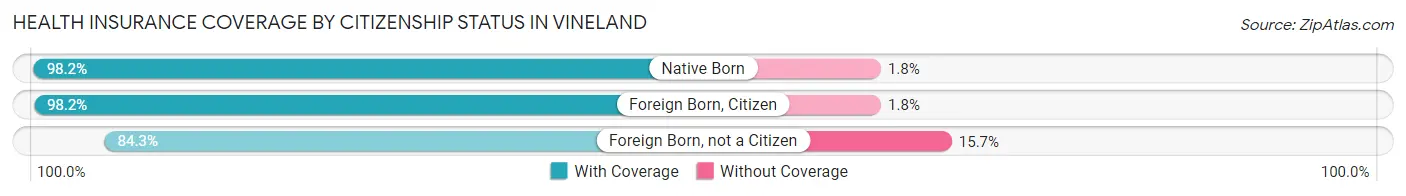
| Citizenship Status | With Coverage | Without Coverage |
| Native Born | 4,642 (98.2%) | 85 (1.8%) |
| Foreign Born, Citizen | 10,155 (98.2%) | 190 (1.8%) |
| Foreign Born, not a Citizen | 4,823 (84.3%) | 901 (15.7%) |
Health Insurance Coverage by Household Income in Vineland
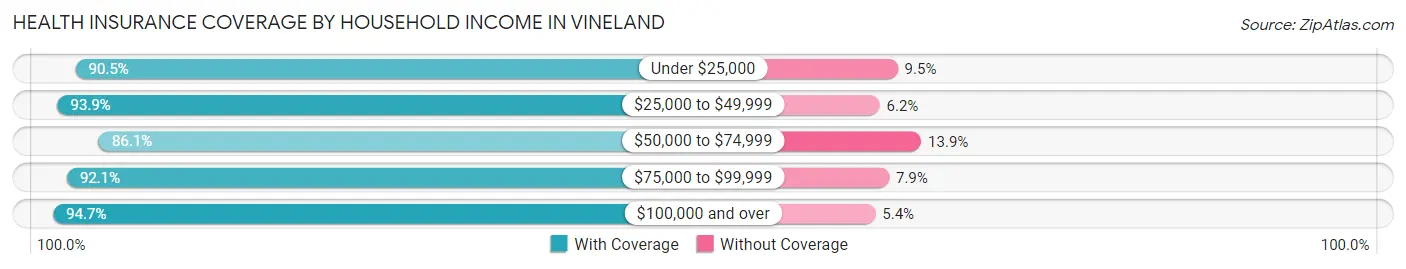
| Household Income | With Coverage | Without Coverage |
| Under $25,000 | 6,675 (90.5%) | 703 (9.5%) |
| $25,000 to $49,999 | 9,090 (93.9%) | 596 (6.1%) |
| $50,000 to $74,999 | 9,141 (86.1%) | 1,479 (13.9%) |
| $75,000 to $99,999 | 6,585 (92.1%) | 566 (7.9%) |
| $100,000 and over | 22,952 (94.7%) | 1,298 (5.3%) |
Public vs Private Health Insurance Coverage by Age in Vineland
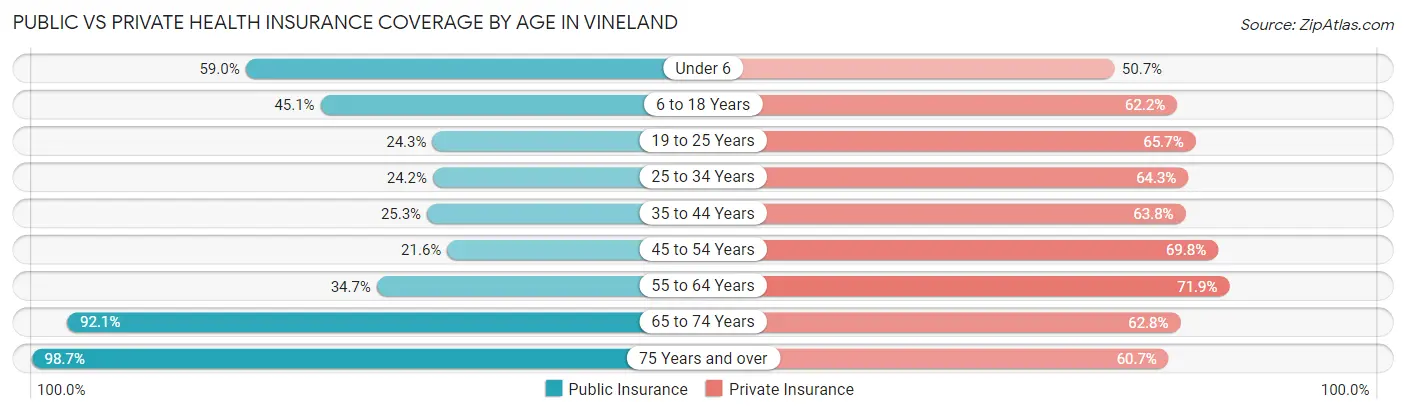
| Age Bracket | Public Insurance | Private Insurance |
| Under 6 | 2,789 (59.0%) | 2,396 (50.7%) |
| 6 to 18 Years | 4,665 (45.1%) | 6,439 (62.2%) |
| 19 to 25 Years | 1,392 (24.3%) | 3,758 (65.6%) |
| 25 to 34 Years | 1,624 (24.2%) | 4,309 (64.3%) |
| 35 to 44 Years | 1,880 (25.3%) | 4,736 (63.8%) |
| 45 to 54 Years | 1,611 (21.6%) | 5,215 (69.8%) |
| 55 to 64 Years | 2,719 (34.6%) | 5,644 (71.9%) |
| 65 to 74 Years | 5,226 (92.1%) | 3,565 (62.8%) |
| 75 Years and over | 3,978 (98.7%) | 2,445 (60.7%) |
| Total | 25,884 (43.2%) | 38,507 (64.2%) |
Disability Status by Sex by Age in Vineland
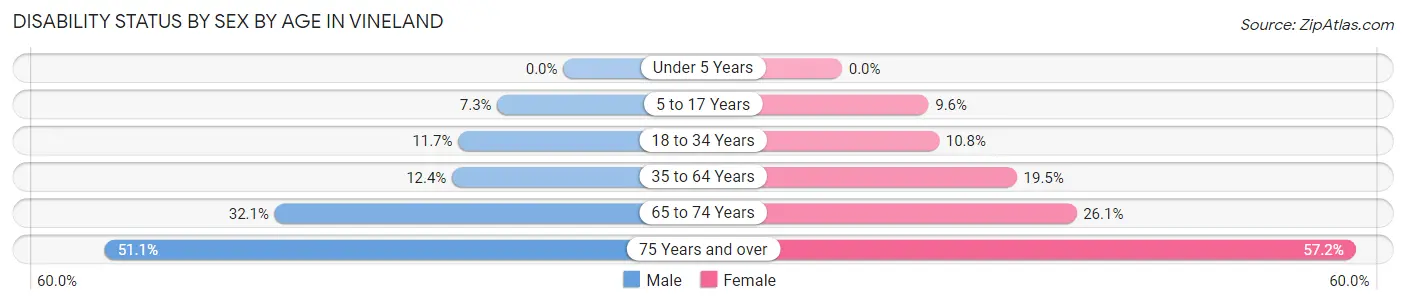
| Age Bracket | Male | Female |
| Under 5 Years | 0 (0.0%) | 0 (0.0%) |
| 5 to 17 Years | 415 (7.3%) | 494 (9.6%) |
| 18 to 34 Years | 848 (11.7%) | 625 (10.8%) |
| 35 to 64 Years | 1,300 (12.4%) | 2,383 (19.5%) |
| 65 to 74 Years | 872 (32.1%) | 773 (26.1%) |
| 75 Years and over | 788 (51.1%) | 1,423 (57.2%) |
Disability Class by Sex by Age in Vineland
Disability Class: Hearing Difficulty
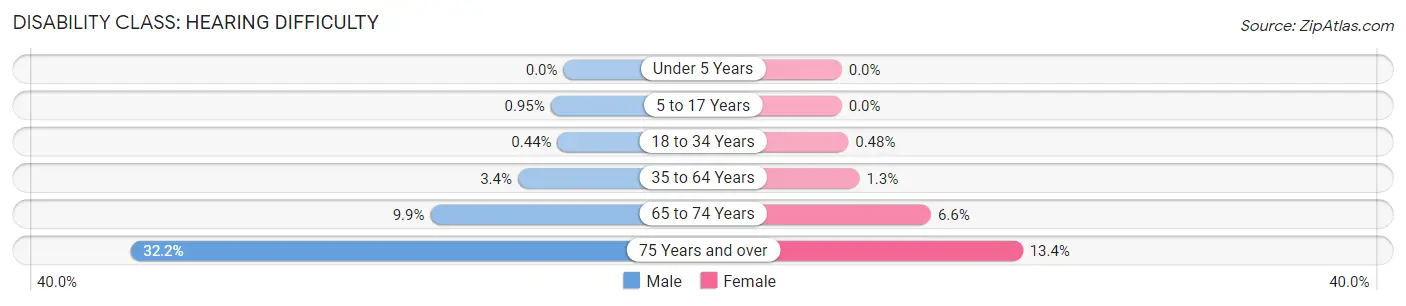
| Age Bracket | Male | Female |
| Under 5 Years | 0 (0.0%) | 0 (0.0%) |
| 5 to 17 Years | 54 (0.9%) | 0 (0.0%) |
| 18 to 34 Years | 32 (0.4%) | 28 (0.5%) |
| 35 to 64 Years | 355 (3.4%) | 160 (1.3%) |
| 65 to 74 Years | 268 (9.9%) | 196 (6.6%) |
| 75 Years and over | 496 (32.2%) | 334 (13.4%) |
Disability Class: Vision Difficulty
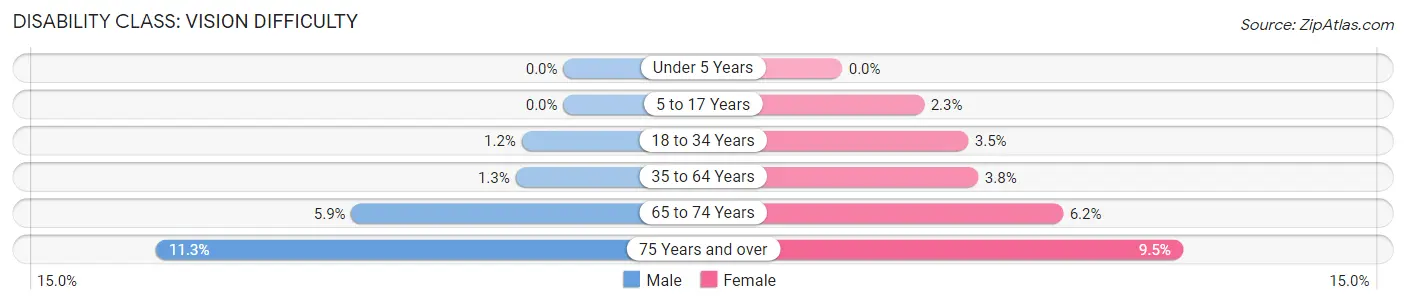
| Age Bracket | Male | Female |
| Under 5 Years | 0 (0.0%) | 0 (0.0%) |
| 5 to 17 Years | 0 (0.0%) | 117 (2.3%) |
| 18 to 34 Years | 84 (1.2%) | 203 (3.5%) |
| 35 to 64 Years | 140 (1.3%) | 464 (3.8%) |
| 65 to 74 Years | 160 (5.9%) | 182 (6.1%) |
| 75 Years and over | 175 (11.3%) | 236 (9.5%) |
Disability Class: Cognitive Difficulty
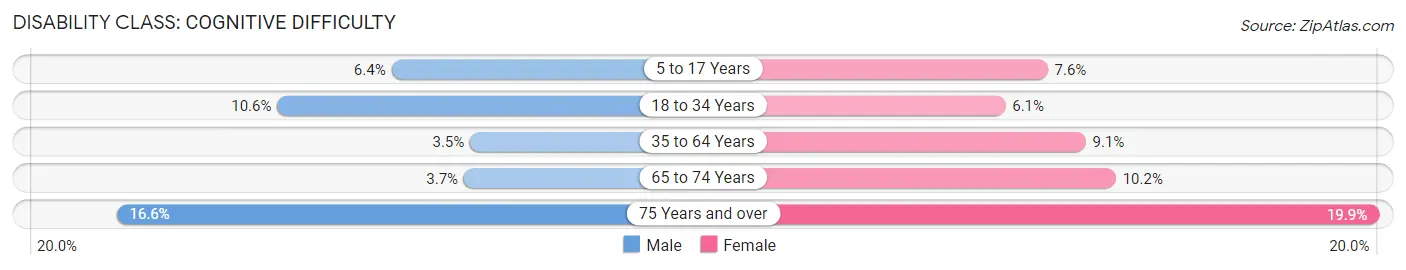
| Age Bracket | Male | Female |
| 5 to 17 Years | 361 (6.4%) | 392 (7.6%) |
| 18 to 34 Years | 770 (10.6%) | 351 (6.1%) |
| 35 to 64 Years | 363 (3.5%) | 1,108 (9.0%) |
| 65 to 74 Years | 100 (3.7%) | 301 (10.2%) |
| 75 Years and over | 256 (16.6%) | 496 (19.9%) |
Disability Class: Ambulatory Difficulty
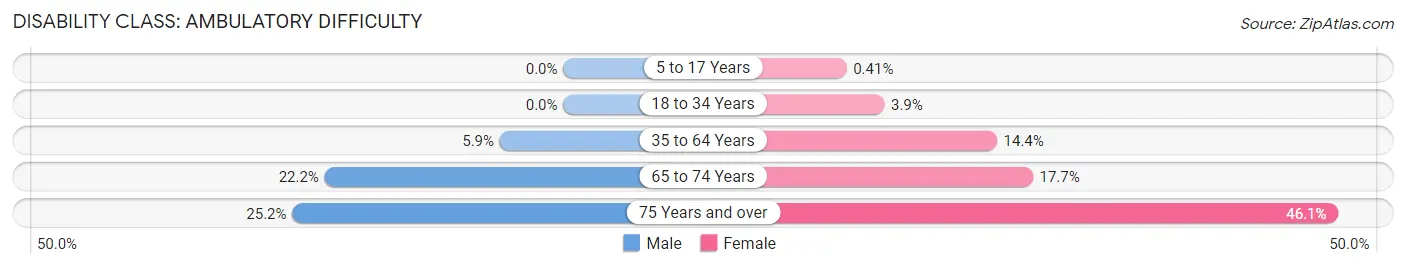
| Age Bracket | Male | Female |
| 5 to 17 Years | 0 (0.0%) | 21 (0.4%) |
| 18 to 34 Years | 0 (0.0%) | 227 (3.9%) |
| 35 to 64 Years | 619 (5.9%) | 1,759 (14.4%) |
| 65 to 74 Years | 601 (22.2%) | 524 (17.7%) |
| 75 Years and over | 388 (25.2%) | 1,146 (46.1%) |
Disability Class: Self-Care Difficulty
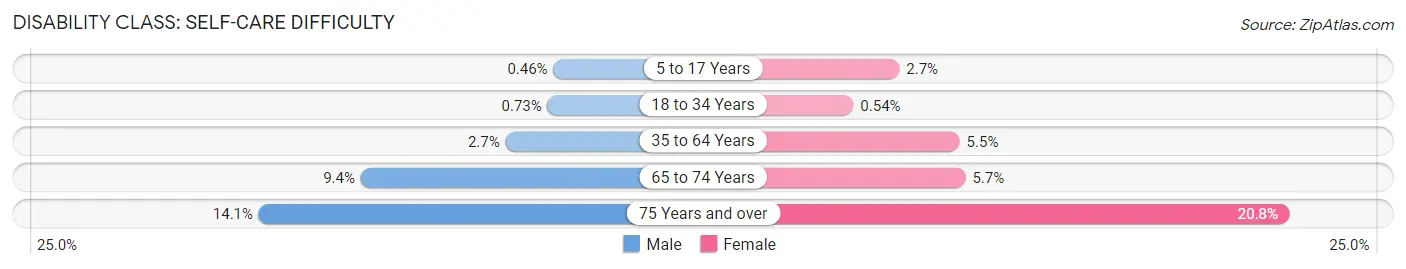
| Age Bracket | Male | Female |
| 5 to 17 Years | 26 (0.5%) | 137 (2.7%) |
| 18 to 34 Years | 53 (0.7%) | 31 (0.5%) |
| 35 to 64 Years | 281 (2.7%) | 670 (5.5%) |
| 65 to 74 Years | 255 (9.4%) | 170 (5.7%) |
| 75 Years and over | 218 (14.1%) | 517 (20.8%) |
Technology Access in Vineland
Computing Device Access in Vineland
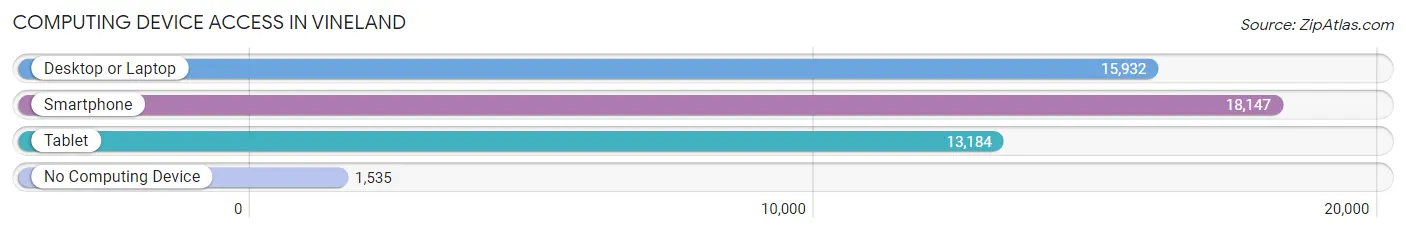
| Device Type | # Households | % Households |
| Desktop or Laptop | 15,932 | 73.9% |
| Smartphone | 18,147 | 84.1% |
| Tablet | 13,184 | 61.1% |
| No Computing Device | 1,535 | 7.1% |
| Total | 21,572 | 100.0% |
Internet Access in Vineland
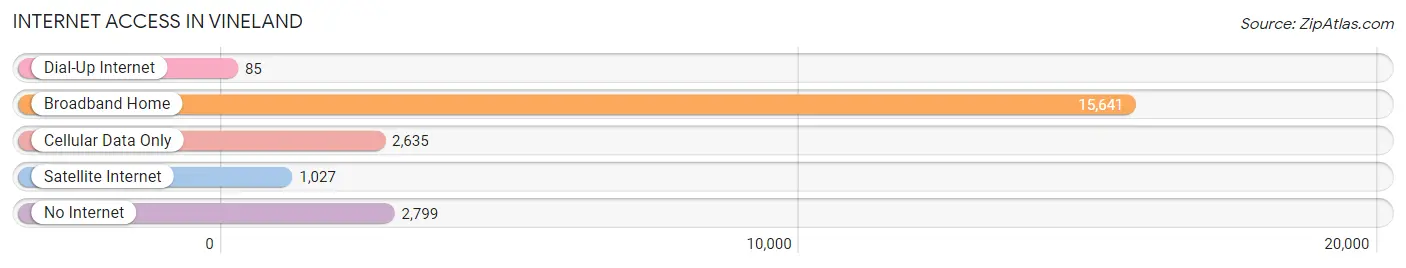
| Internet Type | # Households | % Households |
| Dial-Up Internet | 85 | 0.4% |
| Broadband Home | 15,641 | 72.5% |
| Cellular Data Only | 2,635 | 12.2% |
| Satellite Internet | 1,027 | 4.8% |
| No Internet | 2,799 | 13.0% |
| Total | 21,572 | 100.0% |
Vineland Summary
Vineland is a city located in Cumberland County, New Jersey, United States. It is part of the Vineland-Millville-Bridgeton Primary Metropolitan Statistical Area, which encompasses all of Cumberland County. As of the 2010 United States Census, the city had a total population of 60,724, making it the largest municipality in Cumberland County.
History
Vineland was founded in 1861 by Charles K. Landis, who purchased the land from the Lenni Lenape Native Americans. Landis named the city after the Spanish wine-producing region of Vineland, which he had visited in Spain. The city was incorporated in 1880.
Geography
Vineland is located in the southwestern part of New Jersey, in Cumberland County. It is situated on the north side of the Maurice River, which forms the border between Cumberland and Salem counties. The city is located approximately 10 miles from the Delaware Bay and the Atlantic Ocean.
The city has a total area of 24.2 square miles, of which 23.9 square miles is land and 0.3 square miles is water.
Economy
Vineland's economy is largely based on agriculture and food processing. The city is home to several large food processing companies, including the Campbell Soup Company, which has a large plant in the city. Other major employers in the city include the Vineland Developmental Center, the Vineland Public Schools, and the South Jersey Healthcare System.
Demographics
As of the 2010 United States Census, there were 60,724 people, 22,845 households, and 15,845 families residing in the city. The population density was 2,541.3 people per square mile. The racial makeup of the city was 68.2% White, 15.3% African American, 0.5% Native American, 1.2% Asian, 0.1% Pacific Islander, 11.7% from other races, and 3.0% from two or more races. Hispanic or Latino of any race were 24.7% of the population.
The median income for a household in the city was $45,890, and the median income for a family was $54,890. Males had a median income of $41,890 versus $30,890 for females. The per capita income for the city was $20,890. About 11.7% of families and 14.7% of the population were below the poverty line, including 20.3% of those under age 18 and 10.2% of those age 65 or over.
Common Questions
What is Per Capita Income in Vineland?
Per Capita income in Vineland is $32,195.
What is the Median Family Income in Vineland?
Median Family Income in Vineland is $80,110.
What is the Median Household income in Vineland?
Median Household Income in Vineland is $63,468.
What is Income or Wage Gap in Vineland?
Income or Wage Gap in Vineland is 26.5%.
Women in Vineland earn 73.5 cents for every dollar earned by a man.
What is Family Income Deficit in Vineland?
Family Income Deficit in Vineland is $9,019.
Families that are below poverty line in Vineland earn $9,019 less on average than the poverty threshold level.
What is Inequality or Gini Index in Vineland?
Inequality or Gini Index in Vineland is 0.46.
What is the Total Population of Vineland?
Total Population of Vineland is 60,796.
What is the Total Male Population of Vineland?
Total Male Population of Vineland is 29,752.
What is the Total Female Population of Vineland?
Total Female Population of Vineland is 31,044.
What is the Ratio of Males per 100 Females in Vineland?
There are 95.84 Males per 100 Females in Vineland.
What is the Ratio of Females per 100 Males in Vineland?
There are 104.34 Females per 100 Males in Vineland.
What is the Median Population Age in Vineland?
Median Population Age in Vineland is 38.6 Years.
What is the Average Family Size in Vineland
Average Family Size in Vineland is 3.3 People.
What is the Average Household Size in Vineland
Average Household Size in Vineland is 2.7 People.
How Large is the Labor Force in Vineland?
There are 28,782 People in the Labor Forcein in Vineland.
What is the Percentage of People in the Labor Force in Vineland?
60.2% of People are in the Labor Force in Vineland.
What is the Unemployment Rate in Vineland?
Unemployment Rate in Vineland is 8.3%.