Newton, NJ Map & Demographics
Newton Map
Newton Overview
$39,363
PER CAPITA INCOME
$120,139
AVG FAMILY INCOME
$72,240
AVG HOUSEHOLD INCOME
40.9%
WAGE / INCOME GAP [ % ]
59.1¢/ $1
WAGE / INCOME GAP [ $ ]
$10,259
FAMILY INCOME DEFICIT
0.45
INEQUALITY / GINI INDEX
8,370
TOTAL POPULATION
3,837
MALE POPULATION
4,533
FEMALE POPULATION
84.65
MALES / 100 FEMALES
118.14
FEMALES / 100 MALES
44.4
MEDIAN AGE
3.0
AVG FAMILY SIZE
2.2
AVG HOUSEHOLD SIZE
4,503
LABOR FORCE [ PEOPLE ]
63.0%
PERCENT IN LABOR FORCE
7.6%
UNEMPLOYMENT RATE
Newton Zip Codes
Income in Newton
Income Overview in Newton
Per Capita Income in Newton is $39,363, while median incomes of families and households are $120,139 and $72,240 respectively.
| Characteristic | Number | Measure |
| Per Capita Income | 8,370 | $39,363 |
| Median Family Income | 2,058 | $120,139 |
| Mean Family Income | 2,058 | $124,388 |
| Median Household Income | 3,516 | $72,240 |
| Mean Household Income | 3,516 | $95,741 |
| Income Deficit | 2,058 | $10,259 |
| Wage / Income Gap (%) | 8,370 | 40.88% |
| Wage / Income Gap ($) | 8,370 | 59.12¢ per $1 |
| Gini / Inequality Index | 8,370 | 0.45 |
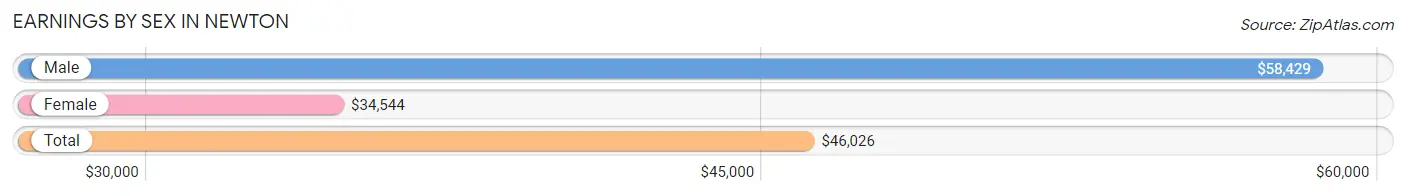
Earnings by Sex in Newton
Average Earnings in Newton are $46,026, $58,429 for men and $34,544 for women, a difference of 40.9%.
| Sex | Number | Average Earnings |
| Male | 2,178 (48.3%) | $58,429 |
| Female | 2,334 (51.7%) | $34,544 |
| Total | 4,512 (100.0%) | $46,026 |
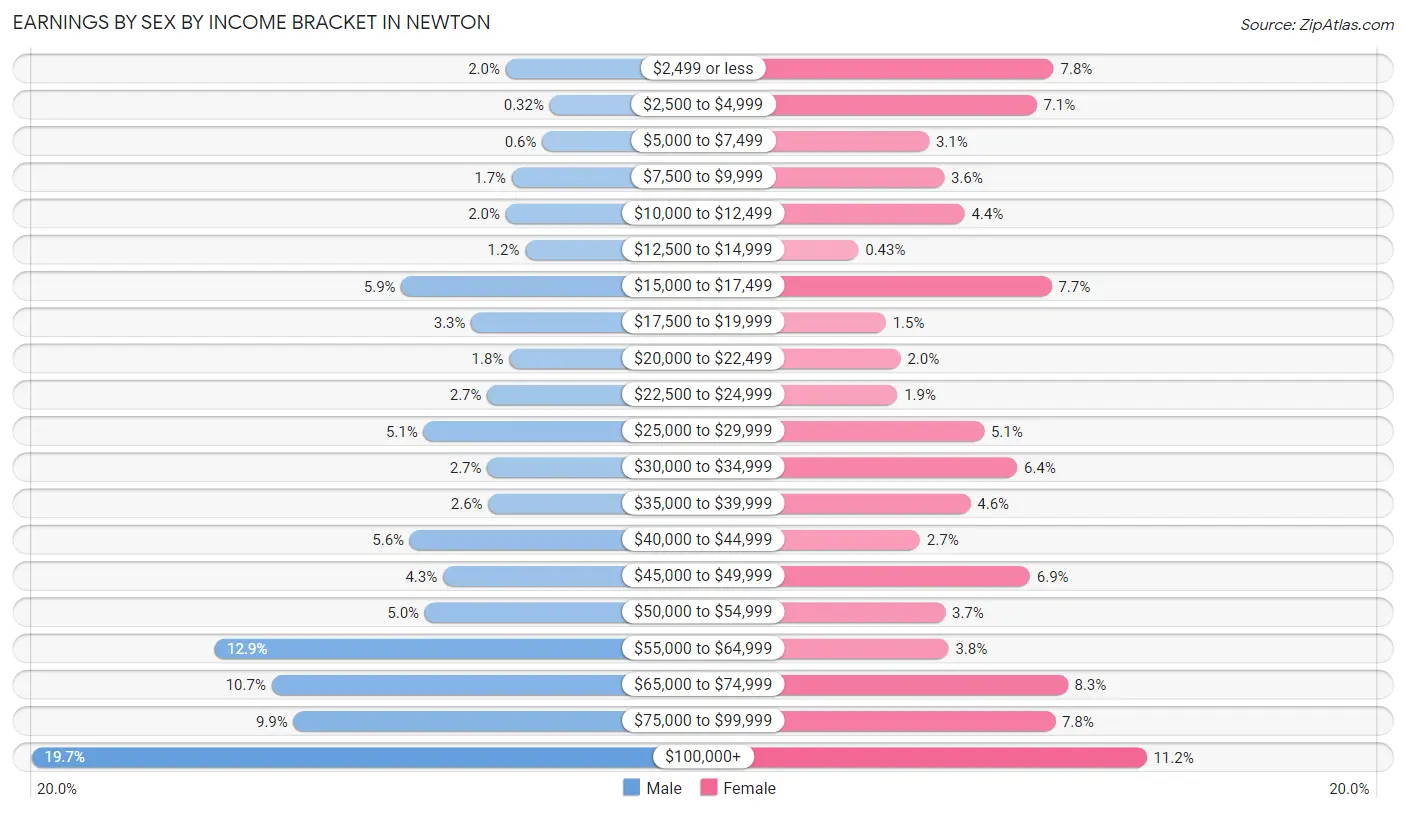
Earnings by Sex by Income Bracket in Newton
The most common earnings brackets in Newton are $100,000+ for men (430 | 19.7%) and $100,000+ for women (262 | 11.2%).
| Income | Male | Female |
| $2,499 or less | 43 (2.0%) | 181 (7.7%) |
| $2,500 to $4,999 | 7 (0.3%) | 166 (7.1%) |
| $5,000 to $7,499 | 13 (0.6%) | 72 (3.1%) |
| $7,500 to $9,999 | 38 (1.7%) | 85 (3.6%) |
| $10,000 to $12,499 | 43 (2.0%) | 103 (4.4%) |
| $12,500 to $14,999 | 27 (1.2%) | 10 (0.4%) |
| $15,000 to $17,499 | 128 (5.9%) | 179 (7.7%) |
| $17,500 to $19,999 | 71 (3.3%) | 34 (1.5%) |
| $20,000 to $22,499 | 40 (1.8%) | 47 (2.0%) |
| $22,500 to $24,999 | 58 (2.7%) | 44 (1.9%) |
| $25,000 to $29,999 | 110 (5.1%) | 120 (5.1%) |
| $30,000 to $34,999 | 58 (2.7%) | 149 (6.4%) |
| $35,000 to $39,999 | 57 (2.6%) | 108 (4.6%) |
| $40,000 to $44,999 | 121 (5.6%) | 64 (2.7%) |
| $45,000 to $49,999 | 94 (4.3%) | 160 (6.9%) |
| $50,000 to $54,999 | 109 (5.0%) | 86 (3.7%) |
| $55,000 to $64,999 | 281 (12.9%) | 89 (3.8%) |
| $65,000 to $74,999 | 234 (10.7%) | 193 (8.3%) |
| $75,000 to $99,999 | 216 (9.9%) | 182 (7.8%) |
| $100,000+ | 430 (19.7%) | 262 (11.2%) |
| Total | 2,178 (100.0%) | 2,334 (100.0%) |
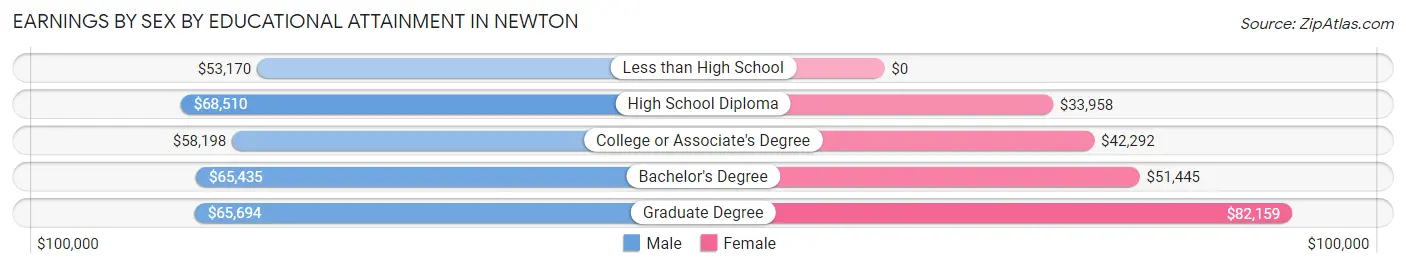
Earnings by Sex by Educational Attainment in Newton
Average earnings in Newton are $61,731 for men and $43,234 for women, a difference of 30.0%. Men with an educational attainment of high school diploma enjoy the highest average annual earnings of $68,510, while those with less than high school education earn the least with $53,170. Women with an educational attainment of graduate degree earn the most with the average annual earnings of $82,159, while those with high school diploma education have the smallest earnings of $33,958.
| Educational Attainment | Male Income | Female Income |
| Less than High School | $53,170 | $0 |
| High School Diploma | $68,510 | $33,958 |
| College or Associate's Degree | $58,198 | $42,292 |
| Bachelor's Degree | $65,435 | $51,445 |
| Graduate Degree | $65,694 | $82,159 |
| Total | $61,731 | $43,234 |
Family Income in Newton
Family Income Brackets in Newton
According to the Newton family income data, there are 471 families falling into the $200,000+ income range, which is the most common income bracket and makes up 22.9% of all families. Conversely, the $10,000 to $14,999 income bracket is the least frequent group with only 37 families (1.8%) belonging to this category.
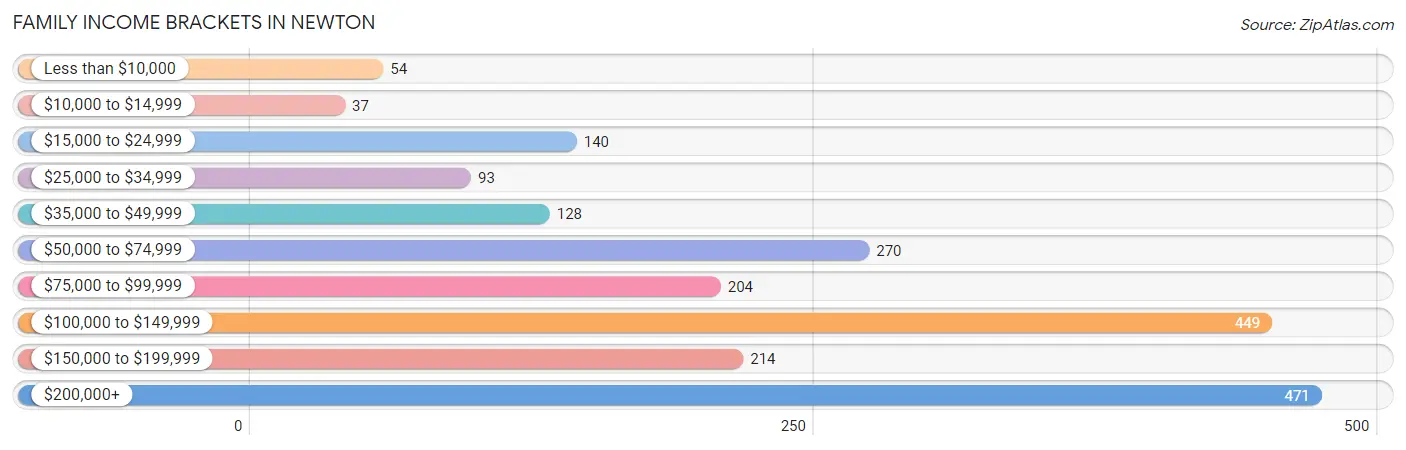
| Income Bracket | # Families | % Families |
| Less than $10,000 | 54 | 2.6% |
| $10,000 to $14,999 | 37 | 1.8% |
| $15,000 to $24,999 | 140 | 6.8% |
| $25,000 to $34,999 | 93 | 4.5% |
| $35,000 to $49,999 | 128 | 6.2% |
| $50,000 to $74,999 | 270 | 13.1% |
| $75,000 to $99,999 | 204 | 9.9% |
| $100,000 to $149,999 | 449 | 21.8% |
| $150,000 to $199,999 | 214 | 10.4% |
| $200,000+ | 471 | 22.9% |
Family Income by Famaliy Size in Newton
5-person families (114 | 5.5%) account for the highest median family income in Newton with $177,708 per family, while 2-person families (921 | 44.8%) have the highest median income of $49,204 per family member.
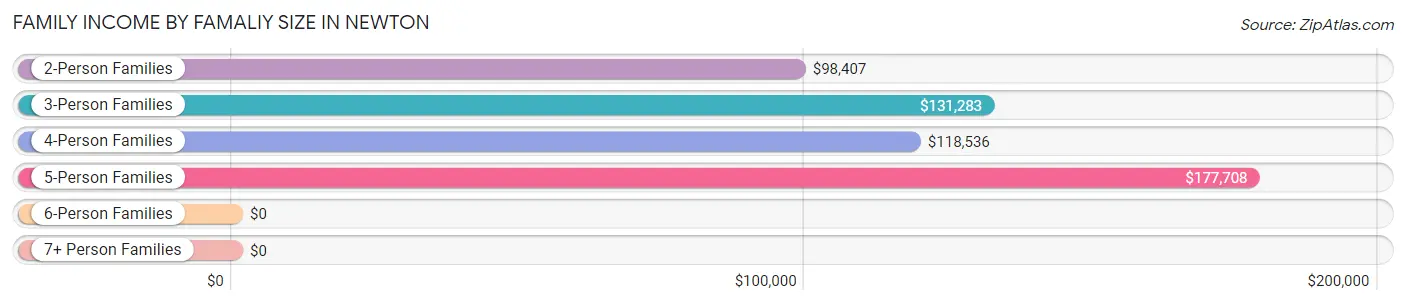
| Income Bracket | # Families | Median Income |
| 2-Person Families | 921 (44.8%) | $98,407 |
| 3-Person Families | 517 (25.1%) | $131,283 |
| 4-Person Families | 385 (18.7%) | $118,536 |
| 5-Person Families | 114 (5.5%) | $177,708 |
| 6-Person Families | 34 (1.7%) | $0 |
| 7+ Person Families | 87 (4.2%) | $0 |
| Total | 2,058 (100.0%) | $120,139 |
Family Income by Number of Earners in Newton
The median family income in Newton is $120,139, with families comprising 3+ earners (376) having the highest median family income of $158,529, while families with 1 earner (615) have the lowest median family income of $59,028, accounting for 18.3% and 29.9% of families, respectively.
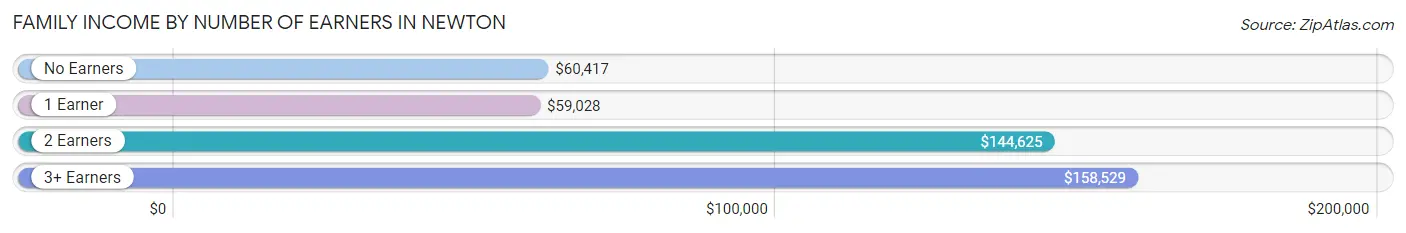
| Number of Earners | # Families | Median Income |
| No Earners | 168 (8.2%) | $60,417 |
| 1 Earner | 615 (29.9%) | $59,028 |
| 2 Earners | 899 (43.7%) | $144,625 |
| 3+ Earners | 376 (18.3%) | $158,529 |
| Total | 2,058 (100.0%) | $120,139 |
Household Income in Newton
Household Income Brackets in Newton
With 647 households falling in the category, the $100,000 to $149,999 income range is the most frequent in Newton, accounting for 18.4% of all households. In contrast, only 127 households (3.6%) fall into the $10,000 to $14,999 income bracket, making it the least populous group.
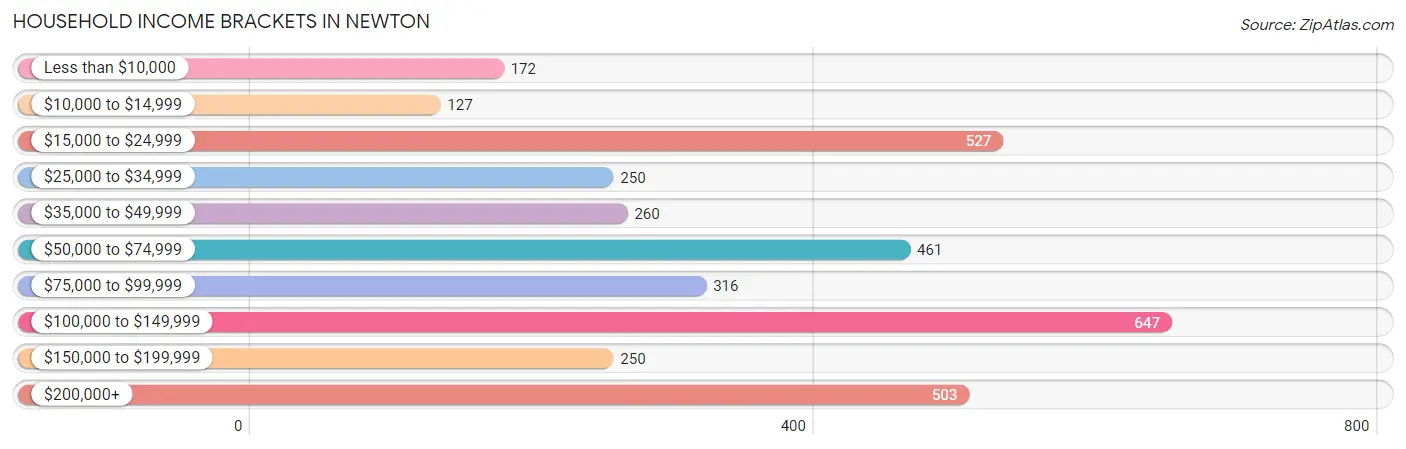
| Income Bracket | # Households | % Households |
| Less than $10,000 | 172 | 4.9% |
| $10,000 to $14,999 | 127 | 3.6% |
| $15,000 to $24,999 | 527 | 15.0% |
| $25,000 to $34,999 | 250 | 7.1% |
| $35,000 to $49,999 | 260 | 7.4% |
| $50,000 to $74,999 | 461 | 13.1% |
| $75,000 to $99,999 | 316 | 9.0% |
| $100,000 to $149,999 | 647 | 18.4% |
| $150,000 to $199,999 | 250 | 7.1% |
| $200,000+ | 503 | 14.3% |
Household Income by Householder Age in Newton
The median household income in Newton is $72,240, with the highest median household income of $99,338 found in the 45 to 64 years age bracket for the primary householder. A total of 1,369 households (38.9%) fall into this category. Meanwhile, the 15 to 24 years age bracket for the primary householder has the lowest median household income of $0, with 40 households (1.1%) in this group.
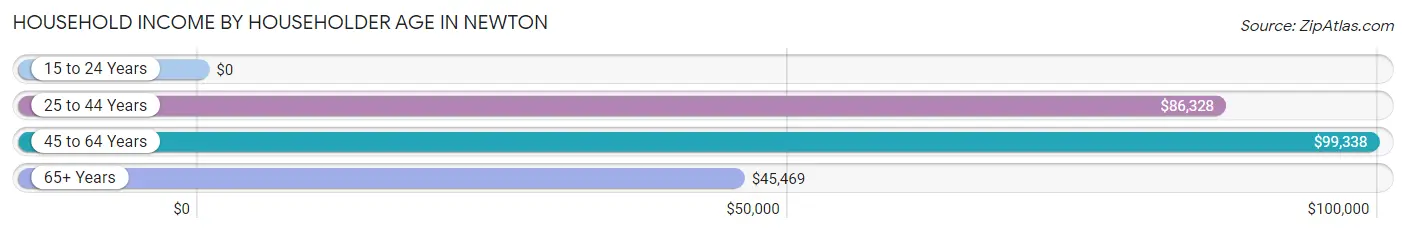
| Income Bracket | # Households | Median Income |
| 15 to 24 Years | 40 (1.1%) | $0 |
| 25 to 44 Years | 978 (27.8%) | $86,328 |
| 45 to 64 Years | 1,369 (38.9%) | $99,338 |
| 65+ Years | 1,129 (32.1%) | $45,469 |
| Total | 3,516 (100.0%) | $72,240 |
Poverty in Newton
Income Below Poverty by Sex and Age in Newton
With 10.1% poverty level for males and 15.1% for females among the residents of Newton, under 5 year old males and 5 year old females are the most vulnerable to poverty, with 76 males (40.2%) and 49 females (84.5%) in their respective age groups living below the poverty level.
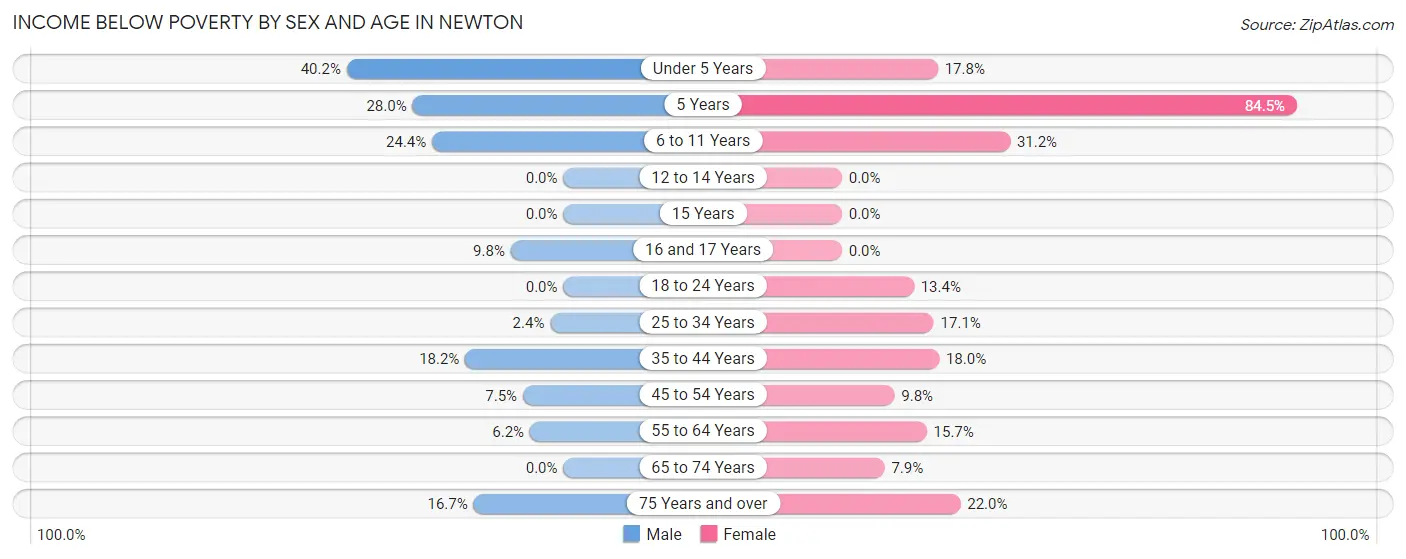
| Age Bracket | Male | Female |
| Under 5 Years | 76 (40.2%) | 13 (17.8%) |
| 5 Years | 14 (28.0%) | 49 (84.5%) |
| 6 to 11 Years | 57 (24.4%) | 49 (31.2%) |
| 12 to 14 Years | 0 (0.0%) | 0 (0.0%) |
| 15 Years | 0 (0.0%) | 0 (0.0%) |
| 16 and 17 Years | 13 (9.8%) | 0 (0.0%) |
| 18 to 24 Years | 0 (0.0%) | 43 (13.4%) |
| 25 to 34 Years | 13 (2.4%) | 110 (17.1%) |
| 35 to 44 Years | 96 (18.2%) | 70 (18.0%) |
| 45 to 54 Years | 45 (7.5%) | 74 (9.8%) |
| 55 to 64 Years | 25 (6.2%) | 82 (15.7%) |
| 65 to 74 Years | 0 (0.0%) | 38 (7.9%) |
| 75 Years and over | 33 (16.7%) | 121 (22.0%) |
| Total | 372 (10.1%) | 649 (15.1%) |
Income Above Poverty by Sex and Age in Newton
According to the poverty statistics in Newton, males aged 12 to 14 years and females aged 12 to 14 years are the age groups that are most secure financially, with 100.0% of males and 100.0% of females in these age groups living above the poverty line.
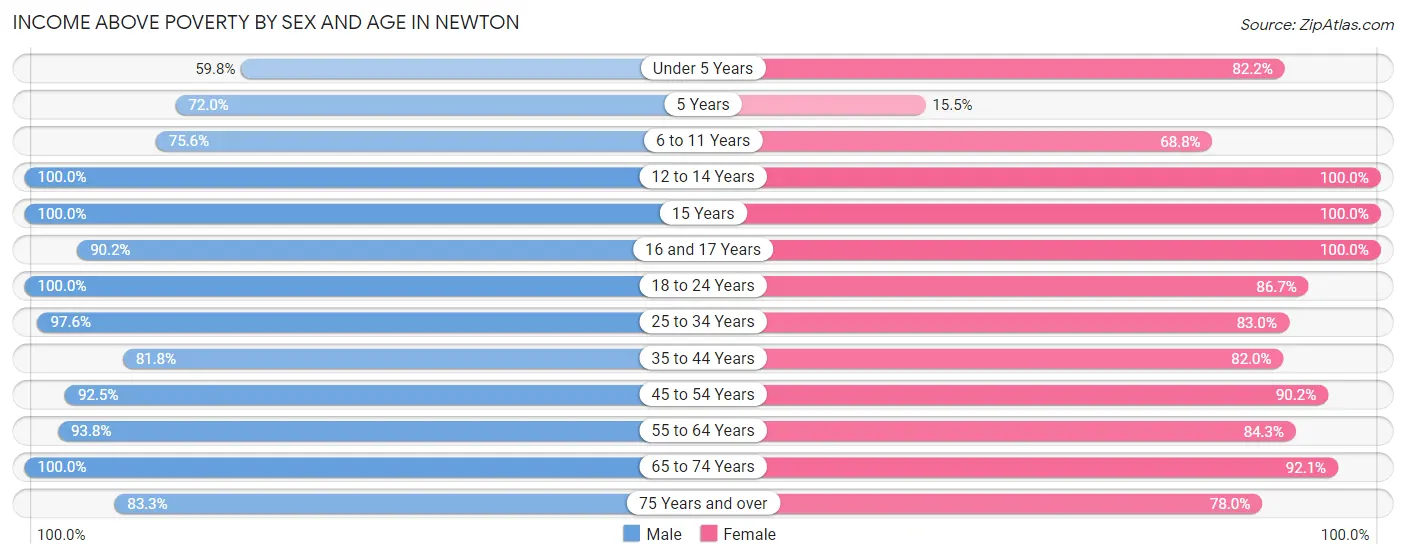
| Age Bracket | Male | Female |
| Under 5 Years | 113 (59.8%) | 60 (82.2%) |
| 5 Years | 36 (72.0%) | 9 (15.5%) |
| 6 to 11 Years | 177 (75.6%) | 108 (68.8%) |
| 12 to 14 Years | 137 (100.0%) | 130 (100.0%) |
| 15 Years | 62 (100.0%) | 101 (100.0%) |
| 16 and 17 Years | 120 (90.2%) | 113 (100.0%) |
| 18 to 24 Years | 293 (100.0%) | 279 (86.7%) |
| 25 to 34 Years | 523 (97.6%) | 535 (83.0%) |
| 35 to 44 Years | 431 (81.8%) | 318 (82.0%) |
| 45 to 54 Years | 555 (92.5%) | 684 (90.2%) |
| 55 to 64 Years | 378 (93.8%) | 439 (84.3%) |
| 65 to 74 Years | 315 (100.0%) | 442 (92.1%) |
| 75 Years and over | 165 (83.3%) | 429 (78.0%) |
| Total | 3,305 (89.9%) | 3,647 (84.9%) |
Income Below Poverty Among Married-Couple Families in Newton
The poverty statistics for married-couple families in Newton show that 6.2% or 86 of the total 1,396 families live below the poverty line. Families with 1 or 2 children have the highest poverty rate of 17.7%, comprising of 77 families. On the other hand, families with 3 or 4 children have the lowest poverty rate of 0.0%, which includes 0 families.
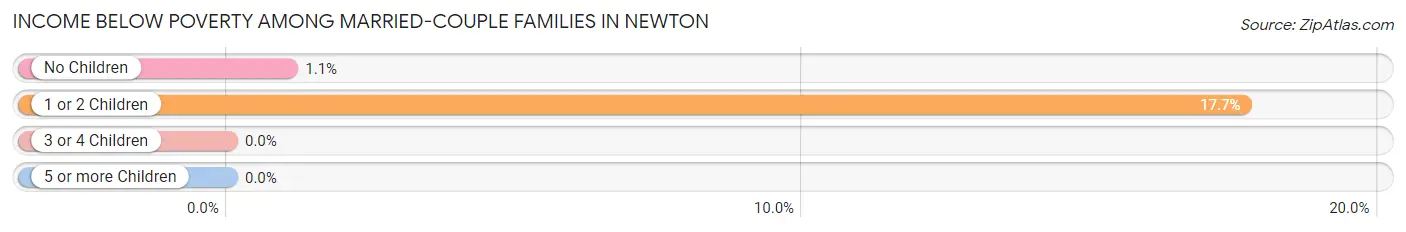
| Children | Above Poverty | Below Poverty |
| No Children | 849 (99.0%) | 9 (1.1%) |
| 1 or 2 Children | 359 (82.3%) | 77 (17.7%) |
| 3 or 4 Children | 84 (100.0%) | 0 (0.0%) |
| 5 or more Children | 18 (100.0%) | 0 (0.0%) |
| Total | 1,310 (93.8%) | 86 (6.2%) |
Income Below Poverty Among Single-Parent Households in Newton
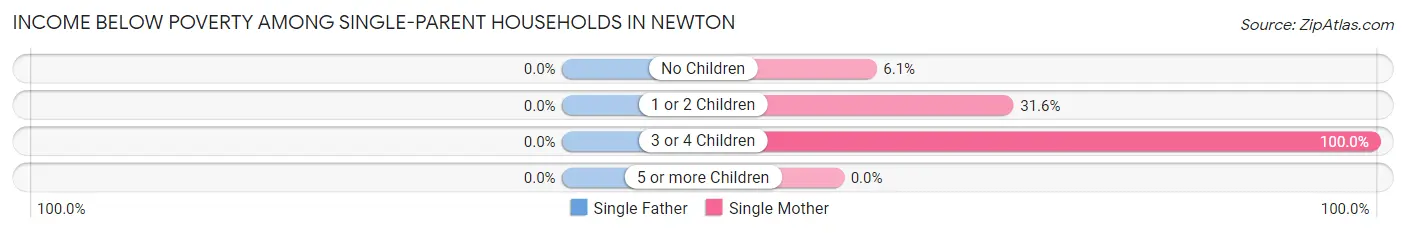
| Children | Single Father | Single Mother |
| No Children | 0 (0.0%) | 14 (6.1%) |
| 1 or 2 Children | 0 (0.0%) | 79 (31.6%) |
| 3 or 4 Children | 0 (0.0%) | 25 (100.0%) |
| 5 or more Children | 0 (0.0%) | 0 (0.0%) |
| Total | 0 (0.0%) | 118 (23.4%) |
Income Below Poverty Among Married-Couple vs Single-Parent Households in Newton
The poverty data for Newton shows that 86 of the married-couple family households (6.2%) and 118 of the single-parent households (17.8%) are living below the poverty level. Within the married-couple family households, those with 1 or 2 children have the highest poverty rate, with 77 households (17.7%) falling below the poverty line. Among the single-parent households, those with 3 or 4 children have the highest poverty rate, with 25 household (100.0%) living below poverty.
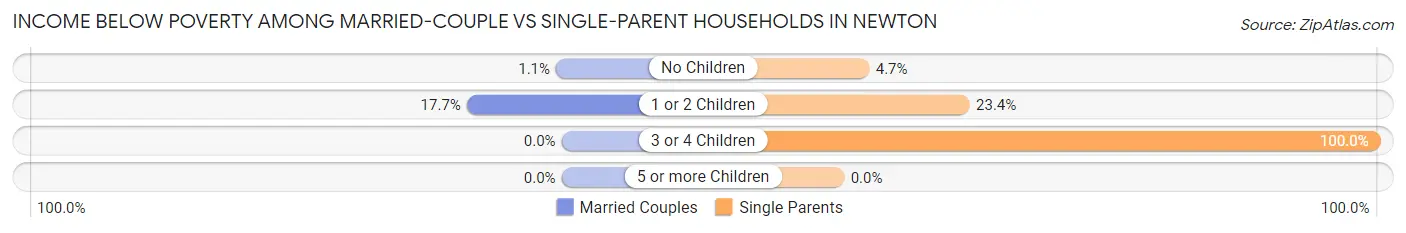
| Children | Married-Couple Families | Single-Parent Households |
| No Children | 9 (1.1%) | 14 (4.7%) |
| 1 or 2 Children | 77 (17.7%) | 79 (23.4%) |
| 3 or 4 Children | 0 (0.0%) | 25 (100.0%) |
| 5 or more Children | 0 (0.0%) | 0 (0.0%) |
| Total | 86 (6.2%) | 118 (17.8%) |
Race in Newton
The most populous races in Newton are White / Caucasian (6,832 | 81.6%), Hispanic or Latino (1,100 | 13.1%), and Black / African American (930 | 11.1%).
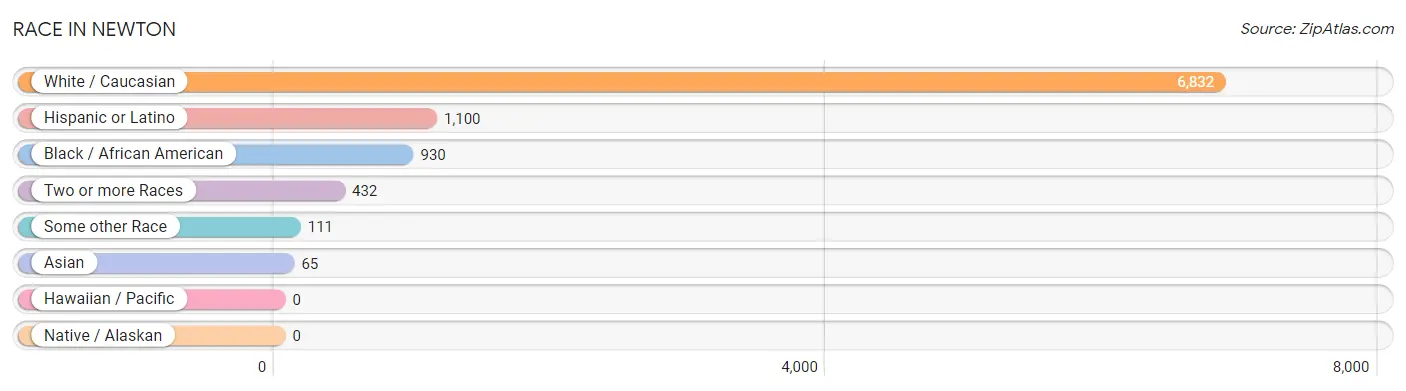
| Race | # Population | % Population |
| Asian | 65 | 0.8% |
| Black / African American | 930 | 11.1% |
| Hawaiian / Pacific | 0 | 0.0% |
| Hispanic or Latino | 1,100 | 13.1% |
| Native / Alaskan | 0 | 0.0% |
| White / Caucasian | 6,832 | 81.6% |
| Two or more Races | 432 | 5.2% |
| Some other Race | 111 | 1.3% |
| Total | 8,370 | 100.0% |
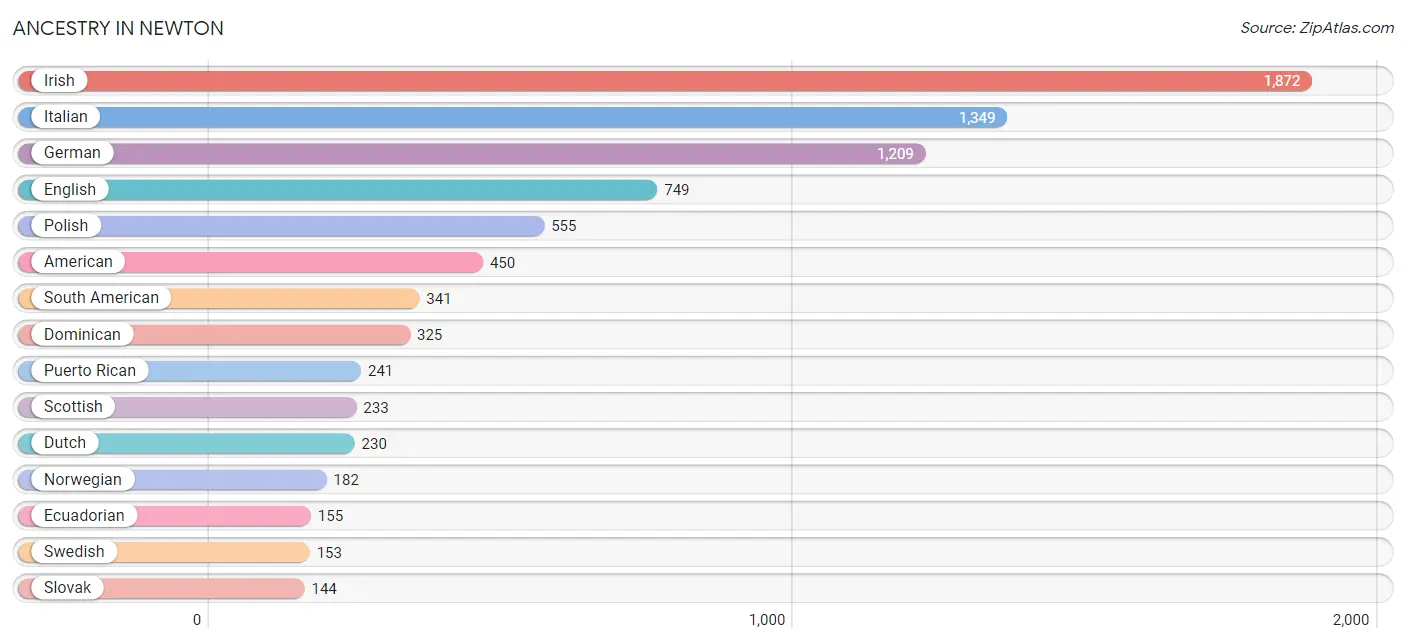
Ancestry in Newton
The most populous ancestries reported in Newton are Irish (1,872 | 22.4%), Italian (1,349 | 16.1%), German (1,209 | 14.4%), English (749 | 8.9%), and Polish (555 | 6.6%), together accounting for 68.5% of all Newton residents.
| Ancestry | # Population | % Population |
| African | 15 | 0.2% |
| American | 450 | 5.4% |
| Arab | 20 | 0.2% |
| Argentinean | 49 | 0.6% |
| Austrian | 30 | 0.4% |
| Barbadian | 3 | 0.0% |
| Brazilian | 14 | 0.2% |
| British | 57 | 0.7% |
| Burmese | 9 | 0.1% |
| Canadian | 19 | 0.2% |
| Central American | 97 | 1.2% |
| Chilean | 18 | 0.2% |
| Colombian | 119 | 1.4% |
| Croatian | 109 | 1.3% |
| Cuban | 9 | 0.1% |
| Czech | 46 | 0.5% |
| Danish | 13 | 0.2% |
| Dominican | 325 | 3.9% |
| Dutch | 230 | 2.8% |
| Ecuadorian | 155 | 1.8% |
| English | 749 | 8.9% |
| European | 70 | 0.8% |
| Finnish | 14 | 0.2% |
| French | 135 | 1.6% |
| French Canadian | 70 | 0.8% |
| German | 1,209 | 14.4% |
| Greek | 127 | 1.5% |
| Guatemalan | 20 | 0.2% |
| Guyanese | 39 | 0.5% |
| Hungarian | 105 | 1.3% |
| Irish | 1,872 | 22.4% |
| Italian | 1,349 | 16.1% |
| Jamaican | 36 | 0.4% |
| Korean | 70 | 0.8% |
| Lithuanian | 38 | 0.4% |
| Mexican | 48 | 0.6% |
| Northern European | 11 | 0.1% |
| Norwegian | 182 | 2.2% |
| Pakistani | 7 | 0.1% |
| Panamanian | 3 | 0.0% |
| Polish | 555 | 6.6% |
| Puerto Rican | 241 | 2.9% |
| Romanian | 68 | 0.8% |
| Russian | 111 | 1.3% |
| Salvadoran | 74 | 0.9% |
| Scandinavian | 10 | 0.1% |
| Scotch-Irish | 61 | 0.7% |
| Scottish | 233 | 2.8% |
| Slovak | 144 | 1.7% |
| South American | 341 | 4.1% |
| Spaniard | 29 | 0.4% |
| Sri Lankan | 12 | 0.1% |
| Subsaharan African | 58 | 0.7% |
| Swedish | 153 | 1.8% |
| Swiss | 7 | 0.1% |
| Thai | 34 | 0.4% |
| Turkish | 22 | 0.3% |
| Ukrainian | 63 | 0.7% |
| Welsh | 41 | 0.5% |
| West Indian | 90 | 1.1% | View All 60 Rows |
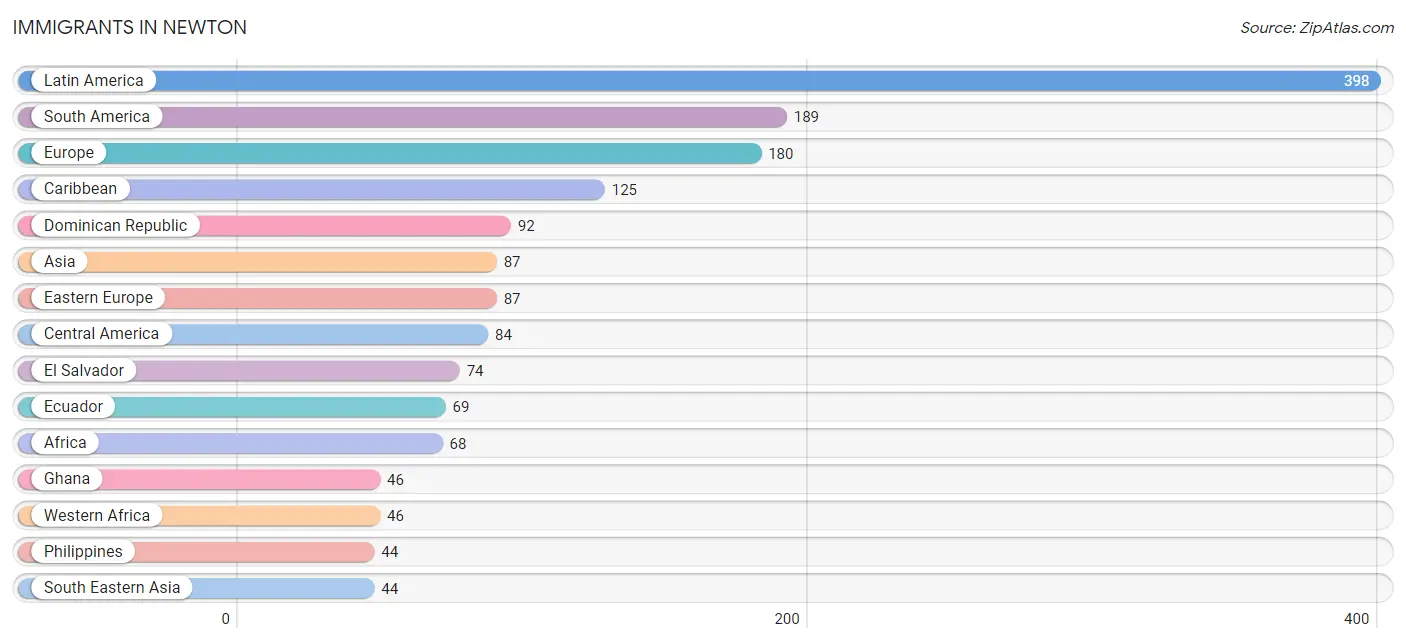
Immigrants in Newton
The most numerous immigrant groups reported in Newton came from Latin America (398 | 4.8%), South America (189 | 2.3%), Europe (180 | 2.1%), Caribbean (125 | 1.5%), and Dominican Republic (92 | 1.1%), together accounting for 11.8% of all Newton residents.
| Immigration Origin | # Population | % Population |
| Africa | 68 | 0.8% |
| Argentina | 31 | 0.4% |
| Asia | 87 | 1.0% |
| Brazil | 14 | 0.2% |
| Cameroon | 22 | 0.3% |
| Canada | 11 | 0.1% |
| Caribbean | 125 | 1.5% |
| Central America | 84 | 1.0% |
| Colombia | 36 | 0.4% |
| Croatia | 9 | 0.1% |
| Dominican Republic | 92 | 1.1% |
| Eastern Asia | 9 | 0.1% |
| Eastern Europe | 87 | 1.0% |
| Ecuador | 69 | 0.8% |
| El Salvador | 74 | 0.9% |
| England | 14 | 0.2% |
| Europe | 180 | 2.1% |
| Germany | 19 | 0.2% |
| Ghana | 46 | 0.5% |
| Greece | 33 | 0.4% |
| Guyana | 39 | 0.5% |
| India | 34 | 0.4% |
| Ireland | 20 | 0.2% |
| Korea | 9 | 0.1% |
| Latin America | 398 | 4.8% |
| Mexico | 7 | 0.1% |
| Middle Africa | 22 | 0.3% |
| Northern Europe | 34 | 0.4% |
| Panama | 3 | 0.0% |
| Philippines | 44 | 0.5% |
| Poland | 24 | 0.3% |
| Russia | 34 | 0.4% |
| South America | 189 | 2.3% |
| South Central Asia | 34 | 0.4% |
| South Eastern Asia | 44 | 0.5% |
| Southern Europe | 33 | 0.4% |
| Switzerland | 7 | 0.1% |
| Trinidad and Tobago | 33 | 0.4% |
| Ukraine | 20 | 0.2% |
| Western Africa | 46 | 0.5% |
| Western Europe | 26 | 0.3% | View All 41 Rows |
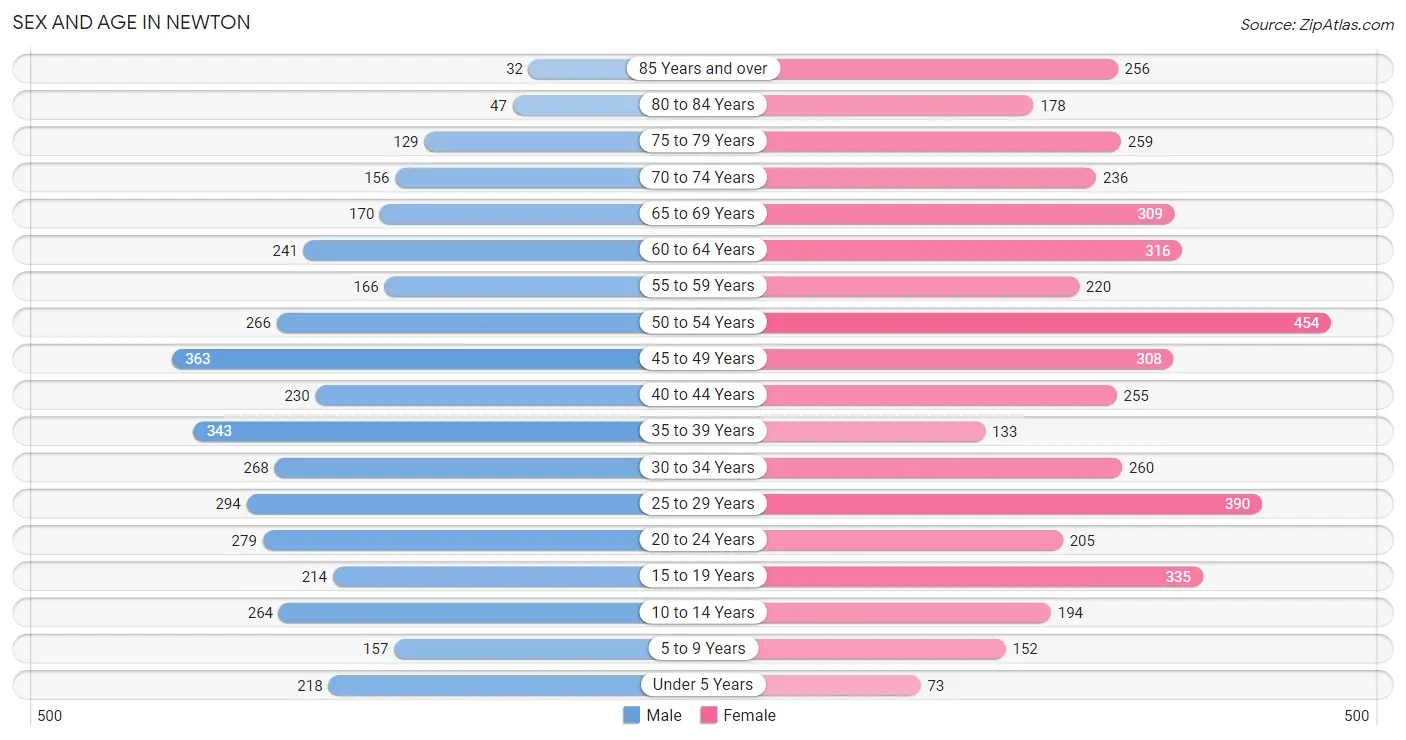
Sex and Age in Newton
Sex and Age in Newton
The most populous age groups in Newton are 45 to 49 Years (363 | 9.5%) for men and 50 to 54 Years (454 | 10.0%) for women.
| Age Bracket | Male | Female |
| Under 5 Years | 218 (5.7%) | 73 (1.6%) |
| 5 to 9 Years | 157 (4.1%) | 152 (3.4%) |
| 10 to 14 Years | 264 (6.9%) | 194 (4.3%) |
| 15 to 19 Years | 214 (5.6%) | 335 (7.4%) |
| 20 to 24 Years | 279 (7.3%) | 205 (4.5%) |
| 25 to 29 Years | 294 (7.7%) | 390 (8.6%) |
| 30 to 34 Years | 268 (7.0%) | 260 (5.7%) |
| 35 to 39 Years | 343 (8.9%) | 133 (2.9%) |
| 40 to 44 Years | 230 (6.0%) | 255 (5.6%) |
| 45 to 49 Years | 363 (9.5%) | 308 (6.8%) |
| 50 to 54 Years | 266 (6.9%) | 454 (10.0%) |
| 55 to 59 Years | 166 (4.3%) | 220 (4.9%) |
| 60 to 64 Years | 241 (6.3%) | 316 (7.0%) |
| 65 to 69 Years | 170 (4.4%) | 309 (6.8%) |
| 70 to 74 Years | 156 (4.1%) | 236 (5.2%) |
| 75 to 79 Years | 129 (3.4%) | 259 (5.7%) |
| 80 to 84 Years | 47 (1.2%) | 178 (3.9%) |
| 85 Years and over | 32 (0.8%) | 256 (5.7%) |
| Total | 3,837 (100.0%) | 4,533 (100.0%) |
Families and Households in Newton
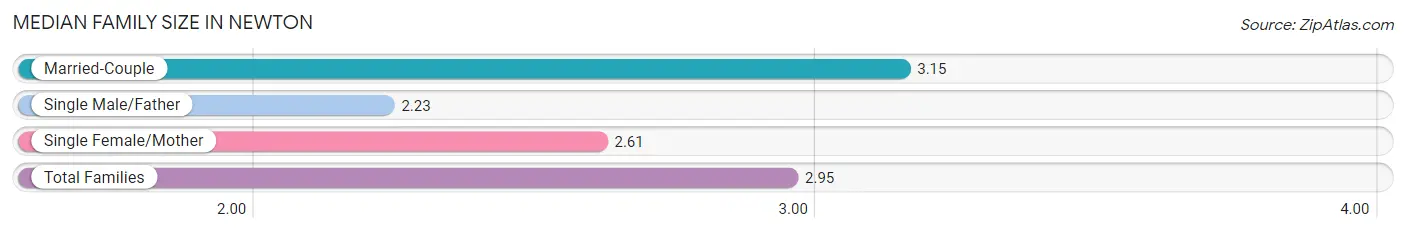
Median Family Size in Newton
The median family size in Newton is 2.95 persons per family, with married-couple families (1,396 | 67.8%) accounting for the largest median family size of 3.15 persons per family. On the other hand, single male/father families (157 | 7.6%) represent the smallest median family size with 2.23 persons per family.
| Family Type | # Families | Family Size |
| Married-Couple | 1,396 (67.8%) | 3.15 |
| Single Male/Father | 157 (7.6%) | 2.23 |
| Single Female/Mother | 505 (24.5%) | 2.61 |
| Total Families | 2,058 (100.0%) | 2.95 |
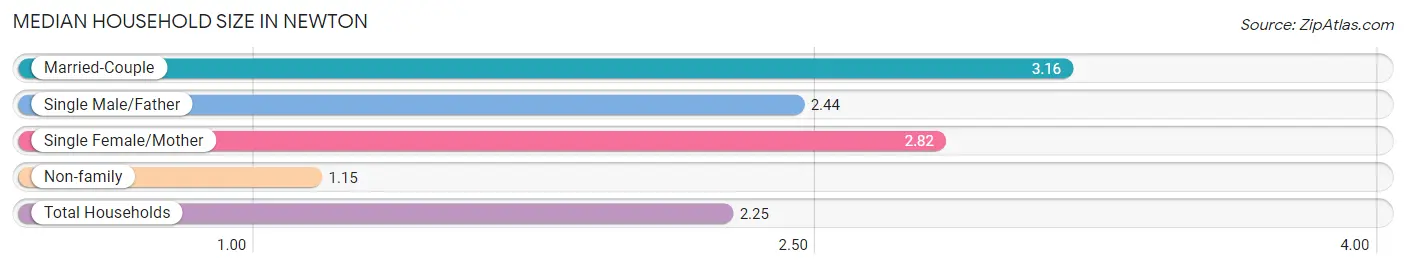
Median Household Size in Newton
The median household size in Newton is 2.25 persons per household, with married-couple households (1,396 | 39.7%) accounting for the largest median household size of 3.16 persons per household. non-family households (1,458 | 41.5%) represent the smallest median household size with 1.15 persons per household.
| Household Type | # Households | Household Size |
| Married-Couple | 1,396 (39.7%) | 3.16 |
| Single Male/Father | 157 (4.5%) | 2.44 |
| Single Female/Mother | 505 (14.4%) | 2.82 |
| Non-family | 1,458 (41.5%) | 1.15 |
| Total Households | 3,516 (100.0%) | 2.25 |
Household Size by Marriage Status in Newton
Out of a total of 3,516 households in Newton, 2,058 (58.5%) are family households, while 1,458 (41.5%) are nonfamily households. The most numerous type of family households are 2-person households, comprising 860, and the most common type of nonfamily households are 1-person households, comprising 1,222.
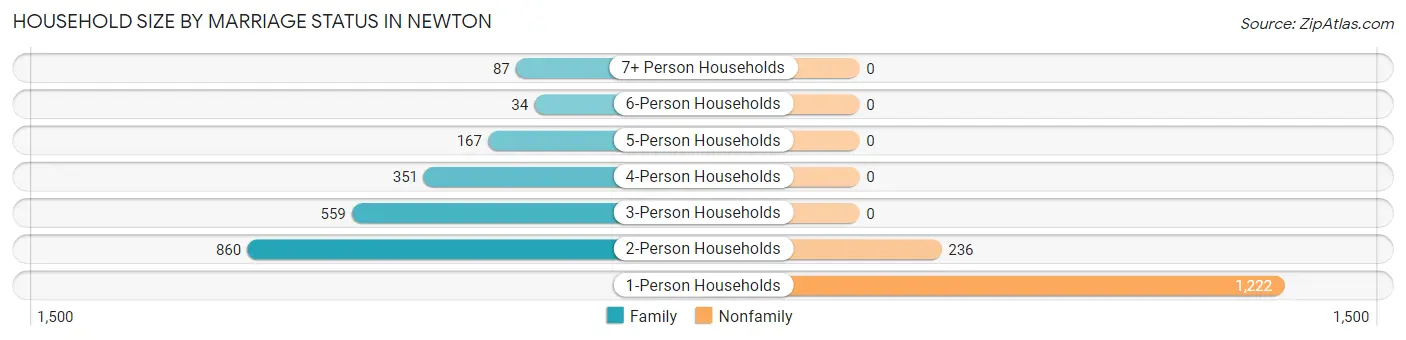
| Household Size | Family Households | Nonfamily Households |
| 1-Person Households | - | 1,222 (34.8%) |
| 2-Person Households | 860 (24.5%) | 236 (6.7%) |
| 3-Person Households | 559 (15.9%) | 0 (0.0%) |
| 4-Person Households | 351 (10.0%) | 0 (0.0%) |
| 5-Person Households | 167 (4.8%) | 0 (0.0%) |
| 6-Person Households | 34 (1.0%) | 0 (0.0%) |
| 7+ Person Households | 87 (2.5%) | 0 (0.0%) |
| Total | 2,058 (58.5%) | 1,458 (41.5%) |
Female Fertility in Newton
Fertility by Age in Newton
Average fertility rate in Newton is 33.0 births per 1,000 women. Women in the age bracket of 20 to 34 years have the highest fertility rate with 65.0 births per 1,000 women. Women in the age bracket of 20 to 34 years acount for 84.9% of all women with births.
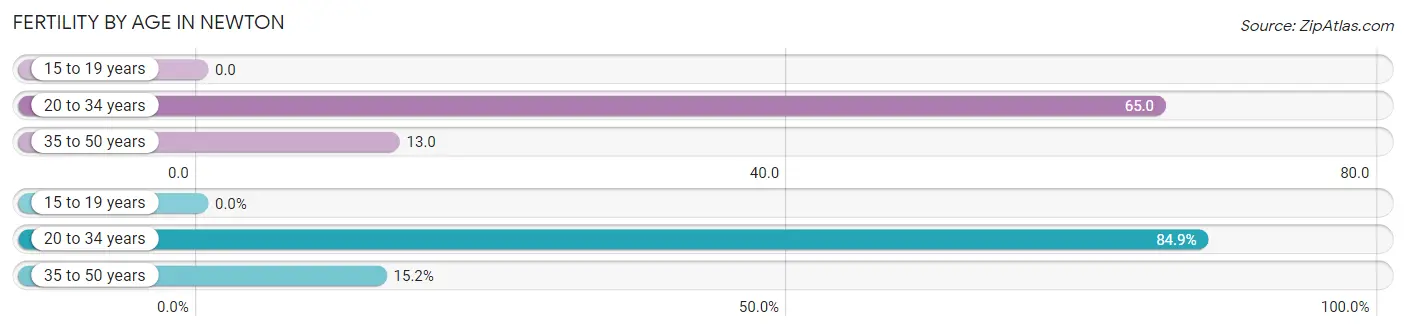
| Age Bracket | Women with Births | Births / 1,000 Women |
| 15 to 19 years | 0 (0.0%) | 0.0 |
| 20 to 34 years | 56 (84.9%) | 65.0 |
| 35 to 50 years | 10 (15.1%) | 13.0 |
| Total | 66 (100.0%) | 33.0 |
Fertility by Age by Marriage Status in Newton
37.9% of women with births (66) in Newton are married. The highest percentage of unmarried women with births falls into 35 to 50 years age bracket with 100.0% of them unmarried at the time of birth, while the lowest percentage of unmarried women with births belong to 20 to 34 years age bracket with 55.4% of them unmarried.
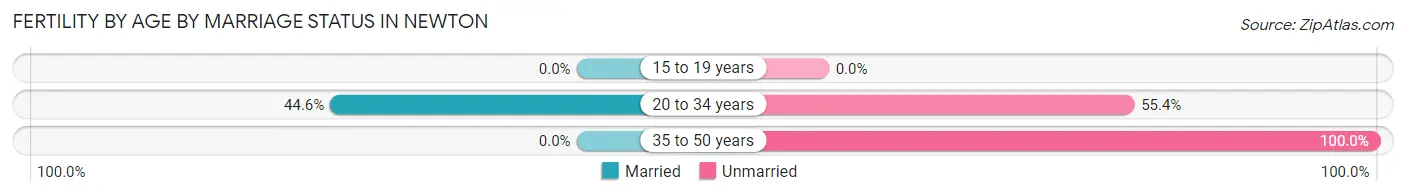
| Age Bracket | Married | Unmarried |
| 15 to 19 years | 0 (0.0%) | 0 (0.0%) |
| 20 to 34 years | 25 (44.6%) | 31 (55.4%) |
| 35 to 50 years | 0 (0.0%) | 10 (100.0%) |
| Total | 25 (37.9%) | 41 (62.1%) |
Fertility by Education in Newton
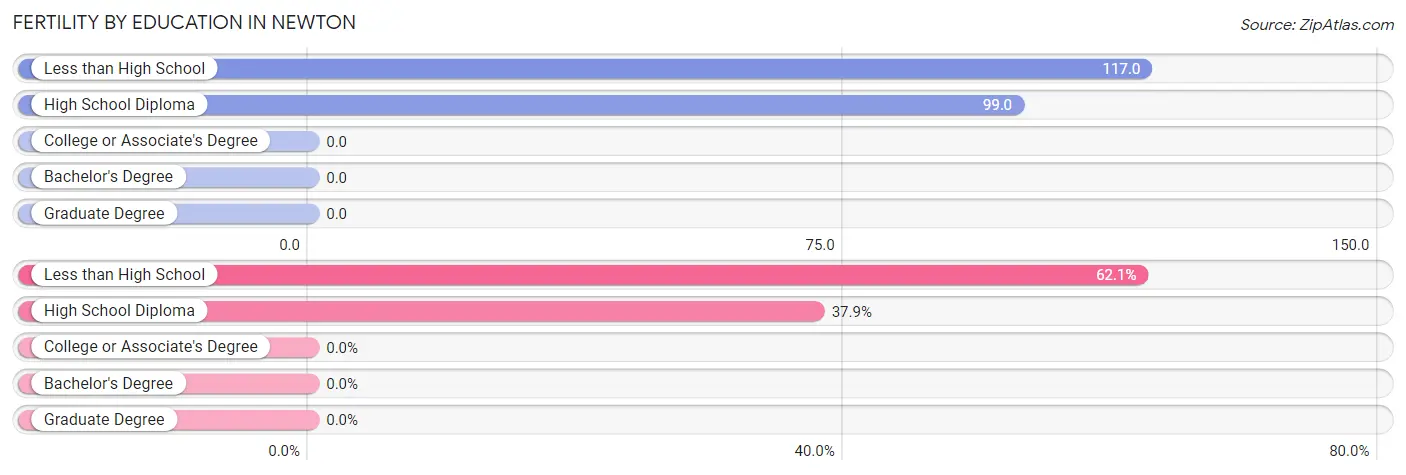
| Educational Attainment | Women with Births | Births / 1,000 Women |
| Less than High School | 41 (62.1%) | 117.0 |
| High School Diploma | 25 (37.9%) | 99.0 |
| College or Associate's Degree | 0 (0.0%) | 0.0 |
| Bachelor's Degree | 0 (0.0%) | 0.0 |
| Graduate Degree | 0 (0.0%) | 0.0 |
| Total | 66 (100.0%) | 33.0 |
Fertility by Education by Marriage Status in Newton
62.1% of women with births in Newton are unmarried. Women with the educational attainment of high school diploma are most likely to be married with 100.0% of them married at childbirth, while women with the educational attainment of less than high school are least likely to be married with 100.0% of them unmarried at childbirth.
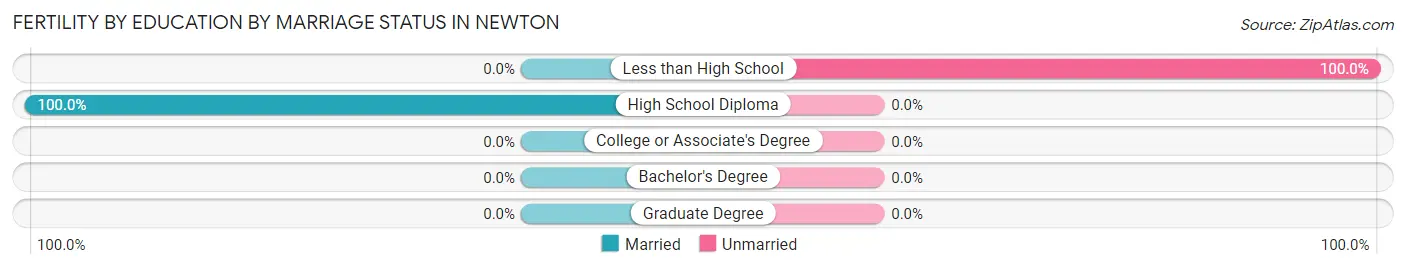
| Educational Attainment | Married | Unmarried |
| Less than High School | 0 (0.0%) | 41 (100.0%) |
| High School Diploma | 25 (100.0%) | 0 (0.0%) |
| College or Associate's Degree | 0 (0.0%) | 0 (0.0%) |
| Bachelor's Degree | 0 (0.0%) | 0 (0.0%) |
| Graduate Degree | 0 (0.0%) | 0 (0.0%) |
| Total | 25 (37.9%) | 41 (62.1%) |
Employment Characteristics in Newton
Employment by Class of Employer in Newton
Among the 4,069 employed individuals in Newton, private company employees (2,888 | 71.0%), local government employees (365 | 9.0%), and not-for-profit organizations (330 | 8.1%) make up the most common classes of employment.
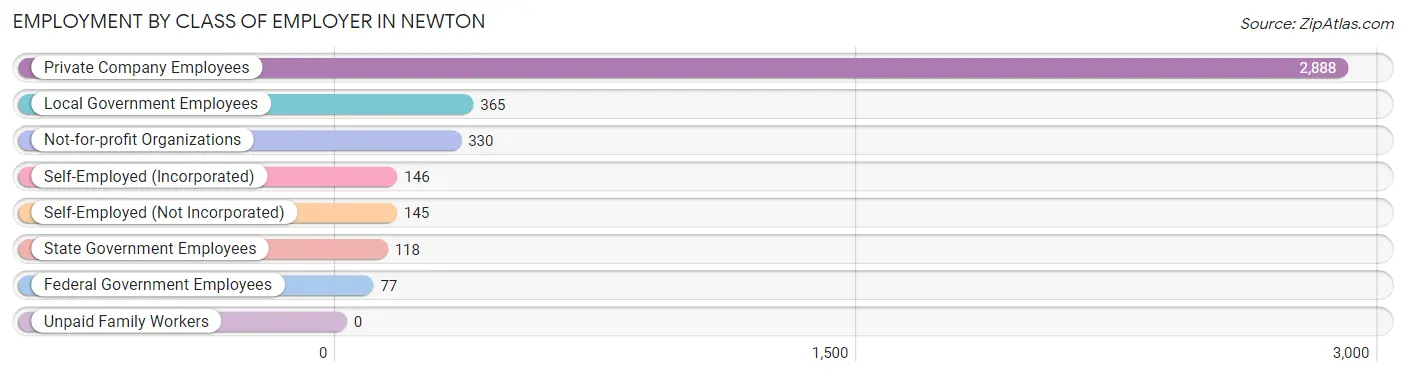
| Employer Class | # Employees | % Employees |
| Private Company Employees | 2,888 | 71.0% |
| Self-Employed (Incorporated) | 146 | 3.6% |
| Self-Employed (Not Incorporated) | 145 | 3.6% |
| Not-for-profit Organizations | 330 | 8.1% |
| Local Government Employees | 365 | 9.0% |
| State Government Employees | 118 | 2.9% |
| Federal Government Employees | 77 | 1.9% |
| Unpaid Family Workers | 0 | 0.0% |
| Total | 4,069 | 100.0% |
Employment Status by Age in Newton
According to the labor force statistics for Newton, out of the total population over 16 years of age (7,148), 63.0% or 4,503 individuals are in the labor force, with 7.6% or 342 of them unemployed. The age group with the highest labor force participation rate is 45 to 54 years, with 87.1% or 1,212 individuals in the labor force. Within the labor force, the 25 to 29 years age range has the highest percentage of unemployed individuals, with 34.5% or 203 of them being unemployed.
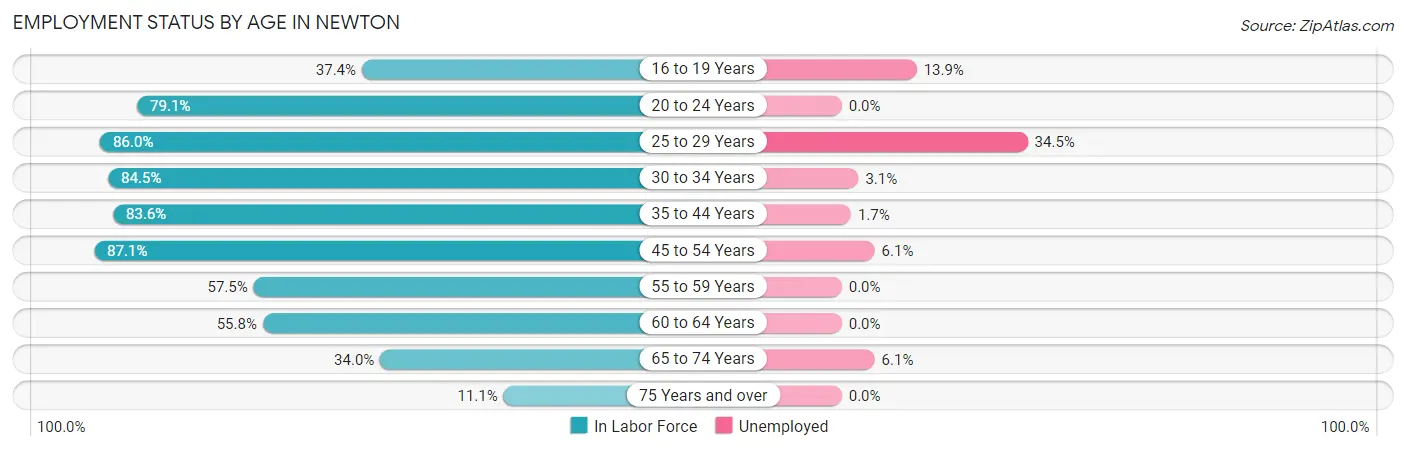
| Age Bracket | In Labor Force | Unemployed |
| 16 to 19 Years | 144 (37.4%) | 20 (13.9%) |
| 20 to 24 Years | 383 (79.1%) | 0 (0.0%) |
| 25 to 29 Years | 588 (86.0%) | 203 (34.5%) |
| 30 to 34 Years | 446 (84.5%) | 14 (3.1%) |
| 35 to 44 Years | 803 (83.6%) | 14 (1.7%) |
| 45 to 54 Years | 1,212 (87.1%) | 74 (6.1%) |
| 55 to 59 Years | 222 (57.5%) | 0 (0.0%) |
| 60 to 64 Years | 311 (55.8%) | 0 (0.0%) |
| 65 to 74 Years | 296 (34.0%) | 18 (6.1%) |
| 75 Years and over | 100 (11.1%) | 0 (0.0%) |
| Total | 4,503 (63.0%) | 342 (7.6%) |
Employment Status by Educational Attainment in Newton
According to labor force statistics for Newton, 79.5% of individuals (3,583) out of the total population between 25 and 64 years of age (4,507) are in the labor force, with 8.5% or 305 of them being unemployed. The group with the highest labor force participation rate are those with the educational attainment of bachelor's degree or higher, with 90.8% or 1,107 individuals in the labor force. Within the labor force, individuals with less than high school education have the highest percentage of unemployment, with 28.9% or 44 of them being unemployed.
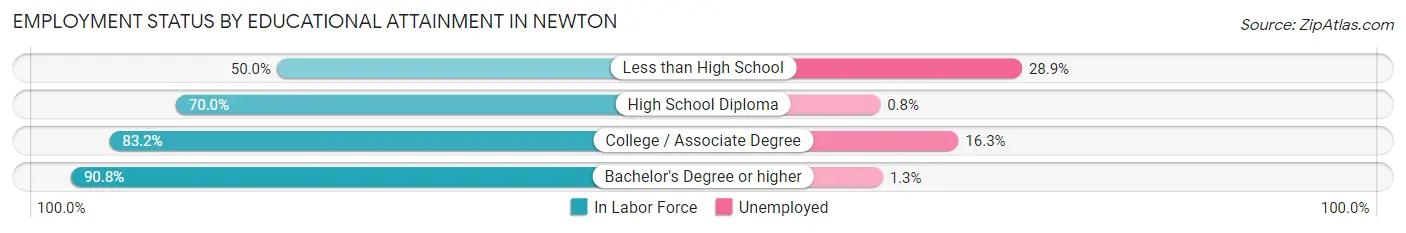
| Educational Attainment | In Labor Force | Unemployed |
| Less than High School | 152 (50.0%) | 88 (28.9%) |
| High School Diploma | 849 (70.0%) | 10 (0.8%) |
| College / Associate Degree | 1,473 (83.2%) | 289 (16.3%) |
| Bachelor's Degree or higher | 1,107 (90.8%) | 16 (1.3%) |
| Total | 3,583 (79.5%) | 383 (8.5%) |
Employment Occupations by Sex in Newton
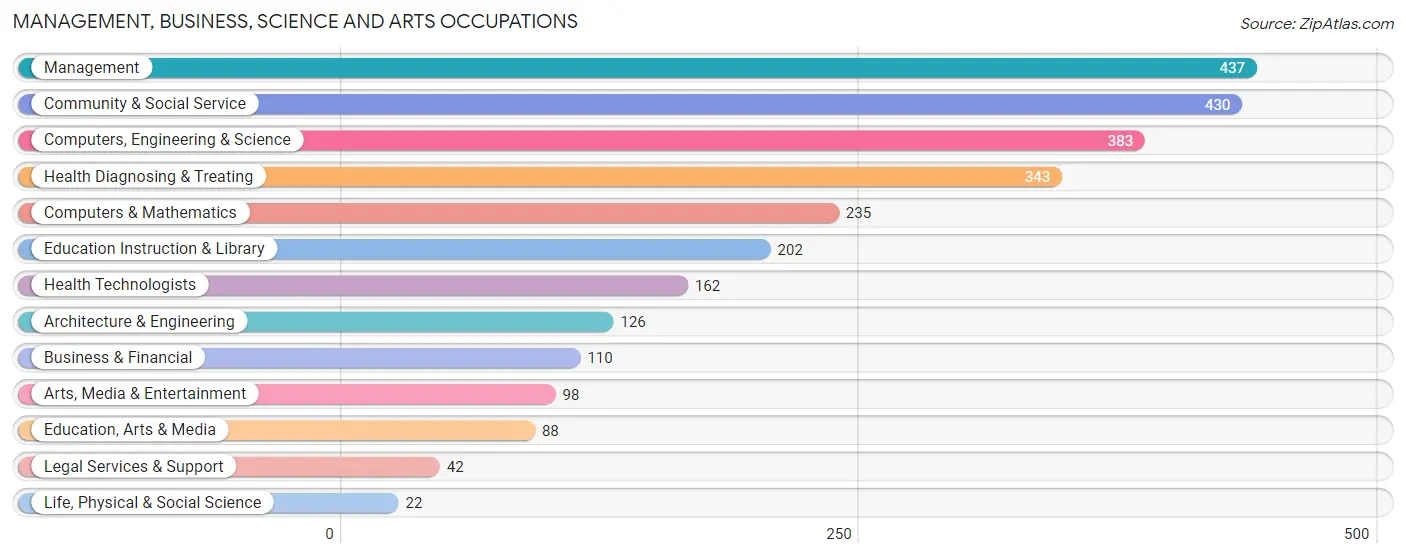
Management, Business, Science and Arts Occupations
The most common Management, Business, Science and Arts occupations in Newton are Management (437 | 10.5%), Community & Social Service (430 | 10.3%), Computers, Engineering & Science (383 | 9.2%), Health Diagnosing & Treating (343 | 8.2%), and Computers & Mathematics (235 | 5.7%).
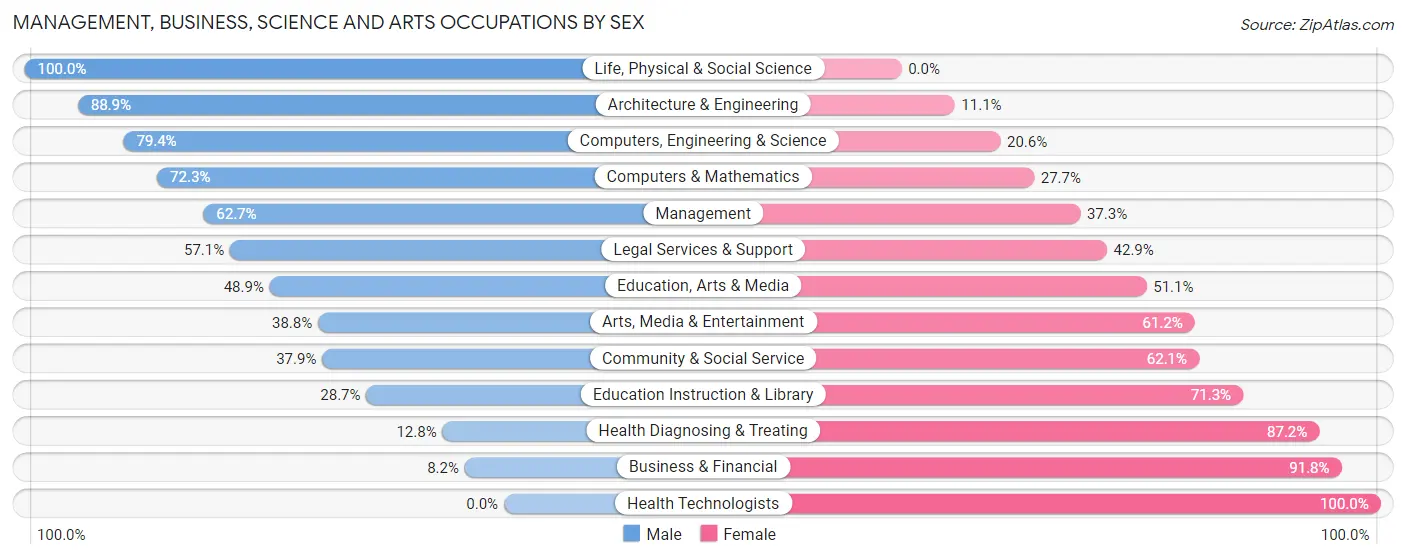
Management, Business, Science and Arts Occupations by Sex
Within the Management, Business, Science and Arts occupations in Newton, the most male-oriented occupations are Life, Physical & Social Science (100.0%), Architecture & Engineering (88.9%), and Computers, Engineering & Science (79.4%), while the most female-oriented occupations are Health Technologists (100.0%), Business & Financial (91.8%), and Health Diagnosing & Treating (87.2%).
| Occupation | Male | Female |
| Management | 274 (62.7%) | 163 (37.3%) |
| Business & Financial | 9 (8.2%) | 101 (91.8%) |
| Computers, Engineering & Science | 304 (79.4%) | 79 (20.6%) |
| Computers & Mathematics | 170 (72.3%) | 65 (27.7%) |
| Architecture & Engineering | 112 (88.9%) | 14 (11.1%) |
| Life, Physical & Social Science | 22 (100.0%) | 0 (0.0%) |
| Community & Social Service | 163 (37.9%) | 267 (62.1%) |
| Education, Arts & Media | 43 (48.9%) | 45 (51.1%) |
| Legal Services & Support | 24 (57.1%) | 18 (42.9%) |
| Education Instruction & Library | 58 (28.7%) | 144 (71.3%) |
| Arts, Media & Entertainment | 38 (38.8%) | 60 (61.2%) |
| Health Diagnosing & Treating | 44 (12.8%) | 299 (87.2%) |
| Health Technologists | 0 (0.0%) | 162 (100.0%) |
| Total (Category) | 794 (46.6%) | 909 (53.4%) |
| Total (Overall) | 2,029 (48.7%) | 2,133 (51.2%) |
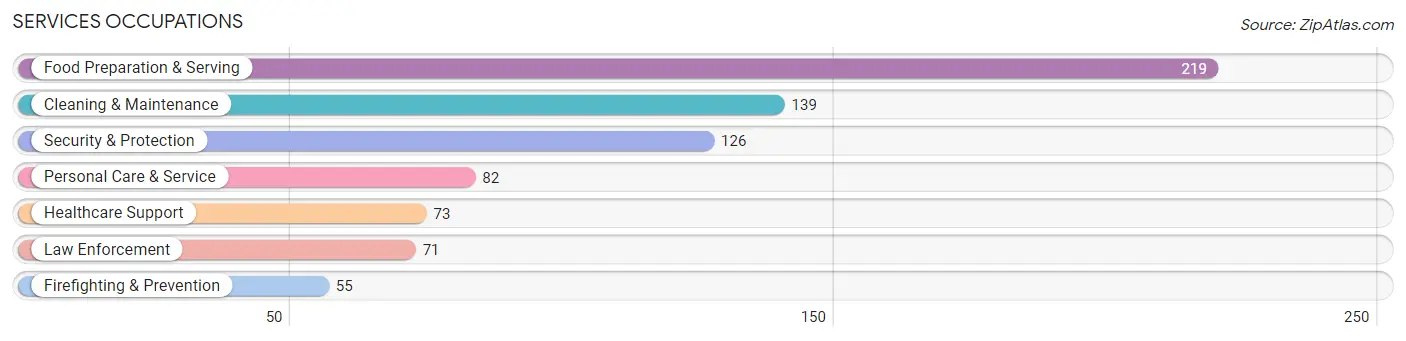
Services Occupations
The most common Services occupations in Newton are Food Preparation & Serving (219 | 5.3%), Cleaning & Maintenance (139 | 3.3%), Security & Protection (126 | 3.0%), Personal Care & Service (82 | 2.0%), and Healthcare Support (73 | 1.8%).
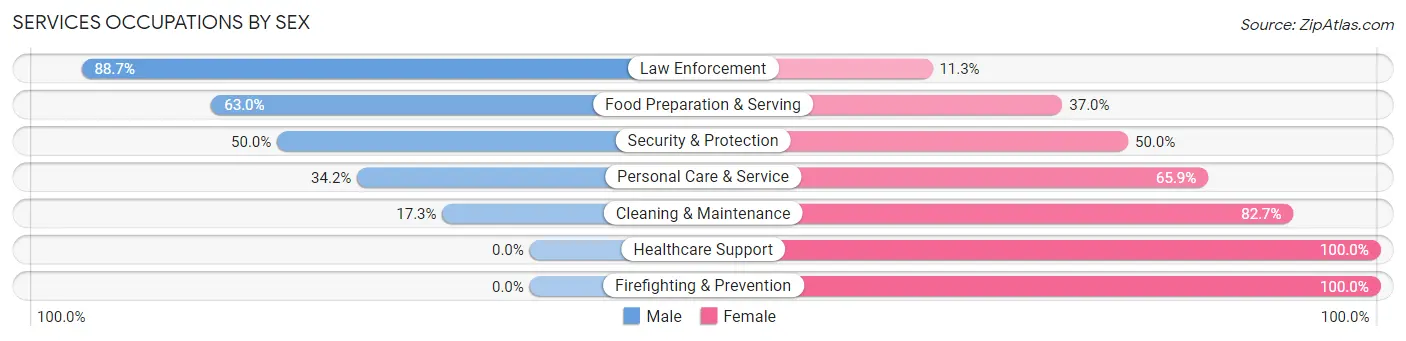
Services Occupations by Sex
Within the Services occupations in Newton, the most male-oriented occupations are Law Enforcement (88.7%), Food Preparation & Serving (63.0%), and Security & Protection (50.0%), while the most female-oriented occupations are Healthcare Support (100.0%), Firefighting & Prevention (100.0%), and Cleaning & Maintenance (82.7%).
| Occupation | Male | Female |
| Healthcare Support | 0 (0.0%) | 73 (100.0%) |
| Security & Protection | 63 (50.0%) | 63 (50.0%) |
| Firefighting & Prevention | 0 (0.0%) | 55 (100.0%) |
| Law Enforcement | 63 (88.7%) | 8 (11.3%) |
| Food Preparation & Serving | 138 (63.0%) | 81 (37.0%) |
| Cleaning & Maintenance | 24 (17.3%) | 115 (82.7%) |
| Personal Care & Service | 28 (34.2%) | 54 (65.8%) |
| Total (Category) | 253 (39.6%) | 386 (60.4%) |
| Total (Overall) | 2,029 (48.7%) | 2,133 (51.2%) |
Sales and Office Occupations
The most common Sales and Office occupations in Newton are Sales & Related (560 | 13.5%), and Office & Administration (521 | 12.5%).
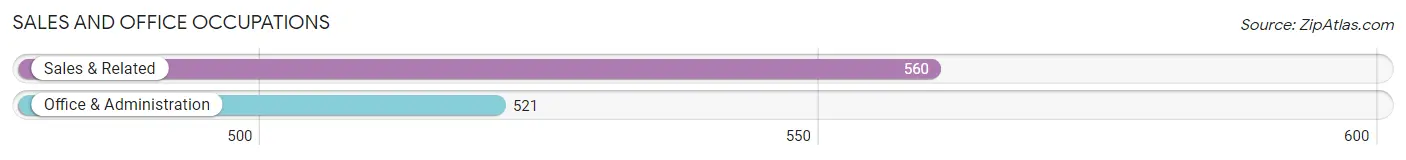
Sales and Office Occupations by Sex
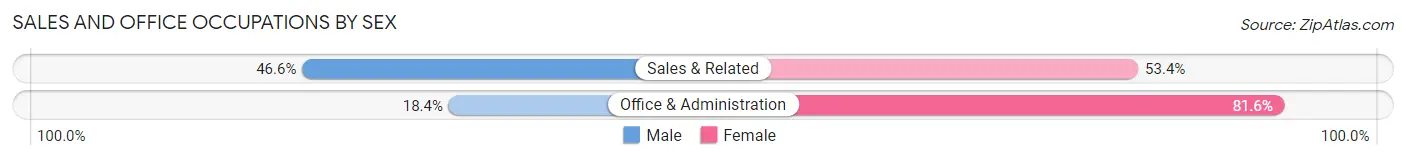
| Occupation | Male | Female |
| Sales & Related | 261 (46.6%) | 299 (53.4%) |
| Office & Administration | 96 (18.4%) | 425 (81.6%) |
| Total (Category) | 357 (33.0%) | 724 (67.0%) |
| Total (Overall) | 2,029 (48.7%) | 2,133 (51.2%) |
Natural Resources, Construction and Maintenance Occupations
The most common Natural Resources, Construction and Maintenance occupations in Newton are Construction & Extraction (217 | 5.2%), and Installation, Maintenance & Repair (144 | 3.5%).
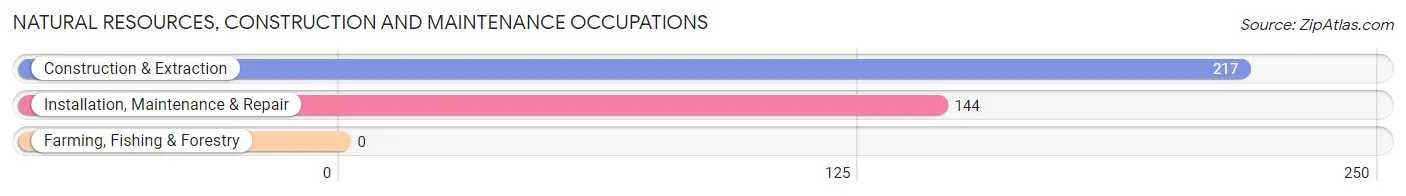
Natural Resources, Construction and Maintenance Occupations by Sex
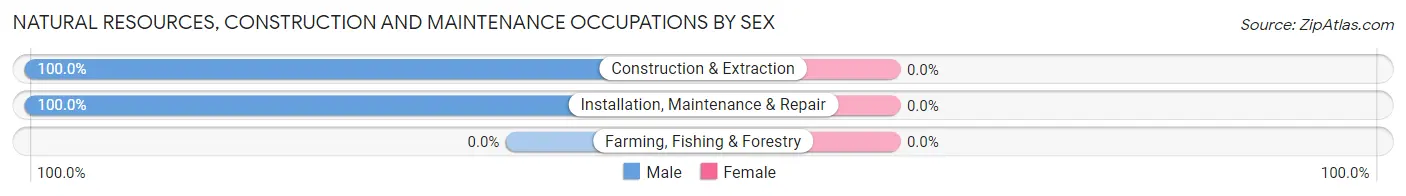
| Occupation | Male | Female |
| Farming, Fishing & Forestry | 0 (0.0%) | 0 (0.0%) |
| Construction & Extraction | 217 (100.0%) | 0 (0.0%) |
| Installation, Maintenance & Repair | 144 (100.0%) | 0 (0.0%) |
| Total (Category) | 361 (100.0%) | 0 (0.0%) |
| Total (Overall) | 2,029 (48.7%) | 2,133 (51.2%) |
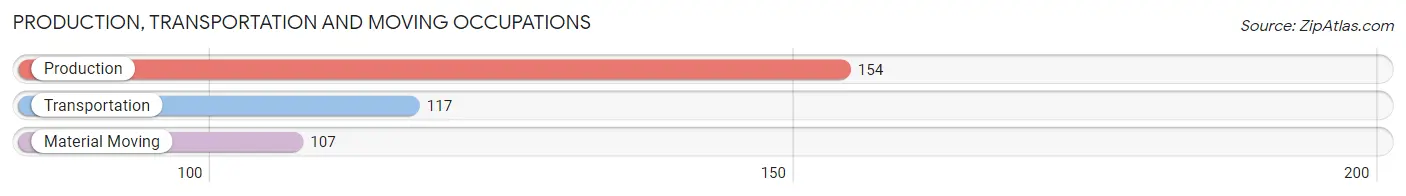
Production, Transportation and Moving Occupations
The most common Production, Transportation and Moving occupations in Newton are Production (154 | 3.7%), Transportation (117 | 2.8%), and Material Moving (107 | 2.6%).
Production, Transportation and Moving Occupations by Sex
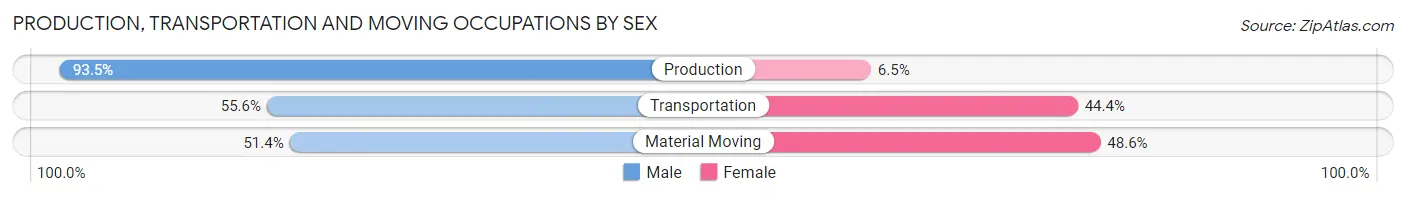
| Occupation | Male | Female |
| Production | 144 (93.5%) | 10 (6.5%) |
| Transportation | 65 (55.6%) | 52 (44.4%) |
| Material Moving | 55 (51.4%) | 52 (48.6%) |
| Total (Category) | 264 (69.8%) | 114 (30.2%) |
| Total (Overall) | 2,029 (48.7%) | 2,133 (51.2%) |
Employment Industries by Sex in Newton
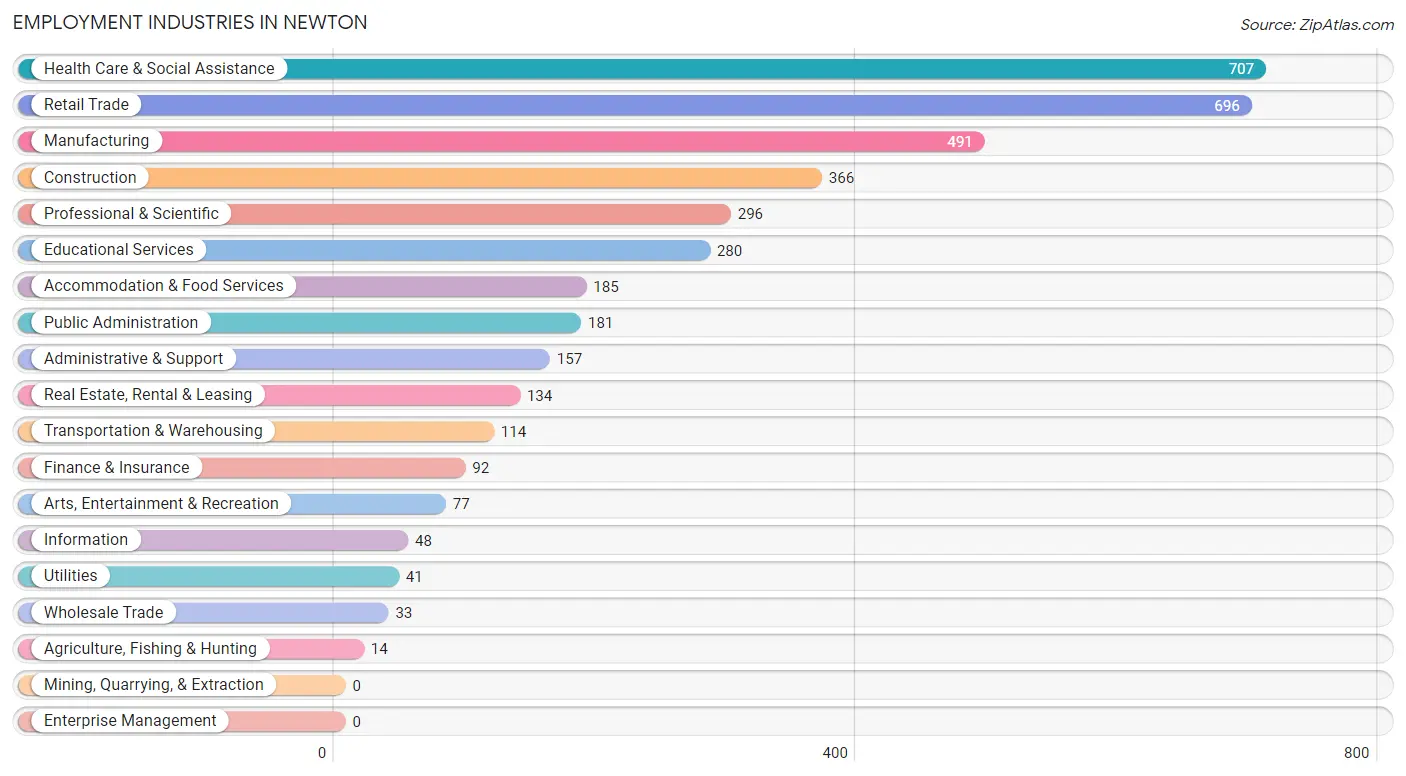
Employment Industries in Newton
The major employment industries in Newton include Health Care & Social Assistance (707 | 17.0%), Retail Trade (696 | 16.7%), Manufacturing (491 | 11.8%), Construction (366 | 8.8%), and Professional & Scientific (296 | 7.1%).
Employment Industries by Sex in Newton
The Newton industries that see more men than women are Agriculture, Fishing & Hunting (100.0%), Utilities (100.0%), and Construction (93.2%), whereas the industries that tend to have a higher number of women are Health Care & Social Assistance (93.1%), Educational Services (75.0%), and Information (56.2%).
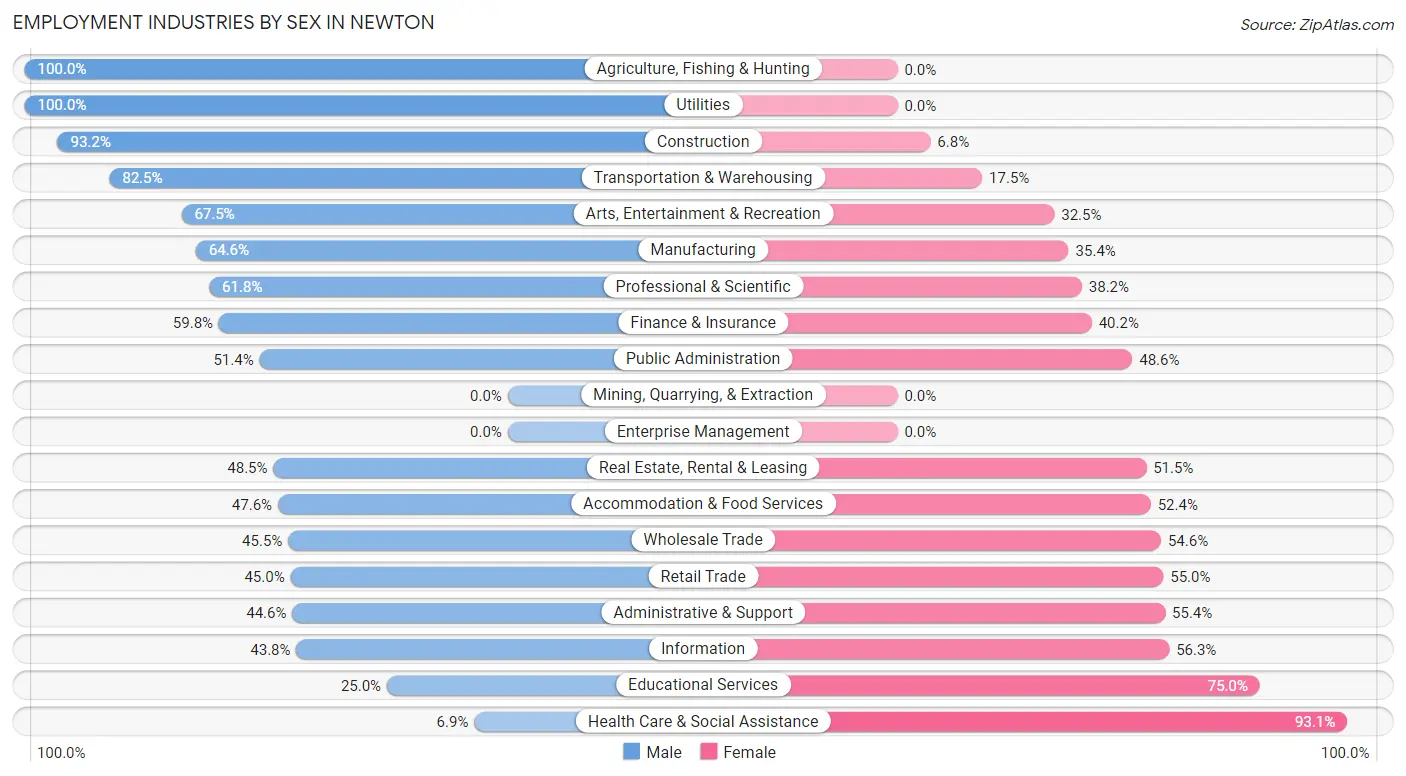
| Industry | Male | Female |
| Agriculture, Fishing & Hunting | 14 (100.0%) | 0 (0.0%) |
| Mining, Quarrying, & Extraction | 0 (0.0%) | 0 (0.0%) |
| Construction | 341 (93.2%) | 25 (6.8%) |
| Manufacturing | 317 (64.6%) | 174 (35.4%) |
| Wholesale Trade | 15 (45.5%) | 18 (54.5%) |
| Retail Trade | 313 (45.0%) | 383 (55.0%) |
| Transportation & Warehousing | 94 (82.5%) | 20 (17.5%) |
| Utilities | 41 (100.0%) | 0 (0.0%) |
| Information | 21 (43.8%) | 27 (56.2%) |
| Finance & Insurance | 55 (59.8%) | 37 (40.2%) |
| Real Estate, Rental & Leasing | 65 (48.5%) | 69 (51.5%) |
| Professional & Scientific | 183 (61.8%) | 113 (38.2%) |
| Enterprise Management | 0 (0.0%) | 0 (0.0%) |
| Administrative & Support | 70 (44.6%) | 87 (55.4%) |
| Educational Services | 70 (25.0%) | 210 (75.0%) |
| Health Care & Social Assistance | 49 (6.9%) | 658 (93.1%) |
| Arts, Entertainment & Recreation | 52 (67.5%) | 25 (32.5%) |
| Accommodation & Food Services | 88 (47.6%) | 97 (52.4%) |
| Public Administration | 93 (51.4%) | 88 (48.6%) |
| Total | 2,029 (48.7%) | 2,133 (51.2%) |
Education in Newton
School Enrollment in Newton
The most common levels of schooling among the 1,874 students in Newton are high school (544 | 29.0%), college / undergraduate (540 | 28.8%), and middle school (360 | 19.2%).
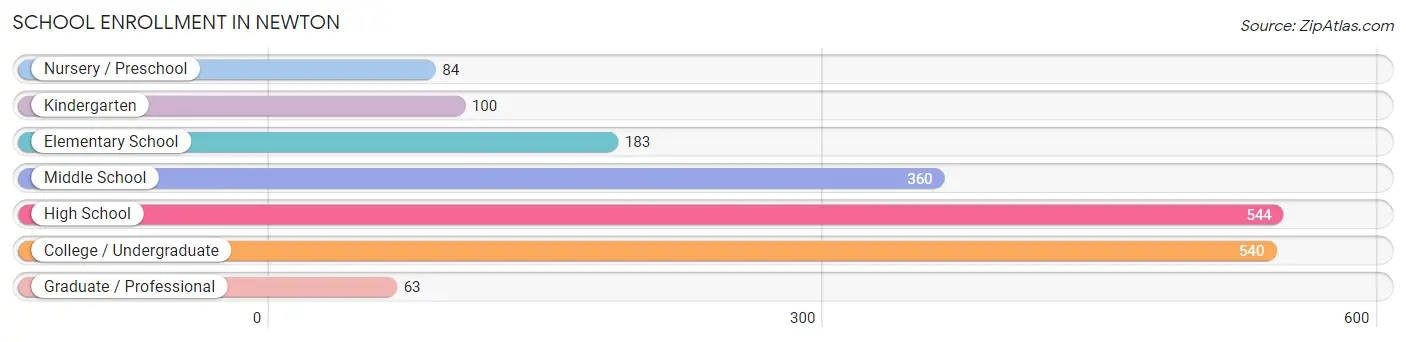
| School Level | # Students | % Students |
| Nursery / Preschool | 84 | 4.5% |
| Kindergarten | 100 | 5.3% |
| Elementary School | 183 | 9.8% |
| Middle School | 360 | 19.2% |
| High School | 544 | 29.0% |
| College / Undergraduate | 540 | 28.8% |
| Graduate / Professional | 63 | 3.4% |
| Total | 1,874 | 100.0% |
School Enrollment by Age by Funding Source in Newton
Out of a total of 1,874 students who are enrolled in schools in Newton, 245 (13.1%) attend a private institution, while the remaining 1,629 (86.9%) are enrolled in public schools. The age group of 5 to 9 year old has the highest likelihood of being enrolled in private schools, with 85 (28.4% in the age bracket) enrolled. Conversely, the age group of 3 to 4 year olds has the lowest likelihood of being enrolled in a private school, with 11 (100.0% in the age bracket) attending a public institution.
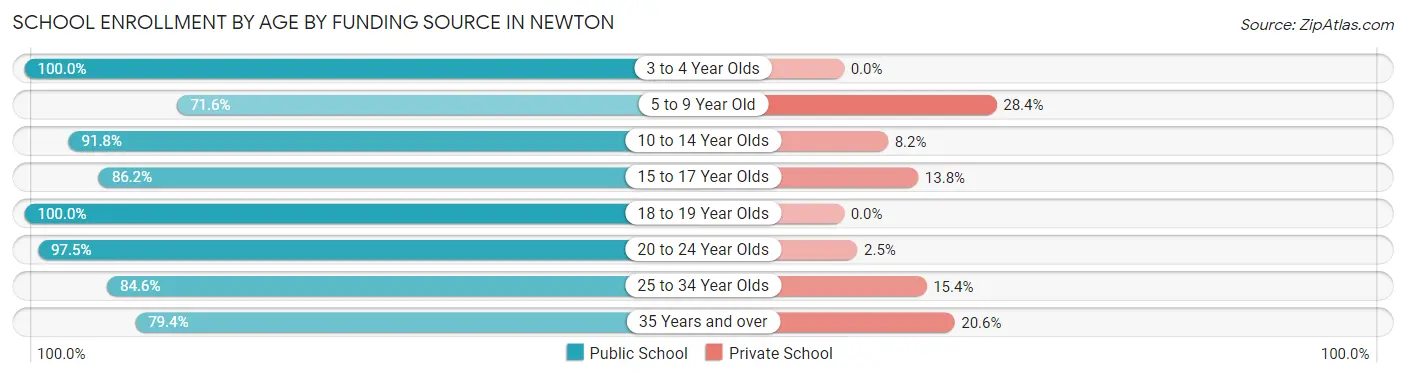
| Age Bracket | Public School | Private School |
| 3 to 4 Year Olds | 11 (100.0%) | 0 (0.0%) |
| 5 to 9 Year Old | 214 (71.6%) | 85 (28.4%) |
| 10 to 14 Year Olds | 403 (91.8%) | 36 (8.2%) |
| 15 to 17 Year Olds | 355 (86.2%) | 57 (13.8%) |
| 18 to 19 Year Olds | 99 (100.0%) | 0 (0.0%) |
| 20 to 24 Year Olds | 273 (97.5%) | 7 (2.5%) |
| 25 to 34 Year Olds | 143 (84.6%) | 26 (15.4%) |
| 35 Years and over | 131 (79.4%) | 34 (20.6%) |
| Total | 1,629 (86.9%) | 245 (13.1%) |
Educational Attainment by Field of Study in Newton
Business (337 | 18.8%), education (225 | 12.6%), science & technology (184 | 10.3%), social sciences (168 | 9.4%), and psychology (164 | 9.1%) are the most common fields of study among 1,792 individuals in Newton who have obtained a bachelor's degree or higher.
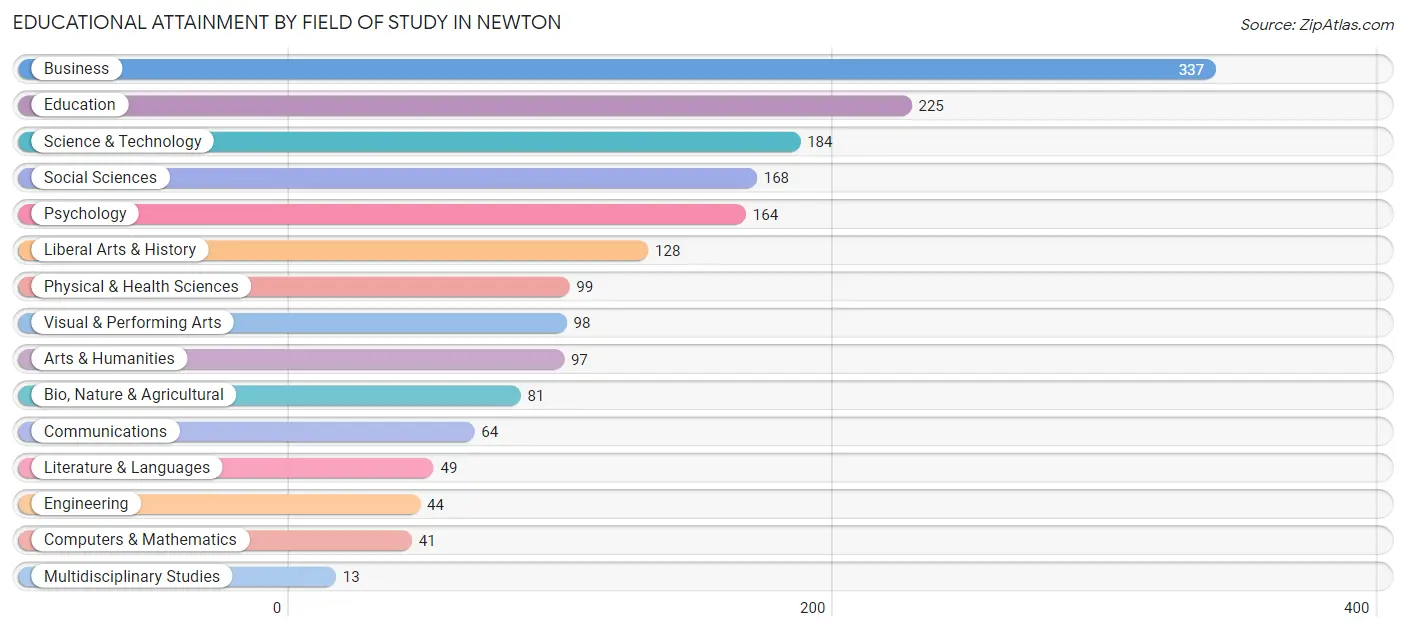
| Field of Study | # Graduates | % Graduates |
| Computers & Mathematics | 41 | 2.3% |
| Bio, Nature & Agricultural | 81 | 4.5% |
| Physical & Health Sciences | 99 | 5.5% |
| Psychology | 164 | 9.1% |
| Social Sciences | 168 | 9.4% |
| Engineering | 44 | 2.5% |
| Multidisciplinary Studies | 13 | 0.7% |
| Science & Technology | 184 | 10.3% |
| Business | 337 | 18.8% |
| Education | 225 | 12.6% |
| Literature & Languages | 49 | 2.7% |
| Liberal Arts & History | 128 | 7.1% |
| Visual & Performing Arts | 98 | 5.5% |
| Communications | 64 | 3.6% |
| Arts & Humanities | 97 | 5.4% |
| Total | 1,792 | 100.0% |
Transportation & Commute in Newton
Vehicle Availability by Sex in Newton
The most prevalent vehicle ownership categories in Newton are males with 2 vehicles (974, accounting for 48.9%) and females with 2 vehicles (711, making up 47.3%).
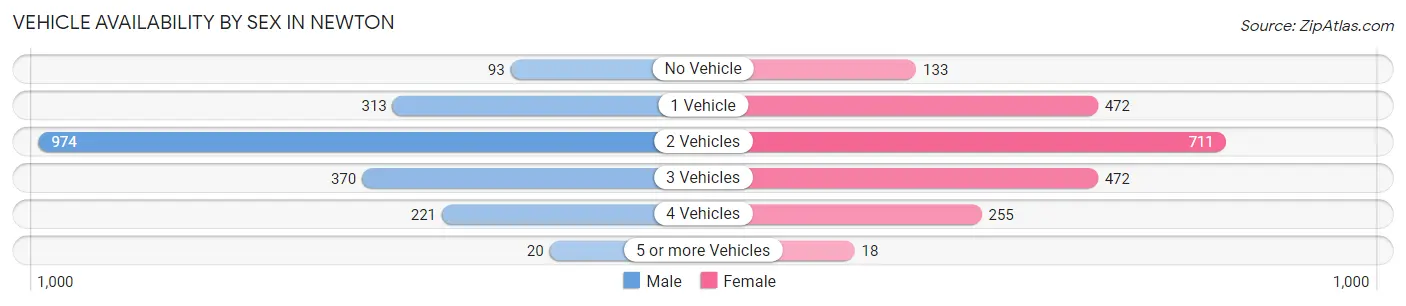
| Vehicles Available | Male | Female |
| No Vehicle | 93 (4.7%) | 133 (6.5%) |
| 1 Vehicle | 313 (15.7%) | 472 (22.9%) |
| 2 Vehicles | 974 (48.9%) | 711 (34.5%) |
| 3 Vehicles | 370 (18.6%) | 472 (22.9%) |
| 4 Vehicles | 221 (11.1%) | 255 (12.4%) |
| 5 or more Vehicles | 20 (1.0%) | 18 (0.9%) |
| Total | 1,991 (100.0%) | 2,061 (100.0%) |
Commute Time in Newton
The most frequently occuring commute durations in Newton are 5 to 9 minutes (697 commuters, 18.2%), 15 to 19 minutes (493 commuters, 12.9%), and 10 to 14 minutes (441 commuters, 11.5%).
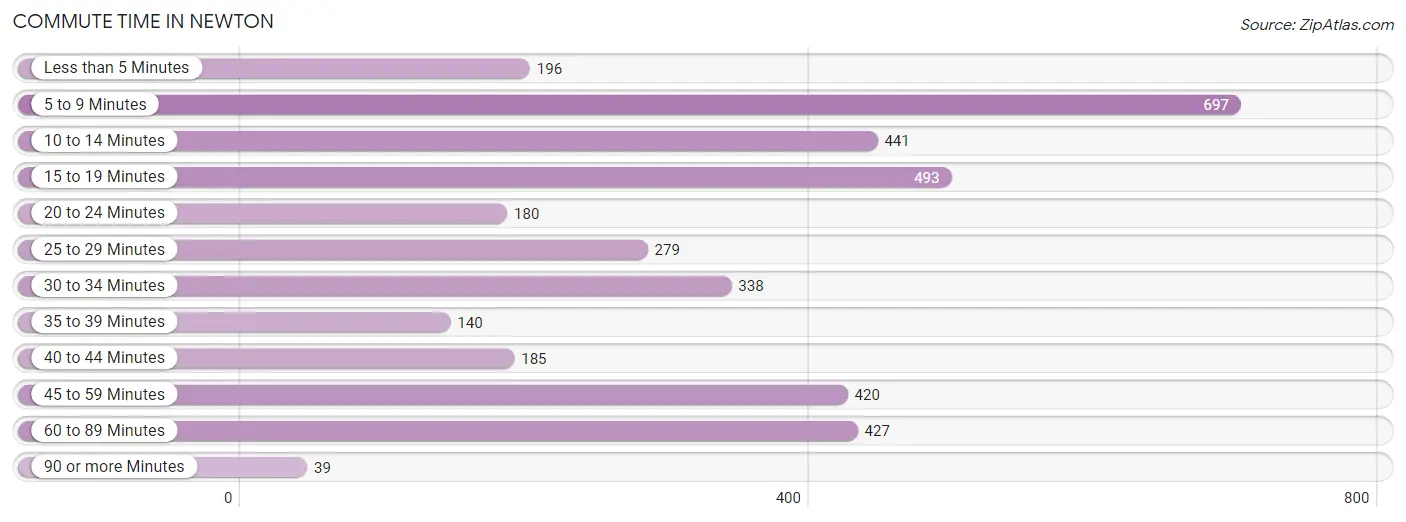
| Commute Time | # Commuters | % Commuters |
| Less than 5 Minutes | 196 | 5.1% |
| 5 to 9 Minutes | 697 | 18.2% |
| 10 to 14 Minutes | 441 | 11.5% |
| 15 to 19 Minutes | 493 | 12.9% |
| 20 to 24 Minutes | 180 | 4.7% |
| 25 to 29 Minutes | 279 | 7.3% |
| 30 to 34 Minutes | 338 | 8.8% |
| 35 to 39 Minutes | 140 | 3.6% |
| 40 to 44 Minutes | 185 | 4.8% |
| 45 to 59 Minutes | 420 | 11.0% |
| 60 to 89 Minutes | 427 | 11.1% |
| 90 or more Minutes | 39 | 1.0% |
Commute Time by Sex in Newton
The most common commute times in Newton are 60 to 89 minutes (287 commuters, 14.8%) for males and 5 to 9 minutes (531 commuters, 28.1%) for females.
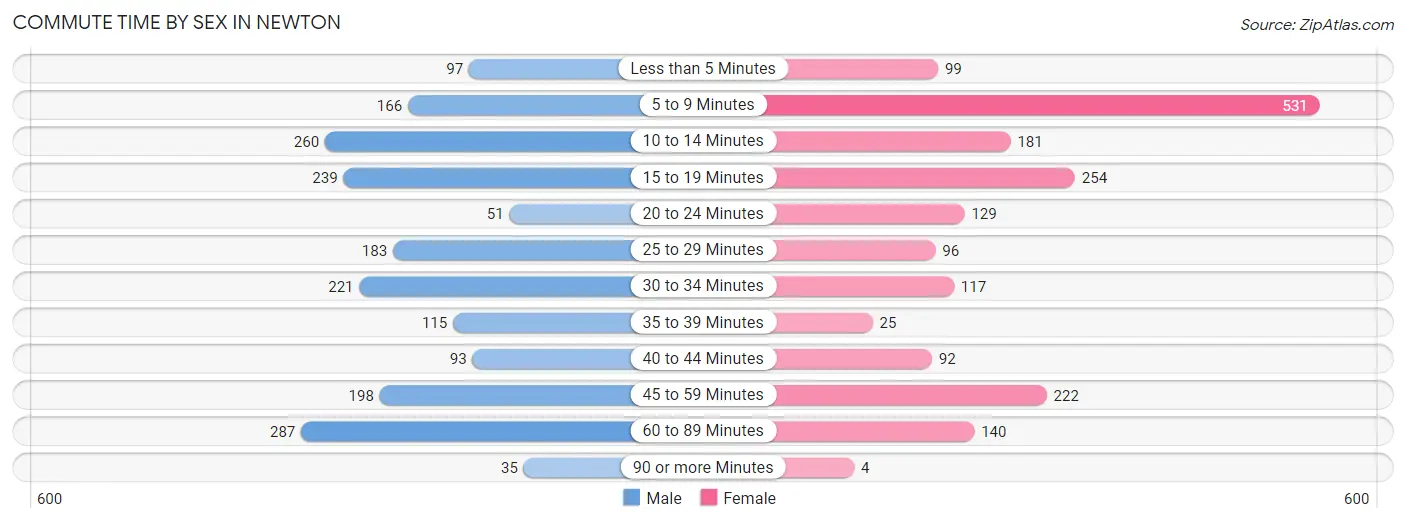
| Commute Time | Male | Female |
| Less than 5 Minutes | 97 (5.0%) | 99 (5.2%) |
| 5 to 9 Minutes | 166 (8.5%) | 531 (28.1%) |
| 10 to 14 Minutes | 260 (13.4%) | 181 (9.6%) |
| 15 to 19 Minutes | 239 (12.3%) | 254 (13.4%) |
| 20 to 24 Minutes | 51 (2.6%) | 129 (6.8%) |
| 25 to 29 Minutes | 183 (9.4%) | 96 (5.1%) |
| 30 to 34 Minutes | 221 (11.4%) | 117 (6.2%) |
| 35 to 39 Minutes | 115 (5.9%) | 25 (1.3%) |
| 40 to 44 Minutes | 93 (4.8%) | 92 (4.9%) |
| 45 to 59 Minutes | 198 (10.2%) | 222 (11.7%) |
| 60 to 89 Minutes | 287 (14.8%) | 140 (7.4%) |
| 90 or more Minutes | 35 (1.8%) | 4 (0.2%) |
Time of Departure to Work by Sex in Newton
The most frequent times of departure to work in Newton are 6:00 AM to 6:29 AM (361, 18.6%) for males and 4:00 PM to 11:59 PM (294, 15.6%) for females.
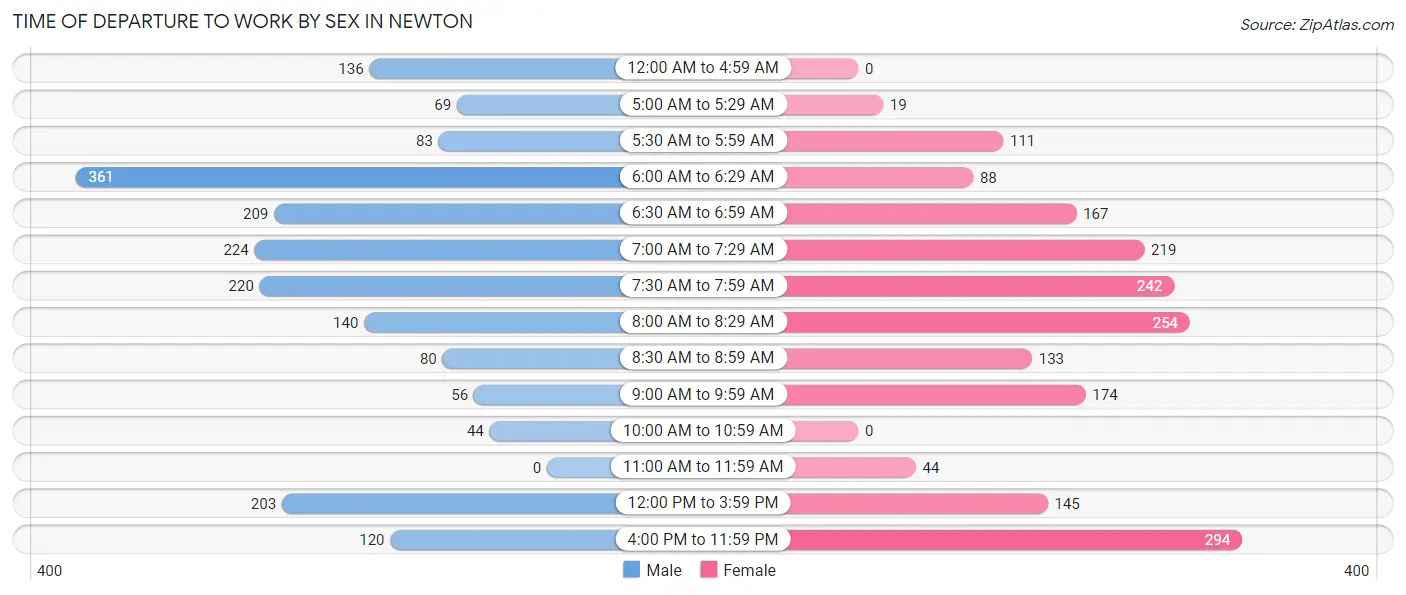
| Time of Departure | Male | Female |
| 12:00 AM to 4:59 AM | 136 (7.0%) | 0 (0.0%) |
| 5:00 AM to 5:29 AM | 69 (3.5%) | 19 (1.0%) |
| 5:30 AM to 5:59 AM | 83 (4.3%) | 111 (5.9%) |
| 6:00 AM to 6:29 AM | 361 (18.6%) | 88 (4.7%) |
| 6:30 AM to 6:59 AM | 209 (10.7%) | 167 (8.8%) |
| 7:00 AM to 7:29 AM | 224 (11.5%) | 219 (11.6%) |
| 7:30 AM to 7:59 AM | 220 (11.3%) | 242 (12.8%) |
| 8:00 AM to 8:29 AM | 140 (7.2%) | 254 (13.4%) |
| 8:30 AM to 8:59 AM | 80 (4.1%) | 133 (7.0%) |
| 9:00 AM to 9:59 AM | 56 (2.9%) | 174 (9.2%) |
| 10:00 AM to 10:59 AM | 44 (2.3%) | 0 (0.0%) |
| 11:00 AM to 11:59 AM | 0 (0.0%) | 44 (2.3%) |
| 12:00 PM to 3:59 PM | 203 (10.4%) | 145 (7.7%) |
| 4:00 PM to 11:59 PM | 120 (6.2%) | 294 (15.6%) |
| Total | 1,945 (100.0%) | 1,890 (100.0%) |
Housing Occupancy in Newton
Occupancy by Ownership in Newton
Of the total 3,516 dwellings in Newton, owner-occupied units account for 2,001 (56.9%), while renter-occupied units make up 1,515 (43.1%).
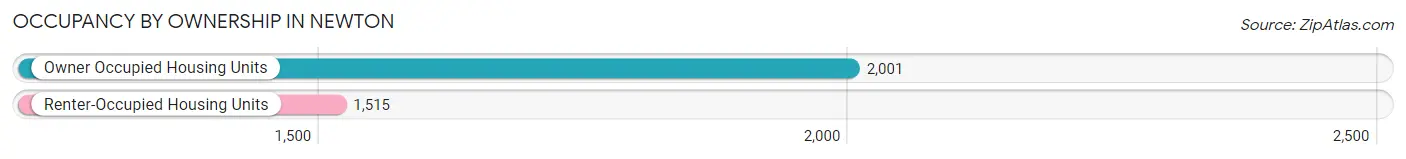
| Occupancy | # Housing Units | % Housing Units |
| Owner Occupied Housing Units | 2,001 | 56.9% |
| Renter-Occupied Housing Units | 1,515 | 43.1% |
| Total Occupied Housing Units | 3,516 | 100.0% |
Occupancy by Household Size in Newton
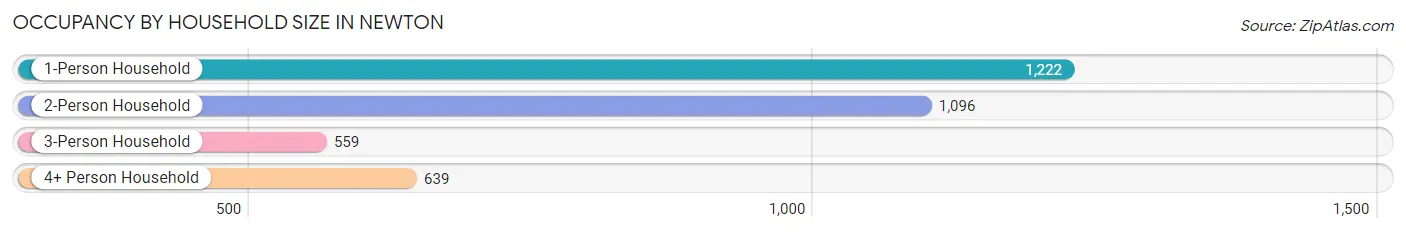
| Household Size | # Housing Units | % Housing Units |
| 1-Person Household | 1,222 | 34.8% |
| 2-Person Household | 1,096 | 31.2% |
| 3-Person Household | 559 | 15.9% |
| 4+ Person Household | 639 | 18.2% |
| Total Housing Units | 3,516 | 100.0% |
Occupancy by Ownership by Household Size in Newton
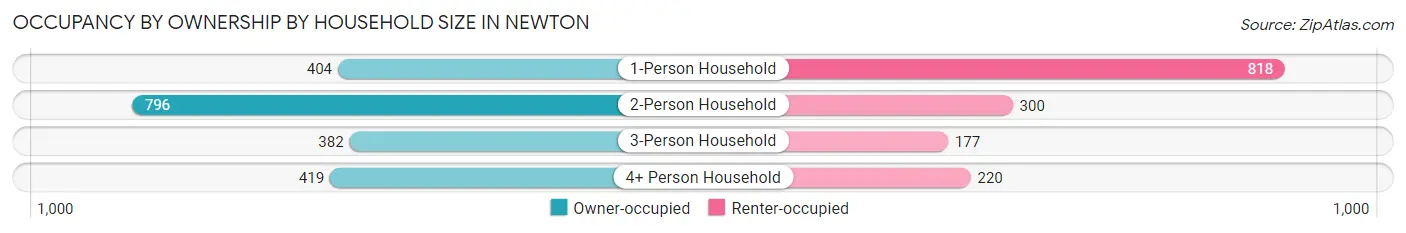
| Household Size | Owner-occupied | Renter-occupied |
| 1-Person Household | 404 (33.1%) | 818 (66.9%) |
| 2-Person Household | 796 (72.6%) | 300 (27.4%) |
| 3-Person Household | 382 (68.3%) | 177 (31.7%) |
| 4+ Person Household | 419 (65.6%) | 220 (34.4%) |
| Total Housing Units | 2,001 (56.9%) | 1,515 (43.1%) |
Occupancy by Educational Attainment in Newton
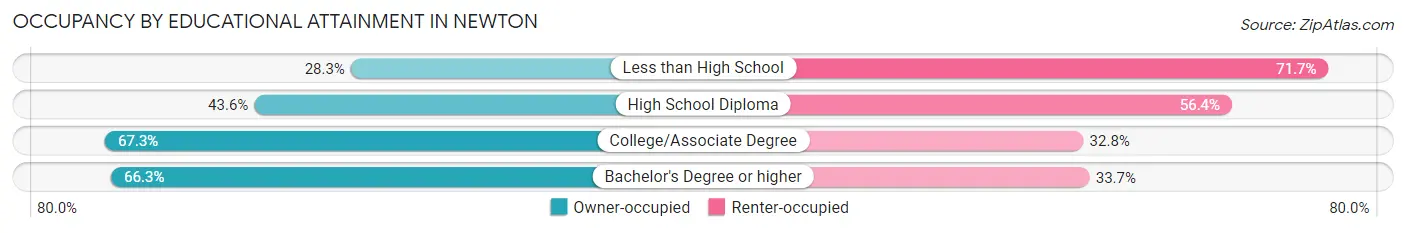
| Household Size | Owner-occupied | Renter-occupied |
| Less than High School | 69 (28.3%) | 175 (71.7%) |
| High School Diploma | 476 (43.6%) | 616 (56.4%) |
| College/Associate Degree | 772 (67.2%) | 376 (32.8%) |
| Bachelor's Degree or higher | 684 (66.3%) | 348 (33.7%) |
Occupancy by Age of Householder in Newton
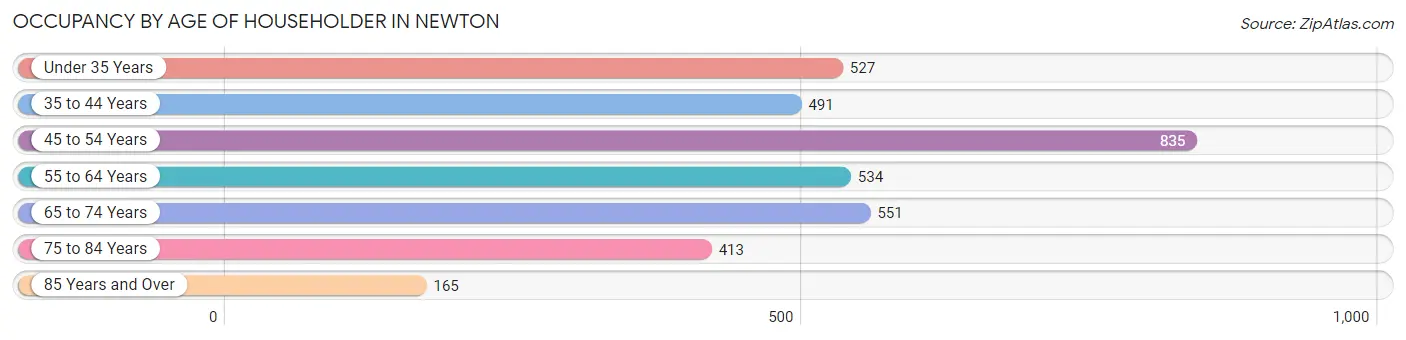
| Age Bracket | # Households | % Households |
| Under 35 Years | 527 | 15.0% |
| 35 to 44 Years | 491 | 14.0% |
| 45 to 54 Years | 835 | 23.7% |
| 55 to 64 Years | 534 | 15.2% |
| 65 to 74 Years | 551 | 15.7% |
| 75 to 84 Years | 413 | 11.7% |
| 85 Years and Over | 165 | 4.7% |
| Total | 3,516 | 100.0% |
Housing Finances in Newton
Median Income by Occupancy in Newton
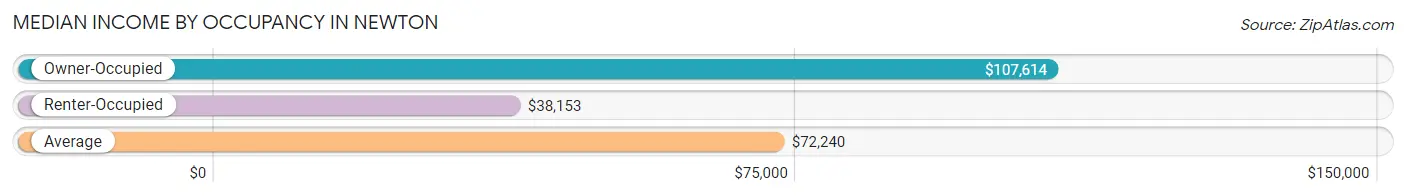
| Occupancy Type | # Households | Median Income |
| Owner-Occupied | 2,001 (56.9%) | $107,614 |
| Renter-Occupied | 1,515 (43.1%) | $38,153 |
| Average | 3,516 (100.0%) | $72,240 |
Occupancy by Householder Income Bracket in Newton
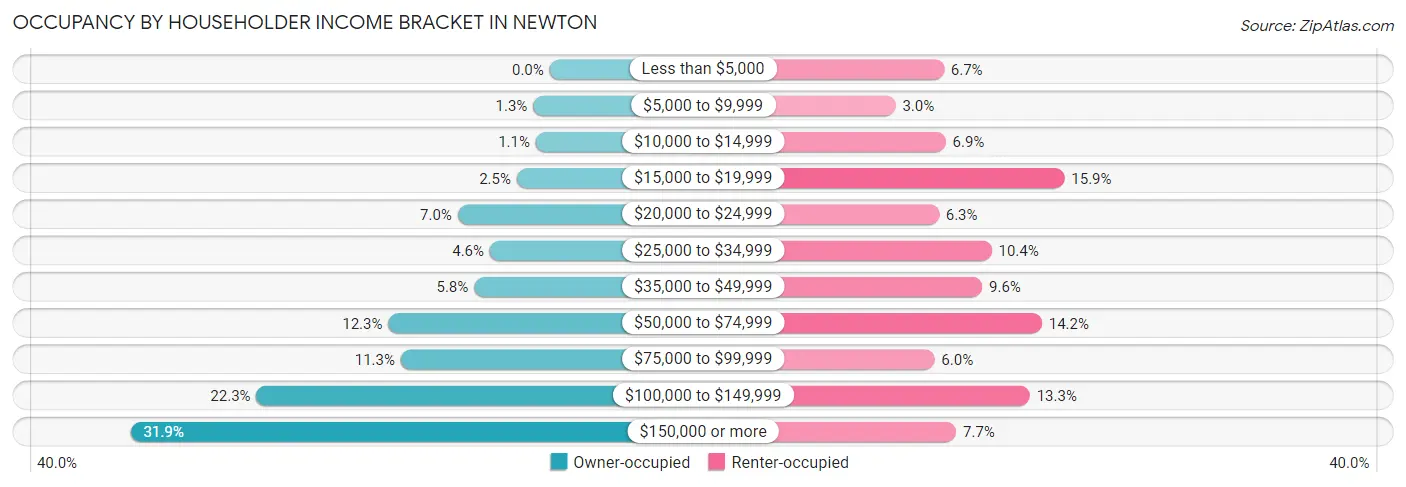
| Income Bracket | Owner-occupied | Renter-occupied |
| Less than $5,000 | 0 (0.0%) | 102 (6.7%) |
| $5,000 to $9,999 | 25 (1.3%) | 46 (3.0%) |
| $10,000 to $14,999 | 21 (1.1%) | 104 (6.9%) |
| $15,000 to $19,999 | 50 (2.5%) | 241 (15.9%) |
| $20,000 to $24,999 | 140 (7.0%) | 96 (6.3%) |
| $25,000 to $34,999 | 91 (4.5%) | 157 (10.4%) |
| $35,000 to $49,999 | 115 (5.8%) | 146 (9.6%) |
| $50,000 to $74,999 | 246 (12.3%) | 215 (14.2%) |
| $75,000 to $99,999 | 227 (11.3%) | 91 (6.0%) |
| $100,000 to $149,999 | 447 (22.3%) | 201 (13.3%) |
| $150,000 or more | 639 (31.9%) | 116 (7.7%) |
| Total | 2,001 (100.0%) | 1,515 (100.0%) |
Monthly Housing Cost Tiers in Newton
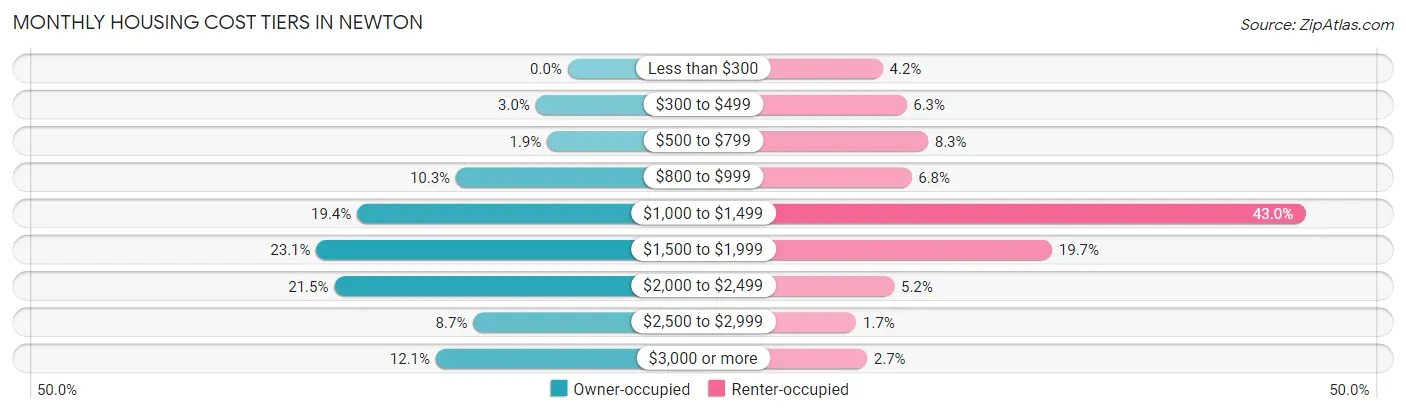
| Monthly Cost | Owner-occupied | Renter-occupied |
| Less than $300 | 0 (0.0%) | 63 (4.2%) |
| $300 to $499 | 59 (2.9%) | 96 (6.3%) |
| $500 to $799 | 38 (1.9%) | 126 (8.3%) |
| $800 to $999 | 206 (10.3%) | 103 (6.8%) |
| $1,000 to $1,499 | 388 (19.4%) | 652 (43.0%) |
| $1,500 to $1,999 | 463 (23.1%) | 299 (19.7%) |
| $2,000 to $2,499 | 430 (21.5%) | 79 (5.2%) |
| $2,500 to $2,999 | 174 (8.7%) | 26 (1.7%) |
| $3,000 or more | 243 (12.1%) | 41 (2.7%) |
| Total | 2,001 (100.0%) | 1,515 (100.0%) |
Physical Housing Characteristics in Newton
Housing Structures in Newton
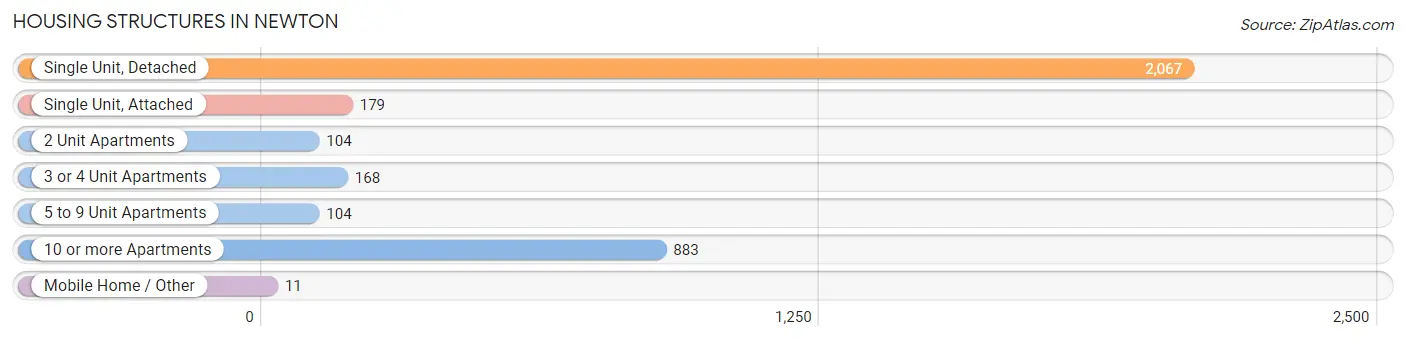
| Structure Type | # Housing Units | % Housing Units |
| Single Unit, Detached | 2,067 | 58.8% |
| Single Unit, Attached | 179 | 5.1% |
| 2 Unit Apartments | 104 | 3.0% |
| 3 or 4 Unit Apartments | 168 | 4.8% |
| 5 to 9 Unit Apartments | 104 | 3.0% |
| 10 or more Apartments | 883 | 25.1% |
| Mobile Home / Other | 11 | 0.3% |
| Total | 3,516 | 100.0% |
Housing Structures by Occupancy in Newton
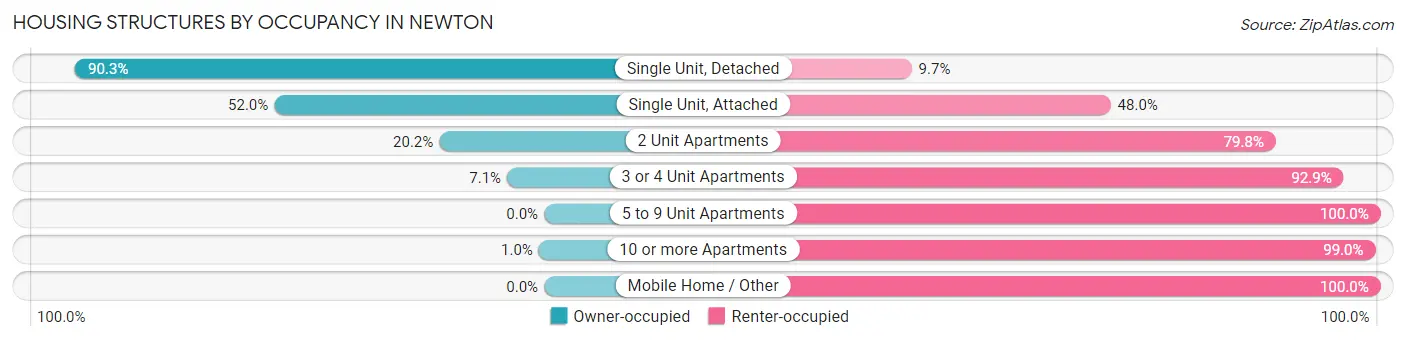
| Structure Type | Owner-occupied | Renter-occupied |
| Single Unit, Detached | 1,866 (90.3%) | 201 (9.7%) |
| Single Unit, Attached | 93 (52.0%) | 86 (48.0%) |
| 2 Unit Apartments | 21 (20.2%) | 83 (79.8%) |
| 3 or 4 Unit Apartments | 12 (7.1%) | 156 (92.9%) |
| 5 to 9 Unit Apartments | 0 (0.0%) | 104 (100.0%) |
| 10 or more Apartments | 9 (1.0%) | 874 (99.0%) |
| Mobile Home / Other | 0 (0.0%) | 11 (100.0%) |
| Total | 2,001 (56.9%) | 1,515 (43.1%) |
Housing Structures by Number of Rooms in Newton
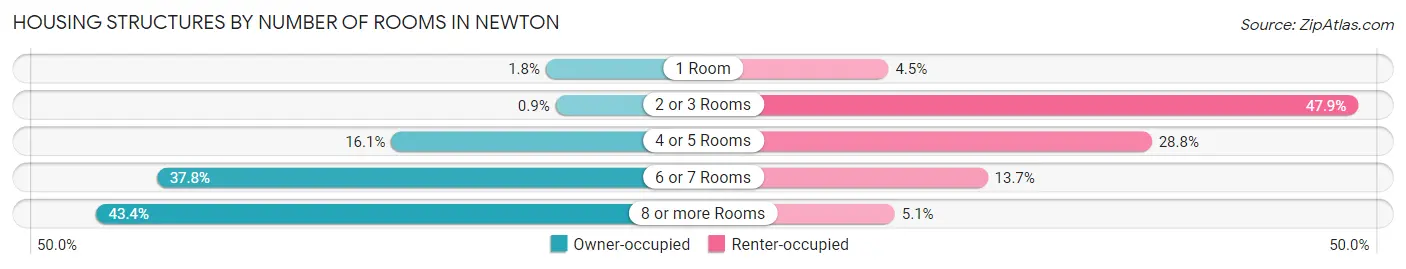
| Number of Rooms | Owner-occupied | Renter-occupied |
| 1 Room | 36 (1.8%) | 68 (4.5%) |
| 2 or 3 Rooms | 18 (0.9%) | 726 (47.9%) |
| 4 or 5 Rooms | 322 (16.1%) | 437 (28.8%) |
| 6 or 7 Rooms | 756 (37.8%) | 207 (13.7%) |
| 8 or more Rooms | 869 (43.4%) | 77 (5.1%) |
| Total | 2,001 (100.0%) | 1,515 (100.0%) |
Housing Structure by Heating Type in Newton
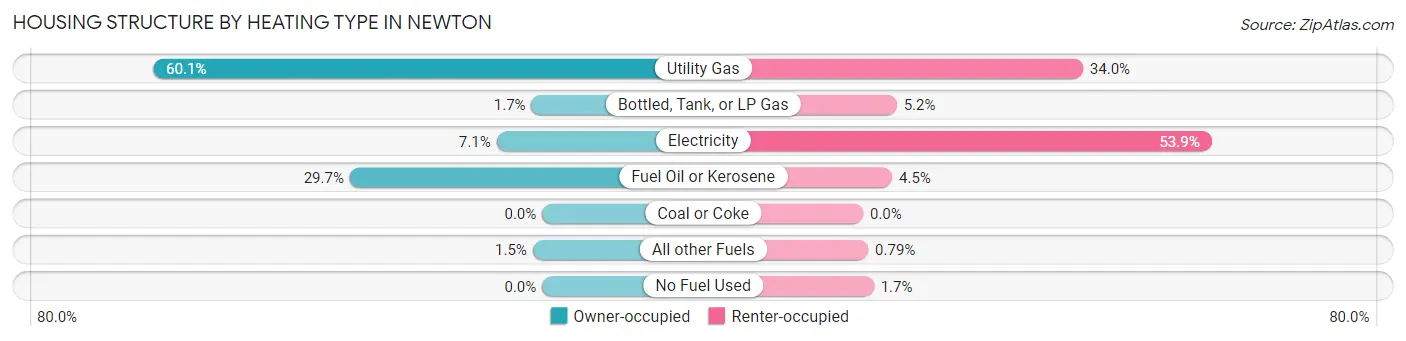
| Heating Type | Owner-occupied | Renter-occupied |
| Utility Gas | 1,203 (60.1%) | 515 (34.0%) |
| Bottled, Tank, or LP Gas | 33 (1.7%) | 79 (5.2%) |
| Electricity | 141 (7.0%) | 816 (53.9%) |
| Fuel Oil or Kerosene | 595 (29.7%) | 68 (4.5%) |
| Coal or Coke | 0 (0.0%) | 0 (0.0%) |
| All other Fuels | 29 (1.5%) | 12 (0.8%) |
| No Fuel Used | 0 (0.0%) | 25 (1.7%) |
| Total | 2,001 (100.0%) | 1,515 (100.0%) |
Household Vehicle Usage in Newton
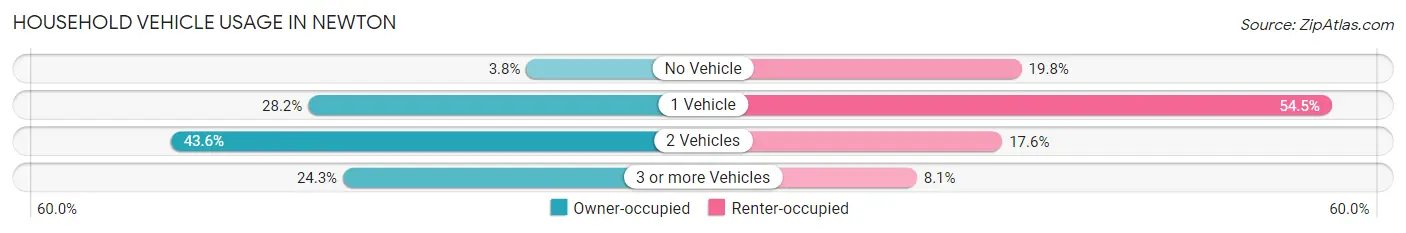
| Vehicles per Household | Owner-occupied | Renter-occupied |
| No Vehicle | 76 (3.8%) | 300 (19.8%) |
| 1 Vehicle | 565 (28.2%) | 826 (54.5%) |
| 2 Vehicles | 873 (43.6%) | 267 (17.6%) |
| 3 or more Vehicles | 487 (24.3%) | 122 (8.1%) |
| Total | 2,001 (100.0%) | 1,515 (100.0%) |
Real Estate & Mortgages in Newton
Real Estate and Mortgage Overview in Newton
| Characteristic | Without Mortgage | With Mortgage |
| Housing Units | 582 | 1,419 |
| Median Property Value | $243,900 | $279,300 |
| Median Household Income | $79,741 | $461 |
| Monthly Housing Costs | $1,053 | $243 |
| Real Estate Taxes | $8,642 | $20 |
Property Value by Mortgage Status in Newton
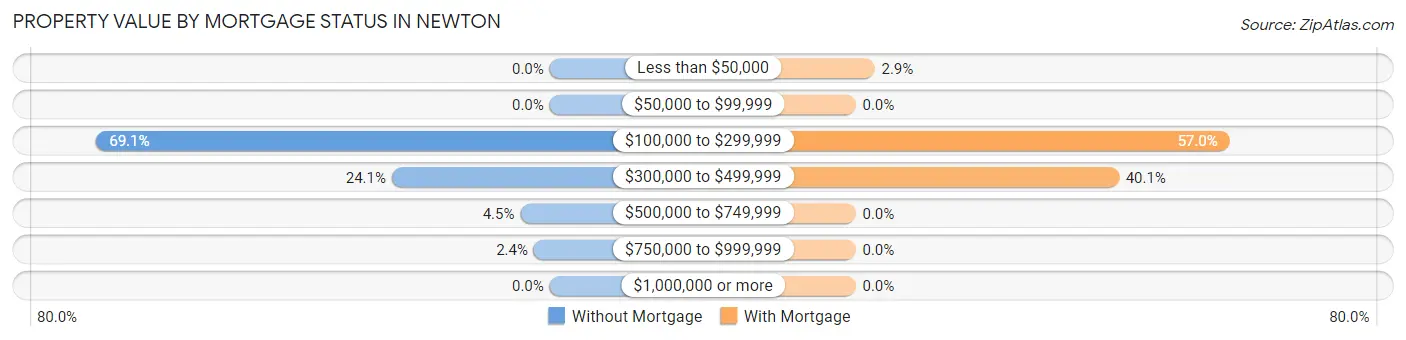
| Property Value | Without Mortgage | With Mortgage |
| Less than $50,000 | 0 (0.0%) | 41 (2.9%) |
| $50,000 to $99,999 | 0 (0.0%) | 0 (0.0%) |
| $100,000 to $299,999 | 402 (69.1%) | 809 (57.0%) |
| $300,000 to $499,999 | 140 (24.0%) | 569 (40.1%) |
| $500,000 to $749,999 | 26 (4.5%) | 0 (0.0%) |
| $750,000 to $999,999 | 14 (2.4%) | 0 (0.0%) |
| $1,000,000 or more | 0 (0.0%) | 0 (0.0%) |
| Total | 582 (100.0%) | 1,419 (100.0%) |
Household Income by Mortgage Status in Newton
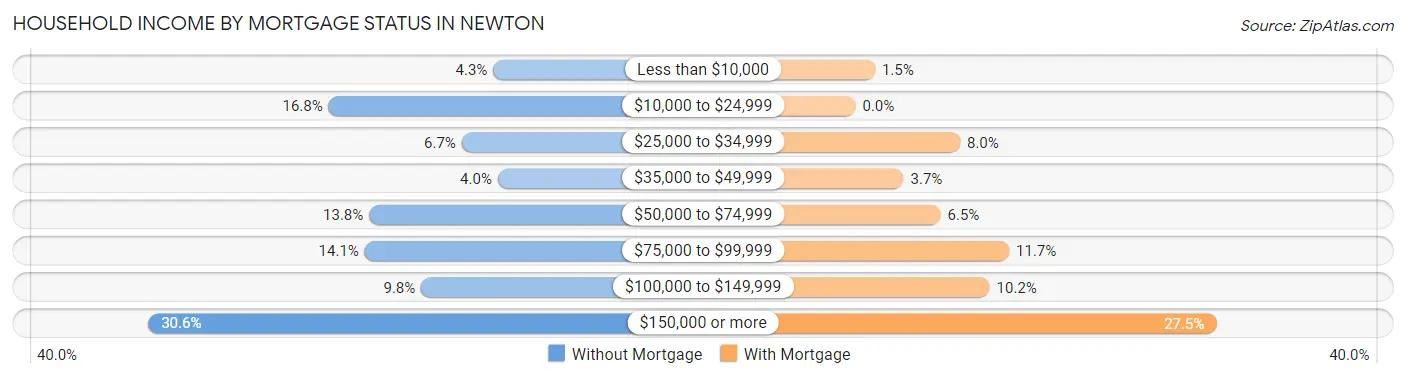
| Household Income | Without Mortgage | With Mortgage |
| Less than $10,000 | 25 (4.3%) | 21 (1.5%) |
| $10,000 to $24,999 | 98 (16.8%) | 0 (0.0%) |
| $25,000 to $34,999 | 39 (6.7%) | 113 (8.0%) |
| $35,000 to $49,999 | 23 (4.0%) | 52 (3.7%) |
| $50,000 to $74,999 | 80 (13.8%) | 92 (6.5%) |
| $75,000 to $99,999 | 82 (14.1%) | 166 (11.7%) |
| $100,000 to $149,999 | 57 (9.8%) | 145 (10.2%) |
| $150,000 or more | 178 (30.6%) | 390 (27.5%) |
| Total | 582 (100.0%) | 1,419 (100.0%) |
Property Value to Household Income Ratio in Newton
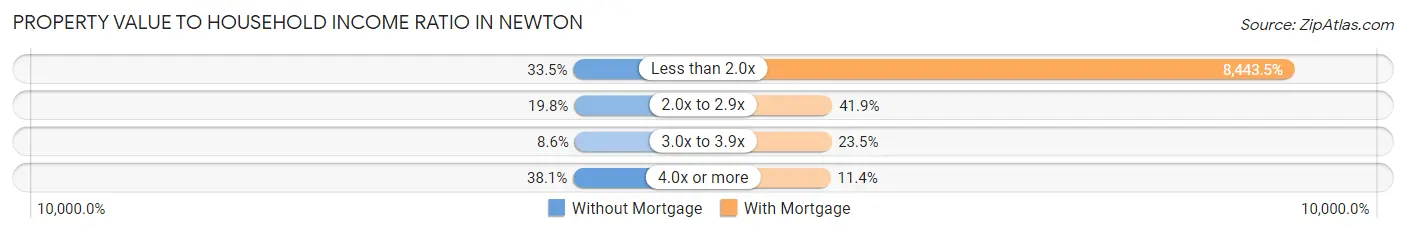
| Value-to-Income Ratio | Without Mortgage | With Mortgage |
| Less than 2.0x | 195 (33.5%) | 119,813 (8,443.5%) |
| 2.0x to 2.9x | 115 (19.8%) | 595 (41.9%) |
| 3.0x to 3.9x | 50 (8.6%) | 334 (23.5%) |
| 4.0x or more | 222 (38.1%) | 162 (11.4%) |
| Total | 582 (100.0%) | 1,419 (100.0%) |
Real Estate Taxes by Mortgage Status in Newton
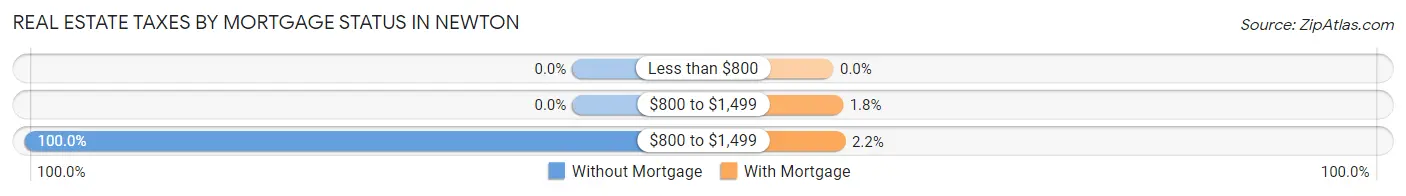
| Property Taxes | Without Mortgage | With Mortgage |
| Less than $800 | 0 (0.0%) | 0 (0.0%) |
| $800 to $1,499 | 0 (0.0%) | 25 (1.8%) |
| $800 to $1,499 | 582 (100.0%) | 31 (2.2%) |
| Total | 582 (100.0%) | 1,419 (100.0%) |
Health & Disability in Newton
Health Insurance Coverage by Age in Newton
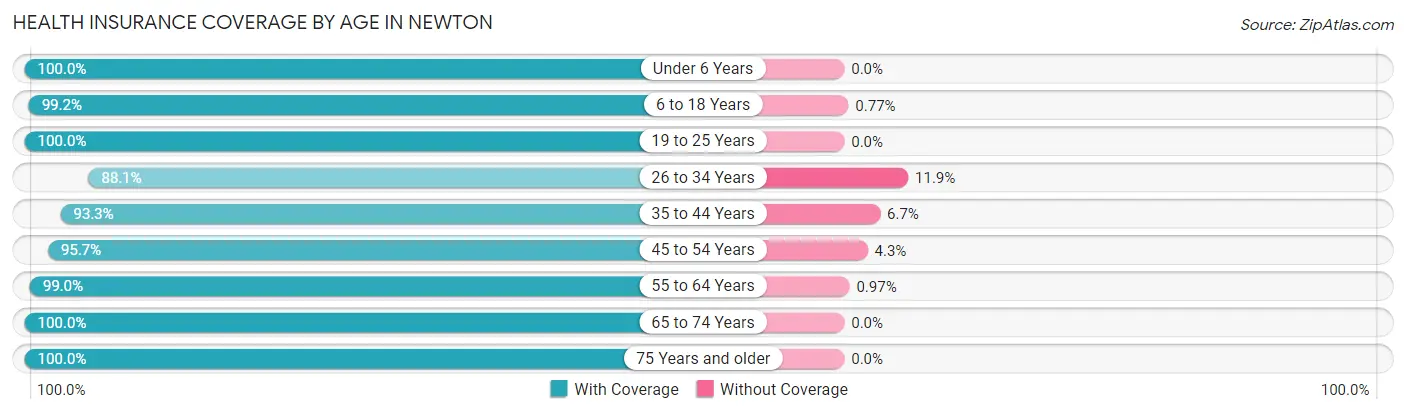
| Age Bracket | With Coverage | Without Coverage |
| Under 6 Years | 399 (100.0%) | 0 (0.0%) |
| 6 to 18 Years | 1,157 (99.2%) | 9 (0.8%) |
| 19 to 25 Years | 605 (100.0%) | 0 (0.0%) |
| 26 to 34 Years | 962 (88.1%) | 130 (11.9%) |
| 35 to 44 Years | 854 (93.3%) | 61 (6.7%) |
| 45 to 54 Years | 1,299 (95.7%) | 59 (4.3%) |
| 55 to 64 Years | 915 (99.0%) | 9 (1.0%) |
| 65 to 74 Years | 795 (100.0%) | 0 (0.0%) |
| 75 Years and older | 748 (100.0%) | 0 (0.0%) |
| Total | 7,734 (96.7%) | 268 (3.4%) |
Health Insurance Coverage by Citizenship Status in Newton
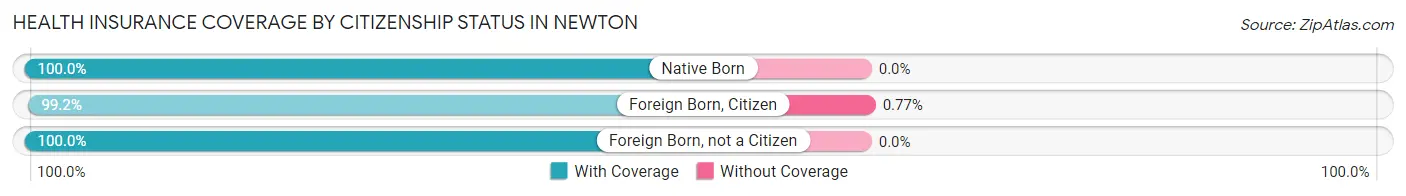
| Citizenship Status | With Coverage | Without Coverage |
| Native Born | 399 (100.0%) | 0 (0.0%) |
| Foreign Born, Citizen | 1,157 (99.2%) | 9 (0.8%) |
| Foreign Born, not a Citizen | 605 (100.0%) | 0 (0.0%) |
Health Insurance Coverage by Household Income in Newton
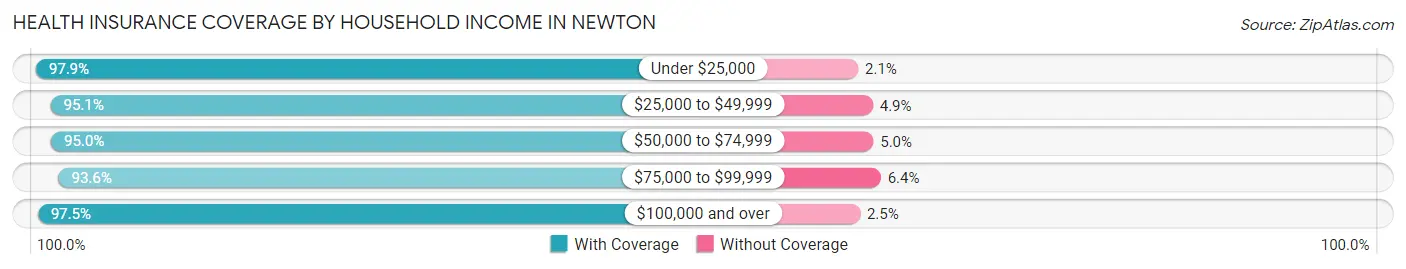
| Household Income | With Coverage | Without Coverage |
| Under $25,000 | 1,295 (97.9%) | 28 (2.1%) |
| $25,000 to $49,999 | 781 (95.1%) | 40 (4.9%) |
| $50,000 to $74,999 | 939 (95.0%) | 49 (5.0%) |
| $75,000 to $99,999 | 692 (93.6%) | 47 (6.4%) |
| $100,000 and over | 3,926 (97.5%) | 99 (2.5%) |
Public vs Private Health Insurance Coverage by Age in Newton
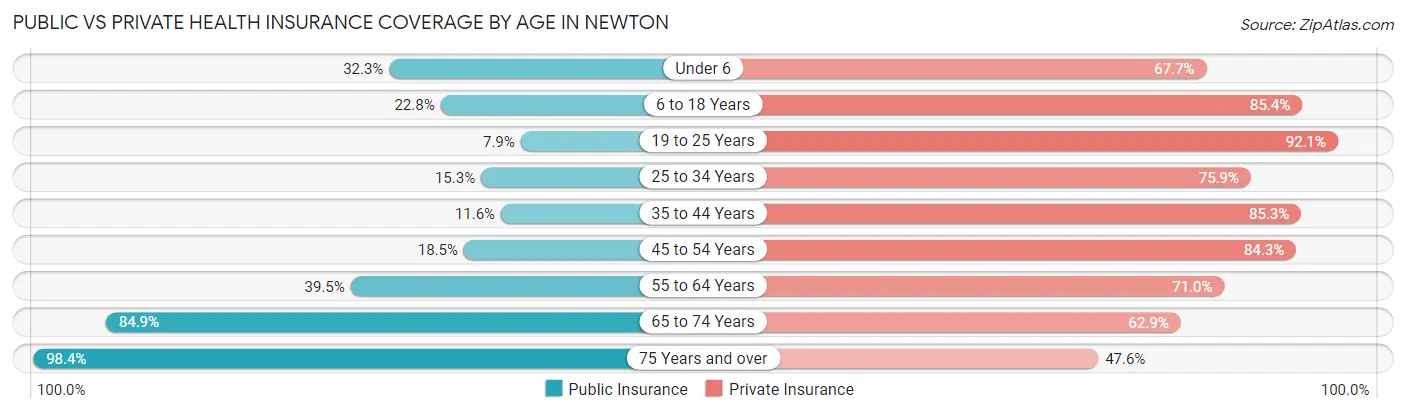
| Age Bracket | Public Insurance | Private Insurance |
| Under 6 | 129 (32.3%) | 270 (67.7%) |
| 6 to 18 Years | 266 (22.8%) | 996 (85.4%) |
| 19 to 25 Years | 48 (7.9%) | 557 (92.1%) |
| 25 to 34 Years | 167 (15.3%) | 829 (75.9%) |
| 35 to 44 Years | 106 (11.6%) | 780 (85.3%) |
| 45 to 54 Years | 251 (18.5%) | 1,145 (84.3%) |
| 55 to 64 Years | 365 (39.5%) | 656 (71.0%) |
| 65 to 74 Years | 675 (84.9%) | 500 (62.9%) |
| 75 Years and over | 736 (98.4%) | 356 (47.6%) |
| Total | 2,743 (34.3%) | 6,089 (76.1%) |
Disability Status by Sex by Age in Newton
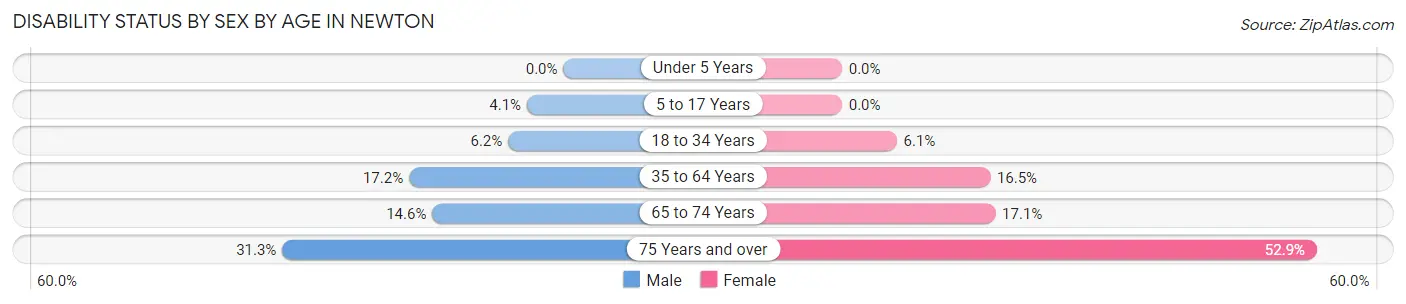
| Age Bracket | Male | Female |
| Under 5 Years | 0 (0.0%) | 0 (0.0%) |
| 5 to 17 Years | 25 (4.1%) | 0 (0.0%) |
| 18 to 34 Years | 51 (6.1%) | 59 (6.1%) |
| 35 to 64 Years | 263 (17.2%) | 275 (16.5%) |
| 65 to 74 Years | 46 (14.6%) | 82 (17.1%) |
| 75 Years and over | 62 (31.3%) | 291 (52.9%) |
Disability Class by Sex by Age in Newton
Disability Class: Hearing Difficulty
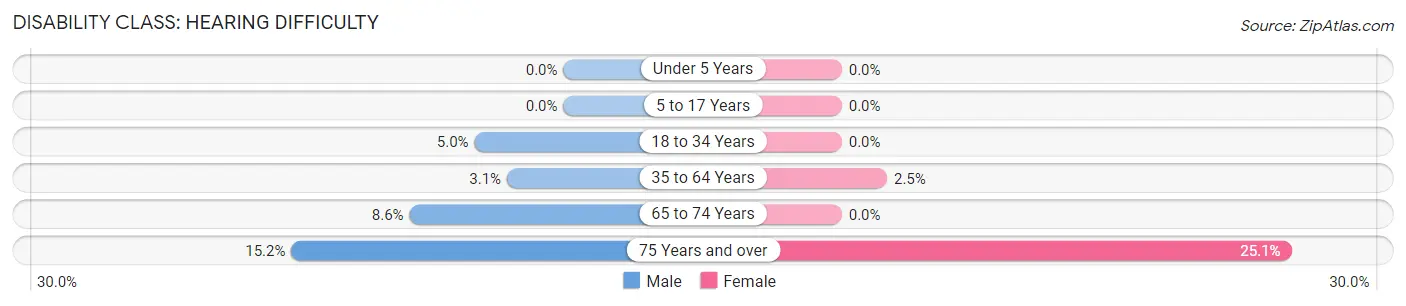
| Age Bracket | Male | Female |
| Under 5 Years | 0 (0.0%) | 0 (0.0%) |
| 5 to 17 Years | 0 (0.0%) | 0 (0.0%) |
| 18 to 34 Years | 41 (5.0%) | 0 (0.0%) |
| 35 to 64 Years | 48 (3.1%) | 42 (2.5%) |
| 65 to 74 Years | 27 (8.6%) | 0 (0.0%) |
| 75 Years and over | 30 (15.1%) | 138 (25.1%) |
Disability Class: Vision Difficulty
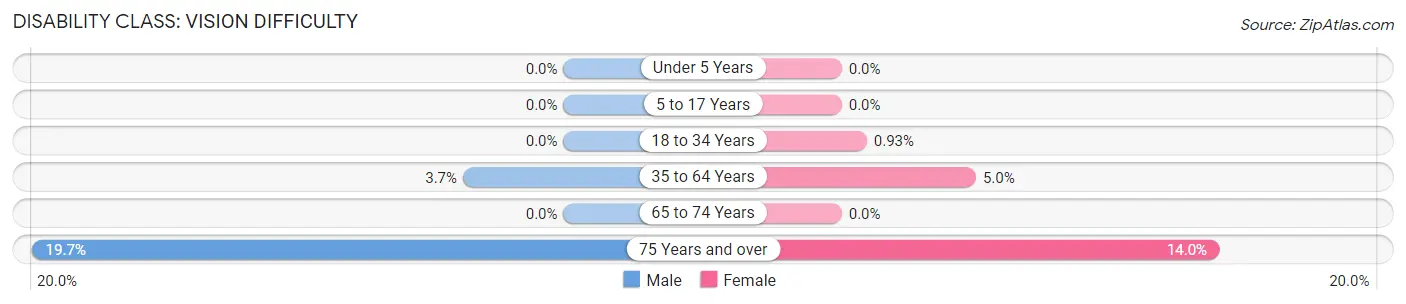
| Age Bracket | Male | Female |
| Under 5 Years | 0 (0.0%) | 0 (0.0%) |
| 5 to 17 Years | 0 (0.0%) | 0 (0.0%) |
| 18 to 34 Years | 0 (0.0%) | 9 (0.9%) |
| 35 to 64 Years | 57 (3.7%) | 83 (5.0%) |
| 65 to 74 Years | 0 (0.0%) | 0 (0.0%) |
| 75 Years and over | 39 (19.7%) | 77 (14.0%) |
Disability Class: Cognitive Difficulty
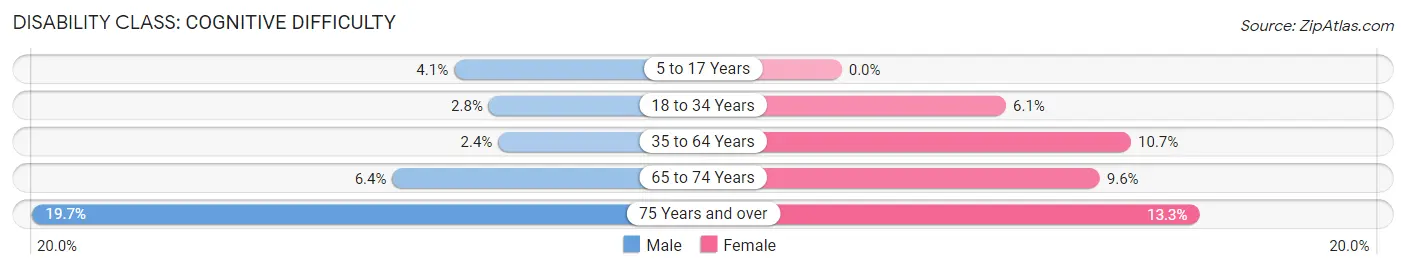
| Age Bracket | Male | Female |
| 5 to 17 Years | 25 (4.1%) | 0 (0.0%) |
| 18 to 34 Years | 23 (2.8%) | 59 (6.1%) |
| 35 to 64 Years | 37 (2.4%) | 179 (10.7%) |
| 65 to 74 Years | 20 (6.4%) | 46 (9.6%) |
| 75 Years and over | 39 (19.7%) | 73 (13.3%) |
Disability Class: Ambulatory Difficulty
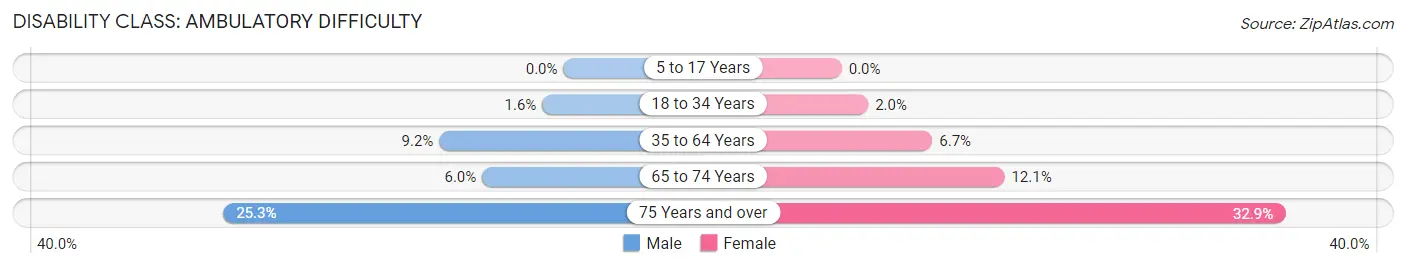
| Age Bracket | Male | Female |
| 5 to 17 Years | 0 (0.0%) | 0 (0.0%) |
| 18 to 34 Years | 13 (1.6%) | 19 (2.0%) |
| 35 to 64 Years | 141 (9.2%) | 112 (6.7%) |
| 65 to 74 Years | 19 (6.0%) | 58 (12.1%) |
| 75 Years and over | 50 (25.3%) | 181 (32.9%) |
Disability Class: Self-Care Difficulty
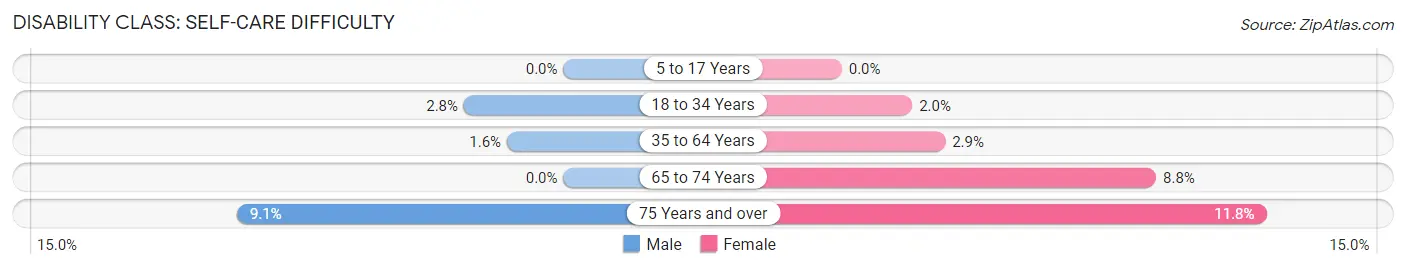
| Age Bracket | Male | Female |
| 5 to 17 Years | 0 (0.0%) | 0 (0.0%) |
| 18 to 34 Years | 23 (2.8%) | 19 (2.0%) |
| 35 to 64 Years | 24 (1.6%) | 48 (2.9%) |
| 65 to 74 Years | 0 (0.0%) | 42 (8.7%) |
| 75 Years and over | 18 (9.1%) | 65 (11.8%) |
Technology Access in Newton
Computing Device Access in Newton
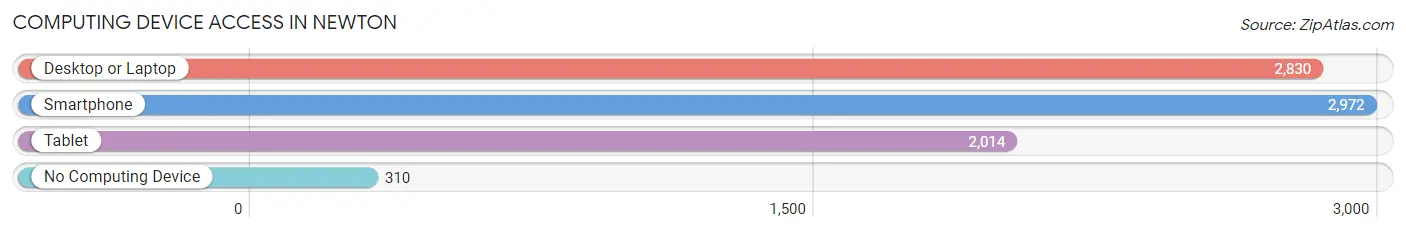
| Device Type | # Households | % Households |
| Desktop or Laptop | 2,830 | 80.5% |
| Smartphone | 2,972 | 84.5% |
| Tablet | 2,014 | 57.3% |
| No Computing Device | 310 | 8.8% |
| Total | 3,516 | 100.0% |
Internet Access in Newton
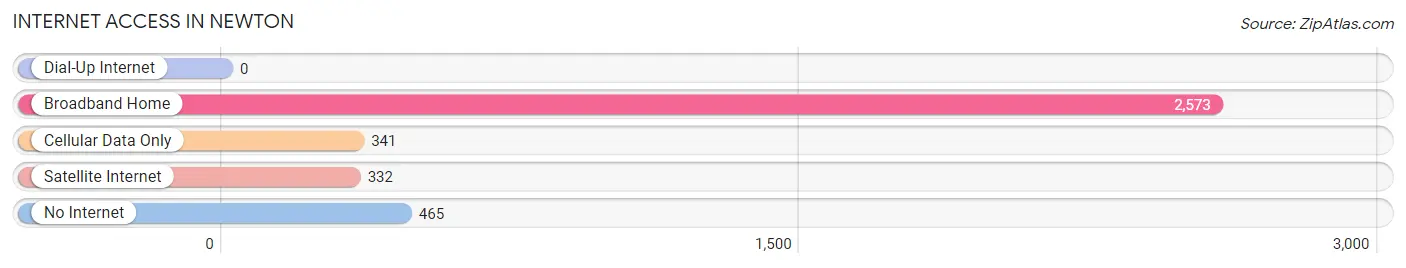
| Internet Type | # Households | % Households |
| Dial-Up Internet | 0 | 0.0% |
| Broadband Home | 2,573 | 73.2% |
| Cellular Data Only | 341 | 9.7% |
| Satellite Internet | 332 | 9.4% |
| No Internet | 465 | 13.2% |
| Total | 3,516 | 100.0% |
Newton Summary
Newton, New Jersey is a small city located in Sussex County, in the northwest corner of the state. It is situated in the Kittatinny Valley, which is part of the Great Appalachian Valley. The city is bordered by Andover Township to the north, Fredon Township to the east, Hampton Township to the south, and Green Township to the west. The city has a total area of 2.3 square miles, all of which is land.
History
The area that is now Newton was originally inhabited by the Lenape Native Americans. The first European settlers arrived in the area in the late 17th century, and the town was officially established in 1751. It was named after the English physicist and mathematician Sir Isaac Newton.
In the 19th century, Newton became an important center for the iron industry. The Morris Canal, which connected the Delaware River to the Hudson River, was built through the city in 1831. This allowed for the transportation of iron ore from the mines in the area to the ironworks in the cities of Newark and Jersey City.
The city was also an important stop on the Sussex Railroad, which connected Newton to the cities of Hoboken and Jersey City. The railroad was completed in 1848 and operated until 1966.
Geography
Newton is located in the Kittatinny Valley, which is part of the Great Appalachian Valley. The city is bordered by Andover Township to the north, Fredon Township to the east, Hampton Township to the south, and Green Township to the west. The city has a total area of 2.3 square miles, all of which is land.
The city is located at the confluence of the Paulinskill and Wallkill rivers. The Paulinskill River flows through the city from the north to the south, while the Wallkill River flows from the east to the west.
Economy
The economy of Newton is largely based on manufacturing and tourism. The city is home to several manufacturing companies, including a paper mill, a printing company, and a plastics factory.
The city is also a popular tourist destination, due to its proximity to the Delaware Water Gap National Recreation Area. The city is home to several historic sites, including the Newton Theatre, which was built in 1924 and is now a performing arts center.
Demographics
As of the 2010 census, Newton had a population of 8,244. The racial makeup of the city was 87.2% White, 5.3% African American, 0.3% Native American, 2.2% Asian, 0.1% Pacific Islander, 2.7% from other races, and 2.4% from two or more races. Hispanic or Latino of any race were 8.3% of the population.
The median household income in Newton was $50,945, and the median family income was $60,917. The per capita income for the city was $25,945. About 8.2% of families and 10.2% of the population were below the poverty line, including 14.2% of those under age 18 and 6.2% of those age 65 or over.
Common Questions
What is Per Capita Income in Newton?
Per Capita income in Newton is $39,363.
What is the Median Family Income in Newton?
Median Family Income in Newton is $120,139.
What is the Median Household income in Newton?
Median Household Income in Newton is $72,240.
What is Income or Wage Gap in Newton?
Income or Wage Gap in Newton is 40.9%.
Women in Newton earn 59.1 cents for every dollar earned by a man.
What is Family Income Deficit in Newton?
Family Income Deficit in Newton is $10,259.
Families that are below poverty line in Newton earn $10,259 less on average than the poverty threshold level.
What is Inequality or Gini Index in Newton?
Inequality or Gini Index in Newton is 0.45.
What is the Total Population of Newton?
Total Population of Newton is 8,370.
What is the Total Male Population of Newton?
Total Male Population of Newton is 3,837.
What is the Total Female Population of Newton?
Total Female Population of Newton is 4,533.
What is the Ratio of Males per 100 Females in Newton?
There are 84.65 Males per 100 Females in Newton.
What is the Ratio of Females per 100 Males in Newton?
There are 118.14 Females per 100 Males in Newton.
What is the Median Population Age in Newton?
Median Population Age in Newton is 44.4 Years.
What is the Average Family Size in Newton
Average Family Size in Newton is 3.0 People.
What is the Average Household Size in Newton
Average Household Size in Newton is 2.2 People.
How Large is the Labor Force in Newton?
There are 4,503 People in the Labor Forcein in Newton.
What is the Percentage of People in the Labor Force in Newton?
63.0% of People are in the Labor Force in Newton.
What is the Unemployment Rate in Newton?
Unemployment Rate in Newton is 7.6%.