Browns Mills, NJ Map & Demographics
Browns Mills Map
Browns Mills Overview
$34,946
PER CAPITA INCOME
$90,781
AVG FAMILY INCOME
$70,826
AVG HOUSEHOLD INCOME
22.6%
WAGE / INCOME GAP [ % ]
77.4¢/ $1
WAGE / INCOME GAP [ $ ]
0.49
INEQUALITY / GINI INDEX
10,060
TOTAL POPULATION
5,334
MALE POPULATION
4,726
FEMALE POPULATION
112.87
MALES / 100 FEMALES
88.60
FEMALES / 100 MALES
41.4
MEDIAN AGE
3.3
AVG FAMILY SIZE
2.7
AVG HOUSEHOLD SIZE
5,067
LABOR FORCE [ PEOPLE ]
60.8%
PERCENT IN LABOR FORCE
9.3%
UNEMPLOYMENT RATE
Browns Mills Zip Codes
Browns Mills Area Codes
Income in Browns Mills
Income Overview in Browns Mills
Per Capita Income in Browns Mills is $34,946, while median incomes of families and households are $90,781 and $70,826 respectively.
| Characteristic | Number | Measure |
| Per Capita Income | 10,060 | $34,946 |
| Median Family Income | 2,422 | $90,781 |
| Mean Family Income | 2,422 | $114,730 |
| Median Household Income | 3,749 | $70,826 |
| Mean Household Income | 3,749 | $94,744 |
| Income Deficit | 2,422 | $0 |
| Wage / Income Gap (%) | 10,060 | 22.59% |
| Wage / Income Gap ($) | 10,060 | 77.41¢ per $1 |
| Gini / Inequality Index | 10,060 | 0.49 |
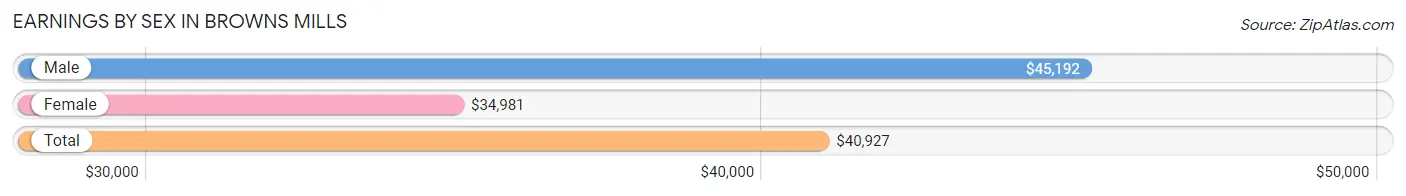
Earnings by Sex in Browns Mills
Average Earnings in Browns Mills are $40,927, $45,192 for men and $34,981 for women, a difference of 22.6%.
| Sex | Number | Average Earnings |
| Male | 2,779 (54.8%) | $45,192 |
| Female | 2,288 (45.2%) | $34,981 |
| Total | 5,067 (100.0%) | $40,927 |
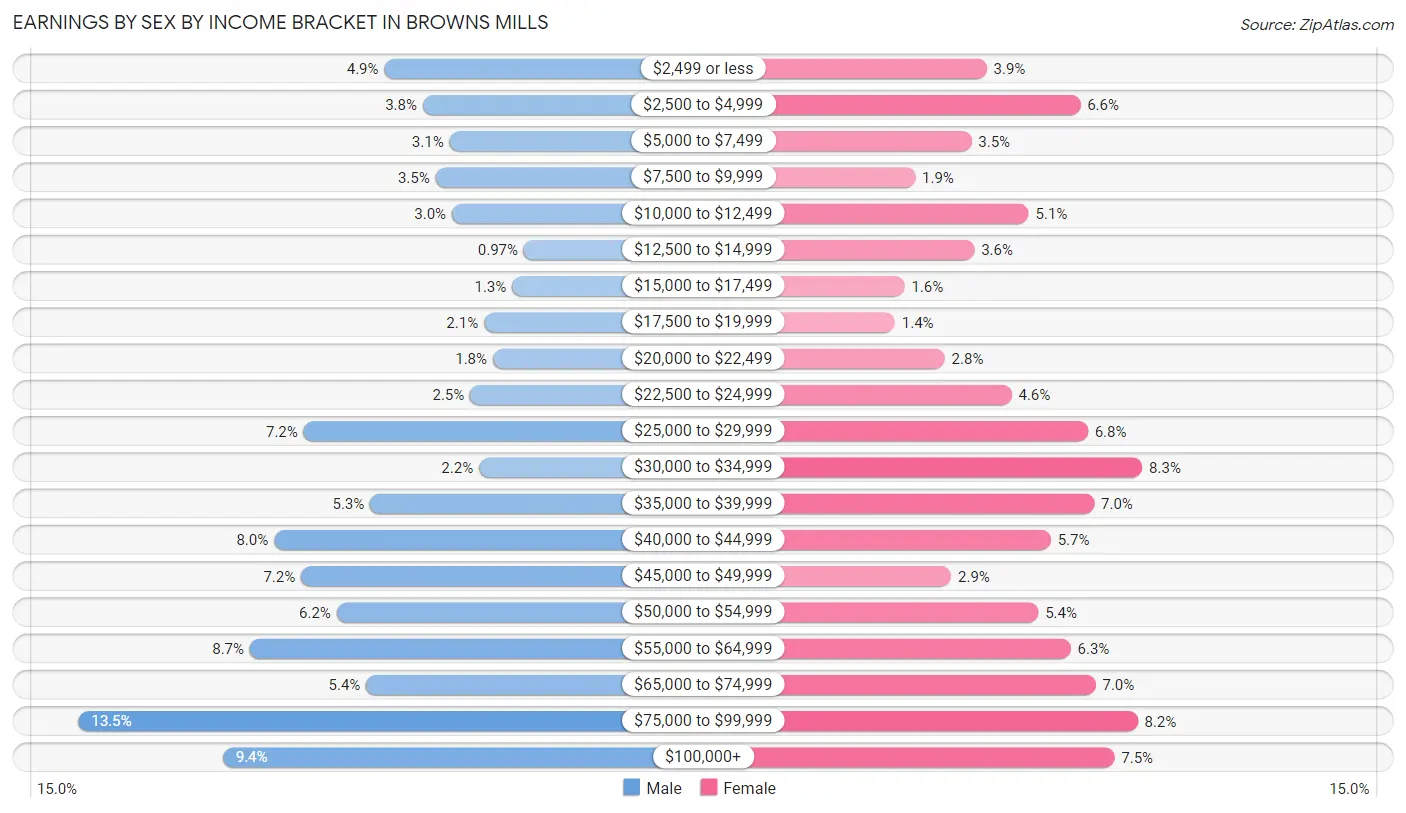
Earnings by Sex by Income Bracket in Browns Mills
The most common earnings brackets in Browns Mills are $75,000 to $99,999 for men (375 | 13.5%) and $30,000 to $34,999 for women (190 | 8.3%).
| Income | Male | Female |
| $2,499 or less | 136 (4.9%) | 90 (3.9%) |
| $2,500 to $4,999 | 106 (3.8%) | 150 (6.6%) |
| $5,000 to $7,499 | 85 (3.1%) | 80 (3.5%) |
| $7,500 to $9,999 | 96 (3.5%) | 44 (1.9%) |
| $10,000 to $12,499 | 83 (3.0%) | 117 (5.1%) |
| $12,500 to $14,999 | 27 (1.0%) | 82 (3.6%) |
| $15,000 to $17,499 | 36 (1.3%) | 37 (1.6%) |
| $17,500 to $19,999 | 58 (2.1%) | 31 (1.3%) |
| $20,000 to $22,499 | 51 (1.8%) | 63 (2.8%) |
| $22,500 to $24,999 | 69 (2.5%) | 106 (4.6%) |
| $25,000 to $29,999 | 199 (7.2%) | 155 (6.8%) |
| $30,000 to $34,999 | 62 (2.2%) | 190 (8.3%) |
| $35,000 to $39,999 | 147 (5.3%) | 159 (7.0%) |
| $40,000 to $44,999 | 222 (8.0%) | 131 (5.7%) |
| $45,000 to $49,999 | 201 (7.2%) | 67 (2.9%) |
| $50,000 to $54,999 | 173 (6.2%) | 123 (5.4%) |
| $55,000 to $64,999 | 241 (8.7%) | 144 (6.3%) |
| $65,000 to $74,999 | 150 (5.4%) | 160 (7.0%) |
| $75,000 to $99,999 | 375 (13.5%) | 187 (8.2%) |
| $100,000+ | 262 (9.4%) | 172 (7.5%) |
| Total | 2,779 (100.0%) | 2,288 (100.0%) |
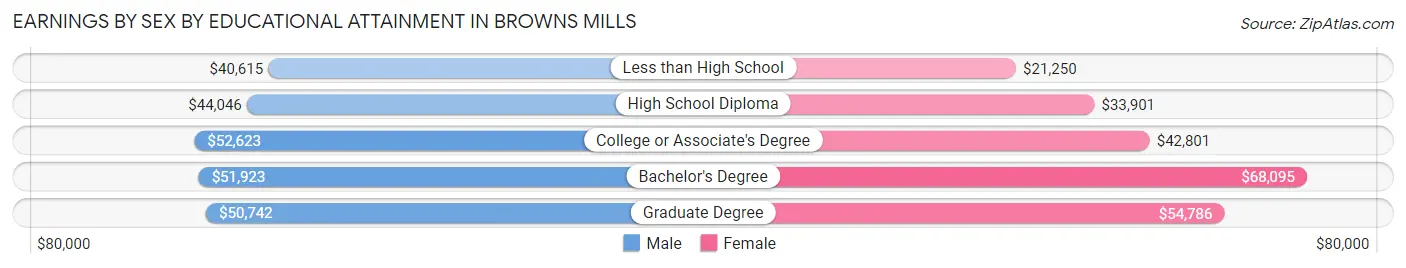
Earnings by Sex by Educational Attainment in Browns Mills
Average earnings in Browns Mills are $47,163 for men and $39,342 for women, a difference of 16.6%. Men with an educational attainment of college or associate's degree enjoy the highest average annual earnings of $52,623, while those with less than high school education earn the least with $40,615. Women with an educational attainment of bachelor's degree earn the most with the average annual earnings of $68,095, while those with less than high school education have the smallest earnings of $21,250.
| Educational Attainment | Male Income | Female Income |
| Less than High School | $40,615 | $21,250 |
| High School Diploma | $44,046 | $33,901 |
| College or Associate's Degree | $52,623 | $42,801 |
| Bachelor's Degree | $51,923 | $68,095 |
| Graduate Degree | $50,742 | $54,786 |
| Total | $47,163 | $39,342 |
Family Income in Browns Mills
Family Income Brackets in Browns Mills
According to the Browns Mills family income data, there are 557 families falling into the $100,000 to $149,999 income range, which is the most common income bracket and makes up 23.0% of all families. Conversely, the $10,000 to $14,999 income bracket is the least frequent group with only 15 families (0.6%) belonging to this category.
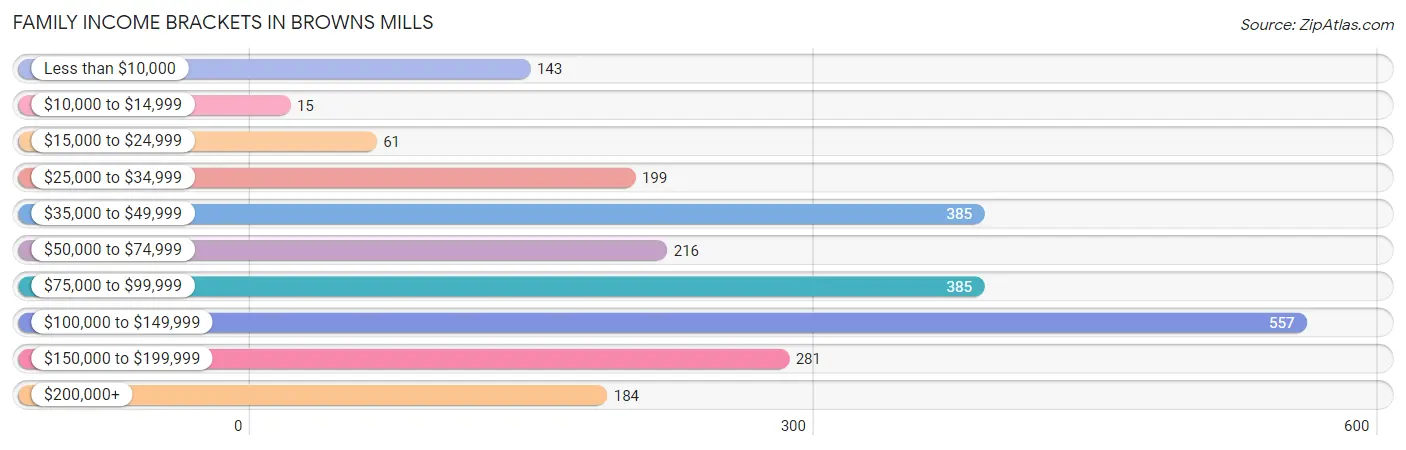
| Income Bracket | # Families | % Families |
| Less than $10,000 | 143 | 5.9% |
| $10,000 to $14,999 | 15 | 0.6% |
| $15,000 to $24,999 | 61 | 2.5% |
| $25,000 to $34,999 | 199 | 8.2% |
| $35,000 to $49,999 | 385 | 15.9% |
| $50,000 to $74,999 | 216 | 8.9% |
| $75,000 to $99,999 | 385 | 15.9% |
| $100,000 to $149,999 | 557 | 23.0% |
| $150,000 to $199,999 | 281 | 11.6% |
| $200,000+ | 184 | 7.6% |
Family Income by Famaliy Size in Browns Mills
6-person families (79 | 3.3%) account for the highest median family income in Browns Mills with $249,625 per family, while 6-person families (79 | 3.3%) have the highest median income of $41,604 per family member.
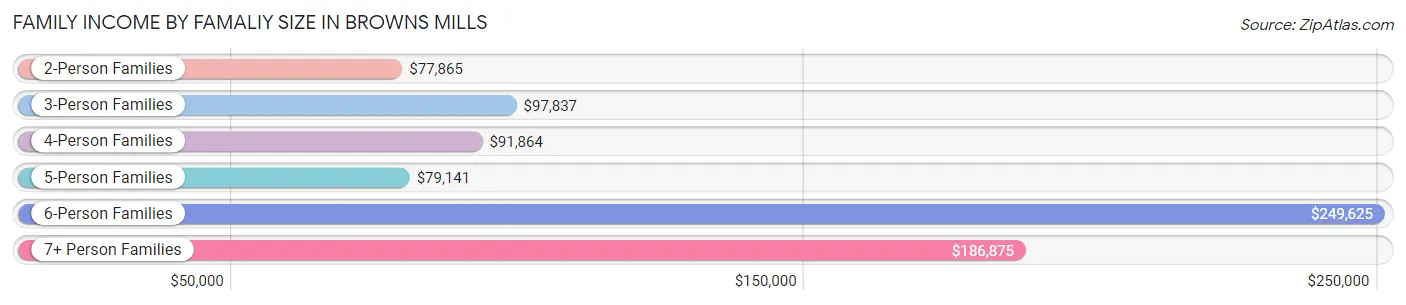
| Income Bracket | # Families | Median Income |
| 2-Person Families | 1,061 (43.8%) | $77,865 |
| 3-Person Families | 501 (20.7%) | $97,837 |
| 4-Person Families | 492 (20.3%) | $91,864 |
| 5-Person Families | 265 (10.9%) | $79,141 |
| 6-Person Families | 79 (3.3%) | $249,625 |
| 7+ Person Families | 24 (1.0%) | $186,875 |
| Total | 2,422 (100.0%) | $90,781 |
Family Income by Number of Earners in Browns Mills
The median family income in Browns Mills is $90,781, with families comprising 3+ earners (368) having the highest median family income of $165,203, while families with 1 earner (870) have the lowest median family income of $47,461, accounting for 15.2% and 35.9% of families, respectively.
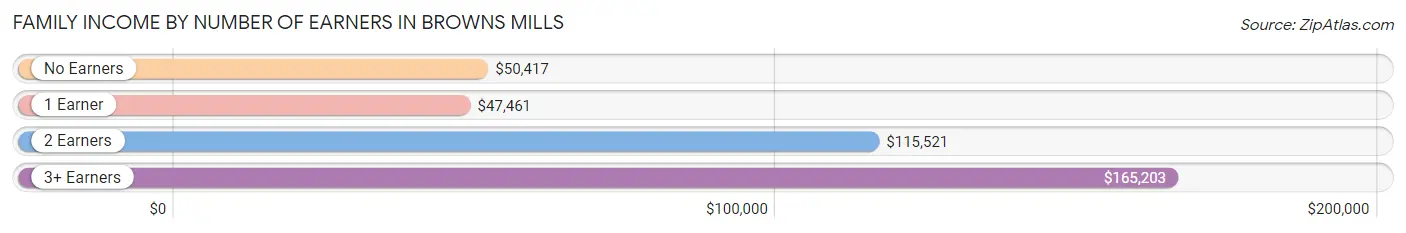
| Number of Earners | # Families | Median Income |
| No Earners | 363 (15.0%) | $50,417 |
| 1 Earner | 870 (35.9%) | $47,461 |
| 2 Earners | 821 (33.9%) | $115,521 |
| 3+ Earners | 368 (15.2%) | $165,203 |
| Total | 2,422 (100.0%) | $90,781 |
Household Income in Browns Mills
Household Income Brackets in Browns Mills
With 675 households falling in the category, the $75,000 to $99,999 income range is the most frequent in Browns Mills, accounting for 18.0% of all households. In contrast, only 45 households (1.2%) fall into the $10,000 to $14,999 income bracket, making it the least populous group.
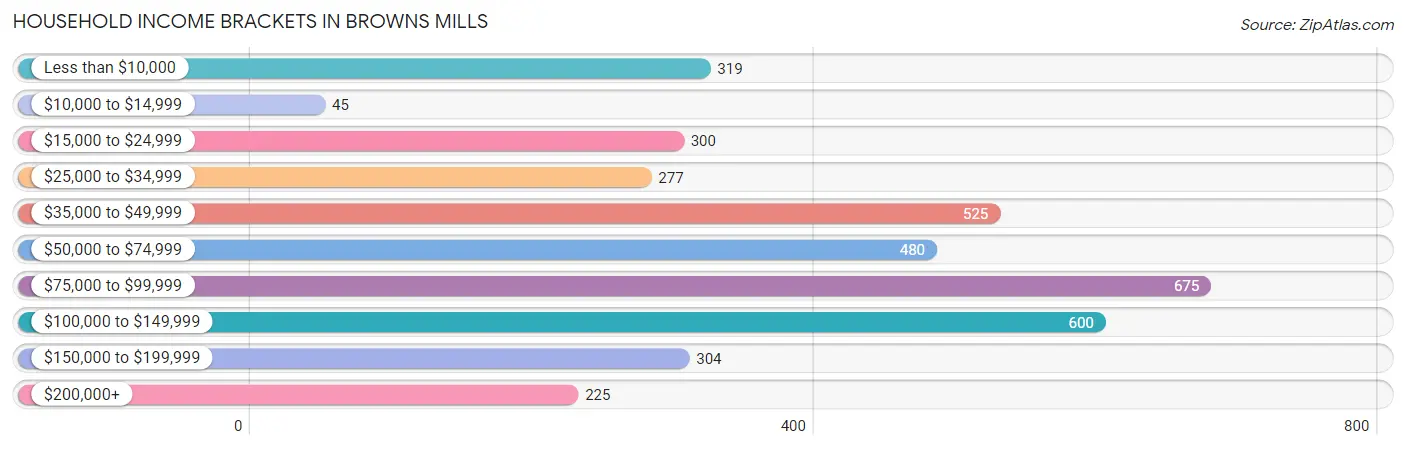
| Income Bracket | # Households | % Households |
| Less than $10,000 | 319 | 8.5% |
| $10,000 to $14,999 | 45 | 1.2% |
| $15,000 to $24,999 | 300 | 8.0% |
| $25,000 to $34,999 | 277 | 7.4% |
| $35,000 to $49,999 | 525 | 14.0% |
| $50,000 to $74,999 | 480 | 12.8% |
| $75,000 to $99,999 | 675 | 18.0% |
| $100,000 to $149,999 | 600 | 16.0% |
| $150,000 to $199,999 | 304 | 8.1% |
| $200,000+ | 225 | 6.0% |
Household Income by Householder Age in Browns Mills
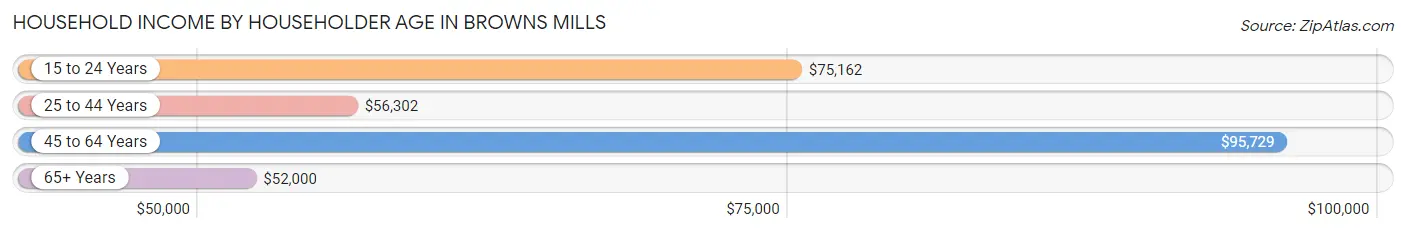
The median household income in Browns Mills is $70,826, with the highest median household income of $95,729 found in the 45 to 64 years age bracket for the primary householder. A total of 1,392 households (37.1%) fall into this category. Meanwhile, the 65+ years age bracket for the primary householder has the lowest median household income of $52,000, with 1,230 households (32.8%) in this group.
| Income Bracket | # Households | Median Income |
| 15 to 24 Years | 101 (2.7%) | $75,162 |
| 25 to 44 Years | 1,026 (27.4%) | $56,302 |
| 45 to 64 Years | 1,392 (37.1%) | $95,729 |
| 65+ Years | 1,230 (32.8%) | $52,000 |
| Total | 3,749 (100.0%) | $70,826 |
Poverty in Browns Mills
Income Below Poverty by Sex and Age in Browns Mills
With 13.0% poverty level for males and 17.7% for females among the residents of Browns Mills, 5 year old males and 15 year old females are the most vulnerable to poverty, with 100 males (64.5%) and 70 females (57.4%) in their respective age groups living below the poverty level.
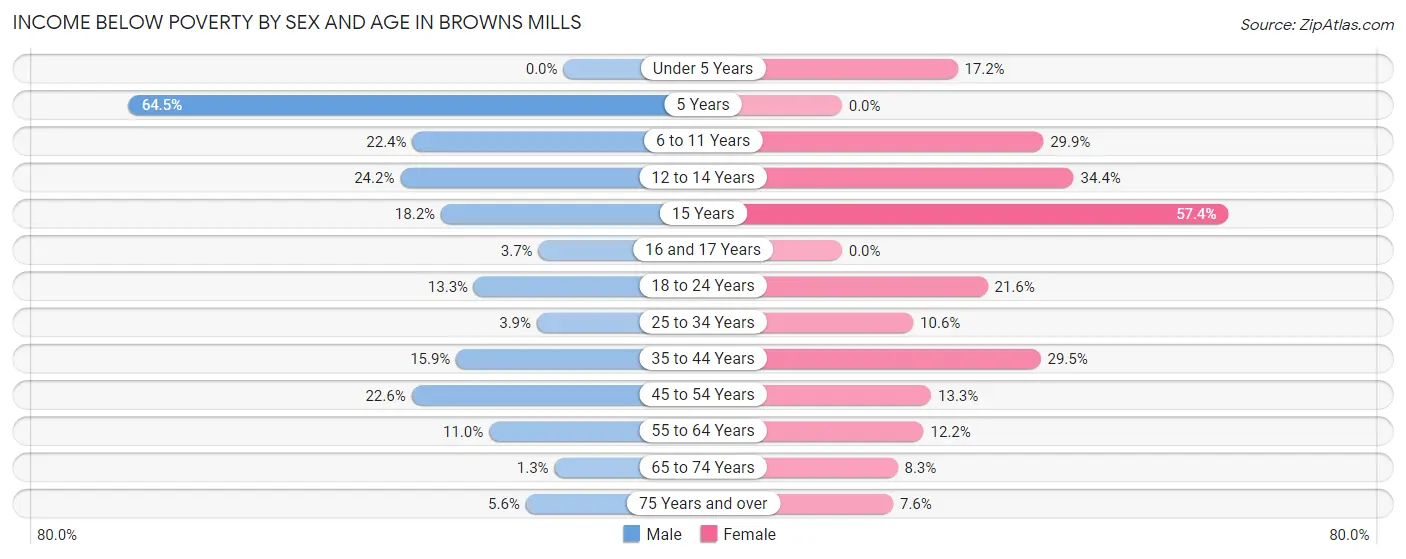
| Age Bracket | Male | Female |
| Under 5 Years | 0 (0.0%) | 34 (17.2%) |
| 5 Years | 100 (64.5%) | 0 (0.0%) |
| 6 to 11 Years | 63 (22.4%) | 70 (29.9%) |
| 12 to 14 Years | 39 (24.2%) | 94 (34.4%) |
| 15 Years | 6 (18.2%) | 70 (57.4%) |
| 16 and 17 Years | 10 (3.7%) | 0 (0.0%) |
| 18 to 24 Years | 70 (13.3%) | 95 (21.6%) |
| 25 to 34 Years | 24 (3.9%) | 58 (10.6%) |
| 35 to 44 Years | 116 (15.9%) | 180 (29.5%) |
| 45 to 54 Years | 161 (22.6%) | 87 (13.3%) |
| 55 to 64 Years | 77 (11.0%) | 73 (12.1%) |
| 65 to 74 Years | 7 (1.3%) | 50 (8.3%) |
| 75 Years and over | 20 (5.6%) | 27 (7.6%) |
| Total | 693 (13.0%) | 838 (17.7%) |
Income Above Poverty by Sex and Age in Browns Mills
According to the poverty statistics in Browns Mills, males aged under 5 years and females aged 16 and 17 years are the age groups that are most secure financially, with 100.0% of males and 100.0% of females in these age groups living above the poverty line.
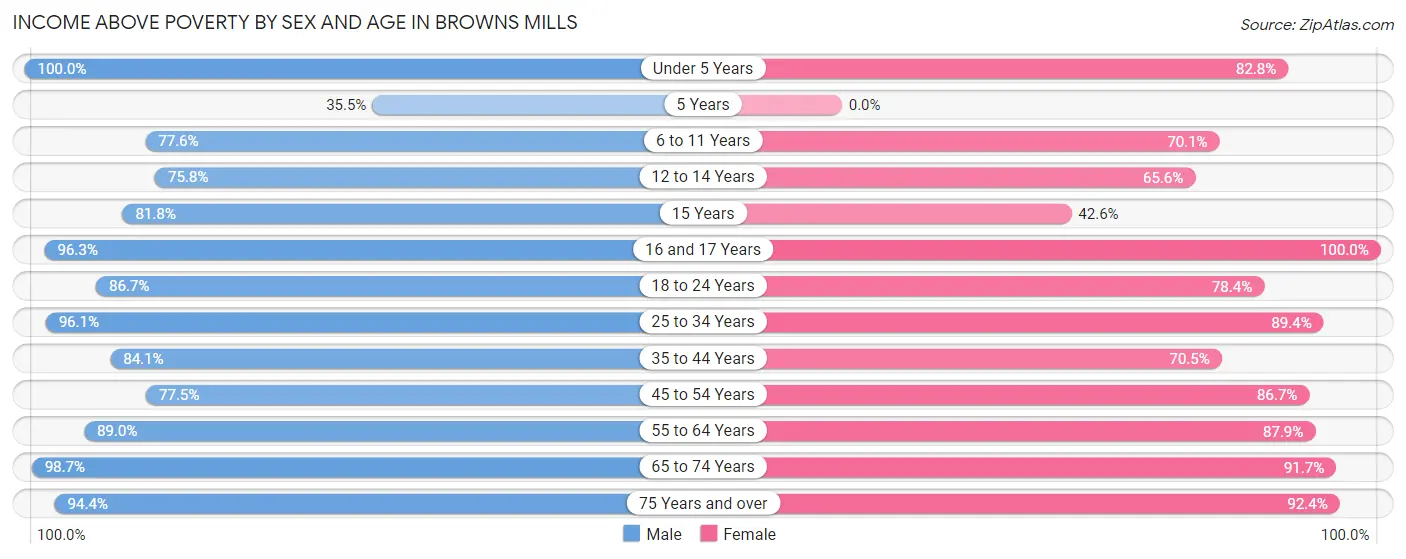
| Age Bracket | Male | Female |
| Under 5 Years | 249 (100.0%) | 164 (82.8%) |
| 5 Years | 55 (35.5%) | 0 (0.0%) |
| 6 to 11 Years | 218 (77.6%) | 164 (70.1%) |
| 12 to 14 Years | 122 (75.8%) | 179 (65.6%) |
| 15 Years | 27 (81.8%) | 52 (42.6%) |
| 16 and 17 Years | 260 (96.3%) | 86 (100.0%) |
| 18 to 24 Years | 457 (86.7%) | 344 (78.4%) |
| 25 to 34 Years | 586 (96.1%) | 489 (89.4%) |
| 35 to 44 Years | 613 (84.1%) | 430 (70.5%) |
| 45 to 54 Years | 553 (77.4%) | 569 (86.7%) |
| 55 to 64 Years | 621 (89.0%) | 528 (87.8%) |
| 65 to 74 Years | 523 (98.7%) | 554 (91.7%) |
| 75 Years and over | 338 (94.4%) | 328 (92.4%) |
| Total | 4,622 (87.0%) | 3,887 (82.3%) |
Income Below Poverty Among Married-Couple Families in Browns Mills
The poverty statistics for married-couple families in Browns Mills show that 6.2% or 99 of the total 1,590 families live below the poverty line. Families with 1 or 2 children have the highest poverty rate of 14.9%, comprising of 78 families. On the other hand, families with 3 or 4 children have the lowest poverty rate of 0.0%, which includes 0 families.
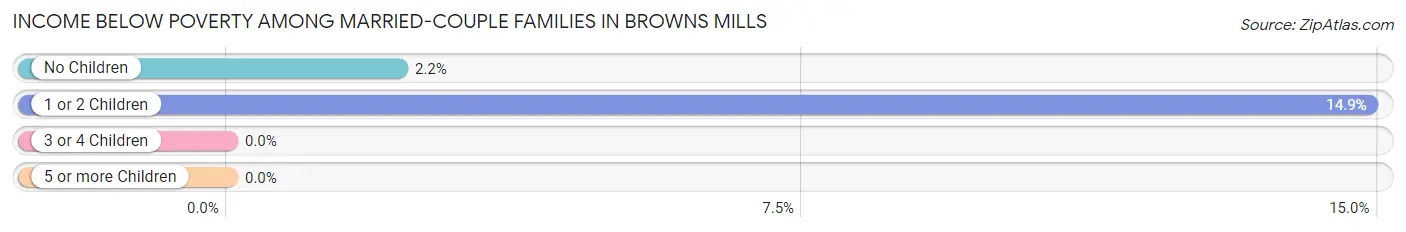
| Children | Above Poverty | Below Poverty |
| No Children | 926 (97.8%) | 21 (2.2%) |
| 1 or 2 Children | 446 (85.1%) | 78 (14.9%) |
| 3 or 4 Children | 119 (100.0%) | 0 (0.0%) |
| 5 or more Children | 0 (0.0%) | 0 (0.0%) |
| Total | 1,491 (93.8%) | 99 (6.2%) |
Income Below Poverty Among Single-Parent Households in Browns Mills
According to the poverty data in Browns Mills, 5.2% or 11 single-father households and 21.4% or 133 single-mother households are living below the poverty line. Among single-father households, those with 3 or 4 children have the highest poverty rate, with 7 households (43.8%) experiencing poverty. Likewise, among single-mother households, those with 3 or 4 children have the highest poverty rate, with 80 households (76.2%) falling below the poverty line.
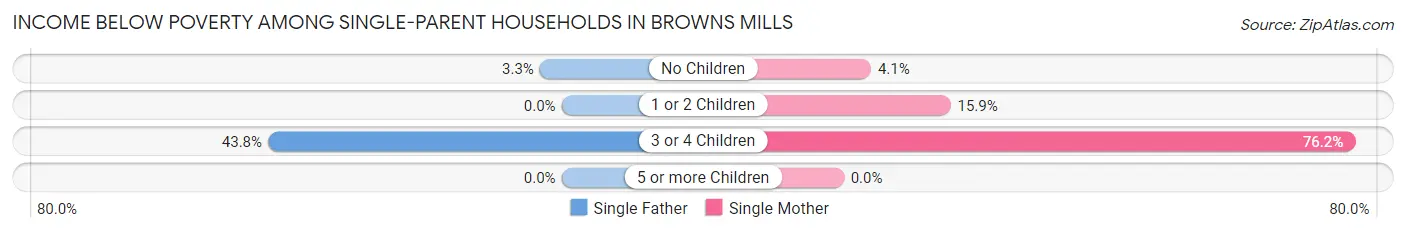
| Children | Single Father | Single Mother |
| No Children | 4 (3.3%) | 10 (4.1%) |
| 1 or 2 Children | 0 (0.0%) | 43 (15.9%) |
| 3 or 4 Children | 7 (43.8%) | 80 (76.2%) |
| 5 or more Children | 0 (0.0%) | 0 (0.0%) |
| Total | 11 (5.2%) | 133 (21.4%) |
Income Below Poverty Among Married-Couple vs Single-Parent Households in Browns Mills
The poverty data for Browns Mills shows that 99 of the married-couple family households (6.2%) and 144 of the single-parent households (17.3%) are living below the poverty level. Within the married-couple family households, those with 1 or 2 children have the highest poverty rate, with 78 households (14.9%) falling below the poverty line. Among the single-parent households, those with 3 or 4 children have the highest poverty rate, with 87 household (71.9%) living below poverty.
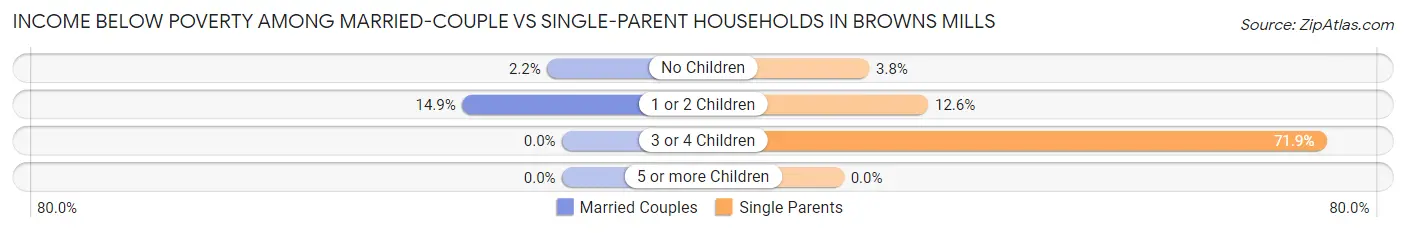
| Children | Married-Couple Families | Single-Parent Households |
| No Children | 21 (2.2%) | 14 (3.8%) |
| 1 or 2 Children | 78 (14.9%) | 43 (12.6%) |
| 3 or 4 Children | 0 (0.0%) | 87 (71.9%) |
| 5 or more Children | 0 (0.0%) | 0 (0.0%) |
| Total | 99 (6.2%) | 144 (17.3%) |
Race in Browns Mills
The most populous races in Browns Mills are White / Caucasian (7,045 | 70.0%), Hispanic or Latino (1,193 | 11.9%), and Black / African American (1,171 | 11.6%).
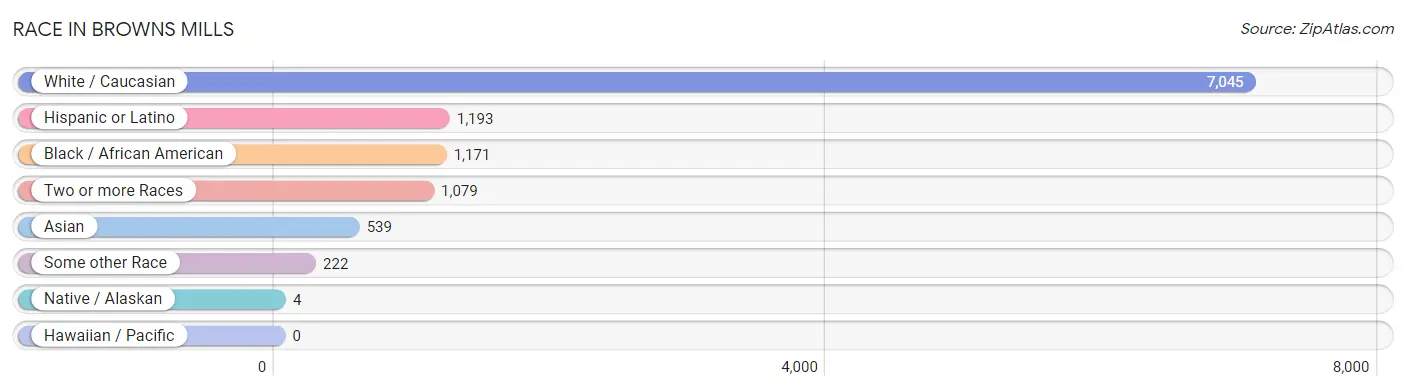
| Race | # Population | % Population |
| Asian | 539 | 5.4% |
| Black / African American | 1,171 | 11.6% |
| Hawaiian / Pacific | 0 | 0.0% |
| Hispanic or Latino | 1,193 | 11.9% |
| Native / Alaskan | 4 | 0.0% |
| White / Caucasian | 7,045 | 70.0% |
| Two or more Races | 1,079 | 10.7% |
| Some other Race | 222 | 2.2% |
| Total | 10,060 | 100.0% |
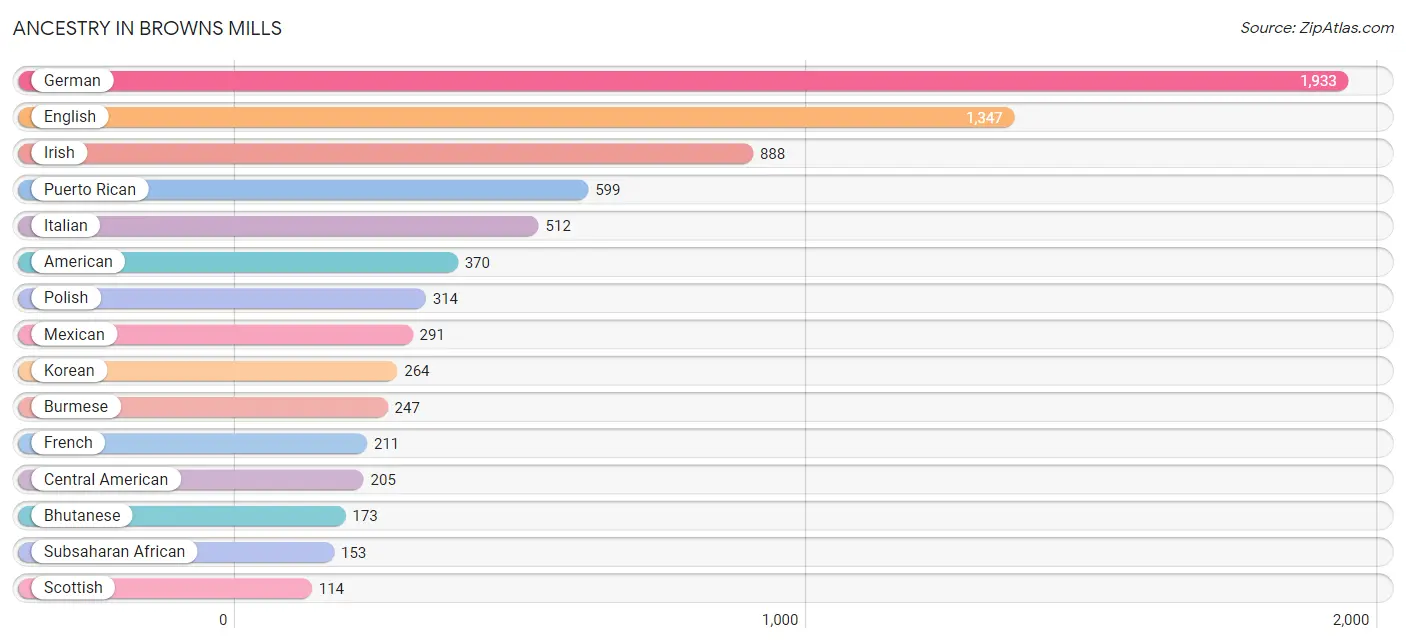
Ancestry in Browns Mills
The most populous ancestries reported in Browns Mills are German (1,933 | 19.2%), English (1,347 | 13.4%), Irish (888 | 8.8%), Puerto Rican (599 | 5.9%), and Italian (512 | 5.1%), together accounting for 52.5% of all Browns Mills residents.
| Ancestry | # Population | % Population |
| African | 64 | 0.6% |
| American | 370 | 3.7% |
| Argentinean | 32 | 0.3% |
| Bhutanese | 173 | 1.7% |
| Blackfeet | 10 | 0.1% |
| Brazilian | 52 | 0.5% |
| British | 40 | 0.4% |
| British West Indian | 3 | 0.0% |
| Burmese | 247 | 2.5% |
| Central American | 205 | 2.0% |
| Cherokee | 35 | 0.4% |
| Chickasaw | 1 | 0.0% |
| Cuban | 14 | 0.1% |
| Dominican | 13 | 0.1% |
| Dutch | 72 | 0.7% |
| English | 1,347 | 13.4% |
| European | 8 | 0.1% |
| Finnish | 29 | 0.3% |
| French | 211 | 2.1% |
| French Canadian | 21 | 0.2% |
| German | 1,933 | 19.2% |
| Guatemalan | 54 | 0.5% |
| Hungarian | 92 | 0.9% |
| Indian (Asian) | 96 | 0.9% |
| Irish | 888 | 8.8% |
| Italian | 512 | 5.1% |
| Jamaican | 27 | 0.3% |
| Korean | 264 | 2.6% |
| Lithuanian | 9 | 0.1% |
| Mexican | 291 | 2.9% |
| Mexican American Indian | 91 | 0.9% |
| Nigerian | 34 | 0.3% |
| Norwegian | 45 | 0.4% |
| Pakistani | 37 | 0.4% |
| Panamanian | 60 | 0.6% |
| Pennsylvania German | 17 | 0.2% |
| Peruvian | 29 | 0.3% |
| Polish | 314 | 3.1% |
| Portuguese | 82 | 0.8% |
| Puerto Rican | 599 | 5.9% |
| Romanian | 6 | 0.1% |
| Russian | 88 | 0.9% |
| Salvadoran | 91 | 0.9% |
| Scandinavian | 47 | 0.5% |
| Scotch-Irish | 45 | 0.4% |
| Scottish | 114 | 1.1% |
| Slovak | 50 | 0.5% |
| South American | 61 | 0.6% |
| Spanish | 10 | 0.1% |
| Sri Lankan | 92 | 0.9% |
| Subsaharan African | 153 | 1.5% |
| Swedish | 13 | 0.1% |
| Turkish | 14 | 0.1% |
| Ukrainian | 35 | 0.4% |
| Welsh | 31 | 0.3% |
| West Indian | 48 | 0.5% | View All 56 Rows |
Immigrants in Browns Mills
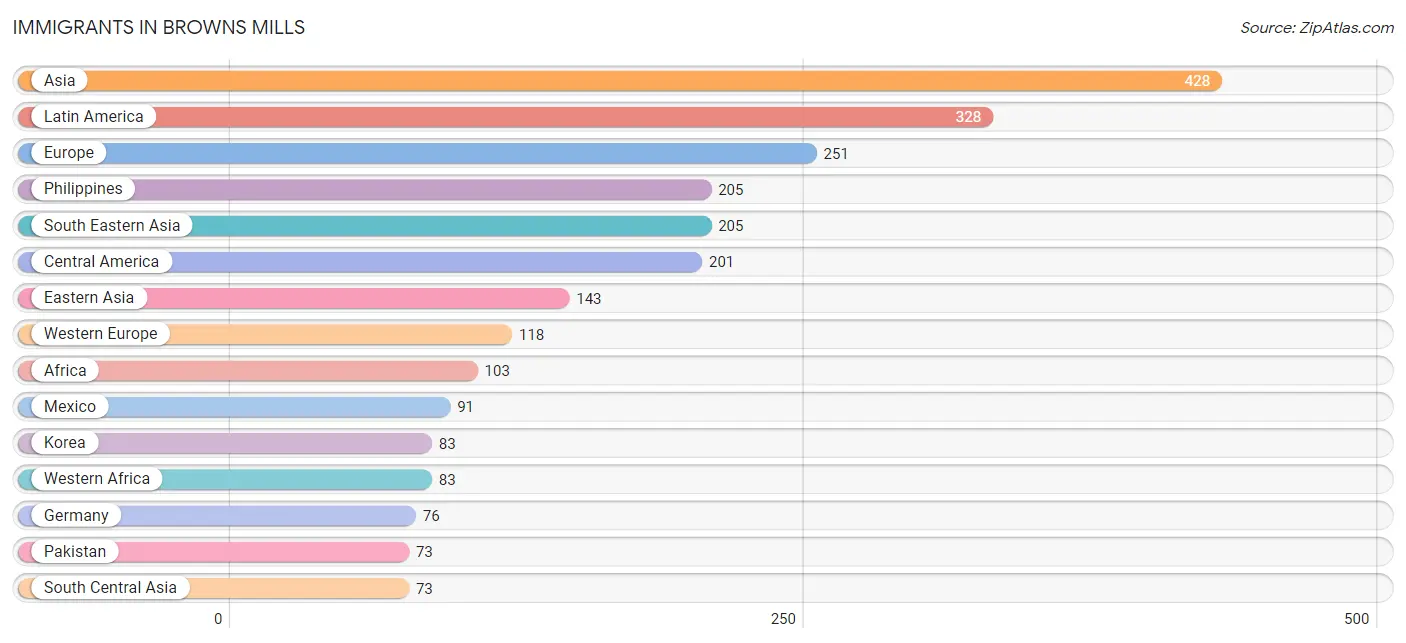
The most numerous immigrant groups reported in Browns Mills came from Asia (428 | 4.3%), Latin America (328 | 3.3%), Europe (251 | 2.5%), Philippines (205 | 2.0%), and South Eastern Asia (205 | 2.0%), together accounting for 14.1% of all Browns Mills residents.
| Immigration Origin | # Population | % Population |
| Africa | 103 | 1.0% |
| Asia | 428 | 4.3% |
| Brazil | 38 | 0.4% |
| Caribbean | 60 | 0.6% |
| Central America | 201 | 2.0% |
| China | 6 | 0.1% |
| Eastern Asia | 143 | 1.4% |
| Egypt | 20 | 0.2% |
| El Salvador | 30 | 0.3% |
| England | 64 | 0.6% |
| Europe | 251 | 2.5% |
| France | 42 | 0.4% |
| Germany | 76 | 0.8% |
| Guatemala | 54 | 0.5% |
| Haiti | 57 | 0.6% |
| Italy | 25 | 0.3% |
| Japan | 54 | 0.5% |
| Korea | 83 | 0.8% |
| Latin America | 328 | 3.3% |
| Mexico | 91 | 0.9% |
| Nigeria | 34 | 0.3% |
| Northern Africa | 20 | 0.2% |
| Northern Europe | 64 | 0.6% |
| Pakistan | 73 | 0.7% |
| Panama | 26 | 0.3% |
| Peru | 29 | 0.3% |
| Philippines | 205 | 2.0% |
| Portugal | 44 | 0.4% |
| Sierra Leone | 22 | 0.2% |
| South America | 67 | 0.7% |
| South Central Asia | 73 | 0.7% |
| South Eastern Asia | 205 | 2.0% |
| Southern Europe | 69 | 0.7% |
| Turkey | 7 | 0.1% |
| Western Africa | 83 | 0.8% |
| Western Asia | 7 | 0.1% |
| Western Europe | 118 | 1.2% | View All 37 Rows |
Sex and Age in Browns Mills
Sex and Age in Browns Mills
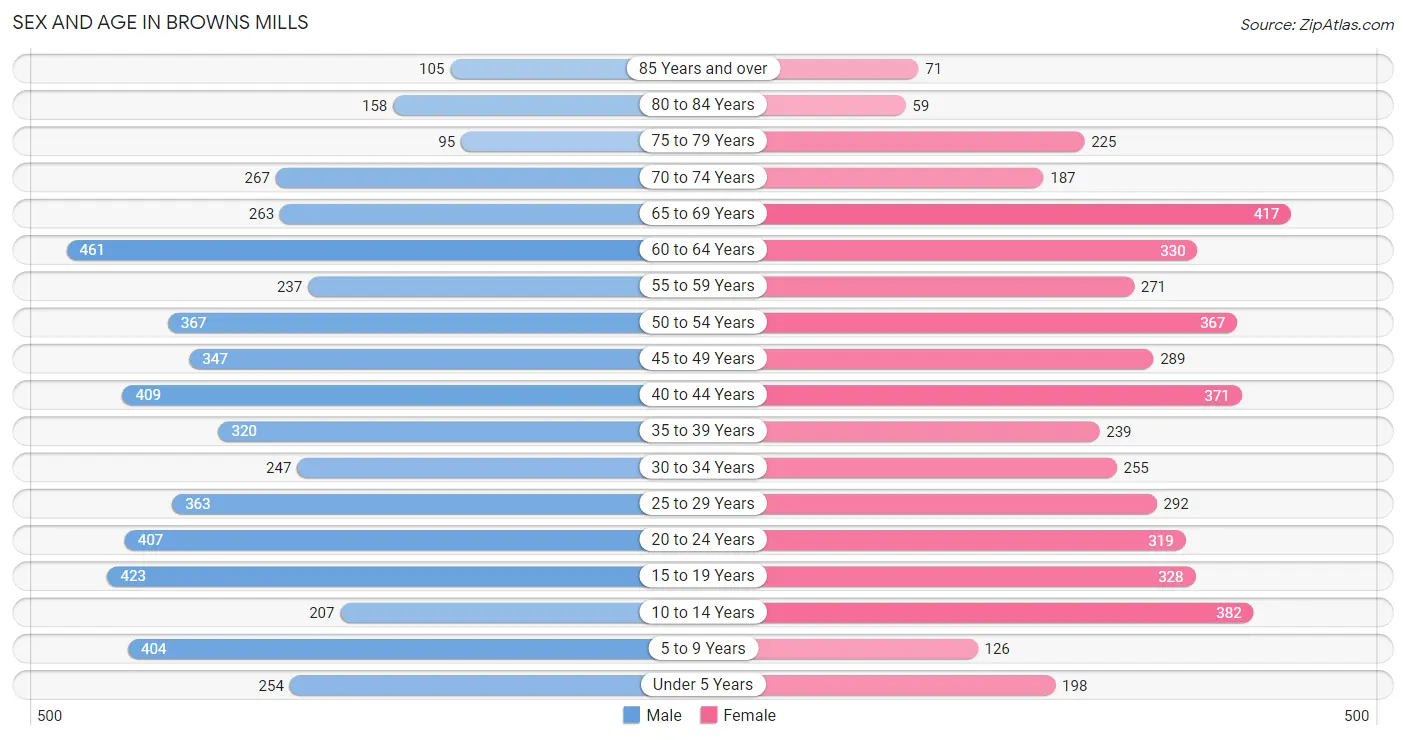
The most populous age groups in Browns Mills are 60 to 64 Years (461 | 8.6%) for men and 65 to 69 Years (417 | 8.8%) for women.
| Age Bracket | Male | Female |
| Under 5 Years | 254 (4.8%) | 198 (4.2%) |
| 5 to 9 Years | 404 (7.6%) | 126 (2.7%) |
| 10 to 14 Years | 207 (3.9%) | 382 (8.1%) |
| 15 to 19 Years | 423 (7.9%) | 328 (6.9%) |
| 20 to 24 Years | 407 (7.6%) | 319 (6.8%) |
| 25 to 29 Years | 363 (6.8%) | 292 (6.2%) |
| 30 to 34 Years | 247 (4.6%) | 255 (5.4%) |
| 35 to 39 Years | 320 (6.0%) | 239 (5.1%) |
| 40 to 44 Years | 409 (7.7%) | 371 (7.9%) |
| 45 to 49 Years | 347 (6.5%) | 289 (6.1%) |
| 50 to 54 Years | 367 (6.9%) | 367 (7.8%) |
| 55 to 59 Years | 237 (4.4%) | 271 (5.7%) |
| 60 to 64 Years | 461 (8.6%) | 330 (7.0%) |
| 65 to 69 Years | 263 (4.9%) | 417 (8.8%) |
| 70 to 74 Years | 267 (5.0%) | 187 (4.0%) |
| 75 to 79 Years | 95 (1.8%) | 225 (4.8%) |
| 80 to 84 Years | 158 (3.0%) | 59 (1.3%) |
| 85 Years and over | 105 (2.0%) | 71 (1.5%) |
| Total | 5,334 (100.0%) | 4,726 (100.0%) |
Families and Households in Browns Mills
Median Family Size in Browns Mills
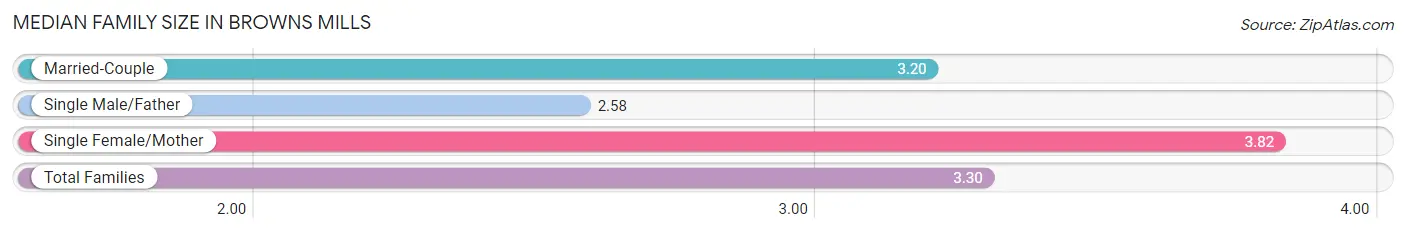
The median family size in Browns Mills is 3.30 persons per family, with single female/mother families (621 | 25.6%) accounting for the largest median family size of 3.82 persons per family. On the other hand, single male/father families (211 | 8.7%) represent the smallest median family size with 2.58 persons per family.
| Family Type | # Families | Family Size |
| Married-Couple | 1,590 (65.6%) | 3.20 |
| Single Male/Father | 211 (8.7%) | 2.58 |
| Single Female/Mother | 621 (25.6%) | 3.82 |
| Total Families | 2,422 (100.0%) | 3.30 |
Median Household Size in Browns Mills
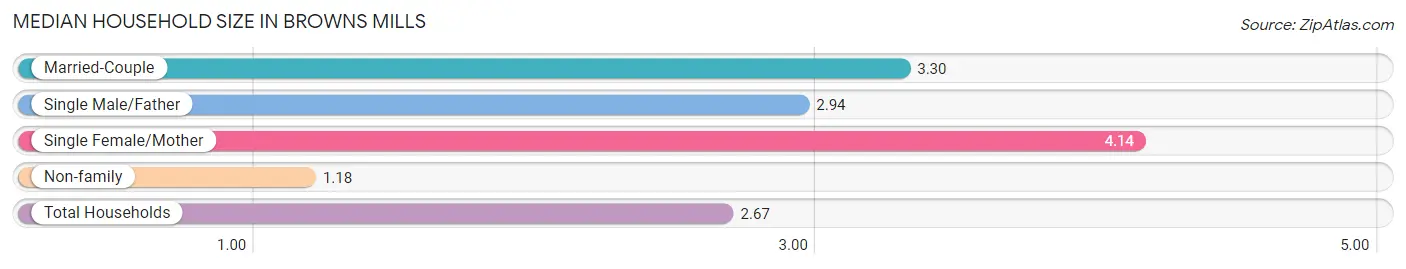
The median household size in Browns Mills is 2.67 persons per household, with single female/mother households (621 | 16.6%) accounting for the largest median household size of 4.14 persons per household. non-family households (1,327 | 35.4%) represent the smallest median household size with 1.18 persons per household.
| Household Type | # Households | Household Size |
| Married-Couple | 1,590 (42.4%) | 3.30 |
| Single Male/Father | 211 (5.6%) | 2.94 |
| Single Female/Mother | 621 (16.6%) | 4.14 |
| Non-family | 1,327 (35.4%) | 1.18 |
| Total Households | 3,749 (100.0%) | 2.67 |
Household Size by Marriage Status in Browns Mills
Out of a total of 3,749 households in Browns Mills, 2,422 (64.6%) are family households, while 1,327 (35.4%) are nonfamily households. The most numerous type of family households are 2-person households, comprising 929, and the most common type of nonfamily households are 1-person households, comprising 1,114.
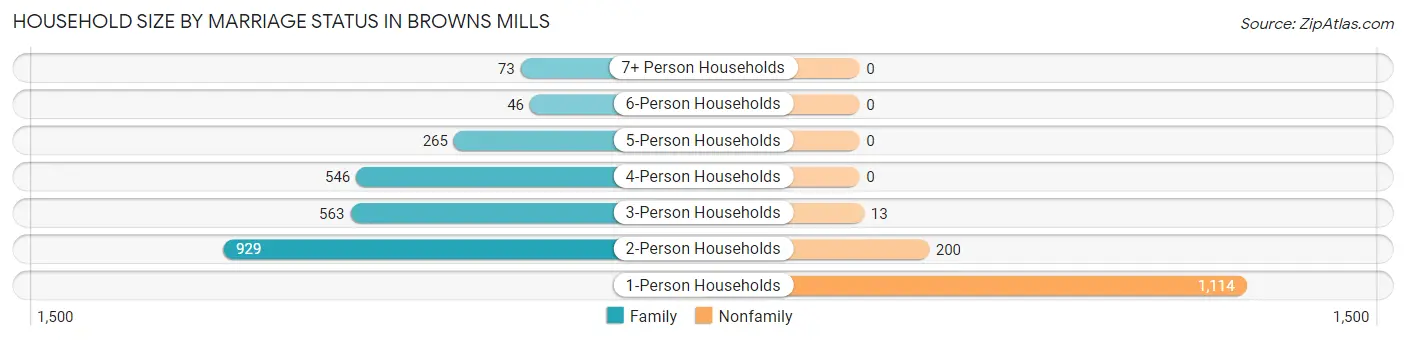
| Household Size | Family Households | Nonfamily Households |
| 1-Person Households | - | 1,114 (29.7%) |
| 2-Person Households | 929 (24.8%) | 200 (5.3%) |
| 3-Person Households | 563 (15.0%) | 13 (0.4%) |
| 4-Person Households | 546 (14.6%) | 0 (0.0%) |
| 5-Person Households | 265 (7.1%) | 0 (0.0%) |
| 6-Person Households | 46 (1.2%) | 0 (0.0%) |
| 7+ Person Households | 73 (1.9%) | 0 (0.0%) |
| Total | 2,422 (64.6%) | 1,327 (35.4%) |
Female Fertility in Browns Mills
Fertility by Age in Browns Mills
Average fertility rate in Browns Mills is 45.0 births per 1,000 women. Women in the age bracket of 20 to 34 years have the highest fertility rate with 114.0 births per 1,000 women. Women in the age bracket of 20 to 34 years acount for 100.0% of all women with births.
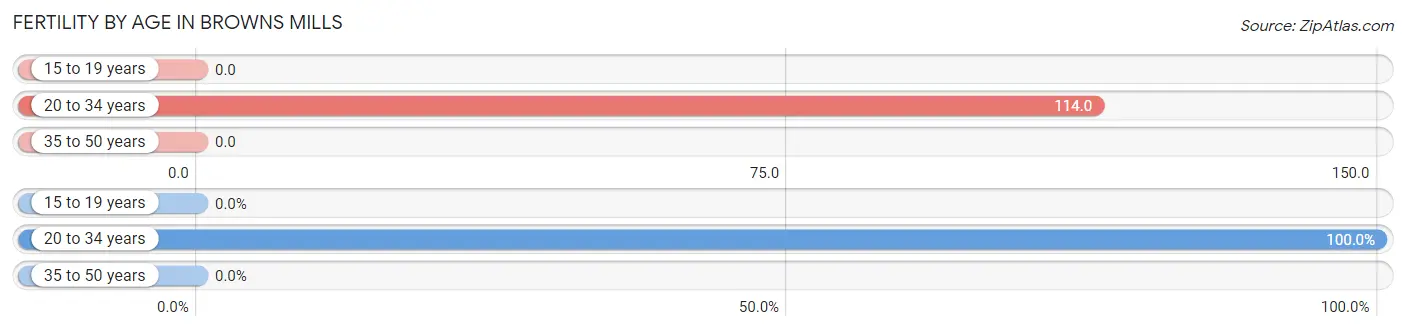
| Age Bracket | Women with Births | Births / 1,000 Women |
| 15 to 19 years | 0 (0.0%) | 0.0 |
| 20 to 34 years | 99 (100.0%) | 114.0 |
| 35 to 50 years | 0 (0.0%) | 0.0 |
| Total | 99 (100.0%) | 45.0 |
Fertility by Age by Marriage Status in Browns Mills
57.6% of women with births (99) in Browns Mills are married. The highest percentage of unmarried women with births falls into 20 to 34 years age bracket with 42.4% of them unmarried at the time of birth, while the lowest percentage of unmarried women with births belong to 20 to 34 years age bracket with 42.4% of them unmarried.
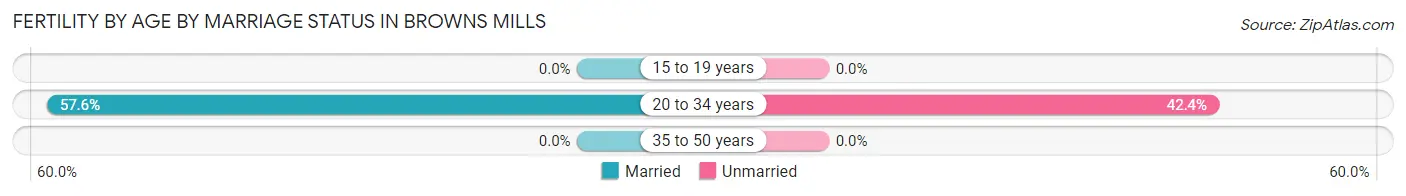
| Age Bracket | Married | Unmarried |
| 15 to 19 years | 0 (0.0%) | 0 (0.0%) |
| 20 to 34 years | 57 (57.6%) | 42 (42.4%) |
| 35 to 50 years | 0 (0.0%) | 0 (0.0%) |
| Total | 57 (57.6%) | 42 (42.4%) |
Fertility by Education in Browns Mills
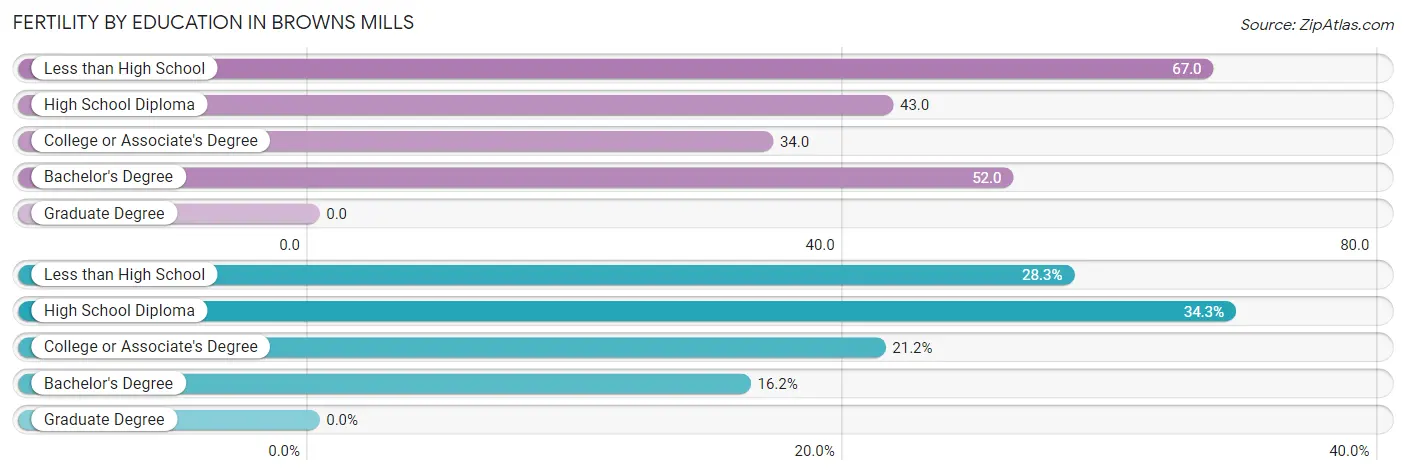
| Educational Attainment | Women with Births | Births / 1,000 Women |
| Less than High School | 28 (28.3%) | 67.0 |
| High School Diploma | 34 (34.3%) | 43.0 |
| College or Associate's Degree | 21 (21.2%) | 34.0 |
| Bachelor's Degree | 16 (16.2%) | 52.0 |
| Graduate Degree | 0 (0.0%) | 0.0 |
| Total | 99 (100.0%) | 45.0 |
Fertility by Education by Marriage Status in Browns Mills
42.4% of women with births in Browns Mills are unmarried. Women with the educational attainment of less than high school are most likely to be married with 100.0% of them married at childbirth, while women with the educational attainment of college or associate's degree are least likely to be married with 100.0% of them unmarried at childbirth.
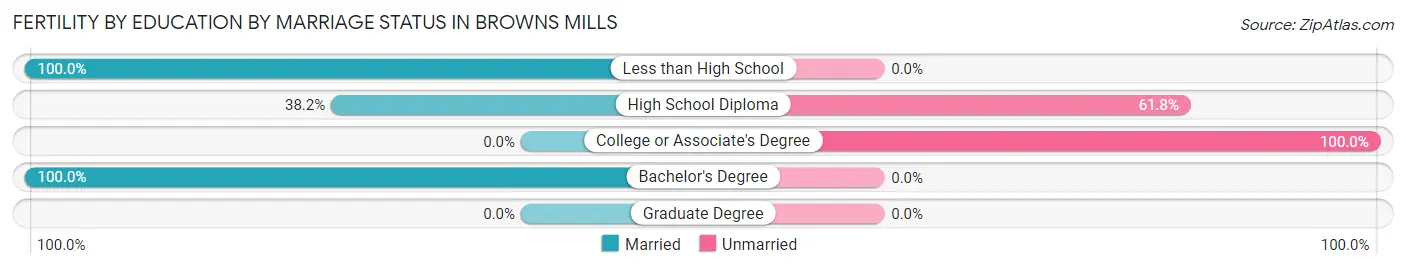
| Educational Attainment | Married | Unmarried |
| Less than High School | 28 (100.0%) | 0 (0.0%) |
| High School Diploma | 13 (38.2%) | 21 (61.8%) |
| College or Associate's Degree | 0 (0.0%) | 21 (100.0%) |
| Bachelor's Degree | 16 (100.0%) | 0 (0.0%) |
| Graduate Degree | 0 (0.0%) | 0 (0.0%) |
| Total | 57 (57.6%) | 42 (42.4%) |
Employment Characteristics in Browns Mills
Employment by Class of Employer in Browns Mills
Among the 4,507 employed individuals in Browns Mills, private company employees (2,724 | 60.4%), federal government employees (529 | 11.7%), and not-for-profit organizations (457 | 10.1%) make up the most common classes of employment.
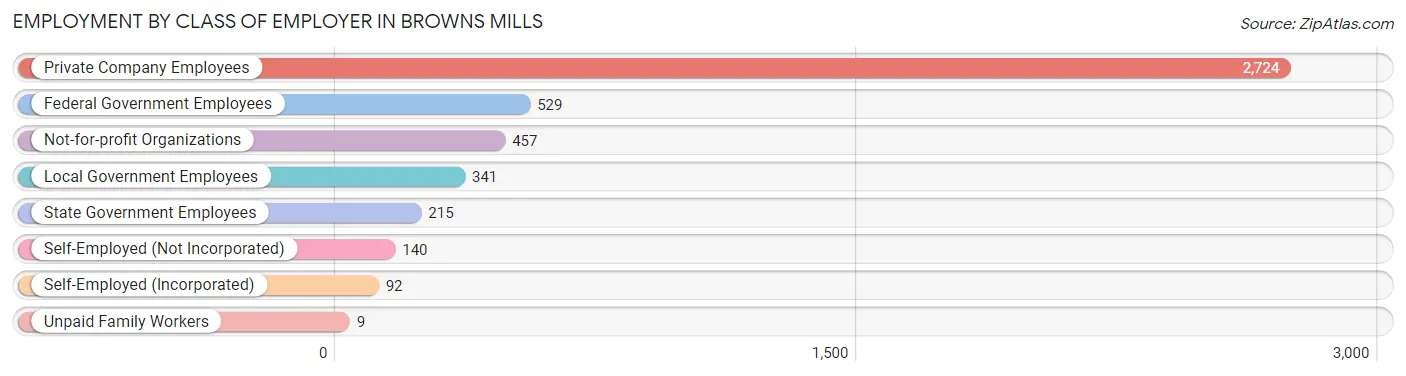
| Employer Class | # Employees | % Employees |
| Private Company Employees | 2,724 | 60.4% |
| Self-Employed (Incorporated) | 92 | 2.0% |
| Self-Employed (Not Incorporated) | 140 | 3.1% |
| Not-for-profit Organizations | 457 | 10.1% |
| Local Government Employees | 341 | 7.6% |
| State Government Employees | 215 | 4.8% |
| Federal Government Employees | 529 | 11.7% |
| Unpaid Family Workers | 9 | 0.2% |
| Total | 4,507 | 100.0% |
Employment Status by Age in Browns Mills
According to the labor force statistics for Browns Mills, out of the total population over 16 years of age (8,334), 60.8% or 5,067 individuals are in the labor force, with 9.3% or 471 of them unemployed. The age group with the highest labor force participation rate is 25 to 29 years, with 90.2% or 591 individuals in the labor force. Within the labor force, the 45 to 54 years age range has the highest percentage of unemployed individuals, with 13.9% or 153 of them being unemployed.
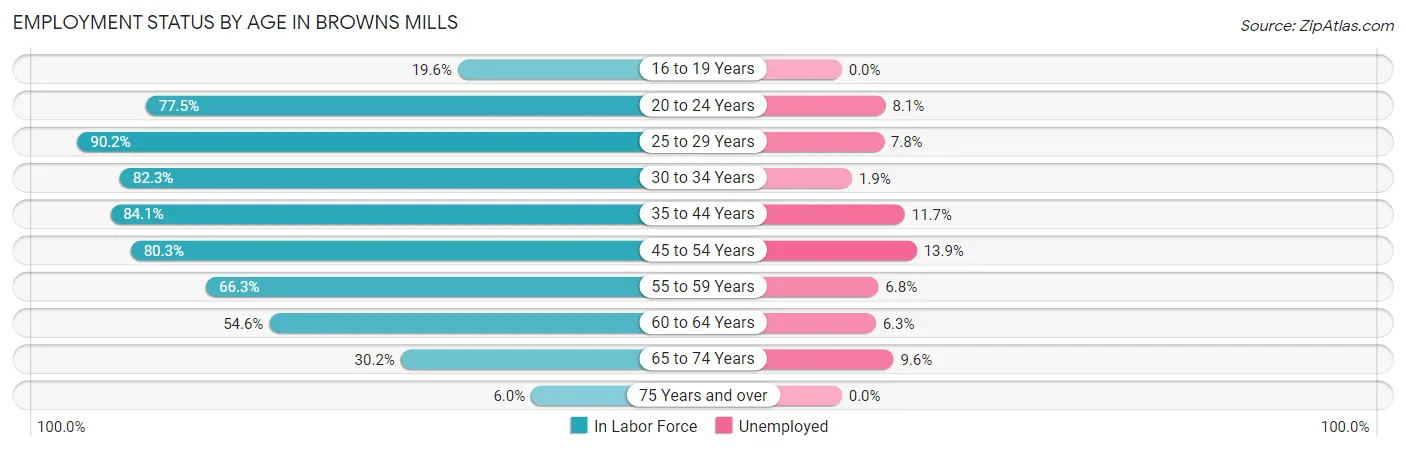
| Age Bracket | In Labor Force | Unemployed |
| 16 to 19 Years | 117 (19.6%) | 0 (0.0%) |
| 20 to 24 Years | 563 (77.5%) | 46 (8.1%) |
| 25 to 29 Years | 591 (90.2%) | 46 (7.8%) |
| 30 to 34 Years | 413 (82.3%) | 8 (1.9%) |
| 35 to 44 Years | 1,126 (84.1%) | 132 (11.7%) |
| 45 to 54 Years | 1,100 (80.3%) | 153 (13.9%) |
| 55 to 59 Years | 337 (66.3%) | 23 (6.8%) |
| 60 to 64 Years | 432 (54.6%) | 27 (6.3%) |
| 65 to 74 Years | 342 (30.2%) | 33 (9.6%) |
| 75 Years and over | 43 (6.0%) | 0 (0.0%) |
| Total | 5,067 (60.8%) | 471 (9.3%) |
Employment Status by Educational Attainment in Browns Mills
According to labor force statistics for Browns Mills, 77.4% of individuals (3,998) out of the total population between 25 and 64 years of age (5,165) are in the labor force, with 9.8% or 392 of them being unemployed. The group with the highest labor force participation rate are those with the educational attainment of bachelor's degree or higher, with 89.5% or 807 individuals in the labor force. Within the labor force, individuals with less than high school education have the highest percentage of unemployment, with 25.8% or 89 of them being unemployed.
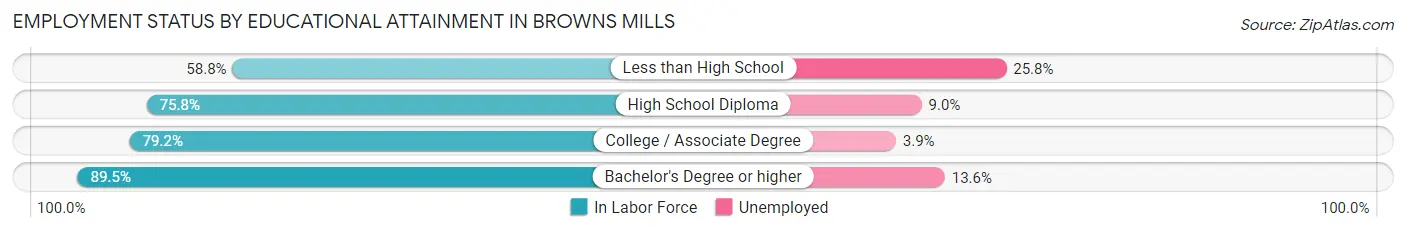
| Educational Attainment | In Labor Force | Unemployed |
| Less than High School | 345 (58.8%) | 151 (25.8%) |
| High School Diploma | 1,452 (75.8%) | 172 (9.0%) |
| College / Associate Degree | 1,394 (79.2%) | 69 (3.9%) |
| Bachelor's Degree or higher | 807 (89.5%) | 123 (13.6%) |
| Total | 3,998 (77.4%) | 506 (9.8%) |
Employment Occupations by Sex in Browns Mills
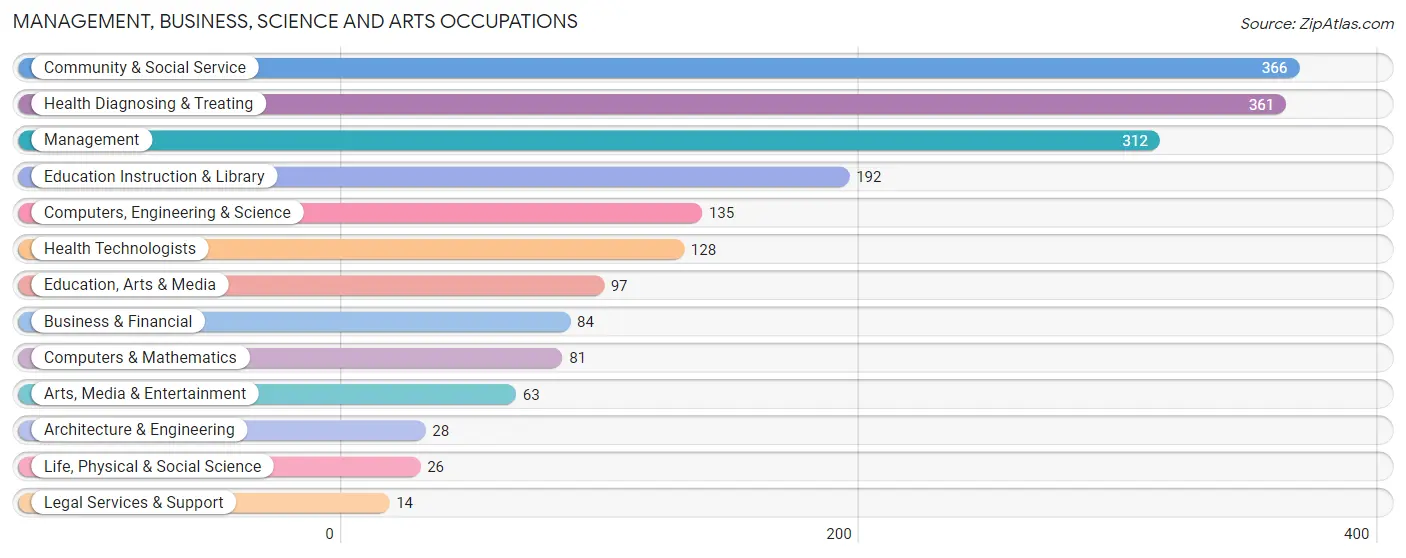
Management, Business, Science and Arts Occupations
The most common Management, Business, Science and Arts occupations in Browns Mills are Community & Social Service (366 | 8.3%), Health Diagnosing & Treating (361 | 8.2%), Management (312 | 7.1%), Education Instruction & Library (192 | 4.4%), and Computers, Engineering & Science (135 | 3.1%).
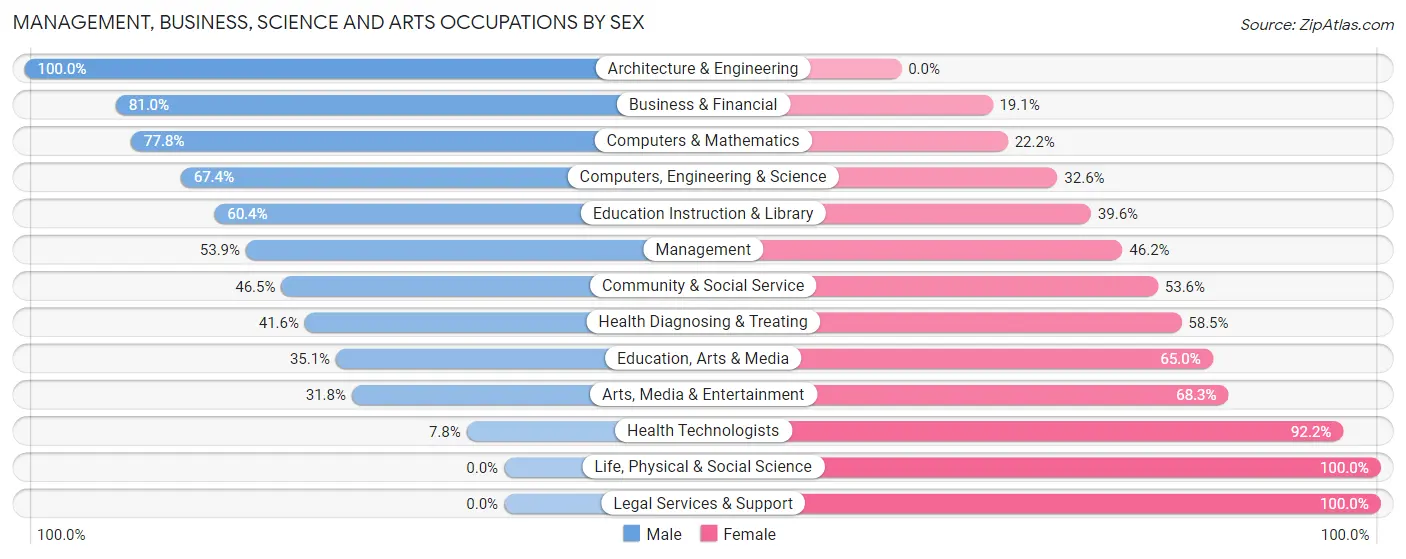
Management, Business, Science and Arts Occupations by Sex
Within the Management, Business, Science and Arts occupations in Browns Mills, the most male-oriented occupations are Architecture & Engineering (100.0%), Business & Financial (80.9%), and Computers & Mathematics (77.8%), while the most female-oriented occupations are Life, Physical & Social Science (100.0%), Legal Services & Support (100.0%), and Health Technologists (92.2%).
| Occupation | Male | Female |
| Management | 168 (53.8%) | 144 (46.2%) |
| Business & Financial | 68 (80.9%) | 16 (19.1%) |
| Computers, Engineering & Science | 91 (67.4%) | 44 (32.6%) |
| Computers & Mathematics | 63 (77.8%) | 18 (22.2%) |
| Architecture & Engineering | 28 (100.0%) | 0 (0.0%) |
| Life, Physical & Social Science | 0 (0.0%) | 26 (100.0%) |
| Community & Social Service | 170 (46.5%) | 196 (53.5%) |
| Education, Arts & Media | 34 (35.0%) | 63 (64.9%) |
| Legal Services & Support | 0 (0.0%) | 14 (100.0%) |
| Education Instruction & Library | 116 (60.4%) | 76 (39.6%) |
| Arts, Media & Entertainment | 20 (31.8%) | 43 (68.2%) |
| Health Diagnosing & Treating | 150 (41.5%) | 211 (58.5%) |
| Health Technologists | 10 (7.8%) | 118 (92.2%) |
| Total (Category) | 647 (51.4%) | 611 (48.6%) |
| Total (Overall) | 2,340 (53.3%) | 2,046 (46.7%) |
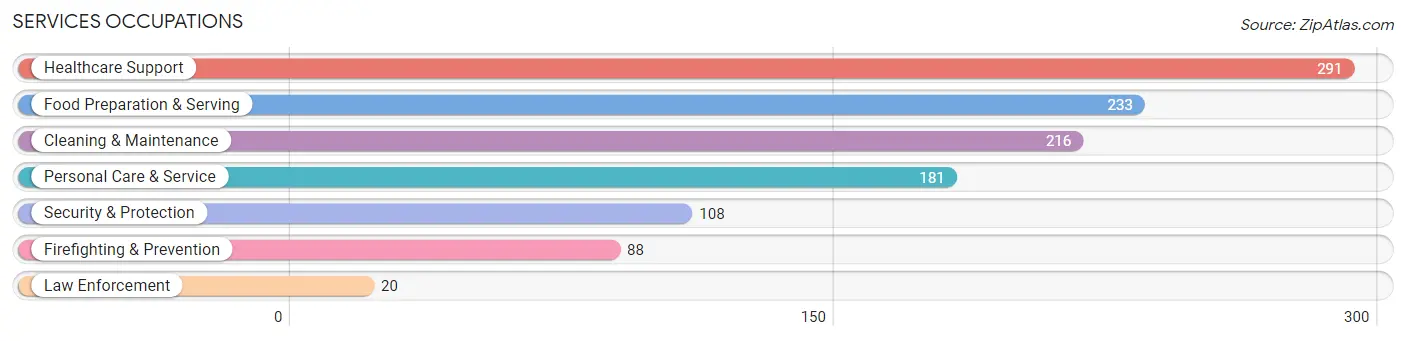
Services Occupations
The most common Services occupations in Browns Mills are Healthcare Support (291 | 6.6%), Food Preparation & Serving (233 | 5.3%), Cleaning & Maintenance (216 | 4.9%), Personal Care & Service (181 | 4.1%), and Security & Protection (108 | 2.5%).
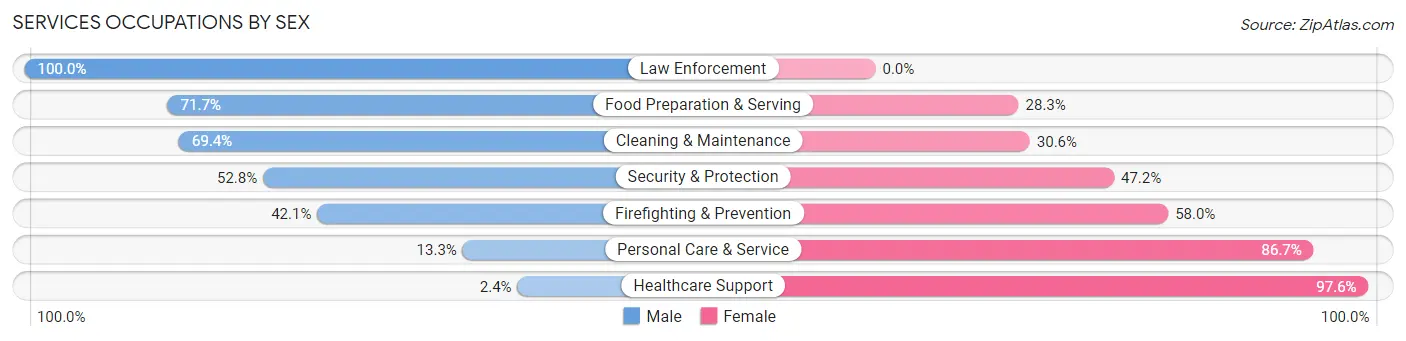
Services Occupations by Sex
Within the Services occupations in Browns Mills, the most male-oriented occupations are Law Enforcement (100.0%), Food Preparation & Serving (71.7%), and Cleaning & Maintenance (69.4%), while the most female-oriented occupations are Healthcare Support (97.6%), Personal Care & Service (86.7%), and Firefighting & Prevention (58.0%).
| Occupation | Male | Female |
| Healthcare Support | 7 (2.4%) | 284 (97.6%) |
| Security & Protection | 57 (52.8%) | 51 (47.2%) |
| Firefighting & Prevention | 37 (42.0%) | 51 (58.0%) |
| Law Enforcement | 20 (100.0%) | 0 (0.0%) |
| Food Preparation & Serving | 167 (71.7%) | 66 (28.3%) |
| Cleaning & Maintenance | 150 (69.4%) | 66 (30.6%) |
| Personal Care & Service | 24 (13.3%) | 157 (86.7%) |
| Total (Category) | 405 (39.4%) | 624 (60.6%) |
| Total (Overall) | 2,340 (53.3%) | 2,046 (46.7%) |
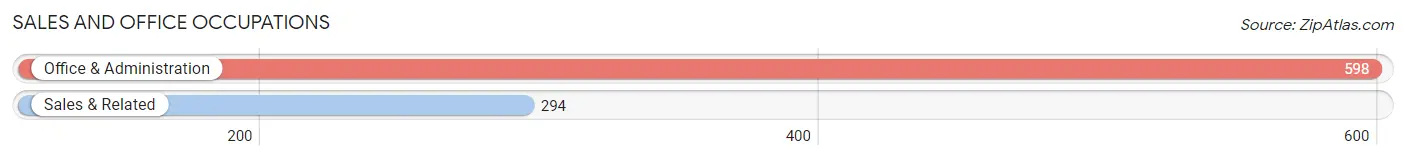
Sales and Office Occupations
The most common Sales and Office occupations in Browns Mills are Office & Administration (598 | 13.6%), and Sales & Related (294 | 6.7%).
Sales and Office Occupations by Sex
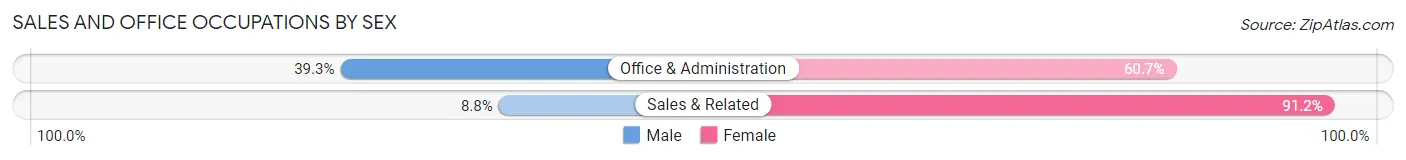
| Occupation | Male | Female |
| Sales & Related | 26 (8.8%) | 268 (91.2%) |
| Office & Administration | 235 (39.3%) | 363 (60.7%) |
| Total (Category) | 261 (29.3%) | 631 (70.7%) |
| Total (Overall) | 2,340 (53.3%) | 2,046 (46.7%) |
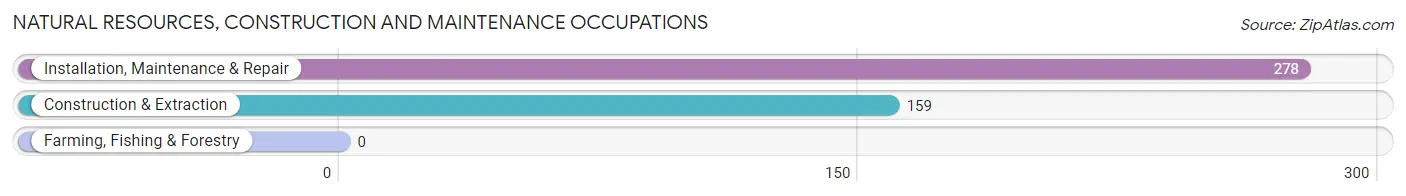
Natural Resources, Construction and Maintenance Occupations
The most common Natural Resources, Construction and Maintenance occupations in Browns Mills are Installation, Maintenance & Repair (278 | 6.3%), and Construction & Extraction (159 | 3.6%).
Natural Resources, Construction and Maintenance Occupations by Sex
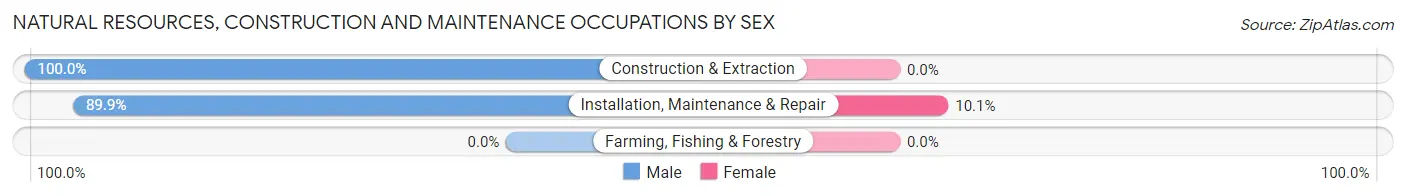
| Occupation | Male | Female |
| Farming, Fishing & Forestry | 0 (0.0%) | 0 (0.0%) |
| Construction & Extraction | 159 (100.0%) | 0 (0.0%) |
| Installation, Maintenance & Repair | 250 (89.9%) | 28 (10.1%) |
| Total (Category) | 409 (93.6%) | 28 (6.4%) |
| Total (Overall) | 2,340 (53.3%) | 2,046 (46.7%) |
Production, Transportation and Moving Occupations
The most common Production, Transportation and Moving occupations in Browns Mills are Production (327 | 7.5%), Material Moving (241 | 5.5%), and Transportation (202 | 4.6%).
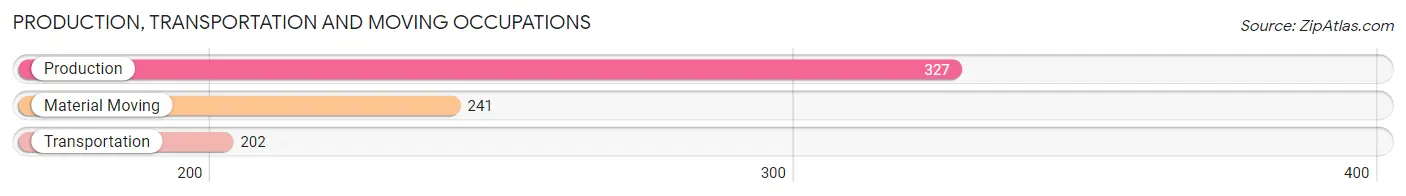
Production, Transportation and Moving Occupations by Sex
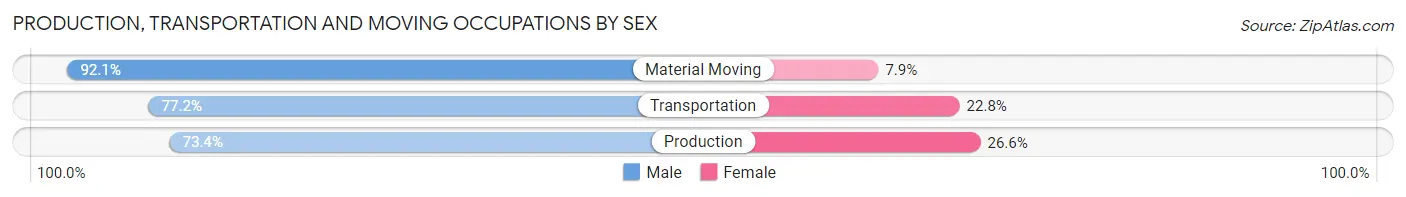
| Occupation | Male | Female |
| Production | 240 (73.4%) | 87 (26.6%) |
| Transportation | 156 (77.2%) | 46 (22.8%) |
| Material Moving | 222 (92.1%) | 19 (7.9%) |
| Total (Category) | 618 (80.3%) | 152 (19.7%) |
| Total (Overall) | 2,340 (53.3%) | 2,046 (46.7%) |
Employment Industries by Sex in Browns Mills
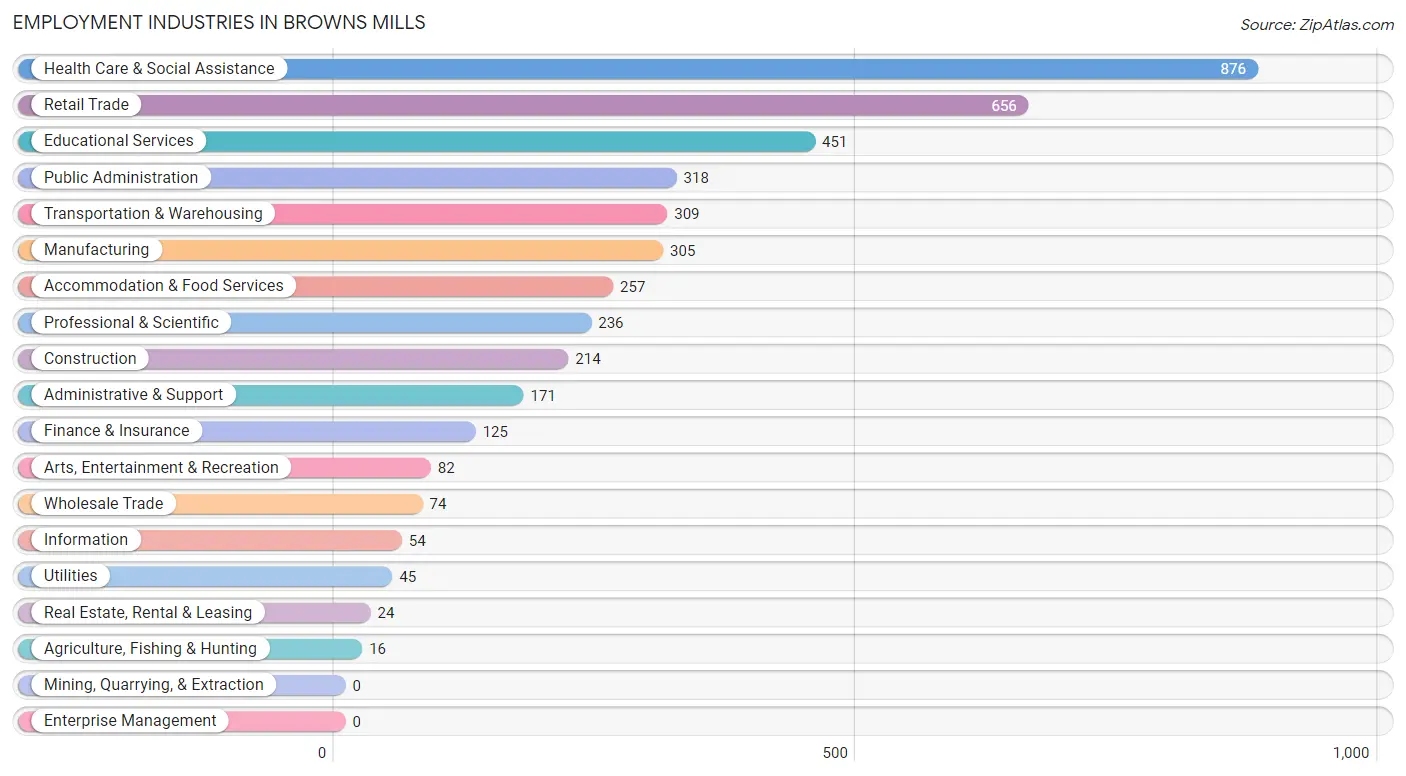
Employment Industries in Browns Mills
The major employment industries in Browns Mills include Health Care & Social Assistance (876 | 20.0%), Retail Trade (656 | 15.0%), Educational Services (451 | 10.3%), Public Administration (318 | 7.2%), and Transportation & Warehousing (309 | 7.0%).
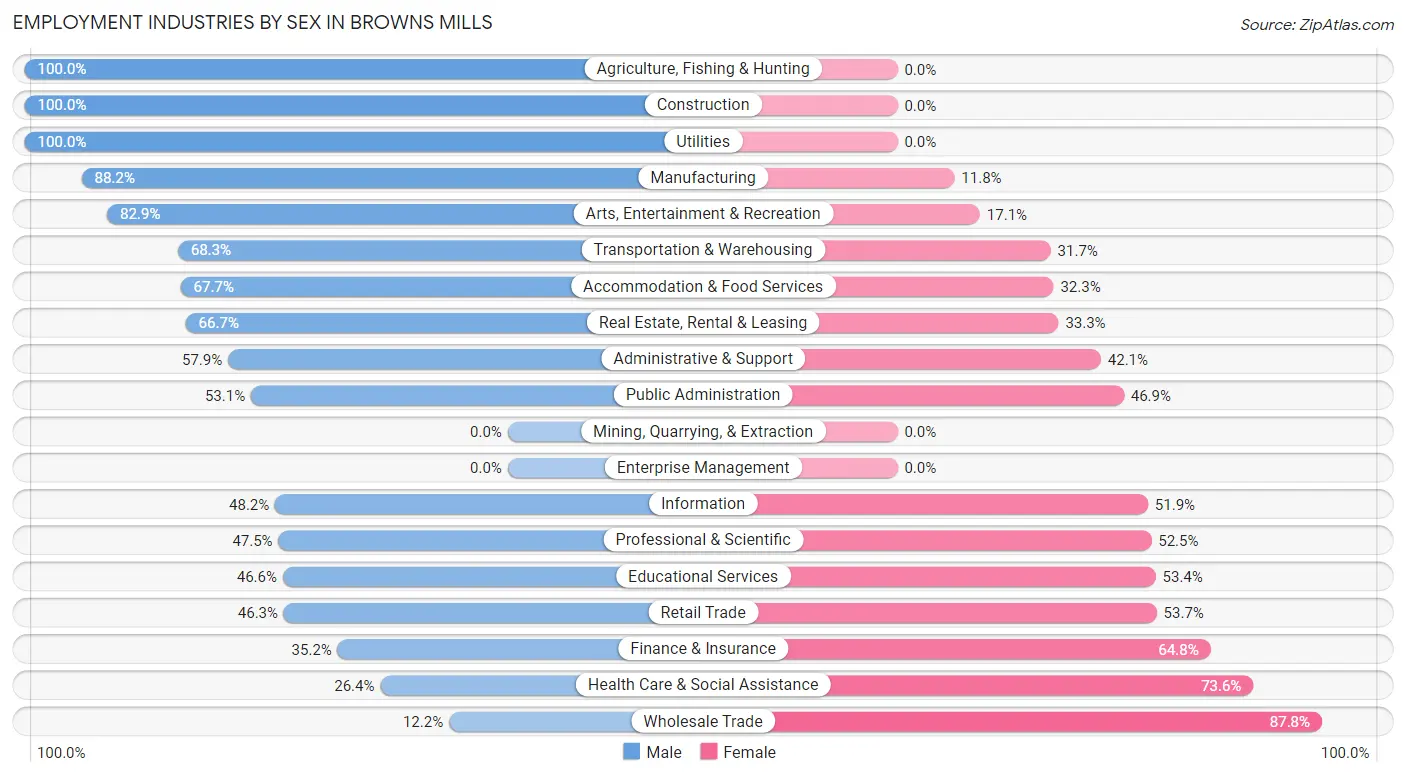
Employment Industries by Sex in Browns Mills
The Browns Mills industries that see more men than women are Agriculture, Fishing & Hunting (100.0%), Construction (100.0%), and Utilities (100.0%), whereas the industries that tend to have a higher number of women are Wholesale Trade (87.8%), Health Care & Social Assistance (73.6%), and Finance & Insurance (64.8%).
| Industry | Male | Female |
| Agriculture, Fishing & Hunting | 16 (100.0%) | 0 (0.0%) |
| Mining, Quarrying, & Extraction | 0 (0.0%) | 0 (0.0%) |
| Construction | 214 (100.0%) | 0 (0.0%) |
| Manufacturing | 269 (88.2%) | 36 (11.8%) |
| Wholesale Trade | 9 (12.2%) | 65 (87.8%) |
| Retail Trade | 304 (46.3%) | 352 (53.7%) |
| Transportation & Warehousing | 211 (68.3%) | 98 (31.7%) |
| Utilities | 45 (100.0%) | 0 (0.0%) |
| Information | 26 (48.1%) | 28 (51.8%) |
| Finance & Insurance | 44 (35.2%) | 81 (64.8%) |
| Real Estate, Rental & Leasing | 16 (66.7%) | 8 (33.3%) |
| Professional & Scientific | 112 (47.5%) | 124 (52.5%) |
| Enterprise Management | 0 (0.0%) | 0 (0.0%) |
| Administrative & Support | 99 (57.9%) | 72 (42.1%) |
| Educational Services | 210 (46.6%) | 241 (53.4%) |
| Health Care & Social Assistance | 231 (26.4%) | 645 (73.6%) |
| Arts, Entertainment & Recreation | 68 (82.9%) | 14 (17.1%) |
| Accommodation & Food Services | 174 (67.7%) | 83 (32.3%) |
| Public Administration | 169 (53.1%) | 149 (46.9%) |
| Total | 2,340 (53.3%) | 2,046 (46.7%) |
Education in Browns Mills
School Enrollment in Browns Mills
The most common levels of schooling among the 2,220 students in Browns Mills are high school (624 | 28.1%), middle school (435 | 19.6%), and college / undergraduate (422 | 19.0%).
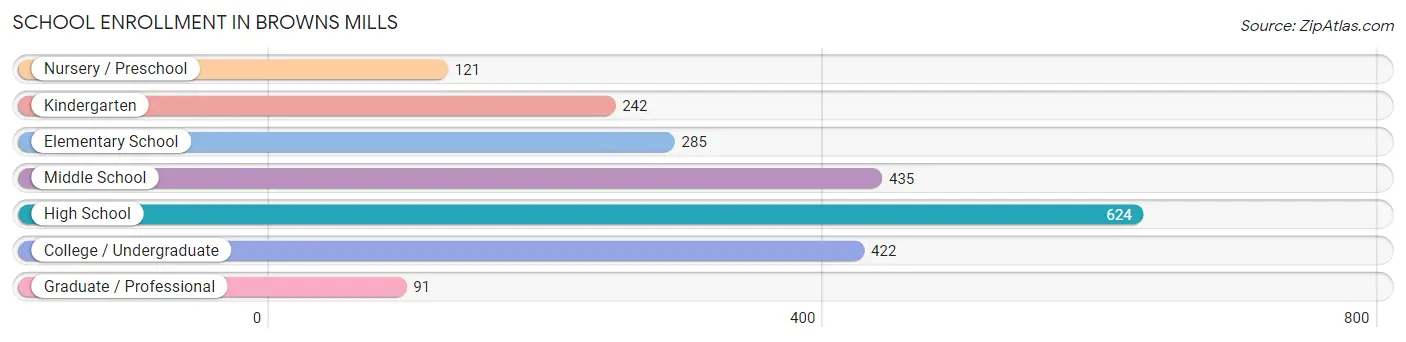
| School Level | # Students | % Students |
| Nursery / Preschool | 121 | 5.4% |
| Kindergarten | 242 | 10.9% |
| Elementary School | 285 | 12.8% |
| Middle School | 435 | 19.6% |
| High School | 624 | 28.1% |
| College / Undergraduate | 422 | 19.0% |
| Graduate / Professional | 91 | 4.1% |
| Total | 2,220 | 100.0% |
School Enrollment by Age by Funding Source in Browns Mills
Out of a total of 2,220 students who are enrolled in schools in Browns Mills, 280 (12.6%) attend a private institution, while the remaining 1,940 (87.4%) are enrolled in public schools. The age group of 20 to 24 year olds has the highest likelihood of being enrolled in private schools, with 68 (36.6% in the age bracket) enrolled. Conversely, the age group of 18 to 19 year olds has the lowest likelihood of being enrolled in a private school, with 130 (100.0% in the age bracket) attending a public institution.
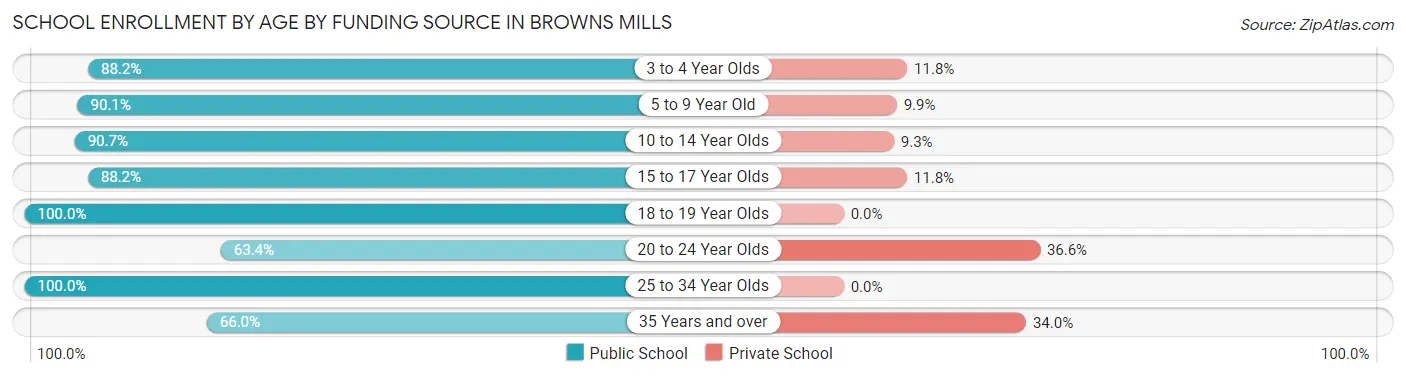
| Age Bracket | Public School | Private School |
| 3 to 4 Year Olds | 82 (88.2%) | 11 (11.8%) |
| 5 to 9 Year Old | 465 (90.1%) | 51 (9.9%) |
| 10 to 14 Year Olds | 534 (90.7%) | 55 (9.3%) |
| 15 to 17 Year Olds | 442 (88.2%) | 59 (11.8%) |
| 18 to 19 Year Olds | 130 (100.0%) | 0 (0.0%) |
| 20 to 24 Year Olds | 118 (63.4%) | 68 (36.6%) |
| 25 to 34 Year Olds | 99 (100.0%) | 0 (0.0%) |
| 35 Years and over | 70 (66.0%) | 36 (34.0%) |
| Total | 1,940 (87.4%) | 280 (12.6%) |
Educational Attainment by Field of Study in Browns Mills
Social sciences (153 | 13.1%), liberal arts & history (135 | 11.5%), education (124 | 10.6%), business (101 | 8.6%), and arts & humanities (100 | 8.5%) are the most common fields of study among 1,172 individuals in Browns Mills who have obtained a bachelor's degree or higher.
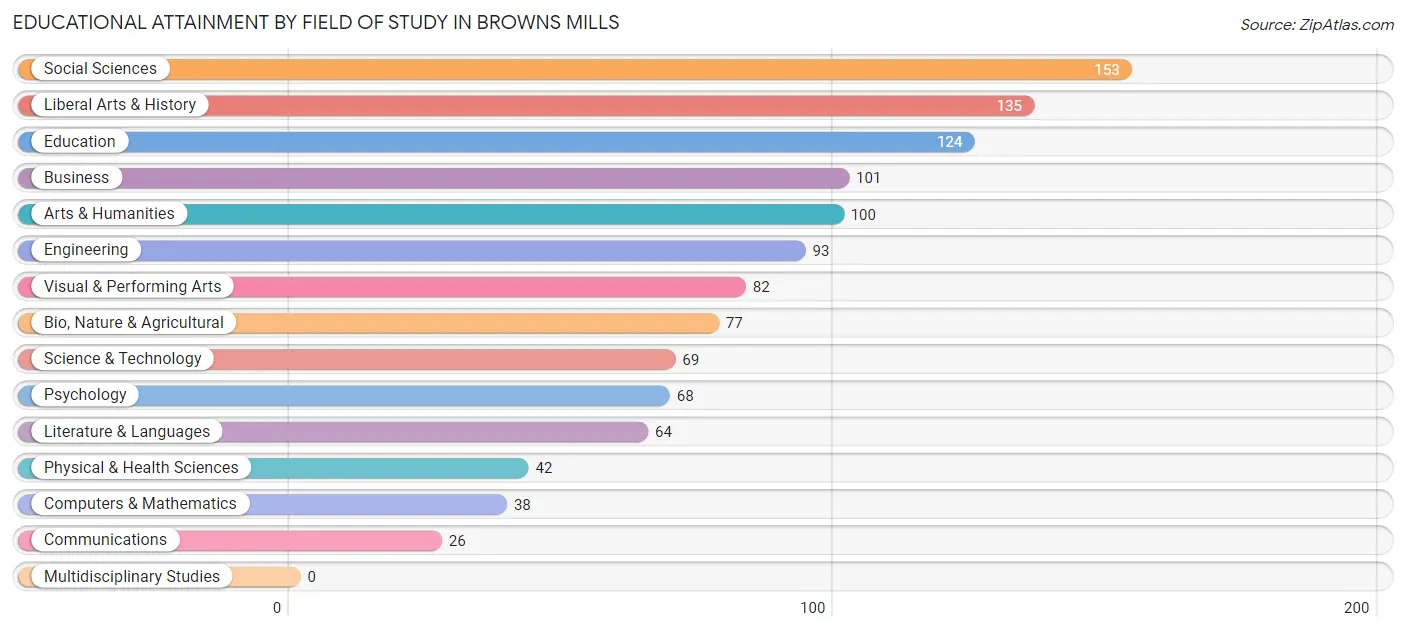
| Field of Study | # Graduates | % Graduates |
| Computers & Mathematics | 38 | 3.2% |
| Bio, Nature & Agricultural | 77 | 6.6% |
| Physical & Health Sciences | 42 | 3.6% |
| Psychology | 68 | 5.8% |
| Social Sciences | 153 | 13.1% |
| Engineering | 93 | 7.9% |
| Multidisciplinary Studies | 0 | 0.0% |
| Science & Technology | 69 | 5.9% |
| Business | 101 | 8.6% |
| Education | 124 | 10.6% |
| Literature & Languages | 64 | 5.5% |
| Liberal Arts & History | 135 | 11.5% |
| Visual & Performing Arts | 82 | 7.0% |
| Communications | 26 | 2.2% |
| Arts & Humanities | 100 | 8.5% |
| Total | 1,172 | 100.0% |
Transportation & Commute in Browns Mills
Vehicle Availability by Sex in Browns Mills
The most prevalent vehicle ownership categories in Browns Mills are males with 3 vehicles (949, accounting for 37.9%) and females with 3 vehicles (488, making up 47.3%).
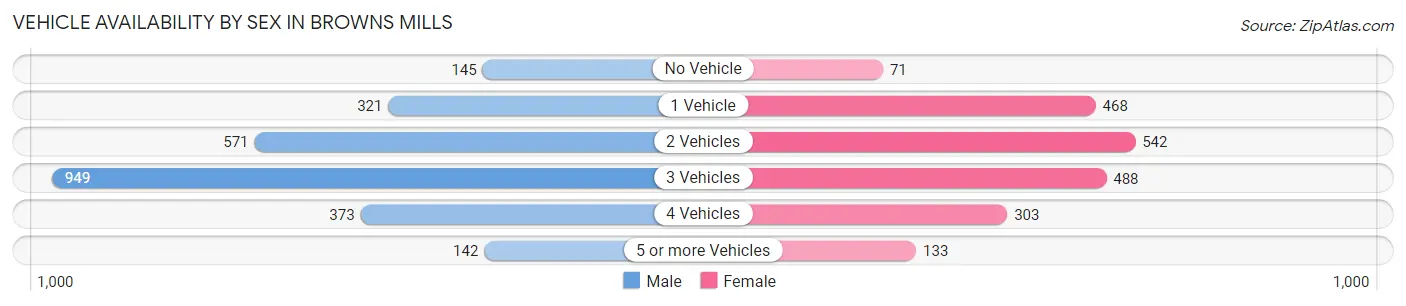
| Vehicles Available | Male | Female |
| No Vehicle | 145 (5.8%) | 71 (3.5%) |
| 1 Vehicle | 321 (12.8%) | 468 (23.3%) |
| 2 Vehicles | 571 (22.8%) | 542 (27.0%) |
| 3 Vehicles | 949 (37.9%) | 488 (24.3%) |
| 4 Vehicles | 373 (14.9%) | 303 (15.1%) |
| 5 or more Vehicles | 142 (5.7%) | 133 (6.6%) |
| Total | 2,501 (100.0%) | 2,005 (100.0%) |
Commute Time in Browns Mills
The most frequently occuring commute durations in Browns Mills are 30 to 34 minutes (597 commuters, 14.1%), 15 to 19 minutes (526 commuters, 12.4%), and 60 to 89 minutes (431 commuters, 10.2%).
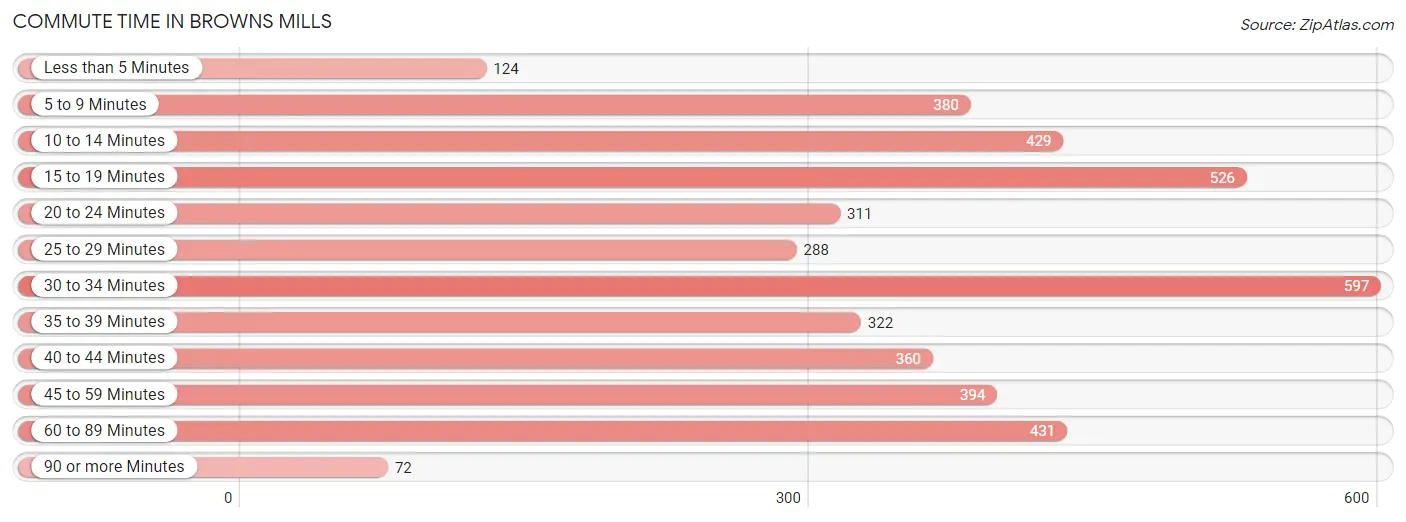
| Commute Time | # Commuters | % Commuters |
| Less than 5 Minutes | 124 | 2.9% |
| 5 to 9 Minutes | 380 | 9.0% |
| 10 to 14 Minutes | 429 | 10.1% |
| 15 to 19 Minutes | 526 | 12.4% |
| 20 to 24 Minutes | 311 | 7.3% |
| 25 to 29 Minutes | 288 | 6.8% |
| 30 to 34 Minutes | 597 | 14.1% |
| 35 to 39 Minutes | 322 | 7.6% |
| 40 to 44 Minutes | 360 | 8.5% |
| 45 to 59 Minutes | 394 | 9.3% |
| 60 to 89 Minutes | 431 | 10.2% |
| 90 or more Minutes | 72 | 1.7% |
Commute Time by Sex in Browns Mills
The most common commute times in Browns Mills are 30 to 34 minutes (449 commuters, 18.6%) for males and 40 to 44 minutes (242 commuters, 13.3%) for females.
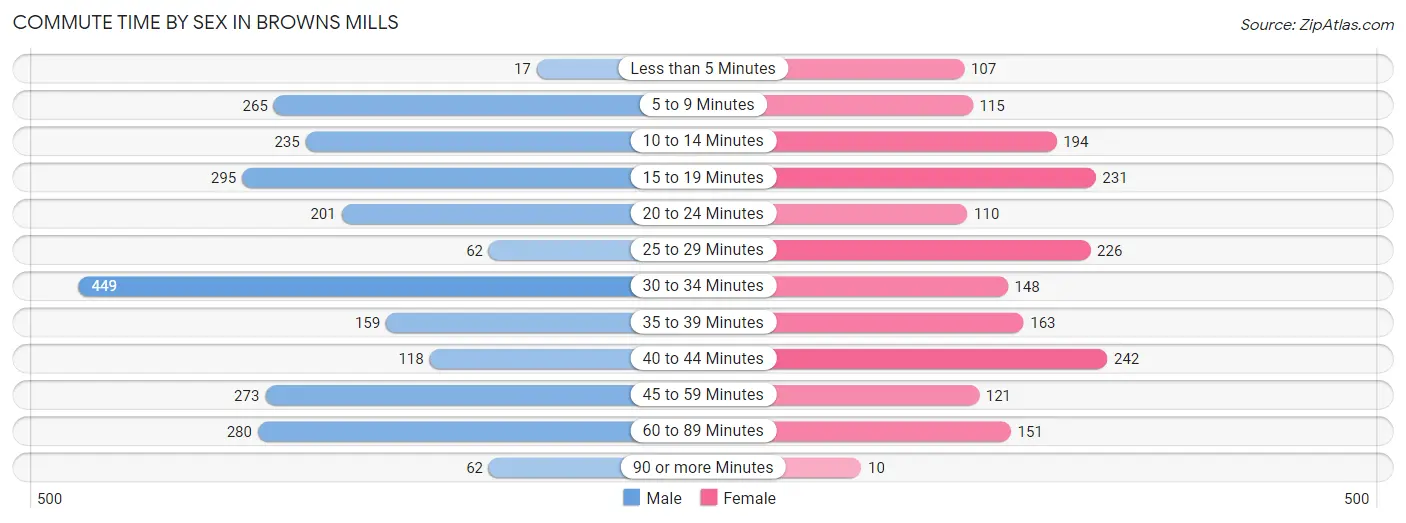
| Commute Time | Male | Female |
| Less than 5 Minutes | 17 (0.7%) | 107 (5.9%) |
| 5 to 9 Minutes | 265 (11.0%) | 115 (6.3%) |
| 10 to 14 Minutes | 235 (9.7%) | 194 (10.7%) |
| 15 to 19 Minutes | 295 (12.2%) | 231 (12.7%) |
| 20 to 24 Minutes | 201 (8.3%) | 110 (6.0%) |
| 25 to 29 Minutes | 62 (2.6%) | 226 (12.4%) |
| 30 to 34 Minutes | 449 (18.6%) | 148 (8.1%) |
| 35 to 39 Minutes | 159 (6.6%) | 163 (9.0%) |
| 40 to 44 Minutes | 118 (4.9%) | 242 (13.3%) |
| 45 to 59 Minutes | 273 (11.3%) | 121 (6.7%) |
| 60 to 89 Minutes | 280 (11.6%) | 151 (8.3%) |
| 90 or more Minutes | 62 (2.6%) | 10 (0.5%) |
Time of Departure to Work by Sex in Browns Mills
The most frequent times of departure to work in Browns Mills are 6:00 AM to 6:29 AM (448, 18.5%) for males and 4:00 PM to 11:59 PM (316, 17.4%) for females.
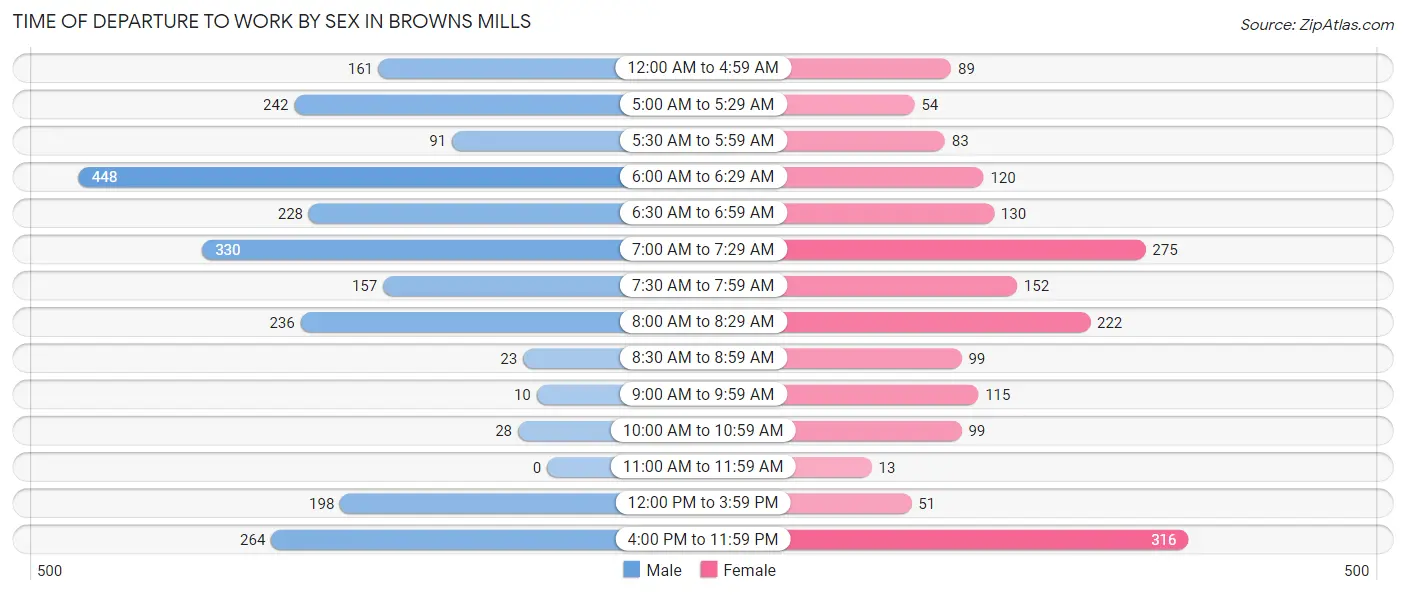
| Time of Departure | Male | Female |
| 12:00 AM to 4:59 AM | 161 (6.7%) | 89 (4.9%) |
| 5:00 AM to 5:29 AM | 242 (10.0%) | 54 (3.0%) |
| 5:30 AM to 5:59 AM | 91 (3.8%) | 83 (4.6%) |
| 6:00 AM to 6:29 AM | 448 (18.5%) | 120 (6.6%) |
| 6:30 AM to 6:59 AM | 228 (9.4%) | 130 (7.1%) |
| 7:00 AM to 7:29 AM | 330 (13.7%) | 275 (15.1%) |
| 7:30 AM to 7:59 AM | 157 (6.5%) | 152 (8.4%) |
| 8:00 AM to 8:29 AM | 236 (9.8%) | 222 (12.2%) |
| 8:30 AM to 8:59 AM | 23 (0.9%) | 99 (5.4%) |
| 9:00 AM to 9:59 AM | 10 (0.4%) | 115 (6.3%) |
| 10:00 AM to 10:59 AM | 28 (1.2%) | 99 (5.4%) |
| 11:00 AM to 11:59 AM | 0 (0.0%) | 13 (0.7%) |
| 12:00 PM to 3:59 PM | 198 (8.2%) | 51 (2.8%) |
| 4:00 PM to 11:59 PM | 264 (10.9%) | 316 (17.4%) |
| Total | 2,416 (100.0%) | 1,818 (100.0%) |
Housing Occupancy in Browns Mills
Occupancy by Ownership in Browns Mills
Of the total 3,749 dwellings in Browns Mills, owner-occupied units account for 2,934 (78.3%), while renter-occupied units make up 815 (21.7%).
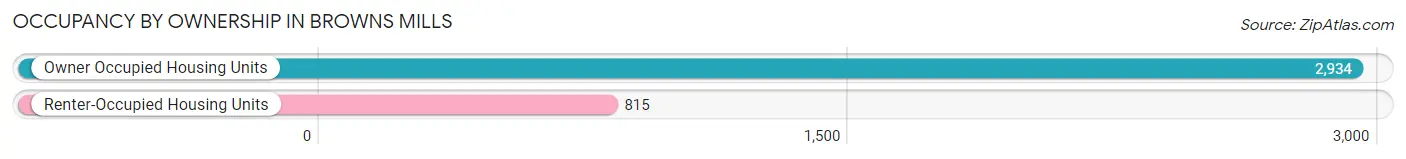
| Occupancy | # Housing Units | % Housing Units |
| Owner Occupied Housing Units | 2,934 | 78.3% |
| Renter-Occupied Housing Units | 815 | 21.7% |
| Total Occupied Housing Units | 3,749 | 100.0% |
Occupancy by Household Size in Browns Mills
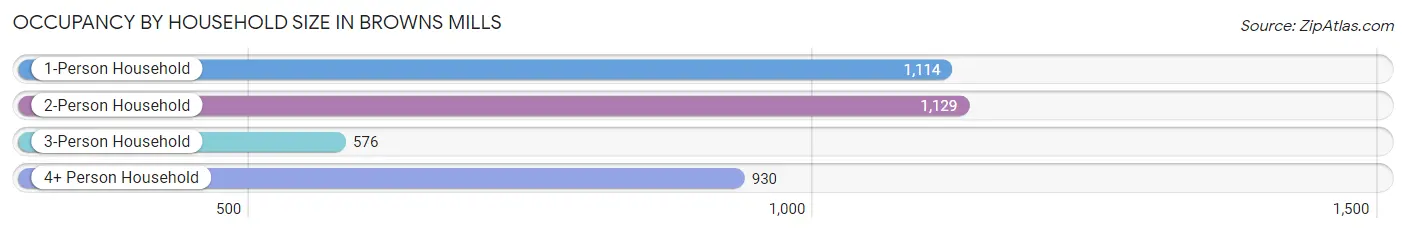
| Household Size | # Housing Units | % Housing Units |
| 1-Person Household | 1,114 | 29.7% |
| 2-Person Household | 1,129 | 30.1% |
| 3-Person Household | 576 | 15.4% |
| 4+ Person Household | 930 | 24.8% |
| Total Housing Units | 3,749 | 100.0% |
Occupancy by Ownership by Household Size in Browns Mills
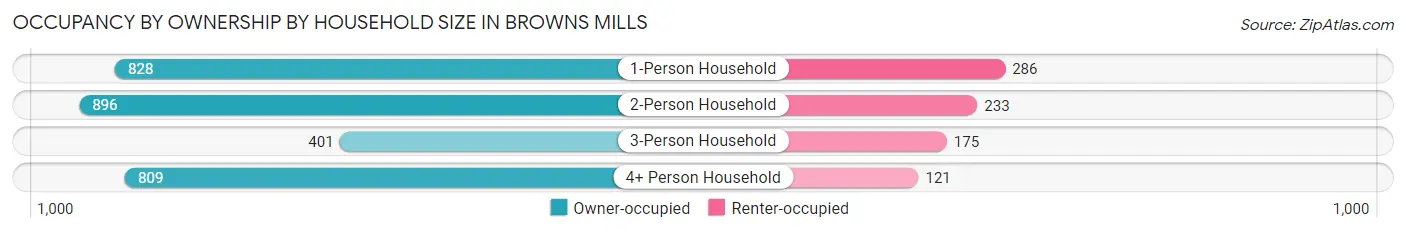
| Household Size | Owner-occupied | Renter-occupied |
| 1-Person Household | 828 (74.3%) | 286 (25.7%) |
| 2-Person Household | 896 (79.4%) | 233 (20.6%) |
| 3-Person Household | 401 (69.6%) | 175 (30.4%) |
| 4+ Person Household | 809 (87.0%) | 121 (13.0%) |
| Total Housing Units | 2,934 (78.3%) | 815 (21.7%) |
Occupancy by Educational Attainment in Browns Mills
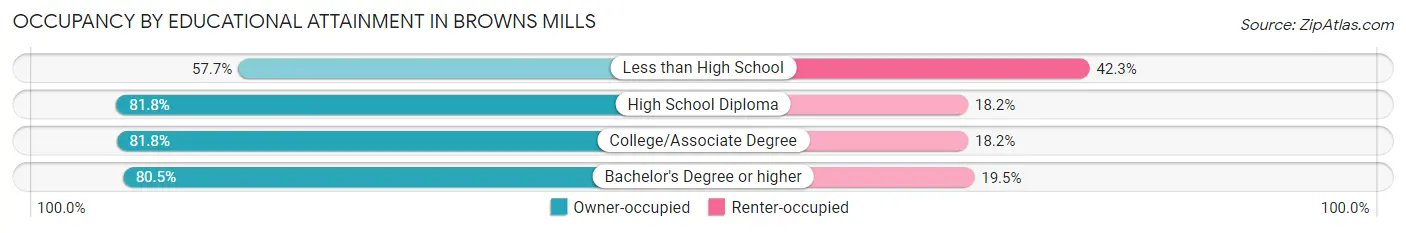
| Household Size | Owner-occupied | Renter-occupied |
| Less than High School | 293 (57.7%) | 215 (42.3%) |
| High School Diploma | 1,136 (81.8%) | 253 (18.2%) |
| College/Associate Degree | 880 (81.8%) | 196 (18.2%) |
| Bachelor's Degree or higher | 625 (80.5%) | 151 (19.5%) |
Occupancy by Age of Householder in Browns Mills
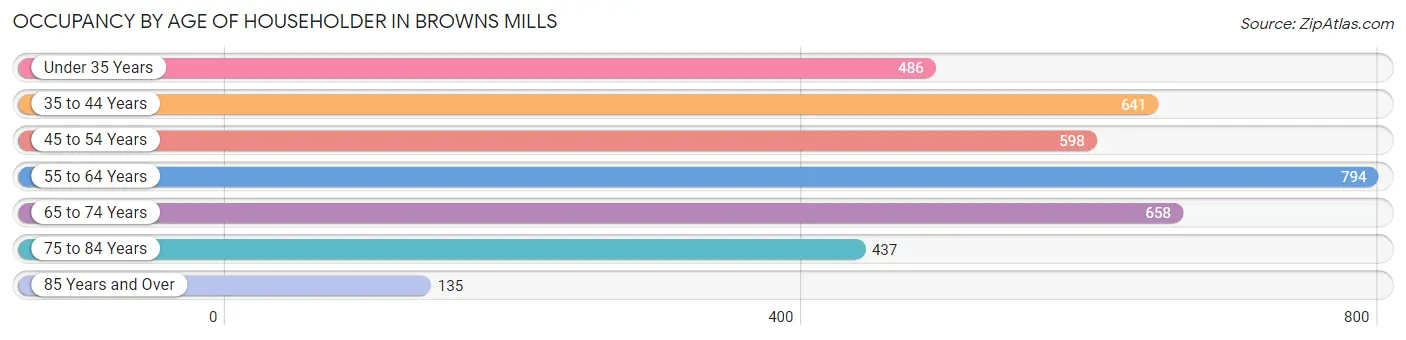
| Age Bracket | # Households | % Households |
| Under 35 Years | 486 | 13.0% |
| 35 to 44 Years | 641 | 17.1% |
| 45 to 54 Years | 598 | 16.0% |
| 55 to 64 Years | 794 | 21.2% |
| 65 to 74 Years | 658 | 17.5% |
| 75 to 84 Years | 437 | 11.7% |
| 85 Years and Over | 135 | 3.6% |
| Total | 3,749 | 100.0% |
Housing Finances in Browns Mills
Median Income by Occupancy in Browns Mills
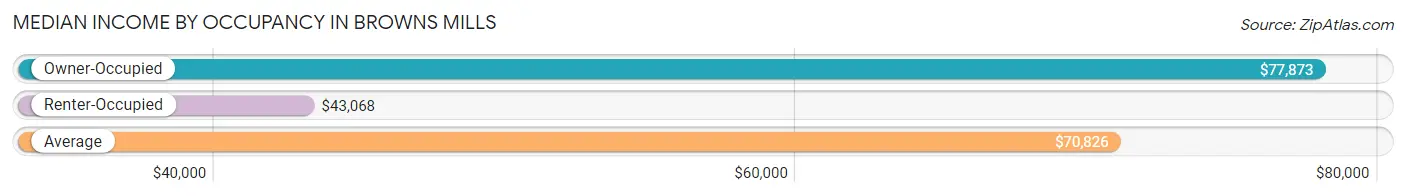
| Occupancy Type | # Households | Median Income |
| Owner-Occupied | 2,934 (78.3%) | $77,873 |
| Renter-Occupied | 815 (21.7%) | $43,068 |
| Average | 3,749 (100.0%) | $70,826 |
Occupancy by Householder Income Bracket in Browns Mills
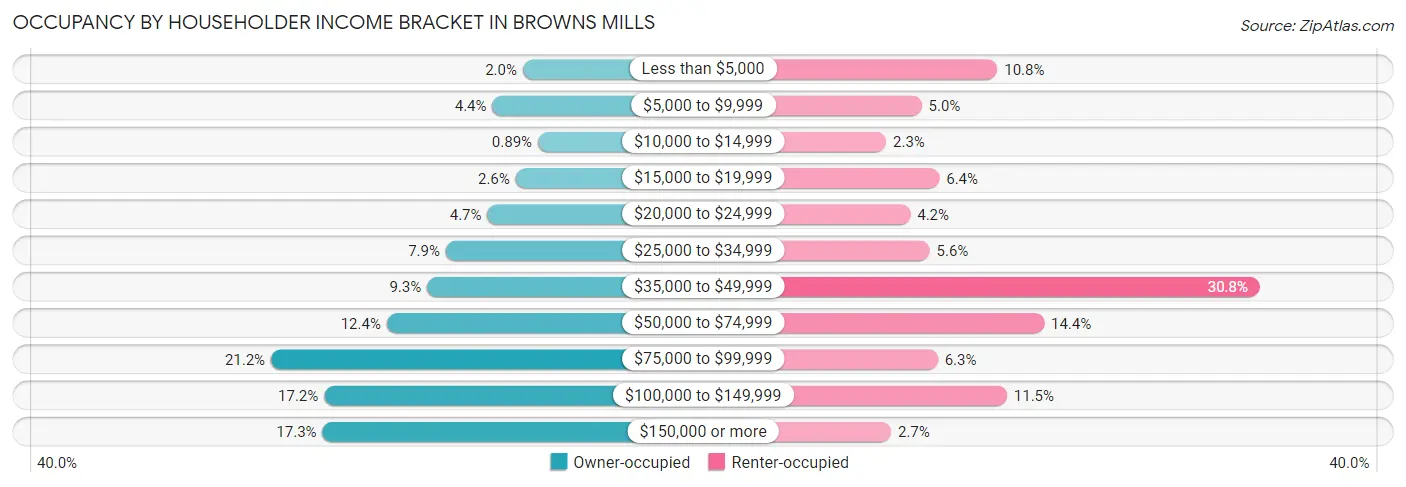
| Income Bracket | Owner-occupied | Renter-occupied |
| Less than $5,000 | 60 (2.0%) | 88 (10.8%) |
| $5,000 to $9,999 | 128 (4.4%) | 41 (5.0%) |
| $10,000 to $14,999 | 26 (0.9%) | 19 (2.3%) |
| $15,000 to $19,999 | 76 (2.6%) | 52 (6.4%) |
| $20,000 to $24,999 | 139 (4.7%) | 34 (4.2%) |
| $25,000 to $34,999 | 232 (7.9%) | 46 (5.6%) |
| $35,000 to $49,999 | 274 (9.3%) | 251 (30.8%) |
| $50,000 to $74,999 | 364 (12.4%) | 117 (14.4%) |
| $75,000 to $99,999 | 623 (21.2%) | 51 (6.3%) |
| $100,000 to $149,999 | 504 (17.2%) | 94 (11.5%) |
| $150,000 or more | 508 (17.3%) | 22 (2.7%) |
| Total | 2,934 (100.0%) | 815 (100.0%) |
Monthly Housing Cost Tiers in Browns Mills
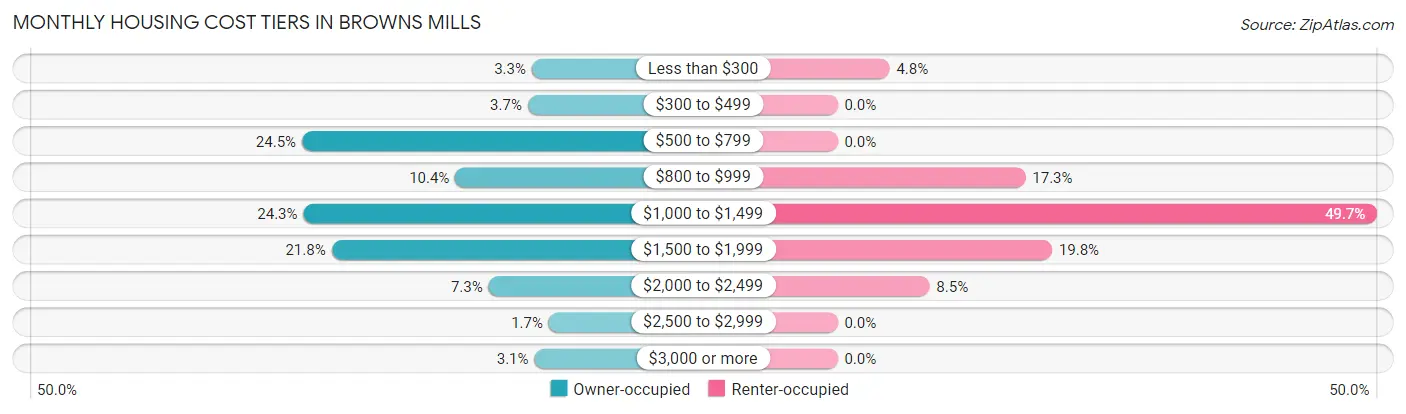
| Monthly Cost | Owner-occupied | Renter-occupied |
| Less than $300 | 97 (3.3%) | 39 (4.8%) |
| $300 to $499 | 108 (3.7%) | 0 (0.0%) |
| $500 to $799 | 718 (24.5%) | 0 (0.0%) |
| $800 to $999 | 304 (10.4%) | 141 (17.3%) |
| $1,000 to $1,499 | 714 (24.3%) | 405 (49.7%) |
| $1,500 to $1,999 | 638 (21.7%) | 161 (19.8%) |
| $2,000 to $2,499 | 214 (7.3%) | 69 (8.5%) |
| $2,500 to $2,999 | 51 (1.7%) | 0 (0.0%) |
| $3,000 or more | 90 (3.1%) | 0 (0.0%) |
| Total | 2,934 (100.0%) | 815 (100.0%) |
Physical Housing Characteristics in Browns Mills
Housing Structures in Browns Mills
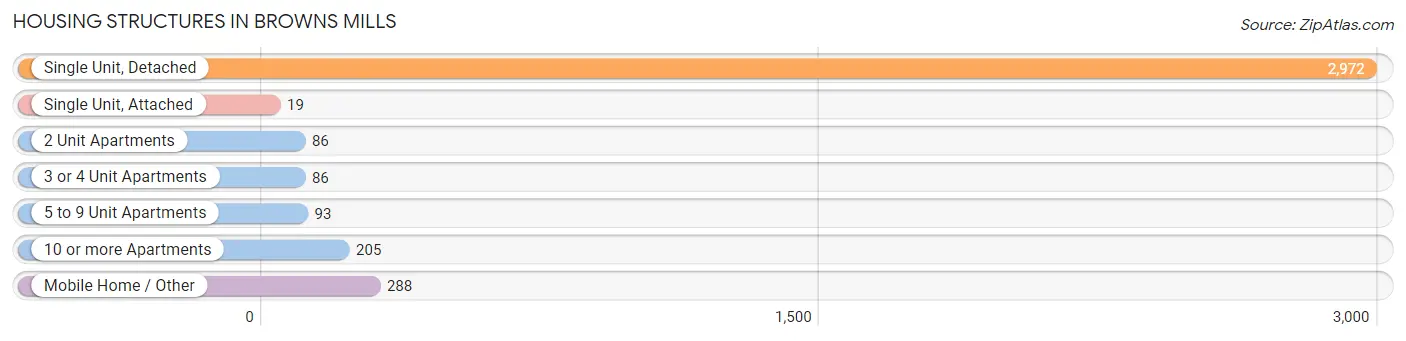
| Structure Type | # Housing Units | % Housing Units |
| Single Unit, Detached | 2,972 | 79.3% |
| Single Unit, Attached | 19 | 0.5% |
| 2 Unit Apartments | 86 | 2.3% |
| 3 or 4 Unit Apartments | 86 | 2.3% |
| 5 to 9 Unit Apartments | 93 | 2.5% |
| 10 or more Apartments | 205 | 5.5% |
| Mobile Home / Other | 288 | 7.7% |
| Total | 3,749 | 100.0% |
Housing Structures by Occupancy in Browns Mills
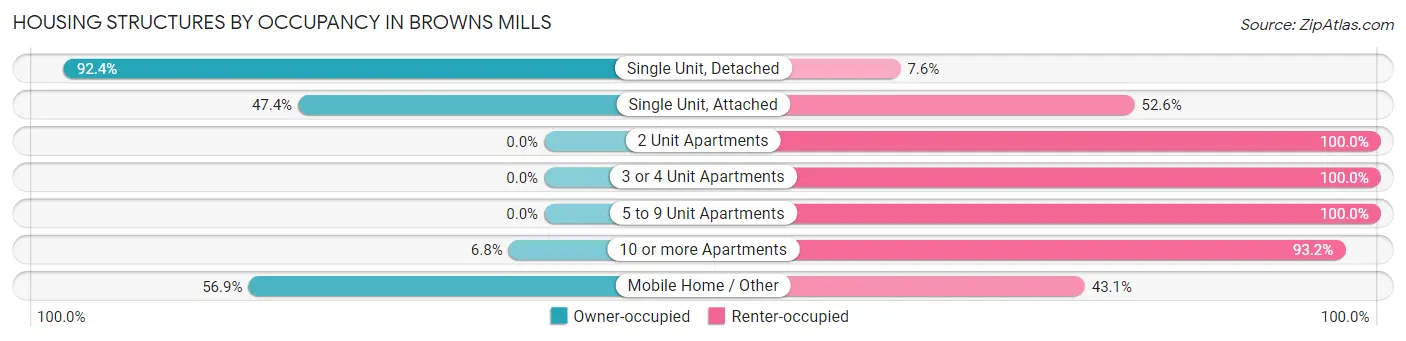
| Structure Type | Owner-occupied | Renter-occupied |
| Single Unit, Detached | 2,747 (92.4%) | 225 (7.6%) |
| Single Unit, Attached | 9 (47.4%) | 10 (52.6%) |
| 2 Unit Apartments | 0 (0.0%) | 86 (100.0%) |
| 3 or 4 Unit Apartments | 0 (0.0%) | 86 (100.0%) |
| 5 to 9 Unit Apartments | 0 (0.0%) | 93 (100.0%) |
| 10 or more Apartments | 14 (6.8%) | 191 (93.2%) |
| Mobile Home / Other | 164 (56.9%) | 124 (43.1%) |
| Total | 2,934 (78.3%) | 815 (21.7%) |
Housing Structures by Number of Rooms in Browns Mills
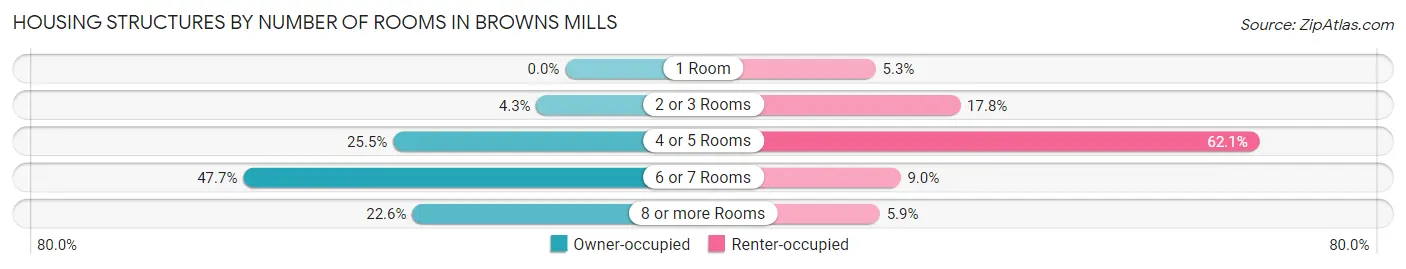
| Number of Rooms | Owner-occupied | Renter-occupied |
| 1 Room | 0 (0.0%) | 43 (5.3%) |
| 2 or 3 Rooms | 125 (4.3%) | 145 (17.8%) |
| 4 or 5 Rooms | 747 (25.5%) | 506 (62.1%) |
| 6 or 7 Rooms | 1,398 (47.6%) | 73 (9.0%) |
| 8 or more Rooms | 664 (22.6%) | 48 (5.9%) |
| Total | 2,934 (100.0%) | 815 (100.0%) |
Housing Structure by Heating Type in Browns Mills
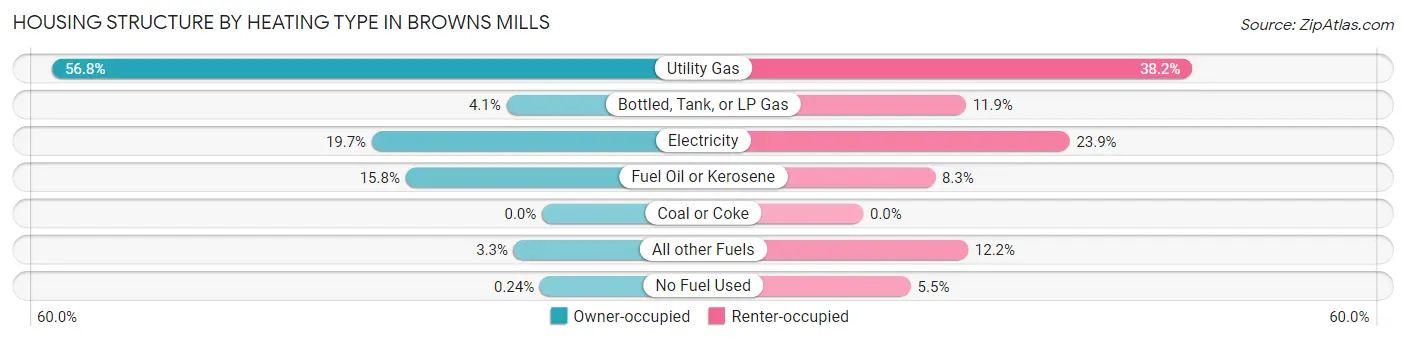
| Heating Type | Owner-occupied | Renter-occupied |
| Utility Gas | 1,667 (56.8%) | 311 (38.2%) |
| Bottled, Tank, or LP Gas | 121 (4.1%) | 97 (11.9%) |
| Electricity | 579 (19.7%) | 195 (23.9%) |
| Fuel Oil or Kerosene | 464 (15.8%) | 68 (8.3%) |
| Coal or Coke | 0 (0.0%) | 0 (0.0%) |
| All other Fuels | 96 (3.3%) | 99 (12.1%) |
| No Fuel Used | 7 (0.2%) | 45 (5.5%) |
| Total | 2,934 (100.0%) | 815 (100.0%) |
Household Vehicle Usage in Browns Mills
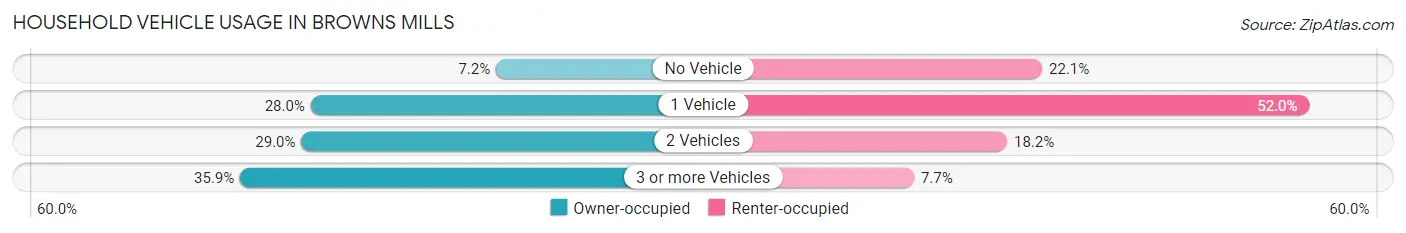
| Vehicles per Household | Owner-occupied | Renter-occupied |
| No Vehicle | 211 (7.2%) | 180 (22.1%) |
| 1 Vehicle | 820 (28.0%) | 424 (52.0%) |
| 2 Vehicles | 851 (29.0%) | 148 (18.2%) |
| 3 or more Vehicles | 1,052 (35.9%) | 63 (7.7%) |
| Total | 2,934 (100.0%) | 815 (100.0%) |
Real Estate & Mortgages in Browns Mills
Real Estate and Mortgage Overview in Browns Mills
| Characteristic | Without Mortgage | With Mortgage |
| Housing Units | 1,304 | 1,630 |
| Median Property Value | $176,400 | $204,700 |
| Median Household Income | $49,448 | $450 |
| Monthly Housing Costs | $686 | $86 |
| Real Estate Taxes | $4,290 | $129 |
Property Value by Mortgage Status in Browns Mills
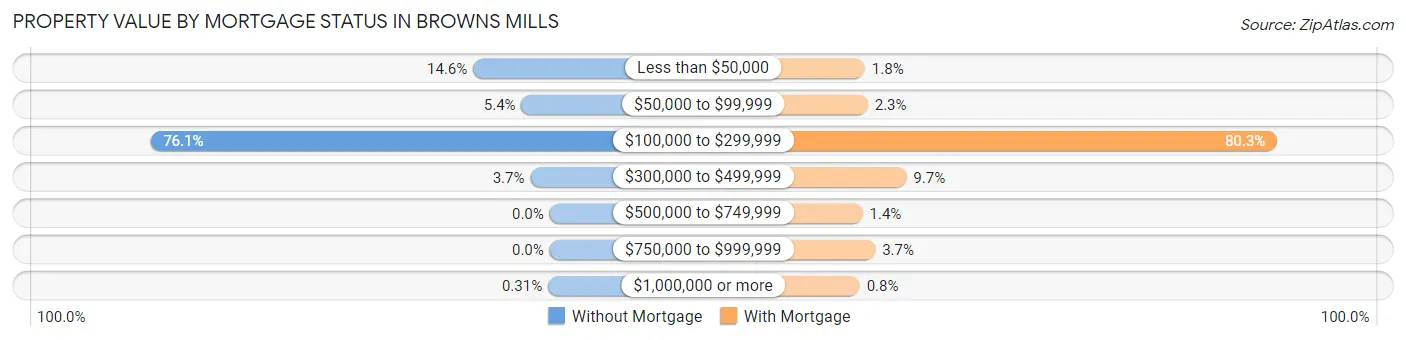
| Property Value | Without Mortgage | With Mortgage |
| Less than $50,000 | 190 (14.6%) | 29 (1.8%) |
| $50,000 to $99,999 | 70 (5.4%) | 38 (2.3%) |
| $100,000 to $299,999 | 992 (76.1%) | 1,309 (80.3%) |
| $300,000 to $499,999 | 48 (3.7%) | 158 (9.7%) |
| $500,000 to $749,999 | 0 (0.0%) | 22 (1.3%) |
| $750,000 to $999,999 | 0 (0.0%) | 61 (3.7%) |
| $1,000,000 or more | 4 (0.3%) | 13 (0.8%) |
| Total | 1,304 (100.0%) | 1,630 (100.0%) |
Household Income by Mortgage Status in Browns Mills
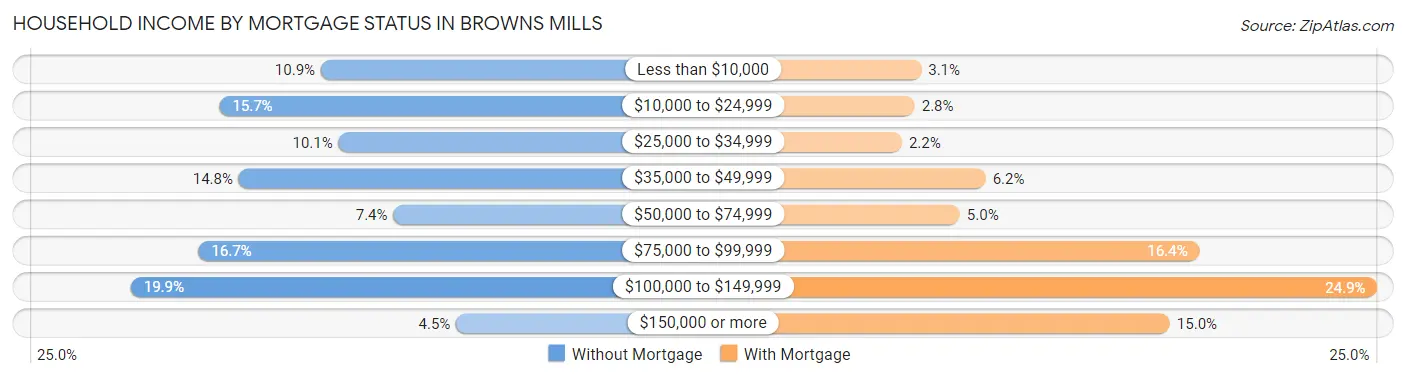
| Household Income | Without Mortgage | With Mortgage |
| Less than $10,000 | 142 (10.9%) | 51 (3.1%) |
| $10,000 to $24,999 | 205 (15.7%) | 46 (2.8%) |
| $25,000 to $34,999 | 131 (10.1%) | 36 (2.2%) |
| $35,000 to $49,999 | 193 (14.8%) | 101 (6.2%) |
| $50,000 to $74,999 | 97 (7.4%) | 81 (5.0%) |
| $75,000 to $99,999 | 218 (16.7%) | 267 (16.4%) |
| $100,000 to $149,999 | 260 (19.9%) | 405 (24.8%) |
| $150,000 or more | 58 (4.4%) | 244 (15.0%) |
| Total | 1,304 (100.0%) | 1,630 (100.0%) |
Property Value to Household Income Ratio in Browns Mills
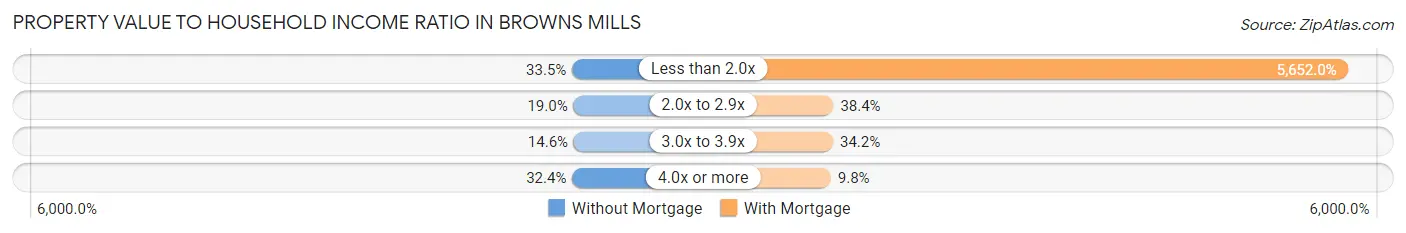
| Value-to-Income Ratio | Without Mortgage | With Mortgage |
| Less than 2.0x | 437 (33.5%) | 92,128 (5,652.0%) |
| 2.0x to 2.9x | 248 (19.0%) | 626 (38.4%) |
| 3.0x to 3.9x | 190 (14.6%) | 557 (34.2%) |
| 4.0x or more | 422 (32.4%) | 160 (9.8%) |
| Total | 1,304 (100.0%) | 1,630 (100.0%) |
Real Estate Taxes by Mortgage Status in Browns Mills
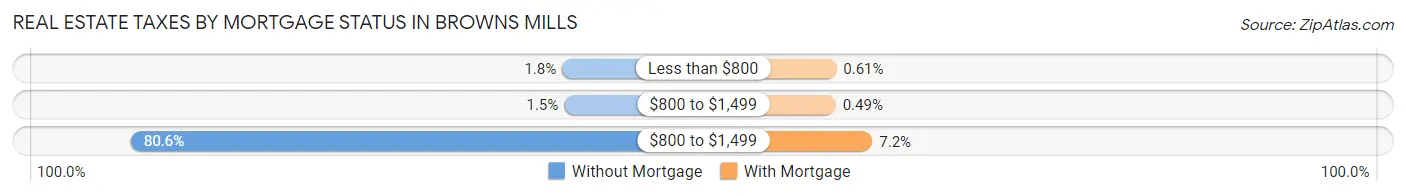
| Property Taxes | Without Mortgage | With Mortgage |
| Less than $800 | 24 (1.8%) | 10 (0.6%) |
| $800 to $1,499 | 19 (1.5%) | 8 (0.5%) |
| $800 to $1,499 | 1,051 (80.6%) | 117 (7.2%) |
| Total | 1,304 (100.0%) | 1,630 (100.0%) |
Health & Disability in Browns Mills
Health Insurance Coverage by Age in Browns Mills
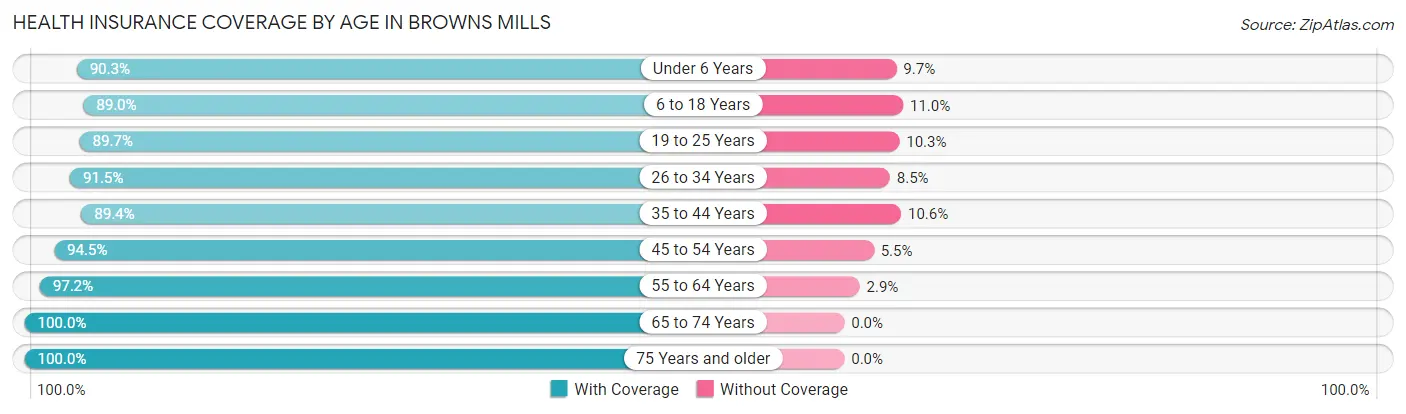
| Age Bracket | With Coverage | Without Coverage |
| Under 6 Years | 548 (90.3%) | 59 (9.7%) |
| 6 to 18 Years | 1,413 (89.0%) | 174 (11.0%) |
| 19 to 25 Years | 822 (89.7%) | 94 (10.3%) |
| 26 to 34 Years | 852 (91.5%) | 79 (8.5%) |
| 35 to 44 Years | 1,157 (89.4%) | 137 (10.6%) |
| 45 to 54 Years | 1,275 (94.5%) | 74 (5.5%) |
| 55 to 64 Years | 1,262 (97.2%) | 37 (2.9%) |
| 65 to 74 Years | 1,134 (100.0%) | 0 (0.0%) |
| 75 Years and older | 713 (100.0%) | 0 (0.0%) |
| Total | 9,176 (93.3%) | 654 (6.7%) |
Health Insurance Coverage by Citizenship Status in Browns Mills
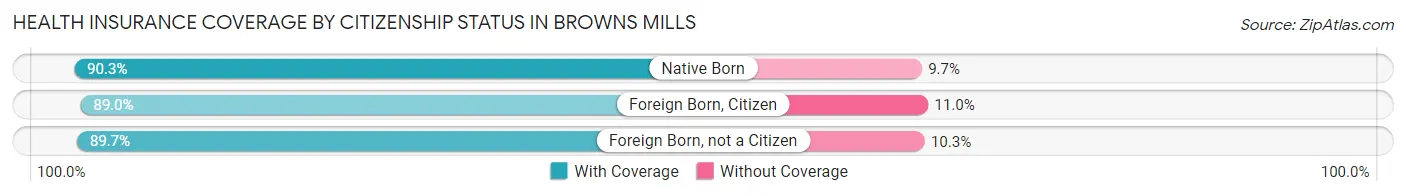
| Citizenship Status | With Coverage | Without Coverage |
| Native Born | 548 (90.3%) | 59 (9.7%) |
| Foreign Born, Citizen | 1,413 (89.0%) | 174 (11.0%) |
| Foreign Born, not a Citizen | 822 (89.7%) | 94 (10.3%) |
Health Insurance Coverage by Household Income in Browns Mills
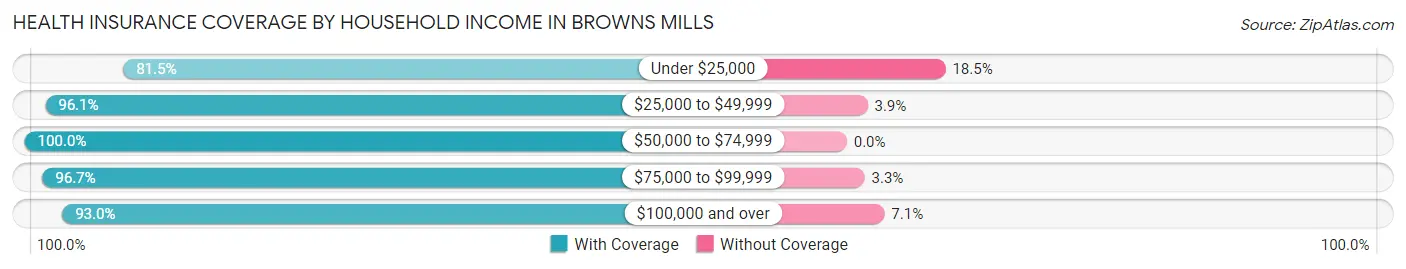
| Household Income | With Coverage | Without Coverage |
| Under $25,000 | 1,067 (81.5%) | 242 (18.5%) |
| $25,000 to $49,999 | 1,883 (96.1%) | 76 (3.9%) |
| $50,000 to $74,999 | 907 (100.0%) | 0 (0.0%) |
| $75,000 to $99,999 | 1,538 (96.7%) | 53 (3.3%) |
| $100,000 and over | 3,732 (92.9%) | 283 (7.0%) |
Public vs Private Health Insurance Coverage by Age in Browns Mills
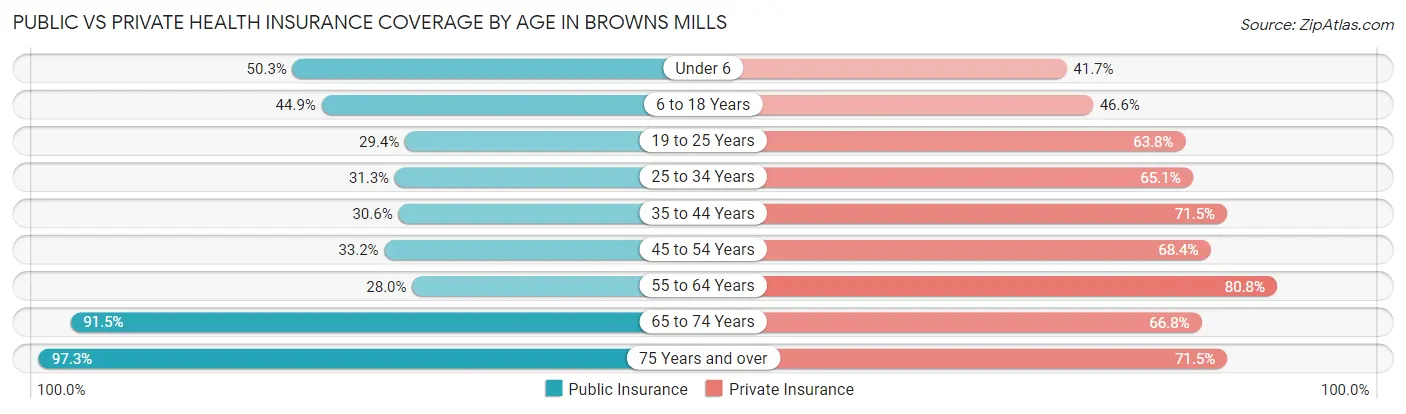
| Age Bracket | Public Insurance | Private Insurance |
| Under 6 | 305 (50.2%) | 253 (41.7%) |
| 6 to 18 Years | 712 (44.9%) | 739 (46.6%) |
| 19 to 25 Years | 269 (29.4%) | 584 (63.8%) |
| 25 to 34 Years | 291 (31.3%) | 606 (65.1%) |
| 35 to 44 Years | 396 (30.6%) | 925 (71.5%) |
| 45 to 54 Years | 448 (33.2%) | 923 (68.4%) |
| 55 to 64 Years | 364 (28.0%) | 1,049 (80.7%) |
| 65 to 74 Years | 1,038 (91.5%) | 757 (66.7%) |
| 75 Years and over | 694 (97.3%) | 510 (71.5%) |
| Total | 4,517 (46.0%) | 6,346 (64.6%) |
Disability Status by Sex by Age in Browns Mills
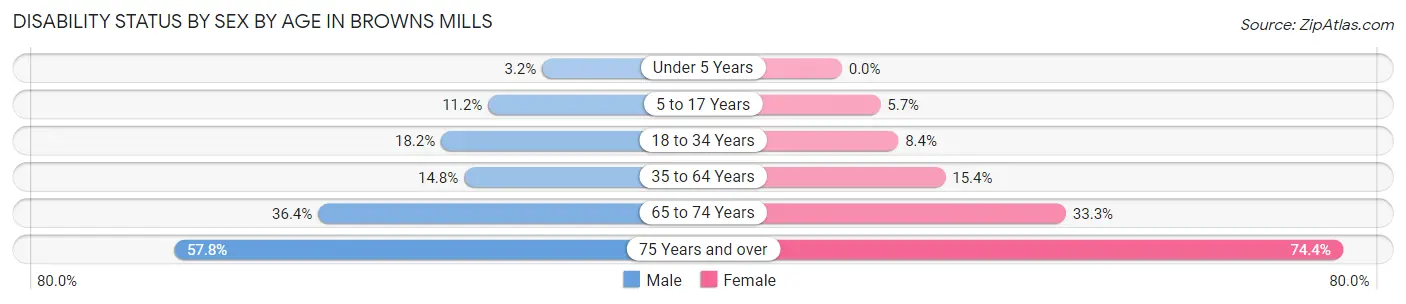
| Age Bracket | Male | Female |
| Under 5 Years | 8 (3.2%) | 0 (0.0%) |
| 5 to 17 Years | 102 (11.2%) | 41 (5.7%) |
| 18 to 34 Years | 178 (18.2%) | 82 (8.4%) |
| 35 to 64 Years | 306 (14.7%) | 287 (15.4%) |
| 65 to 74 Years | 193 (36.4%) | 201 (33.3%) |
| 75 Years and over | 207 (57.8%) | 264 (74.4%) |
Disability Class by Sex by Age in Browns Mills
Disability Class: Hearing Difficulty
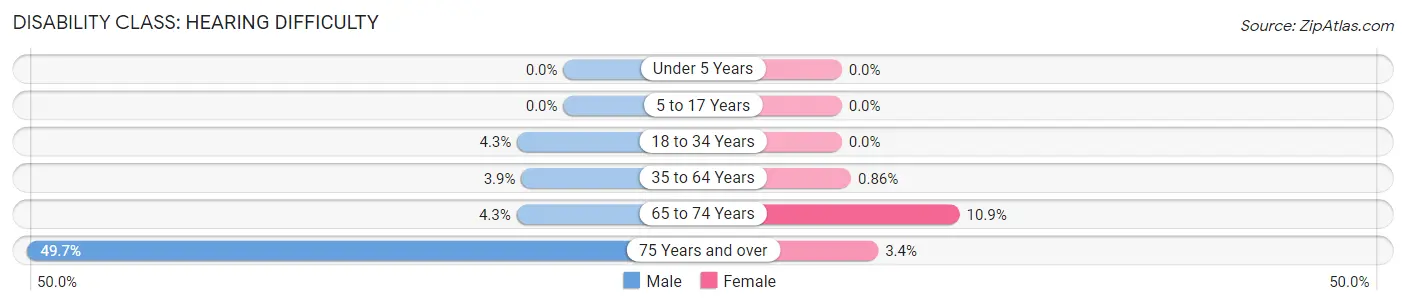
| Age Bracket | Male | Female |
| Under 5 Years | 0 (0.0%) | 0 (0.0%) |
| 5 to 17 Years | 0 (0.0%) | 0 (0.0%) |
| 18 to 34 Years | 42 (4.3%) | 0 (0.0%) |
| 35 to 64 Years | 81 (3.9%) | 16 (0.9%) |
| 65 to 74 Years | 23 (4.3%) | 66 (10.9%) |
| 75 Years and over | 178 (49.7%) | 12 (3.4%) |
Disability Class: Vision Difficulty
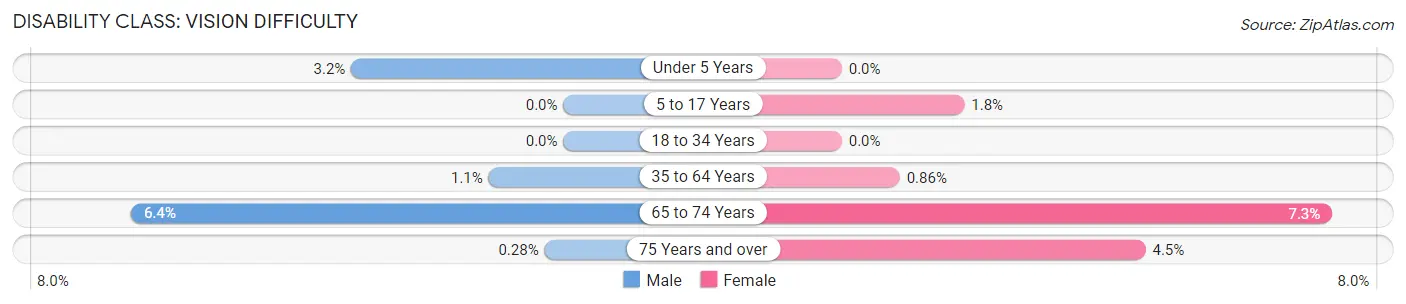
| Age Bracket | Male | Female |
| Under 5 Years | 8 (3.2%) | 0 (0.0%) |
| 5 to 17 Years | 0 (0.0%) | 13 (1.8%) |
| 18 to 34 Years | 0 (0.0%) | 0 (0.0%) |
| 35 to 64 Years | 23 (1.1%) | 16 (0.9%) |
| 65 to 74 Years | 34 (6.4%) | 44 (7.3%) |
| 75 Years and over | 1 (0.3%) | 16 (4.5%) |
Disability Class: Cognitive Difficulty
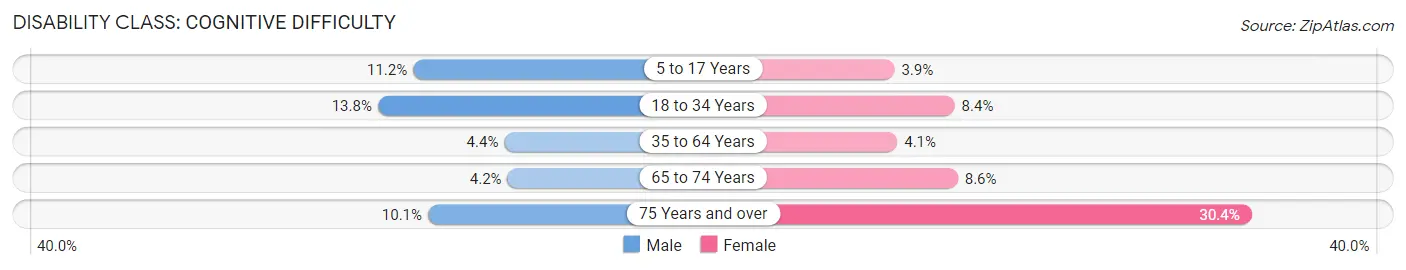
| Age Bracket | Male | Female |
| 5 to 17 Years | 102 (11.2%) | 28 (3.9%) |
| 18 to 34 Years | 135 (13.8%) | 82 (8.4%) |
| 35 to 64 Years | 91 (4.4%) | 77 (4.1%) |
| 65 to 74 Years | 22 (4.2%) | 52 (8.6%) |
| 75 Years and over | 36 (10.1%) | 108 (30.4%) |
Disability Class: Ambulatory Difficulty
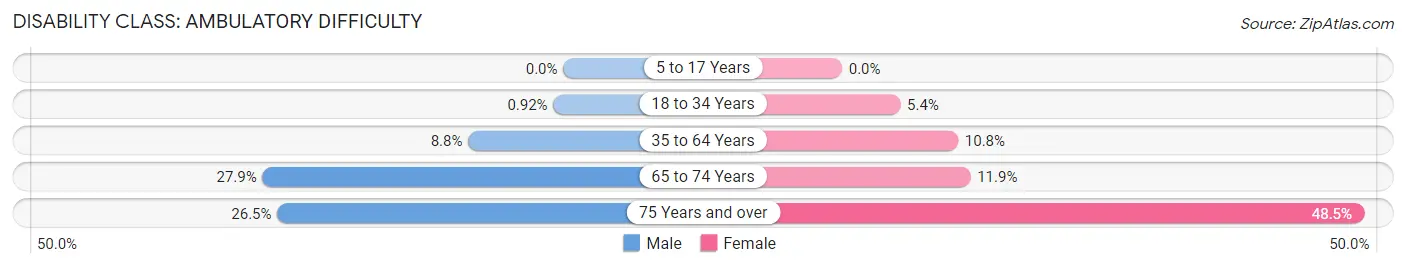
| Age Bracket | Male | Female |
| 5 to 17 Years | 0 (0.0%) | 0 (0.0%) |
| 18 to 34 Years | 9 (0.9%) | 53 (5.4%) |
| 35 to 64 Years | 183 (8.8%) | 201 (10.8%) |
| 65 to 74 Years | 148 (27.9%) | 72 (11.9%) |
| 75 Years and over | 95 (26.5%) | 172 (48.4%) |
Disability Class: Self-Care Difficulty
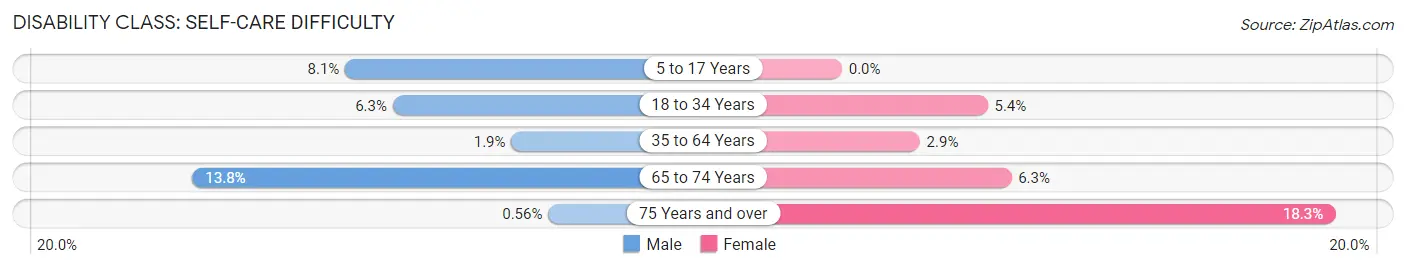
| Age Bracket | Male | Female |
| 5 to 17 Years | 74 (8.1%) | 0 (0.0%) |
| 18 to 34 Years | 62 (6.3%) | 53 (5.4%) |
| 35 to 64 Years | 40 (1.9%) | 54 (2.9%) |
| 65 to 74 Years | 73 (13.8%) | 38 (6.3%) |
| 75 Years and over | 2 (0.6%) | 65 (18.3%) |
Technology Access in Browns Mills
Computing Device Access in Browns Mills
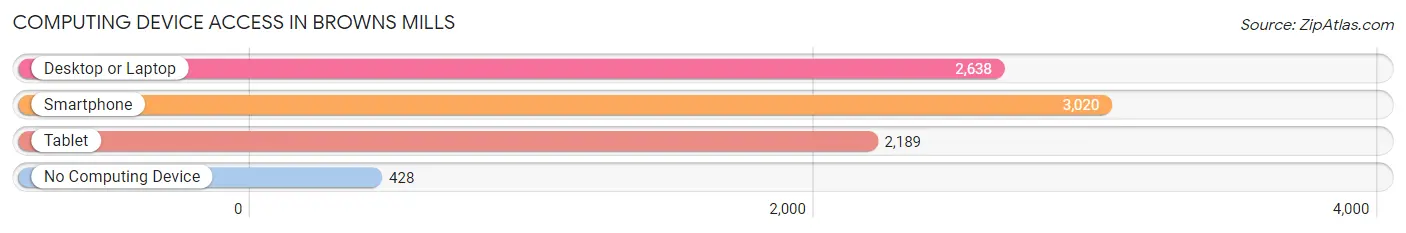
| Device Type | # Households | % Households |
| Desktop or Laptop | 2,638 | 70.4% |
| Smartphone | 3,020 | 80.5% |
| Tablet | 2,189 | 58.4% |
| No Computing Device | 428 | 11.4% |
| Total | 3,749 | 100.0% |
Internet Access in Browns Mills
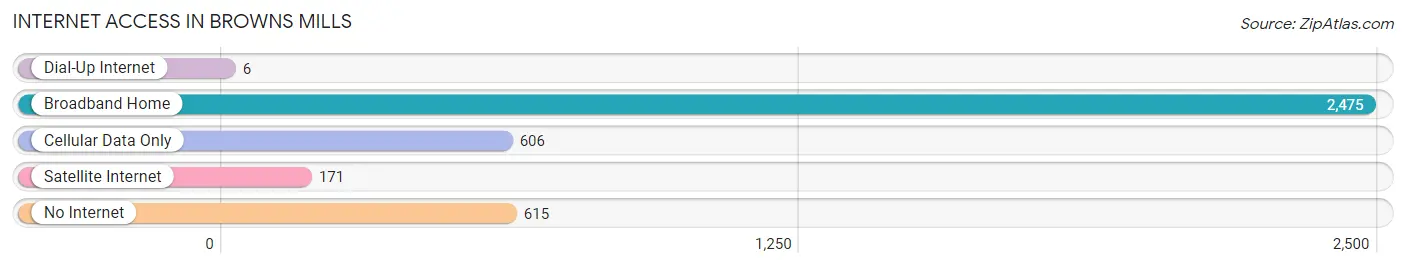
| Internet Type | # Households | % Households |
| Dial-Up Internet | 6 | 0.2% |
| Broadband Home | 2,475 | 66.0% |
| Cellular Data Only | 606 | 16.2% |
| Satellite Internet | 171 | 4.6% |
| No Internet | 615 | 16.4% |
| Total | 3,749 | 100.0% |
Browns Mills Summary
Browns Mills is a census-designated place (CDP) located in Pemberton Township, Burlington County, New Jersey. It is located in the southernmost part of the state, near the border with Pennsylvania. The population of Browns Mills was 10,919 at the 2010 United States Census.
History
The area now known as Browns Mills was originally inhabited by the Lenape Native Americans. The first European settlers arrived in the area in the late 17th century. The area was originally known as “Brown’s Mills” after the family of William Brown, who owned a mill in the area. The area was officially incorporated as a township in 1871.
In the early 20th century, the area was a popular vacation spot for people from Philadelphia and New York City. The area was known for its many lakes and streams, which were used for fishing and swimming.
In the 1950s, the area began to experience rapid growth due to the construction of the nearby Fort Dix military base. This led to an influx of military personnel and their families, which caused the population of Browns Mills to increase significantly.
Geography
Browns Mills is located at 39°59'45" North, 74°31'45" West (39.995833, -74.529167). According to the United States Census Bureau, the CDP has a total area of 5.3 square miles (13.7 km2), all of which is land.
The area is located in the Pine Barrens, a large area of pine forests and wetlands located in the southern part of New Jersey. The area is known for its sandy soil and numerous lakes and streams.
Economy
The economy of Browns Mills is largely based on the nearby Fort Dix military base. The base is home to the 87th Air Base Wing, which is responsible for providing support to the Air Force, Army, Navy, and Marine Corps. The base also houses the Joint Base McGuire-Dix-Lakehurst, which is the only tri-service base in the United States.
The base provides a significant number of jobs to the local economy, as well as providing a large number of services to the community. In addition to the base, the area is home to a number of small businesses, including restaurants, retail stores, and service providers.
Demographics
As of the 2010 United States Census, there were 10,919 people, 3,945 households, and 2,817 families residing in the CDP. The population density was 2,062.2 people per square mile (797.2/km2). There were 4,323 housing units at an average density of 817.3 per square mile (315.7/km2). The racial makeup of the CDP was 73.2% White, 15.2% African American, 0.5% Native American, 3.2% Asian, 0.1% Pacific Islander, 5.2% from other races, and 2.7% from two or more races. Hispanic or Latino of any race were 11.7% of the population.
There were 3,945 households, out of which 33.2% had children under the age of 18 living with them, 48.2% were married couples living together, 16.2% had a female householder with no husband present, and 29.2% were non-families. 24.2% of all households were made up of individuals, and 9.2% had someone living alone who was 65 years of age or older. The average household size was 2.76 and the average family size was 3.27.
In the CDP, the population was spread out, with 25.2% under the age of 18, 8.7% from 18 to 24, 28.3% from 25 to 44, 25.2% from 45 to 64, and 12.6% who were 65 years of age or older. The median age was 36.4 years. For every 100 females, there were 97.2 males. For every 100 females age 18 and over, there were 94.2 males.
The median income for a household in the CDP was $50,945, and the median income for a family was $58,958. Males had a median income of $41,919 versus $31,917 for females. The per capita income for the CDP was $21,945. About 6.2% of families and 8.2% of the population were below the poverty line, including 11.2% of those under age 18 and 6.2% of those age 65 or over.
Common Questions
What is Per Capita Income in Browns Mills?
Per Capita income in Browns Mills is $34,946.
What is the Median Family Income in Browns Mills?
Median Family Income in Browns Mills is $90,781.
What is the Median Household income in Browns Mills?
Median Household Income in Browns Mills is $70,826.
What is Income or Wage Gap in Browns Mills?
Income or Wage Gap in Browns Mills is 22.6%.
Women in Browns Mills earn 77.4 cents for every dollar earned by a man.
What is Inequality or Gini Index in Browns Mills?
Inequality or Gini Index in Browns Mills is 0.49.
What is the Total Population of Browns Mills?
Total Population of Browns Mills is 10,060.
What is the Total Male Population of Browns Mills?
Total Male Population of Browns Mills is 5,334.
What is the Total Female Population of Browns Mills?
Total Female Population of Browns Mills is 4,726.
What is the Ratio of Males per 100 Females in Browns Mills?
There are 112.87 Males per 100 Females in Browns Mills.
What is the Ratio of Females per 100 Males in Browns Mills?
There are 88.60 Females per 100 Males in Browns Mills.
What is the Median Population Age in Browns Mills?
Median Population Age in Browns Mills is 41.4 Years.
What is the Average Family Size in Browns Mills
Average Family Size in Browns Mills is 3.3 People.
What is the Average Household Size in Browns Mills
Average Household Size in Browns Mills is 2.7 People.
How Large is the Labor Force in Browns Mills?
There are 5,067 People in the Labor Forcein in Browns Mills.
What is the Percentage of People in the Labor Force in Browns Mills?
60.8% of People are in the Labor Force in Browns Mills.
What is the Unemployment Rate in Browns Mills?
Unemployment Rate in Browns Mills is 9.3%.