Mays Landing, NJ Map & Demographics
Mays Landing Map
Mays Landing Overview
$44,227
PER CAPITA INCOME
$103,591
AVG FAMILY INCOME
$83,639
AVG HOUSEHOLD INCOME
21.5%
WAGE / INCOME GAP [ % ]
78.5¢/ $1
WAGE / INCOME GAP [ $ ]
0.43
INEQUALITY / GINI INDEX
6,183
TOTAL POPULATION
3,248
MALE POPULATION
2,935
FEMALE POPULATION
110.66
MALES / 100 FEMALES
90.36
FEMALES / 100 MALES
39.7
MEDIAN AGE
3.1
AVG FAMILY SIZE
2.3
AVG HOUSEHOLD SIZE
3,114
LABOR FORCE [ PEOPLE ]
62.9%
PERCENT IN LABOR FORCE
13.1%
UNEMPLOYMENT RATE
Mays Landing Zip Codes
Mays Landing Area Codes
Income in Mays Landing
Income Overview in Mays Landing
Per Capita Income in Mays Landing is $44,227, while median incomes of families and households are $103,591 and $83,639 respectively.
| Characteristic | Number | Measure |
| Per Capita Income | 6,183 | $44,227 |
| Median Family Income | 1,367 | $103,591 |
| Mean Family Income | 1,367 | $144,842 |
| Median Household Income | 2,460 | $83,639 |
| Mean Household Income | 2,460 | $109,218 |
| Income Deficit | 1,367 | $0 |
| Wage / Income Gap (%) | 6,183 | 21.51% |
| Wage / Income Gap ($) | 6,183 | 78.49¢ per $1 |
| Gini / Inequality Index | 6,183 | 0.43 |
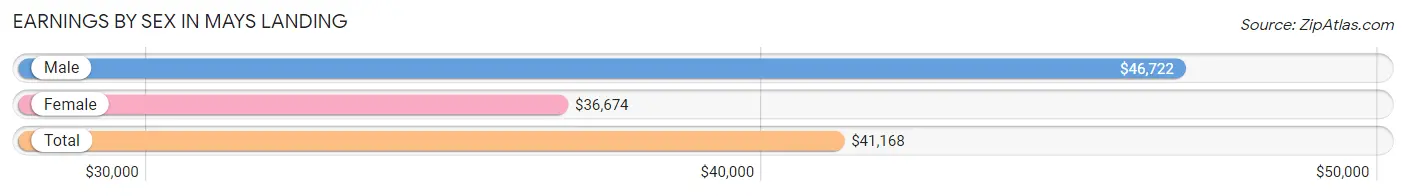
Earnings by Sex in Mays Landing
Average Earnings in Mays Landing are $41,168, $46,722 for men and $36,674 for women, a difference of 21.5%.
| Sex | Number | Average Earnings |
| Male | 1,654 (49.3%) | $46,722 |
| Female | 1,700 (50.7%) | $36,674 |
| Total | 3,354 (100.0%) | $41,168 |
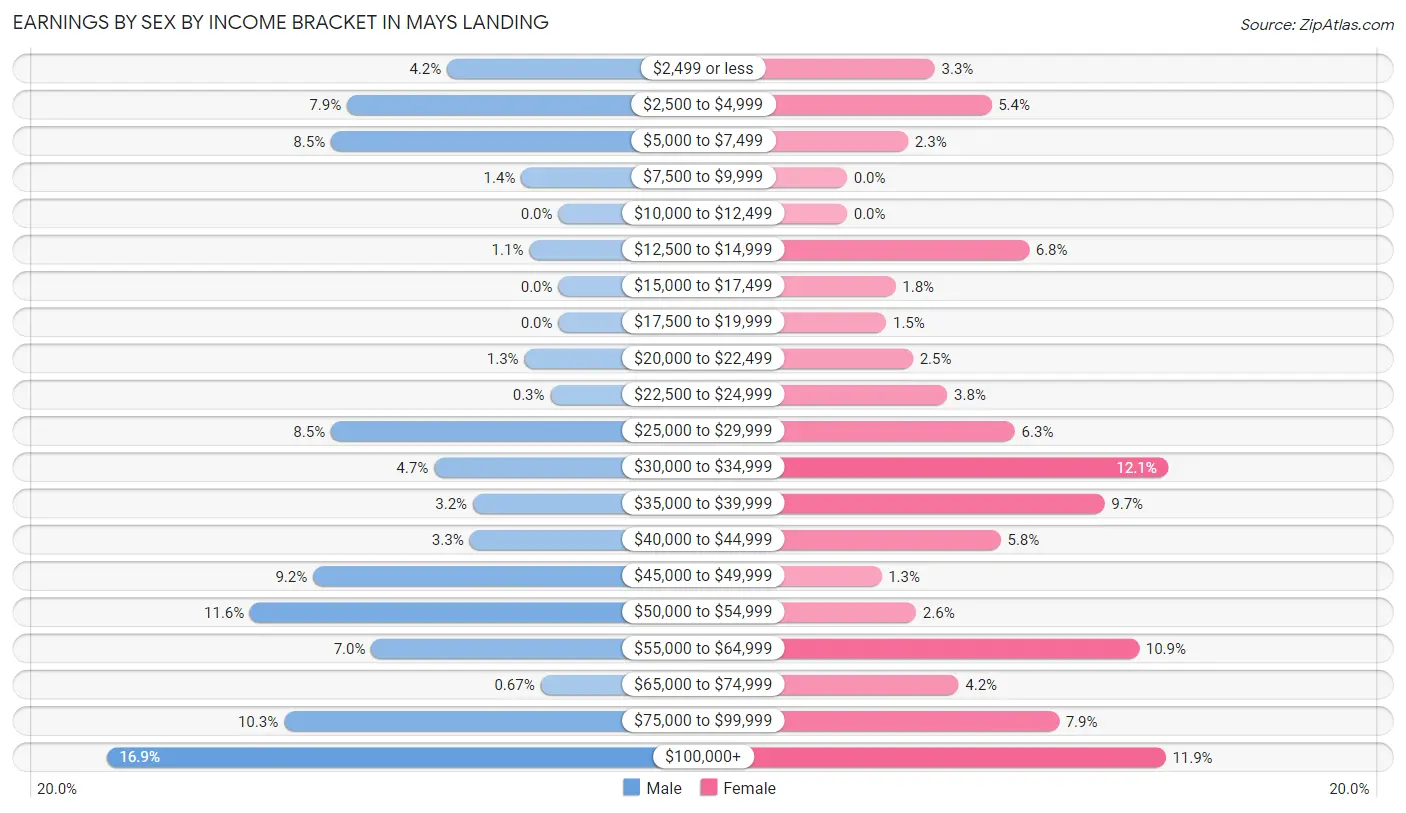
Earnings by Sex by Income Bracket in Mays Landing
The most common earnings brackets in Mays Landing are $100,000+ for men (280 | 16.9%) and $30,000 to $34,999 for women (205 | 12.1%).
| Income | Male | Female |
| $2,499 or less | 69 (4.2%) | 56 (3.3%) |
| $2,500 to $4,999 | 131 (7.9%) | 92 (5.4%) |
| $5,000 to $7,499 | 141 (8.5%) | 39 (2.3%) |
| $7,500 to $9,999 | 23 (1.4%) | 0 (0.0%) |
| $10,000 to $12,499 | 0 (0.0%) | 0 (0.0%) |
| $12,500 to $14,999 | 18 (1.1%) | 116 (6.8%) |
| $15,000 to $17,499 | 0 (0.0%) | 31 (1.8%) |
| $17,500 to $19,999 | 0 (0.0%) | 25 (1.5%) |
| $20,000 to $22,499 | 21 (1.3%) | 42 (2.5%) |
| $22,500 to $24,999 | 5 (0.3%) | 64 (3.8%) |
| $25,000 to $29,999 | 141 (8.5%) | 107 (6.3%) |
| $30,000 to $34,999 | 77 (4.7%) | 205 (12.1%) |
| $35,000 to $39,999 | 53 (3.2%) | 164 (9.7%) |
| $40,000 to $44,999 | 55 (3.3%) | 98 (5.8%) |
| $45,000 to $49,999 | 152 (9.2%) | 22 (1.3%) |
| $50,000 to $54,999 | 191 (11.6%) | 44 (2.6%) |
| $55,000 to $64,999 | 116 (7.0%) | 186 (10.9%) |
| $65,000 to $74,999 | 11 (0.7%) | 71 (4.2%) |
| $75,000 to $99,999 | 170 (10.3%) | 135 (7.9%) |
| $100,000+ | 280 (16.9%) | 203 (11.9%) |
| Total | 1,654 (100.0%) | 1,700 (100.0%) |
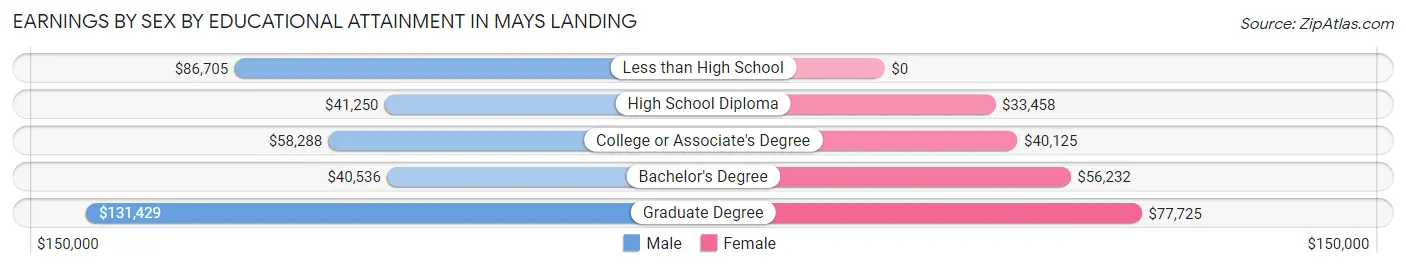
Earnings by Sex by Educational Attainment in Mays Landing
Average earnings in Mays Landing are $48,162 for men and $41,719 for women, a difference of 13.4%. Men with an educational attainment of graduate degree enjoy the highest average annual earnings of $131,429, while those with bachelor's degree education earn the least with $40,536. Women with an educational attainment of graduate degree earn the most with the average annual earnings of $77,725, while those with high school diploma education have the smallest earnings of $33,458.
| Educational Attainment | Male Income | Female Income |
| Less than High School | $86,705 | $0 |
| High School Diploma | $41,250 | $33,458 |
| College or Associate's Degree | $58,288 | $40,125 |
| Bachelor's Degree | $40,536 | $56,232 |
| Graduate Degree | $131,429 | $77,725 |
| Total | $48,162 | $41,719 |
Family Income in Mays Landing
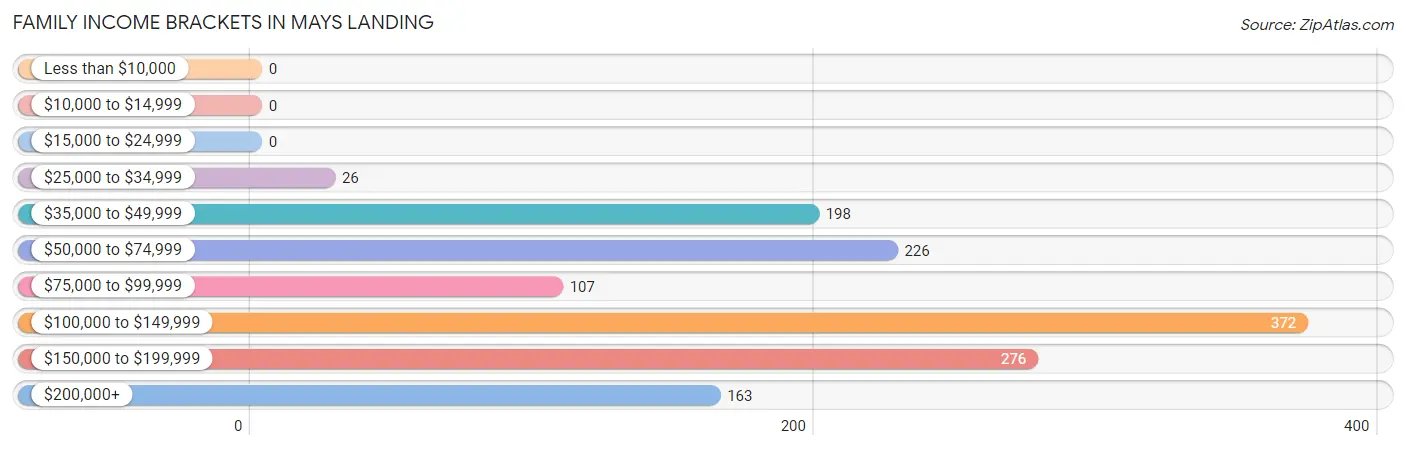
Family Income Brackets in Mays Landing
According to the Mays Landing family income data, there are 372 families falling into the $100,000 to $149,999 income range, which is the most common income bracket and makes up 27.2% of all families.
| Income Bracket | # Families | % Families |
| Less than $10,000 | 0 | 0.0% |
| $10,000 to $14,999 | 0 | 0.0% |
| $15,000 to $24,999 | 0 | 0.0% |
| $25,000 to $34,999 | 26 | 1.9% |
| $35,000 to $49,999 | 198 | 14.5% |
| $50,000 to $74,999 | 226 | 16.5% |
| $75,000 to $99,999 | 107 | 7.8% |
| $100,000 to $149,999 | 372 | 27.2% |
| $150,000 to $199,999 | 276 | 20.2% |
| $200,000+ | 163 | 11.9% |
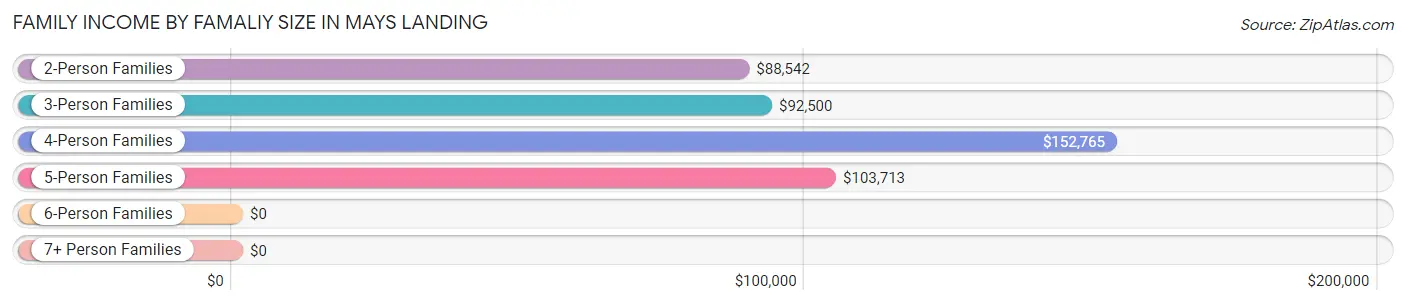
Family Income by Famaliy Size in Mays Landing
4-person families (273 | 20.0%) account for the highest median family income in Mays Landing with $152,765 per family, while 2-person families (698 | 51.1%) have the highest median income of $44,271 per family member.
| Income Bracket | # Families | Median Income |
| 2-Person Families | 698 (51.1%) | $88,542 |
| 3-Person Families | 174 (12.7%) | $92,500 |
| 4-Person Families | 273 (20.0%) | $152,765 |
| 5-Person Families | 183 (13.4%) | $103,713 |
| 6-Person Families | 39 (2.9%) | $0 |
| 7+ Person Families | 0 (0.0%) | $0 |
| Total | 1,367 (100.0%) | $103,591 |
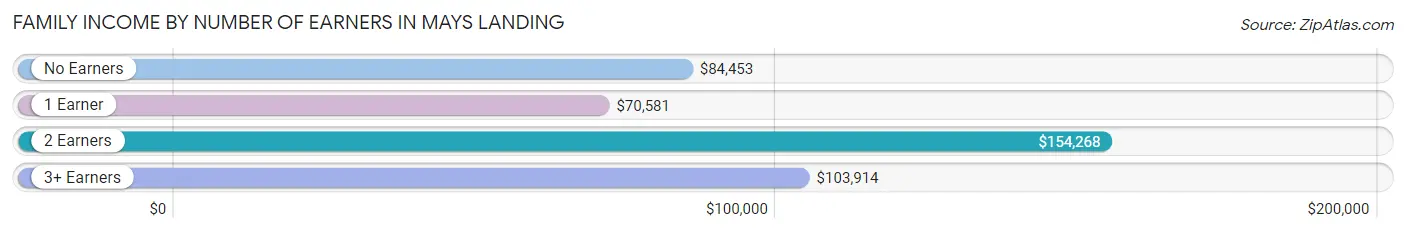
Family Income by Number of Earners in Mays Landing
The median family income in Mays Landing is $103,591, with families comprising 2 earners (506) having the highest median family income of $154,268, while families with 1 earner (574) have the lowest median family income of $70,581, accounting for 37.0% and 42.0% of families, respectively.
| Number of Earners | # Families | Median Income |
| No Earners | 137 (10.0%) | $84,453 |
| 1 Earner | 574 (42.0%) | $70,581 |
| 2 Earners | 506 (37.0%) | $154,268 |
| 3+ Earners | 150 (11.0%) | $103,914 |
| Total | 1,367 (100.0%) | $103,591 |
Household Income in Mays Landing
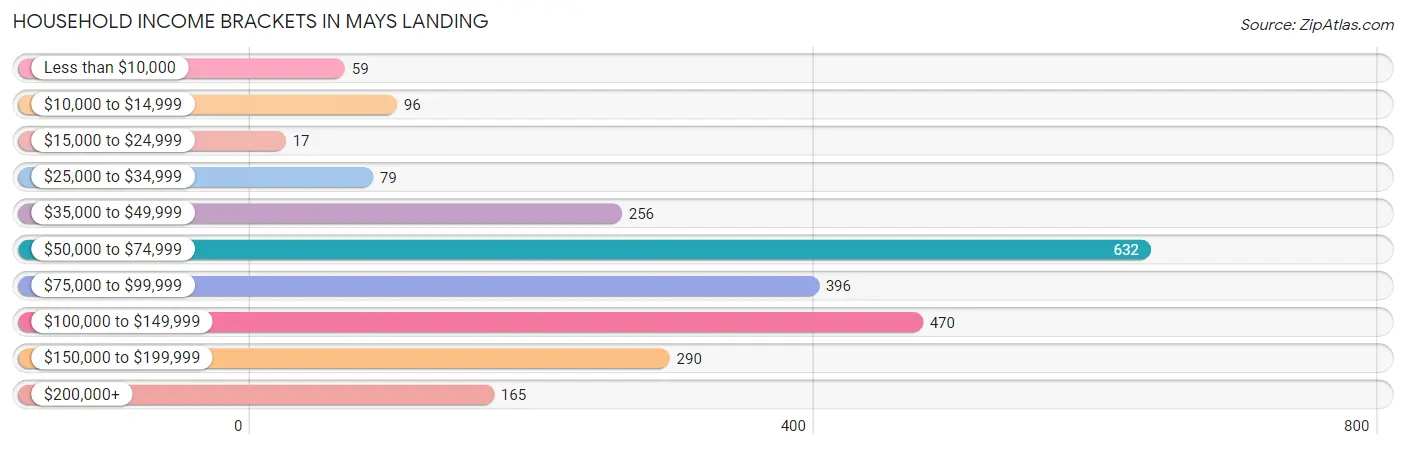
Household Income Brackets in Mays Landing
With 632 households falling in the category, the $50,000 to $74,999 income range is the most frequent in Mays Landing, accounting for 25.7% of all households. In contrast, only 17 households (0.7%) fall into the $15,000 to $24,999 income bracket, making it the least populous group.
| Income Bracket | # Households | % Households |
| Less than $10,000 | 59 | 2.4% |
| $10,000 to $14,999 | 96 | 3.9% |
| $15,000 to $24,999 | 17 | 0.7% |
| $25,000 to $34,999 | 79 | 3.2% |
| $35,000 to $49,999 | 256 | 10.4% |
| $50,000 to $74,999 | 632 | 25.7% |
| $75,000 to $99,999 | 396 | 16.1% |
| $100,000 to $149,999 | 470 | 19.1% |
| $150,000 to $199,999 | 290 | 11.8% |
| $200,000+ | 165 | 6.7% |
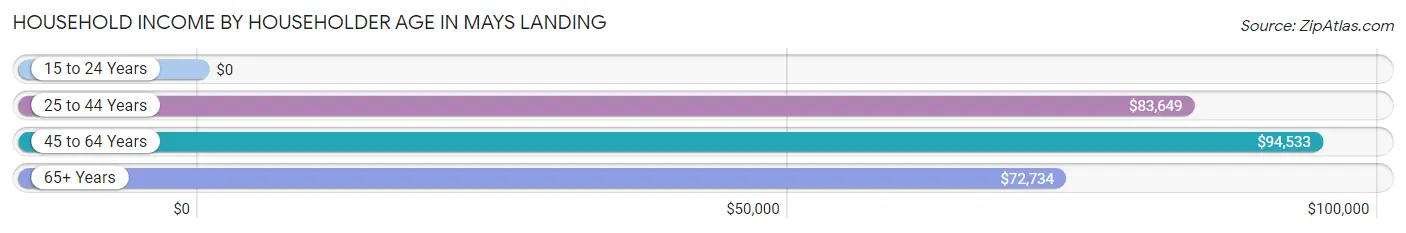
Household Income by Householder Age in Mays Landing
The median household income in Mays Landing is $83,639, with the highest median household income of $94,533 found in the 45 to 64 years age bracket for the primary householder. A total of 768 households (31.2%) fall into this category. Meanwhile, the 15 to 24 years age bracket for the primary householder has the lowest median household income of $0, with 75 households (3.0%) in this group.
| Income Bracket | # Households | Median Income |
| 15 to 24 Years | 75 (3.0%) | $0 |
| 25 to 44 Years | 832 (33.8%) | $83,649 |
| 45 to 64 Years | 768 (31.2%) | $94,533 |
| 65+ Years | 785 (31.9%) | $72,734 |
| Total | 2,460 (100.0%) | $83,639 |
Poverty in Mays Landing
Income Below Poverty by Sex and Age in Mays Landing
With 4.2% poverty level for males and 2.4% for females among the residents of Mays Landing, 35 to 44 year old males and 45 to 54 year old females are the most vulnerable to poverty, with 97 males (20.4%) and 25 females (9.4%) in their respective age groups living below the poverty level.
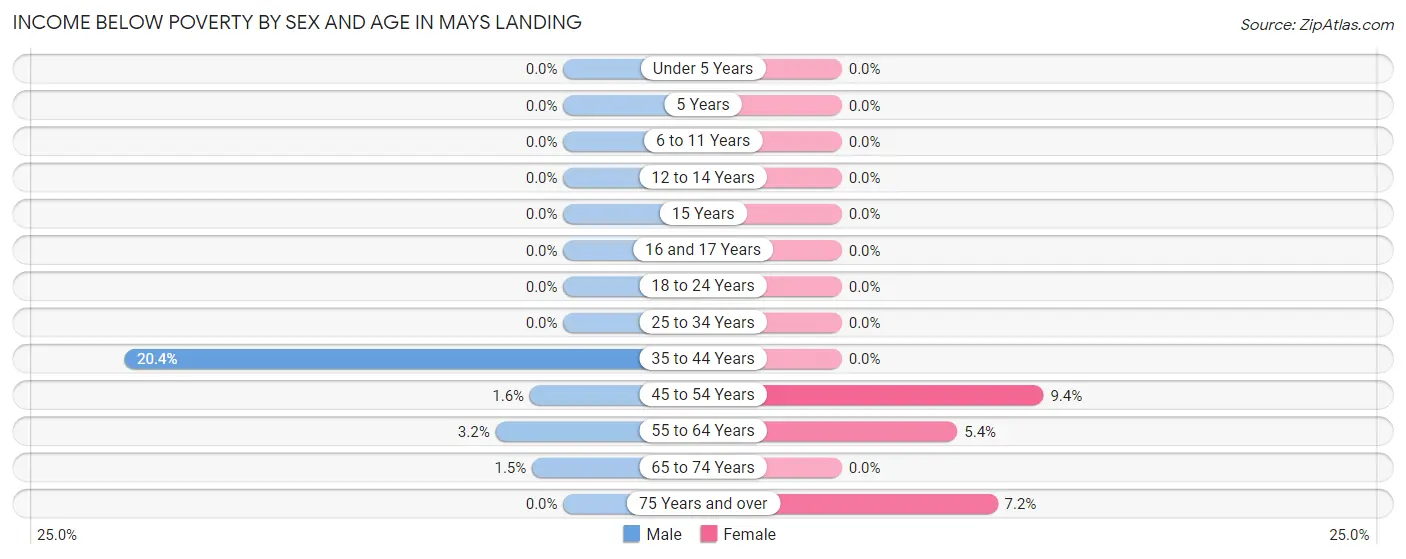
| Age Bracket | Male | Female |
| Under 5 Years | 0 (0.0%) | 0 (0.0%) |
| 5 Years | 0 (0.0%) | 0 (0.0%) |
| 6 to 11 Years | 0 (0.0%) | 0 (0.0%) |
| 12 to 14 Years | 0 (0.0%) | 0 (0.0%) |
| 15 Years | 0 (0.0%) | 0 (0.0%) |
| 16 and 17 Years | 0 (0.0%) | 0 (0.0%) |
| 18 to 24 Years | 0 (0.0%) | 0 (0.0%) |
| 25 to 34 Years | 0 (0.0%) | 0 (0.0%) |
| 35 to 44 Years | 97 (20.4%) | 0 (0.0%) |
| 45 to 54 Years | 3 (1.5%) | 25 (9.4%) |
| 55 to 64 Years | 11 (3.2%) | 24 (5.4%) |
| 65 to 74 Years | 5 (1.5%) | 0 (0.0%) |
| 75 Years and over | 0 (0.0%) | 18 (7.2%) |
| Total | 116 (4.2%) | 67 (2.4%) |
Income Above Poverty by Sex and Age in Mays Landing
According to the poverty statistics in Mays Landing, males aged under 5 years and females aged under 5 years are the age groups that are most secure financially, with 100.0% of males and 100.0% of females in these age groups living above the poverty line.
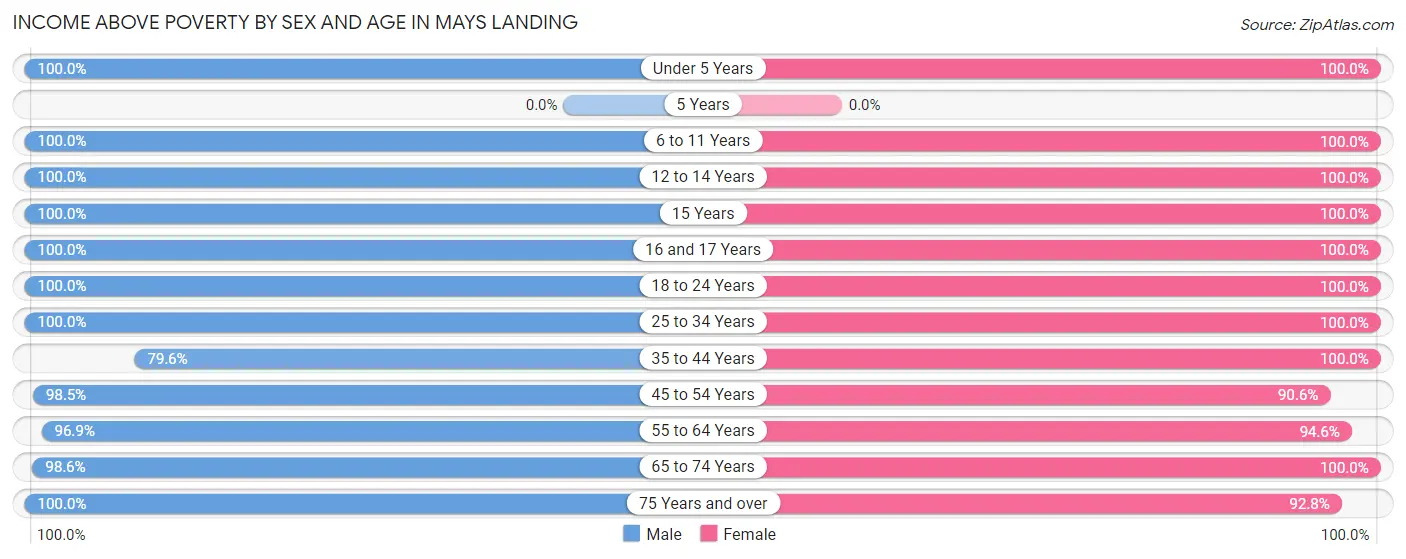
| Age Bracket | Male | Female |
| Under 5 Years | 263 (100.0%) | 85 (100.0%) |
| 5 Years | 0 (0.0%) | 0 (0.0%) |
| 6 to 11 Years | 241 (100.0%) | 121 (100.0%) |
| 12 to 14 Years | 206 (100.0%) | 132 (100.0%) |
| 15 Years | 27 (100.0%) | 120 (100.0%) |
| 16 and 17 Years | 97 (100.0%) | 60 (100.0%) |
| 18 to 24 Years | 187 (100.0%) | 284 (100.0%) |
| 25 to 34 Years | 169 (100.0%) | 373 (100.0%) |
| 35 to 44 Years | 379 (79.6%) | 324 (100.0%) |
| 45 to 54 Years | 190 (98.5%) | 242 (90.6%) |
| 55 to 64 Years | 338 (96.9%) | 424 (94.6%) |
| 65 to 74 Years | 340 (98.6%) | 387 (100.0%) |
| 75 Years and over | 227 (100.0%) | 231 (92.8%) |
| Total | 2,664 (95.8%) | 2,783 (97.7%) |
Income Below Poverty Among Married-Couple Families in Mays Landing
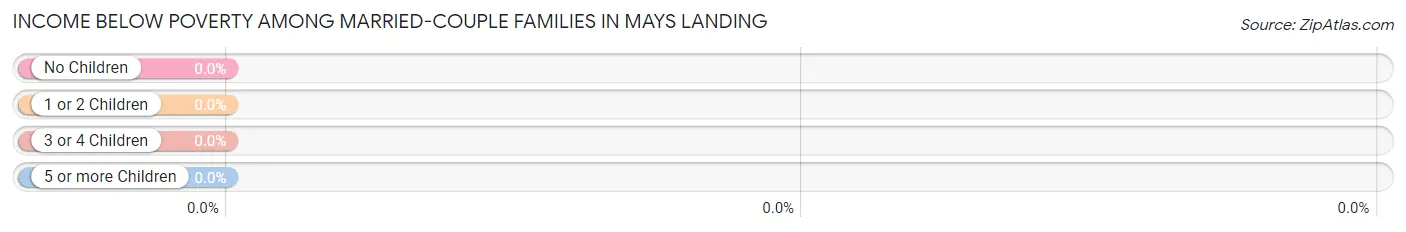
| Children | Above Poverty | Below Poverty |
| No Children | 571 (100.0%) | 0 (0.0%) |
| 1 or 2 Children | 215 (100.0%) | 0 (0.0%) |
| 3 or 4 Children | 68 (100.0%) | 0 (0.0%) |
| 5 or more Children | 0 (0.0%) | 0 (0.0%) |
| Total | 854 (100.0%) | 0 (0.0%) |
Income Below Poverty Among Single-Parent Households in Mays Landing
| Children | Single Father | Single Mother |
| No Children | 0 (0.0%) | 0 (0.0%) |
| 1 or 2 Children | 0 (0.0%) | 0 (0.0%) |
| 3 or 4 Children | 0 (0.0%) | 0 (0.0%) |
| 5 or more Children | 0 (0.0%) | 0 (0.0%) |
| Total | 0 (0.0%) | 0 (0.0%) |
Income Below Poverty Among Married-Couple vs Single-Parent Households in Mays Landing
| Children | Married-Couple Families | Single-Parent Households |
| No Children | 0 (0.0%) | 0 (0.0%) |
| 1 or 2 Children | 0 (0.0%) | 0 (0.0%) |
| 3 or 4 Children | 0 (0.0%) | 0 (0.0%) |
| 5 or more Children | 0 (0.0%) | 0 (0.0%) |
| Total | 0 (0.0%) | 0 (0.0%) |
Race in Mays Landing
The most populous races in Mays Landing are White / Caucasian (3,561 | 57.6%), Two or more Races (1,067 | 17.3%), and Hispanic or Latino (985 | 15.9%).
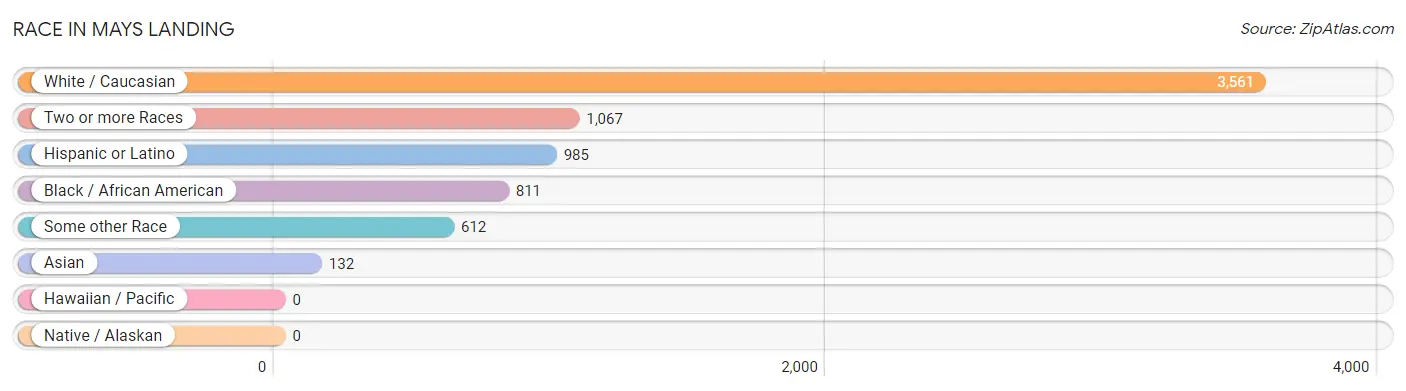
| Race | # Population | % Population |
| Asian | 132 | 2.1% |
| Black / African American | 811 | 13.1% |
| Hawaiian / Pacific | 0 | 0.0% |
| Hispanic or Latino | 985 | 15.9% |
| Native / Alaskan | 0 | 0.0% |
| White / Caucasian | 3,561 | 57.6% |
| Two or more Races | 1,067 | 17.3% |
| Some other Race | 612 | 9.9% |
| Total | 6,183 | 100.0% |
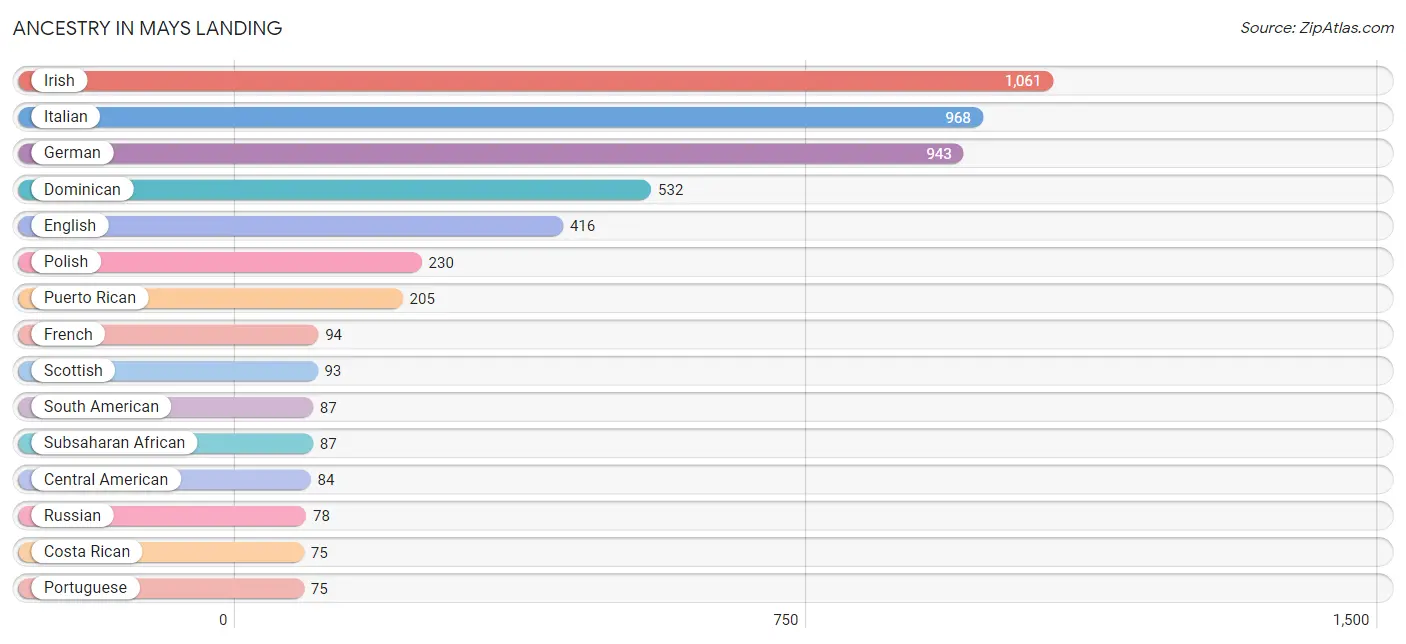
Ancestry in Mays Landing
The most populous ancestries reported in Mays Landing are Irish (1,061 | 17.2%), Italian (968 | 15.7%), German (943 | 15.2%), Dominican (532 | 8.6%), and English (416 | 6.7%), together accounting for 63.4% of all Mays Landing residents.
| Ancestry | # Population | % Population |
| African | 16 | 0.3% |
| American | 54 | 0.9% |
| Austrian | 42 | 0.7% |
| Bhutanese | 3 | 0.1% |
| Burmese | 19 | 0.3% |
| Central American | 84 | 1.4% |
| Cherokee | 6 | 0.1% |
| Costa Rican | 75 | 1.2% |
| Czech | 9 | 0.2% |
| Czechoslovakian | 26 | 0.4% |
| Dominican | 532 | 8.6% |
| Dutch | 40 | 0.6% |
| Eastern European | 39 | 0.6% |
| Ecuadorian | 67 | 1.1% |
| English | 416 | 6.7% |
| European | 21 | 0.3% |
| French | 94 | 1.5% |
| French Canadian | 21 | 0.3% |
| German | 943 | 15.2% |
| Greek | 73 | 1.2% |
| Haitian | 40 | 0.6% |
| Hungarian | 16 | 0.3% |
| Indian (Asian) | 17 | 0.3% |
| Irish | 1,061 | 17.2% |
| Italian | 968 | 15.7% |
| Japanese | 6 | 0.1% |
| Korean | 70 | 1.1% |
| Latvian | 7 | 0.1% |
| Lithuanian | 12 | 0.2% |
| Mexican | 59 | 0.9% |
| Nigerian | 71 | 1.1% |
| Norwegian | 38 | 0.6% |
| Polish | 230 | 3.7% |
| Portuguese | 75 | 1.2% |
| Puerto Rican | 205 | 3.3% |
| Romanian | 37 | 0.6% |
| Russian | 78 | 1.3% |
| Salvadoran | 9 | 0.2% |
| Scotch-Irish | 49 | 0.8% |
| Scottish | 93 | 1.5% |
| Slovak | 18 | 0.3% |
| South American | 87 | 1.4% |
| Spaniard | 9 | 0.2% |
| Subsaharan African | 87 | 1.4% |
| Thai | 45 | 0.7% |
| Ukrainian | 12 | 0.2% |
| Venezuelan | 20 | 0.3% |
| Welsh | 10 | 0.2% | View All 48 Rows |
Immigrants in Mays Landing
The most numerous immigrant groups reported in Mays Landing came from Latin America (352 | 5.7%), Caribbean (261 | 4.2%), Dominican Republic (261 | 4.2%), Asia (117 | 1.9%), and Central America (81 | 1.3%), together accounting for 17.3% of all Mays Landing residents.
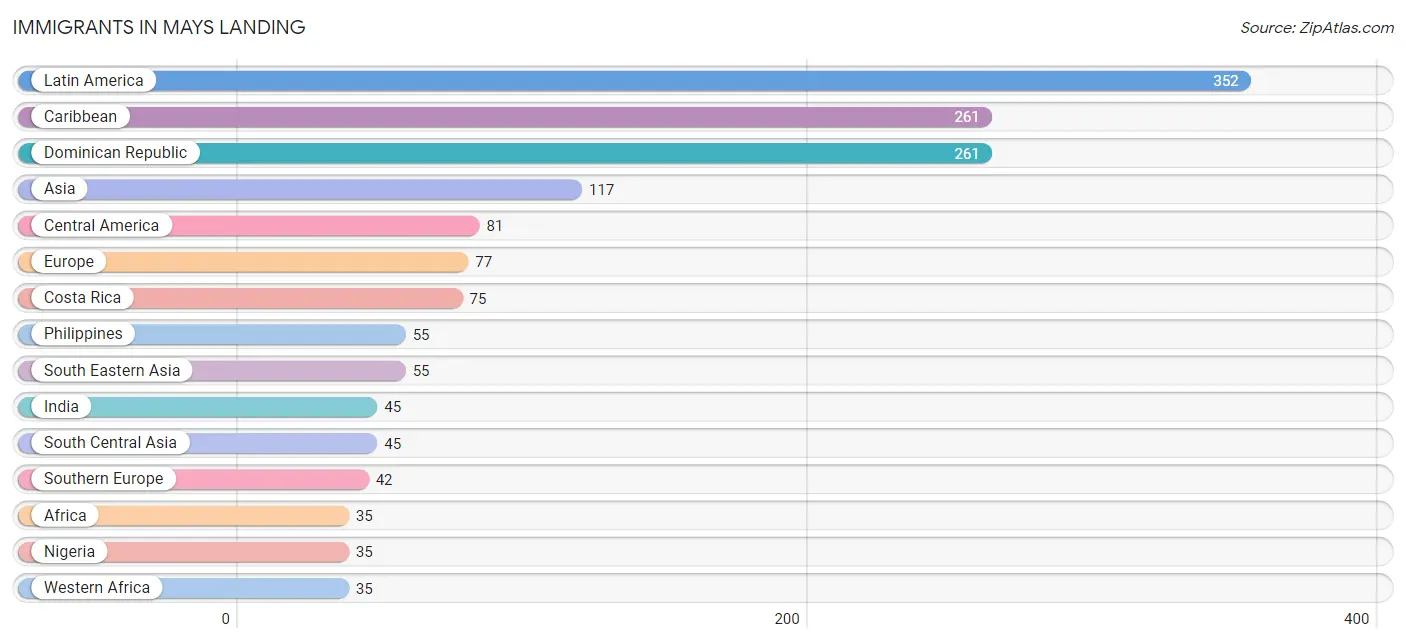
| Immigration Origin | # Population | % Population |
| Africa | 35 | 0.6% |
| Asia | 117 | 1.9% |
| Caribbean | 261 | 4.2% |
| Central America | 81 | 1.3% |
| China | 17 | 0.3% |
| Costa Rica | 75 | 1.2% |
| Dominican Republic | 261 | 4.2% |
| Eastern Asia | 17 | 0.3% |
| Eastern Europe | 7 | 0.1% |
| Europe | 77 | 1.3% |
| India | 45 | 0.7% |
| Italy | 15 | 0.2% |
| Latin America | 352 | 5.7% |
| Latvia | 7 | 0.1% |
| Mexico | 6 | 0.1% |
| Nigeria | 35 | 0.6% |
| Philippines | 55 | 0.9% |
| Portugal | 27 | 0.4% |
| South America | 10 | 0.2% |
| South Central Asia | 45 | 0.7% |
| South Eastern Asia | 55 | 0.9% |
| Southern Europe | 42 | 0.7% |
| Switzerland | 28 | 0.4% |
| Venezuela | 10 | 0.2% |
| Western Africa | 35 | 0.6% |
| Western Europe | 28 | 0.4% | View All 26 Rows |
Sex and Age in Mays Landing
Sex and Age in Mays Landing
The most populous age groups in Mays Landing are 10 to 14 Years (409 | 12.6%) for men and 60 to 64 Years (299 | 10.2%) for women.
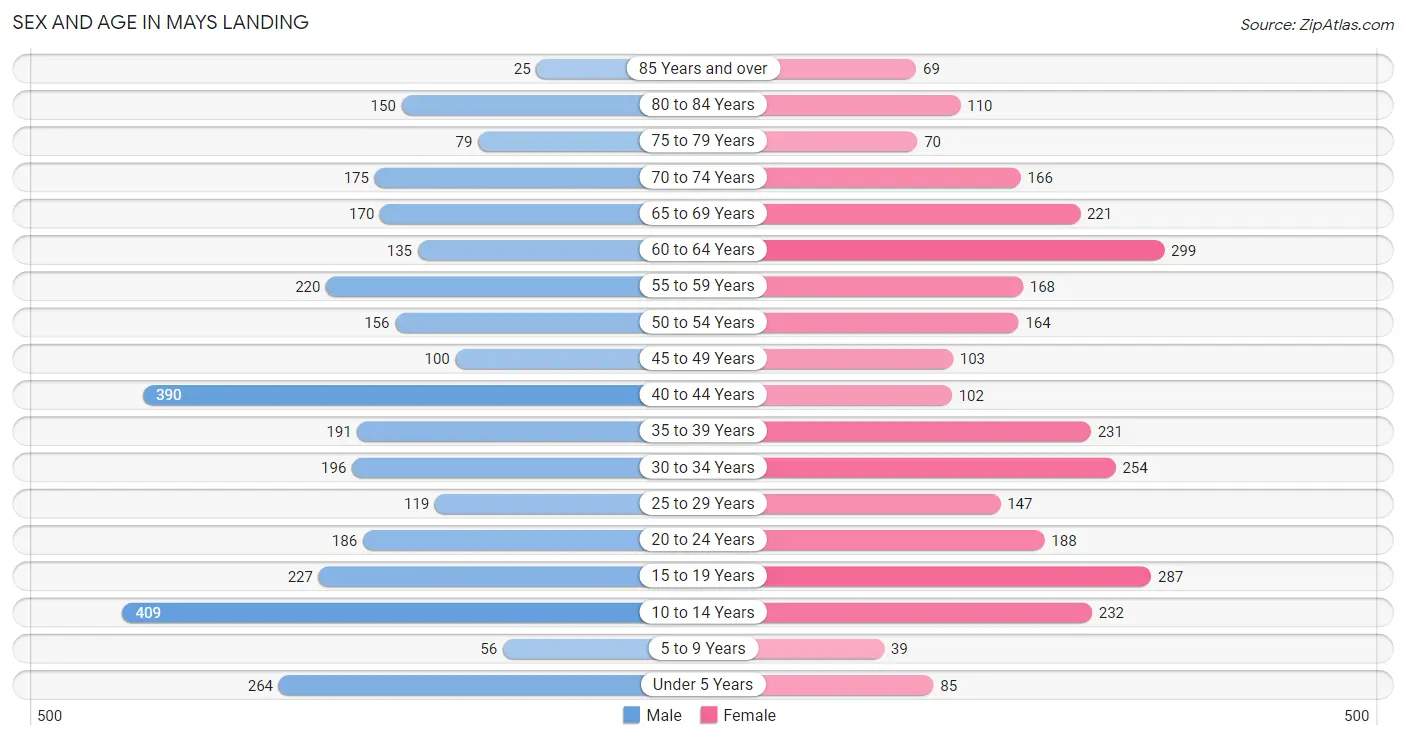
| Age Bracket | Male | Female |
| Under 5 Years | 264 (8.1%) | 85 (2.9%) |
| 5 to 9 Years | 56 (1.7%) | 39 (1.3%) |
| 10 to 14 Years | 409 (12.6%) | 232 (7.9%) |
| 15 to 19 Years | 227 (7.0%) | 287 (9.8%) |
| 20 to 24 Years | 186 (5.7%) | 188 (6.4%) |
| 25 to 29 Years | 119 (3.7%) | 147 (5.0%) |
| 30 to 34 Years | 196 (6.0%) | 254 (8.6%) |
| 35 to 39 Years | 191 (5.9%) | 231 (7.9%) |
| 40 to 44 Years | 390 (12.0%) | 102 (3.5%) |
| 45 to 49 Years | 100 (3.1%) | 103 (3.5%) |
| 50 to 54 Years | 156 (4.8%) | 164 (5.6%) |
| 55 to 59 Years | 220 (6.8%) | 168 (5.7%) |
| 60 to 64 Years | 135 (4.2%) | 299 (10.2%) |
| 65 to 69 Years | 170 (5.2%) | 221 (7.5%) |
| 70 to 74 Years | 175 (5.4%) | 166 (5.7%) |
| 75 to 79 Years | 79 (2.4%) | 70 (2.4%) |
| 80 to 84 Years | 150 (4.6%) | 110 (3.7%) |
| 85 Years and over | 25 (0.8%) | 69 (2.4%) |
| Total | 3,248 (100.0%) | 2,935 (100.0%) |
Families and Households in Mays Landing
Median Family Size in Mays Landing
The median family size in Mays Landing is 3.07 persons per family, with single female/mother families (293 | 21.4%) accounting for the largest median family size of 3.69 persons per family. On the other hand, single male/father families (220 | 16.1%) represent the smallest median family size with 2.60 persons per family.
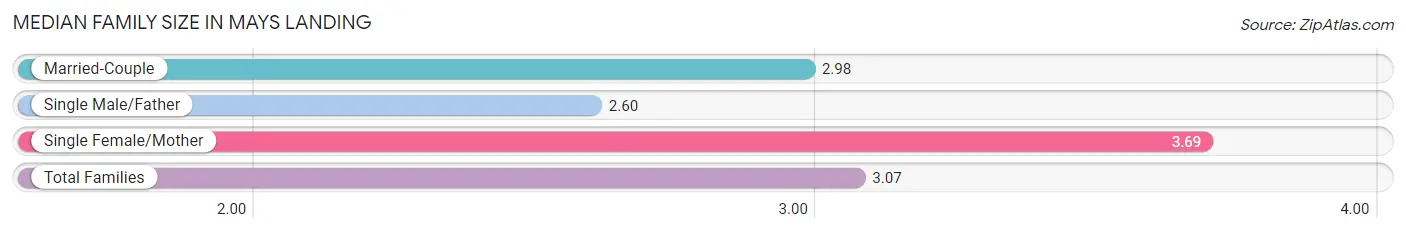
| Family Type | # Families | Family Size |
| Married-Couple | 854 (62.5%) | 2.98 |
| Single Male/Father | 220 (16.1%) | 2.60 |
| Single Female/Mother | 293 (21.4%) | 3.69 |
| Total Families | 1,367 (100.0%) | 3.07 |
Median Household Size in Mays Landing
The median household size in Mays Landing is 2.29 persons per household, with single female/mother households (293 | 11.9%) accounting for the largest median household size of 4 persons per household. non-family households (1,093 | 44.4%) represent the smallest median household size with 1.17 persons per household.
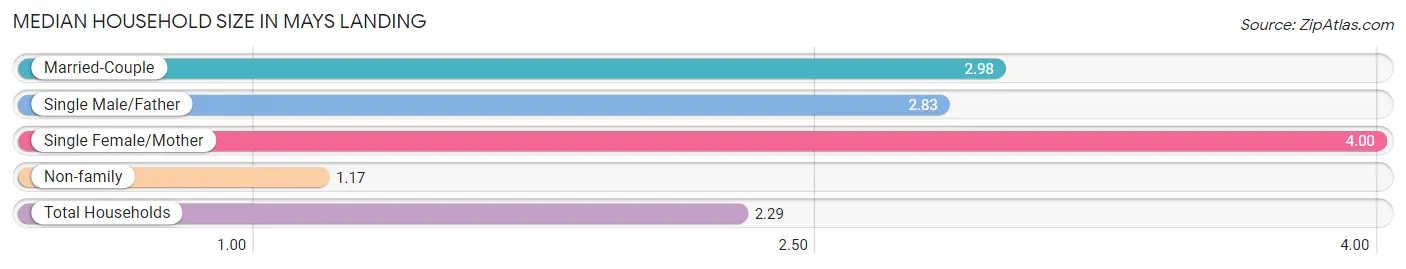
| Household Type | # Households | Household Size |
| Married-Couple | 854 (34.7%) | 2.98 |
| Single Male/Father | 220 (8.9%) | 2.83 |
| Single Female/Mother | 293 (11.9%) | 4.00 |
| Non-family | 1,093 (44.4%) | 1.17 |
| Total Households | 2,460 (100.0%) | 2.29 |
Household Size by Marriage Status in Mays Landing
Out of a total of 2,460 households in Mays Landing, 1,367 (55.6%) are family households, while 1,093 (44.4%) are nonfamily households. The most numerous type of family households are 2-person households, comprising 689, and the most common type of nonfamily households are 1-person households, comprising 956.
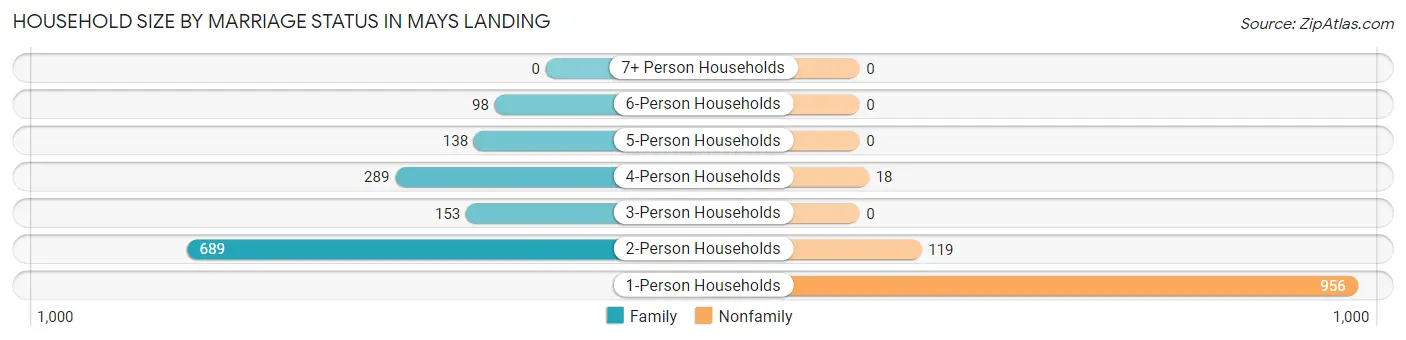
| Household Size | Family Households | Nonfamily Households |
| 1-Person Households | - | 956 (38.9%) |
| 2-Person Households | 689 (28.0%) | 119 (4.8%) |
| 3-Person Households | 153 (6.2%) | 0 (0.0%) |
| 4-Person Households | 289 (11.7%) | 18 (0.7%) |
| 5-Person Households | 138 (5.6%) | 0 (0.0%) |
| 6-Person Households | 98 (4.0%) | 0 (0.0%) |
| 7+ Person Households | 0 (0.0%) | 0 (0.0%) |
| Total | 1,367 (55.6%) | 1,093 (44.4%) |
Female Fertility in Mays Landing
Fertility by Age in Mays Landing
Average fertility rate in Mays Landing is 58.0 births per 1,000 women. Women in the age bracket of 20 to 34 years have the highest fertility rate with 131.0 births per 1,000 women. Women in the age bracket of 20 to 34 years acount for 100.0% of all women with births.
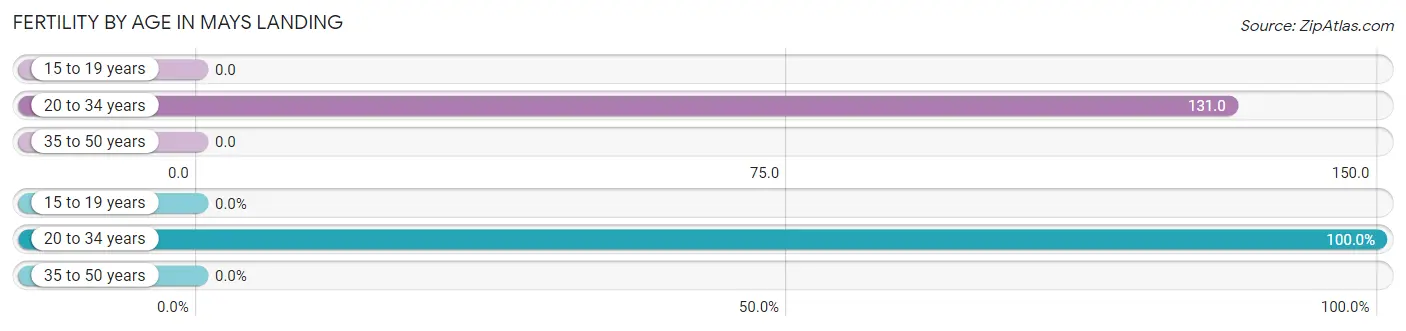
| Age Bracket | Women with Births | Births / 1,000 Women |
| 15 to 19 years | 0 (0.0%) | 0.0 |
| 20 to 34 years | 77 (100.0%) | 131.0 |
| 35 to 50 years | 0 (0.0%) | 0.0 |
| Total | 77 (100.0%) | 58.0 |
Fertility by Age by Marriage Status in Mays Landing
23.4% of women with births (77) in Mays Landing are married. The highest percentage of unmarried women with births falls into 20 to 34 years age bracket with 76.6% of them unmarried at the time of birth, while the lowest percentage of unmarried women with births belong to 20 to 34 years age bracket with 76.6% of them unmarried.
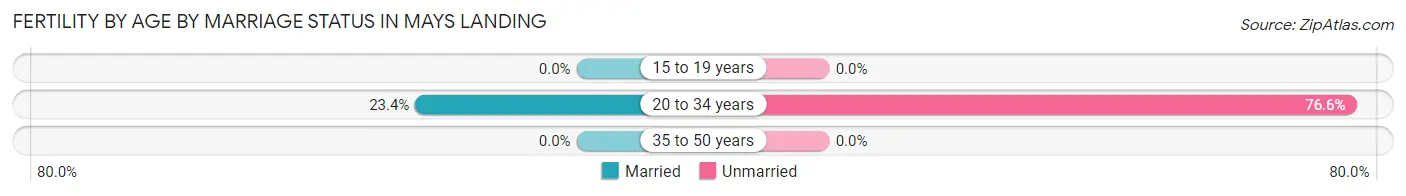
| Age Bracket | Married | Unmarried |
| 15 to 19 years | 0 (0.0%) | 0 (0.0%) |
| 20 to 34 years | 18 (23.4%) | 59 (76.6%) |
| 35 to 50 years | 0 (0.0%) | 0 (0.0%) |
| Total | 18 (23.4%) | 59 (76.6%) |
Fertility by Education in Mays Landing
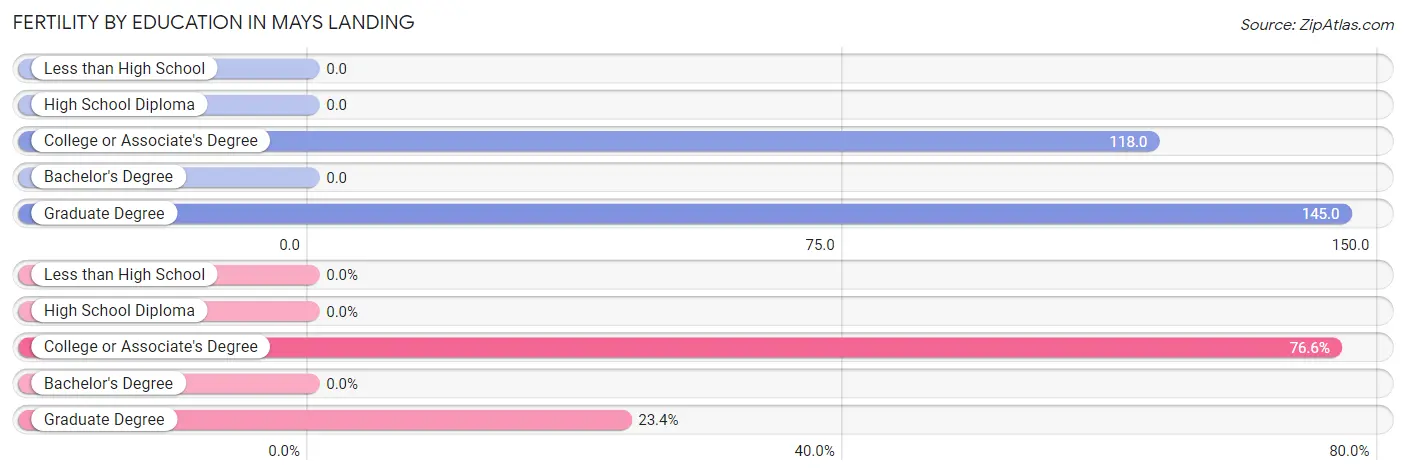
| Educational Attainment | Women with Births | Births / 1,000 Women |
| Less than High School | 0 (0.0%) | 0.0 |
| High School Diploma | 0 (0.0%) | 0.0 |
| College or Associate's Degree | 59 (76.6%) | 118.0 |
| Bachelor's Degree | 0 (0.0%) | 0.0 |
| Graduate Degree | 18 (23.4%) | 145.0 |
| Total | 77 (100.0%) | 58.0 |
Fertility by Education by Marriage Status in Mays Landing
76.6% of women with births in Mays Landing are unmarried. Women with the educational attainment of graduate degree are most likely to be married with 100.0% of them married at childbirth, while women with the educational attainment of college or associate's degree are least likely to be married with 100.0% of them unmarried at childbirth.
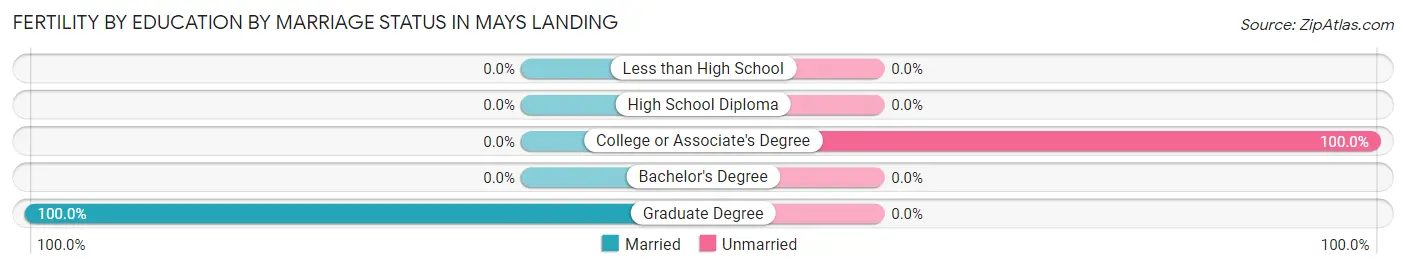
| Educational Attainment | Married | Unmarried |
| Less than High School | 0 (0.0%) | 0 (0.0%) |
| High School Diploma | 0 (0.0%) | 0 (0.0%) |
| College or Associate's Degree | 0 (0.0%) | 59 (100.0%) |
| Bachelor's Degree | 0 (0.0%) | 0 (0.0%) |
| Graduate Degree | 18 (100.0%) | 0 (0.0%) |
| Total | 18 (23.4%) | 59 (76.6%) |
Employment Characteristics in Mays Landing
Employment by Class of Employer in Mays Landing
Among the 2,670 employed individuals in Mays Landing, private company employees (1,814 | 67.9%), local government employees (261 | 9.8%), and self-employed (not incorporated) (242 | 9.1%) make up the most common classes of employment.
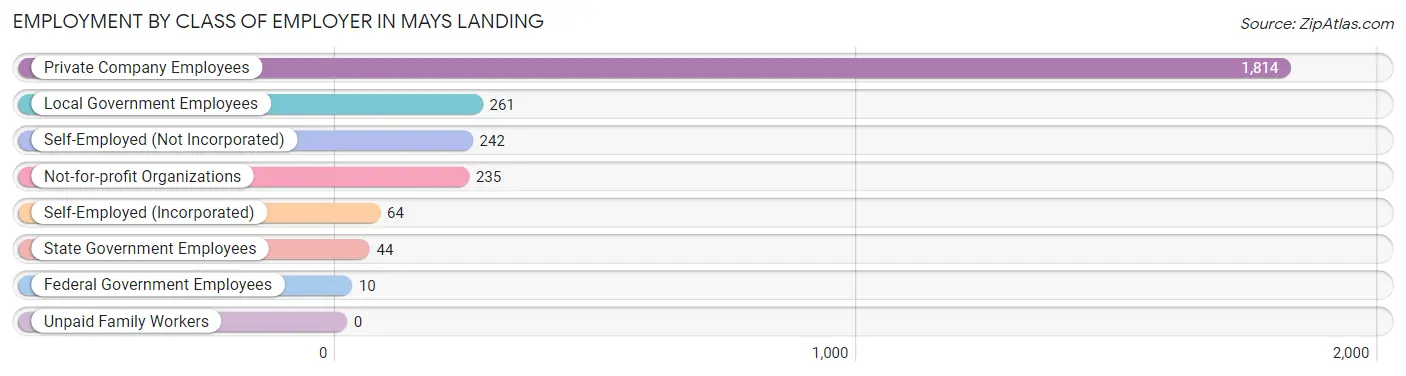
| Employer Class | # Employees | % Employees |
| Private Company Employees | 1,814 | 67.9% |
| Self-Employed (Incorporated) | 64 | 2.4% |
| Self-Employed (Not Incorporated) | 242 | 9.1% |
| Not-for-profit Organizations | 235 | 8.8% |
| Local Government Employees | 261 | 9.8% |
| State Government Employees | 44 | 1.7% |
| Federal Government Employees | 10 | 0.4% |
| Unpaid Family Workers | 0 | 0.0% |
| Total | 2,670 | 100.0% |
Employment Status by Age in Mays Landing
According to the labor force statistics for Mays Landing, out of the total population over 16 years of age (4,951), 62.9% or 3,114 individuals are in the labor force, with 13.1% or 408 of them unemployed. The age group with the highest labor force participation rate is 55 to 59 years, with 87.1% or 338 individuals in the labor force. Within the labor force, the 16 to 19 years age range has the highest percentage of unemployed individuals, with 62.8% or 123 of them being unemployed.
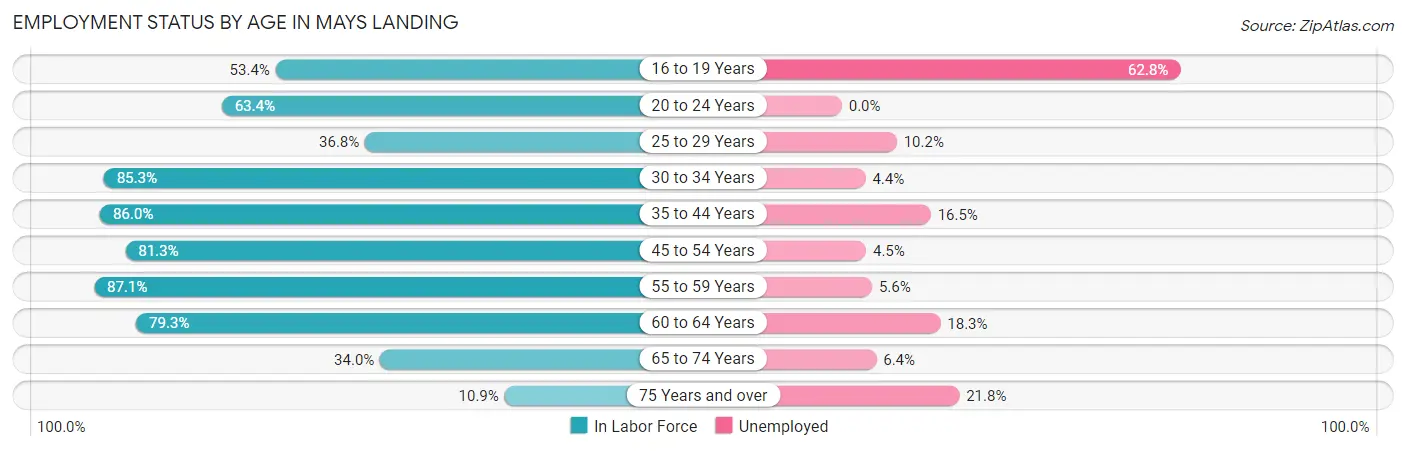
| Age Bracket | In Labor Force | Unemployed |
| 16 to 19 Years | 196 (53.4%) | 123 (62.8%) |
| 20 to 24 Years | 237 (63.4%) | 0 (0.0%) |
| 25 to 29 Years | 98 (36.8%) | 10 (10.2%) |
| 30 to 34 Years | 384 (85.3%) | 17 (4.4%) |
| 35 to 44 Years | 786 (86.0%) | 130 (16.5%) |
| 45 to 54 Years | 425 (81.3%) | 19 (4.5%) |
| 55 to 59 Years | 338 (87.1%) | 19 (5.6%) |
| 60 to 64 Years | 344 (79.3%) | 63 (18.3%) |
| 65 to 74 Years | 249 (34.0%) | 16 (6.4%) |
| 75 Years and over | 55 (10.9%) | 12 (21.8%) |
| Total | 3,114 (62.9%) | 408 (13.1%) |
Employment Status by Educational Attainment in Mays Landing
According to labor force statistics for Mays Landing, 79.8% of individuals (2,374) out of the total population between 25 and 64 years of age (2,975) are in the labor force, with 10.9% or 259 of them being unemployed. The group with the highest labor force participation rate are those with the educational attainment of bachelor's degree or higher, with 88.7% or 847 individuals in the labor force. Within the labor force, individuals with less than high school education have the highest percentage of unemployment, with 25.9% or 43 of them being unemployed.
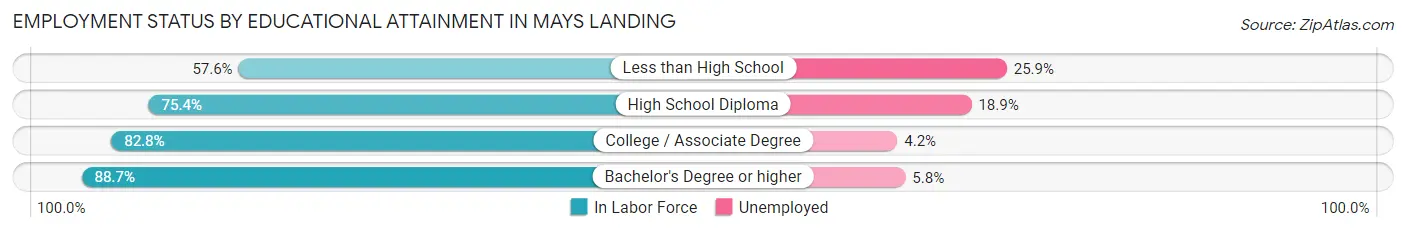
| Educational Attainment | In Labor Force | Unemployed |
| Less than High School | 166 (57.6%) | 75 (25.9%) |
| High School Diploma | 740 (75.4%) | 185 (18.9%) |
| College / Associate Degree | 622 (82.8%) | 32 (4.2%) |
| Bachelor's Degree or higher | 847 (88.7%) | 55 (5.8%) |
| Total | 2,374 (79.8%) | 324 (10.9%) |
Employment Occupations by Sex in Mays Landing
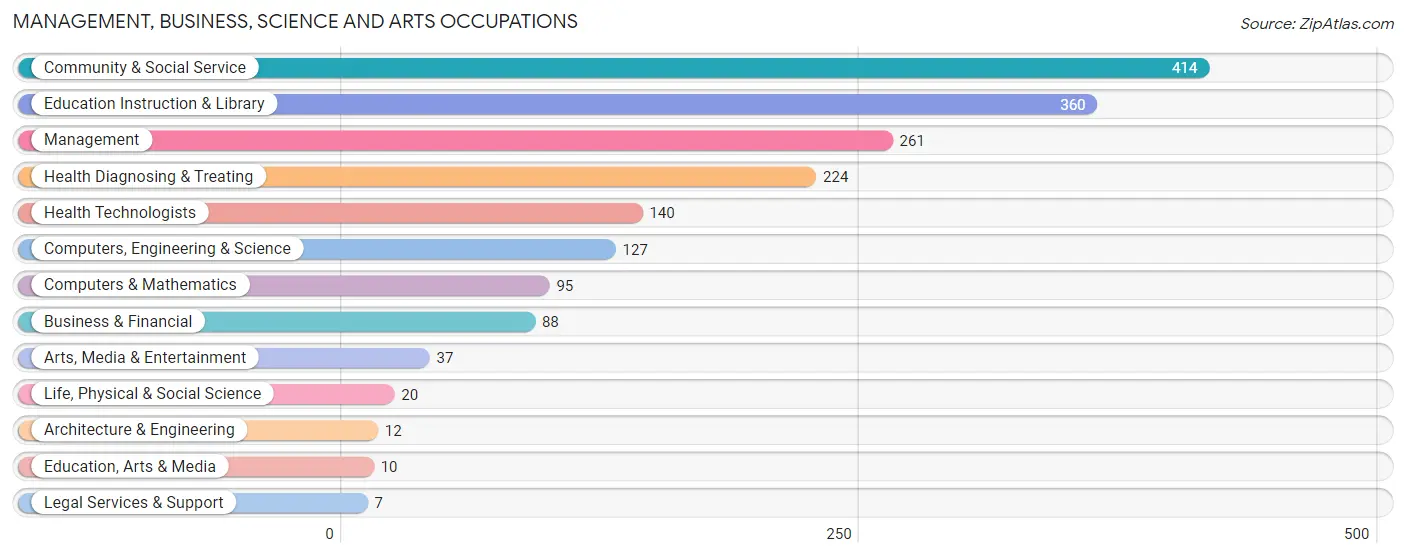
Management, Business, Science and Arts Occupations
The most common Management, Business, Science and Arts occupations in Mays Landing are Community & Social Service (414 | 15.3%), Education Instruction & Library (360 | 13.3%), Management (261 | 9.7%), Health Diagnosing & Treating (224 | 8.3%), and Health Technologists (140 | 5.2%).
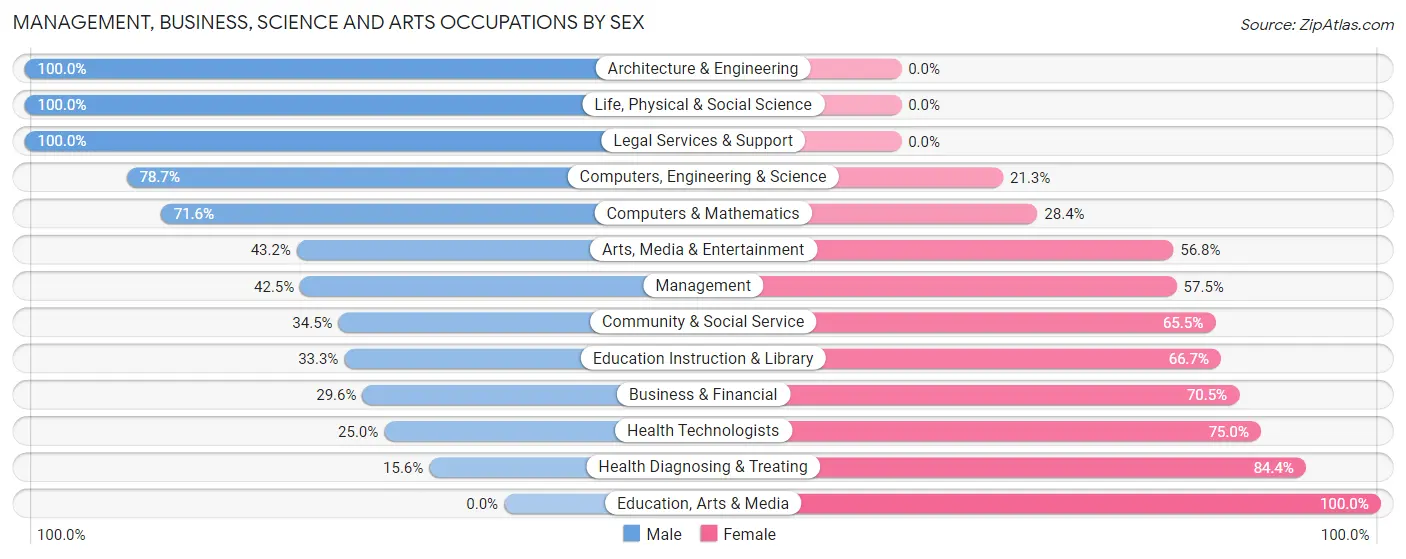
Management, Business, Science and Arts Occupations by Sex
Within the Management, Business, Science and Arts occupations in Mays Landing, the most male-oriented occupations are Architecture & Engineering (100.0%), Life, Physical & Social Science (100.0%), and Legal Services & Support (100.0%), while the most female-oriented occupations are Education, Arts & Media (100.0%), Health Diagnosing & Treating (84.4%), and Health Technologists (75.0%).
| Occupation | Male | Female |
| Management | 111 (42.5%) | 150 (57.5%) |
| Business & Financial | 26 (29.5%) | 62 (70.5%) |
| Computers, Engineering & Science | 100 (78.7%) | 27 (21.3%) |
| Computers & Mathematics | 68 (71.6%) | 27 (28.4%) |
| Architecture & Engineering | 12 (100.0%) | 0 (0.0%) |
| Life, Physical & Social Science | 20 (100.0%) | 0 (0.0%) |
| Community & Social Service | 143 (34.5%) | 271 (65.5%) |
| Education, Arts & Media | 0 (0.0%) | 10 (100.0%) |
| Legal Services & Support | 7 (100.0%) | 0 (0.0%) |
| Education Instruction & Library | 120 (33.3%) | 240 (66.7%) |
| Arts, Media & Entertainment | 16 (43.2%) | 21 (56.8%) |
| Health Diagnosing & Treating | 35 (15.6%) | 189 (84.4%) |
| Health Technologists | 35 (25.0%) | 105 (75.0%) |
| Total (Category) | 415 (37.2%) | 699 (62.7%) |
| Total (Overall) | 1,320 (48.8%) | 1,383 (51.2%) |
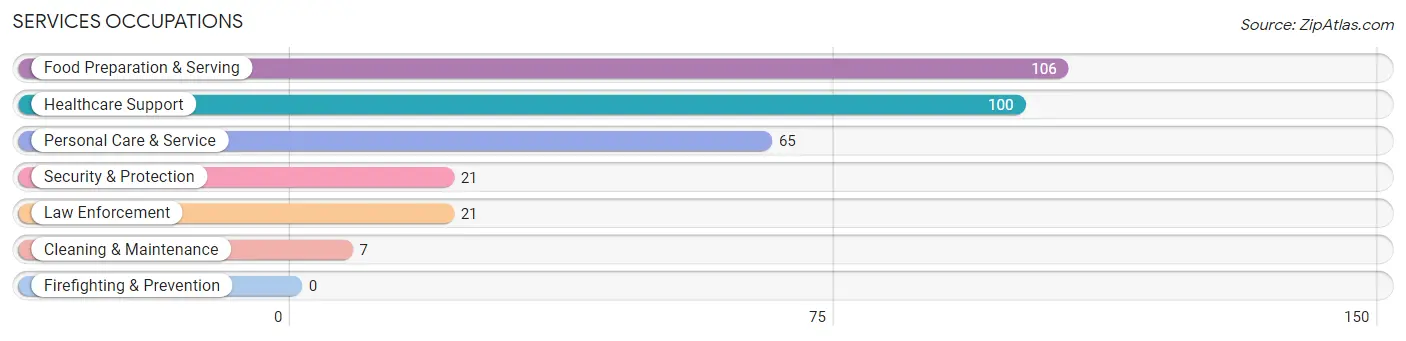
Services Occupations
The most common Services occupations in Mays Landing are Food Preparation & Serving (106 | 3.9%), Healthcare Support (100 | 3.7%), Personal Care & Service (65 | 2.4%), Security & Protection (21 | 0.8%), and Law Enforcement (21 | 0.8%).
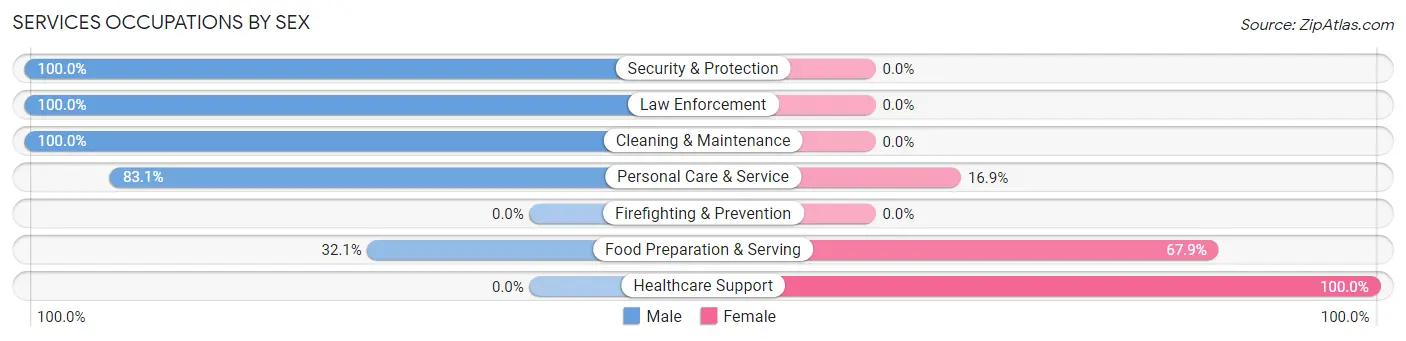
Services Occupations by Sex
Within the Services occupations in Mays Landing, the most male-oriented occupations are Security & Protection (100.0%), Law Enforcement (100.0%), and Cleaning & Maintenance (100.0%), while the most female-oriented occupations are Healthcare Support (100.0%), Food Preparation & Serving (67.9%), and Personal Care & Service (16.9%).
| Occupation | Male | Female |
| Healthcare Support | 0 (0.0%) | 100 (100.0%) |
| Security & Protection | 21 (100.0%) | 0 (0.0%) |
| Firefighting & Prevention | 0 (0.0%) | 0 (0.0%) |
| Law Enforcement | 21 (100.0%) | 0 (0.0%) |
| Food Preparation & Serving | 34 (32.1%) | 72 (67.9%) |
| Cleaning & Maintenance | 7 (100.0%) | 0 (0.0%) |
| Personal Care & Service | 54 (83.1%) | 11 (16.9%) |
| Total (Category) | 116 (38.8%) | 183 (61.2%) |
| Total (Overall) | 1,320 (48.8%) | 1,383 (51.2%) |
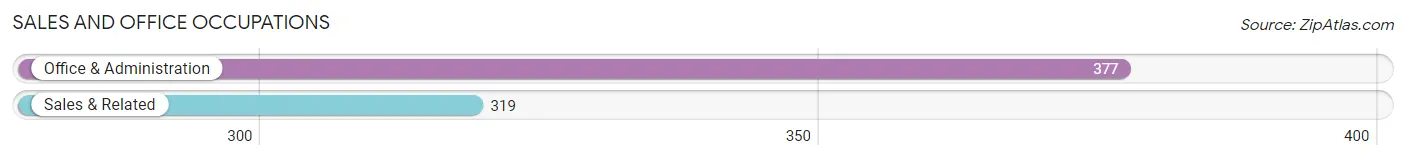
Sales and Office Occupations
The most common Sales and Office occupations in Mays Landing are Office & Administration (377 | 14.0%), and Sales & Related (319 | 11.8%).
Sales and Office Occupations by Sex
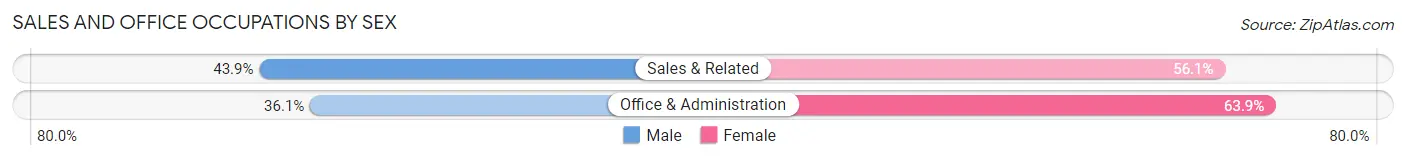
| Occupation | Male | Female |
| Sales & Related | 140 (43.9%) | 179 (56.1%) |
| Office & Administration | 136 (36.1%) | 241 (63.9%) |
| Total (Category) | 276 (39.7%) | 420 (60.3%) |
| Total (Overall) | 1,320 (48.8%) | 1,383 (51.2%) |
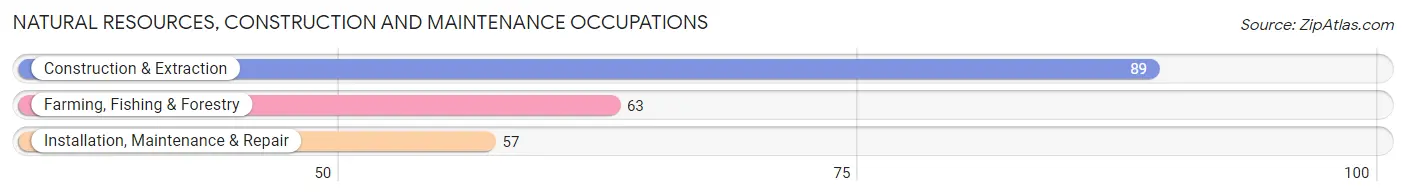
Natural Resources, Construction and Maintenance Occupations
The most common Natural Resources, Construction and Maintenance occupations in Mays Landing are Construction & Extraction (89 | 3.3%), Farming, Fishing & Forestry (63 | 2.3%), and Installation, Maintenance & Repair (57 | 2.1%).
Natural Resources, Construction and Maintenance Occupations by Sex
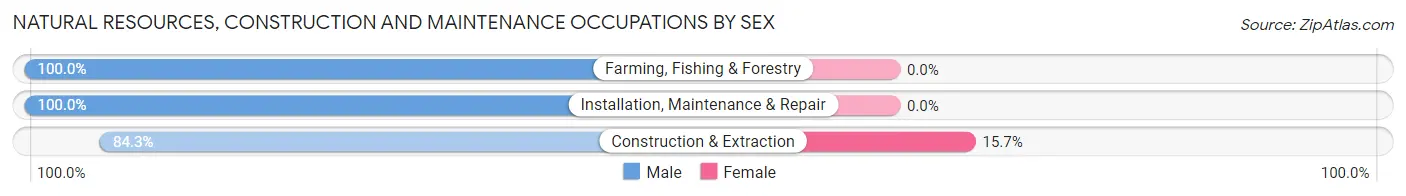
| Occupation | Male | Female |
| Farming, Fishing & Forestry | 63 (100.0%) | 0 (0.0%) |
| Construction & Extraction | 75 (84.3%) | 14 (15.7%) |
| Installation, Maintenance & Repair | 57 (100.0%) | 0 (0.0%) |
| Total (Category) | 195 (93.3%) | 14 (6.7%) |
| Total (Overall) | 1,320 (48.8%) | 1,383 (51.2%) |
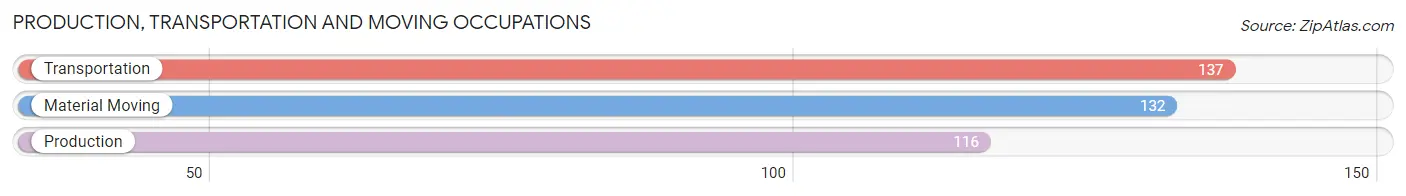
Production, Transportation and Moving Occupations
The most common Production, Transportation and Moving occupations in Mays Landing are Transportation (137 | 5.1%), Material Moving (132 | 4.9%), and Production (116 | 4.3%).
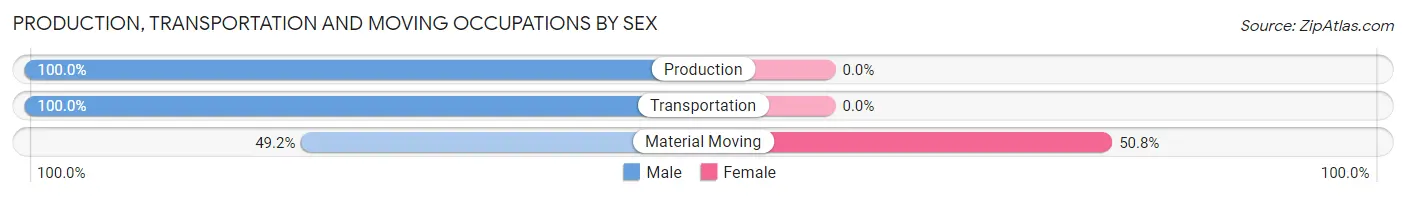
Production, Transportation and Moving Occupations by Sex
| Occupation | Male | Female |
| Production | 116 (100.0%) | 0 (0.0%) |
| Transportation | 137 (100.0%) | 0 (0.0%) |
| Material Moving | 65 (49.2%) | 67 (50.8%) |
| Total (Category) | 318 (82.6%) | 67 (17.4%) |
| Total (Overall) | 1,320 (48.8%) | 1,383 (51.2%) |
Employment Industries by Sex in Mays Landing
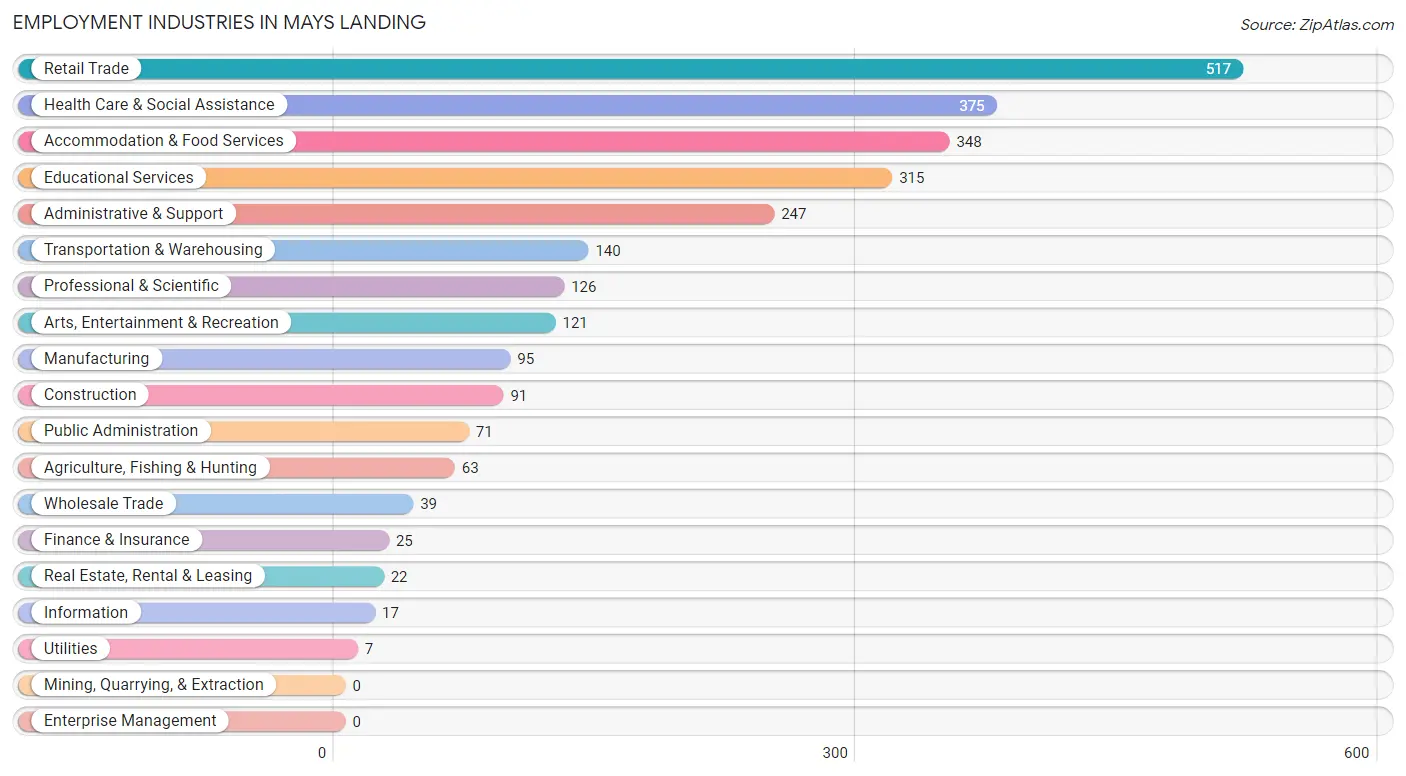
Employment Industries in Mays Landing
The major employment industries in Mays Landing include Retail Trade (517 | 19.1%), Health Care & Social Assistance (375 | 13.9%), Accommodation & Food Services (348 | 12.9%), Educational Services (315 | 11.7%), and Administrative & Support (247 | 9.1%).
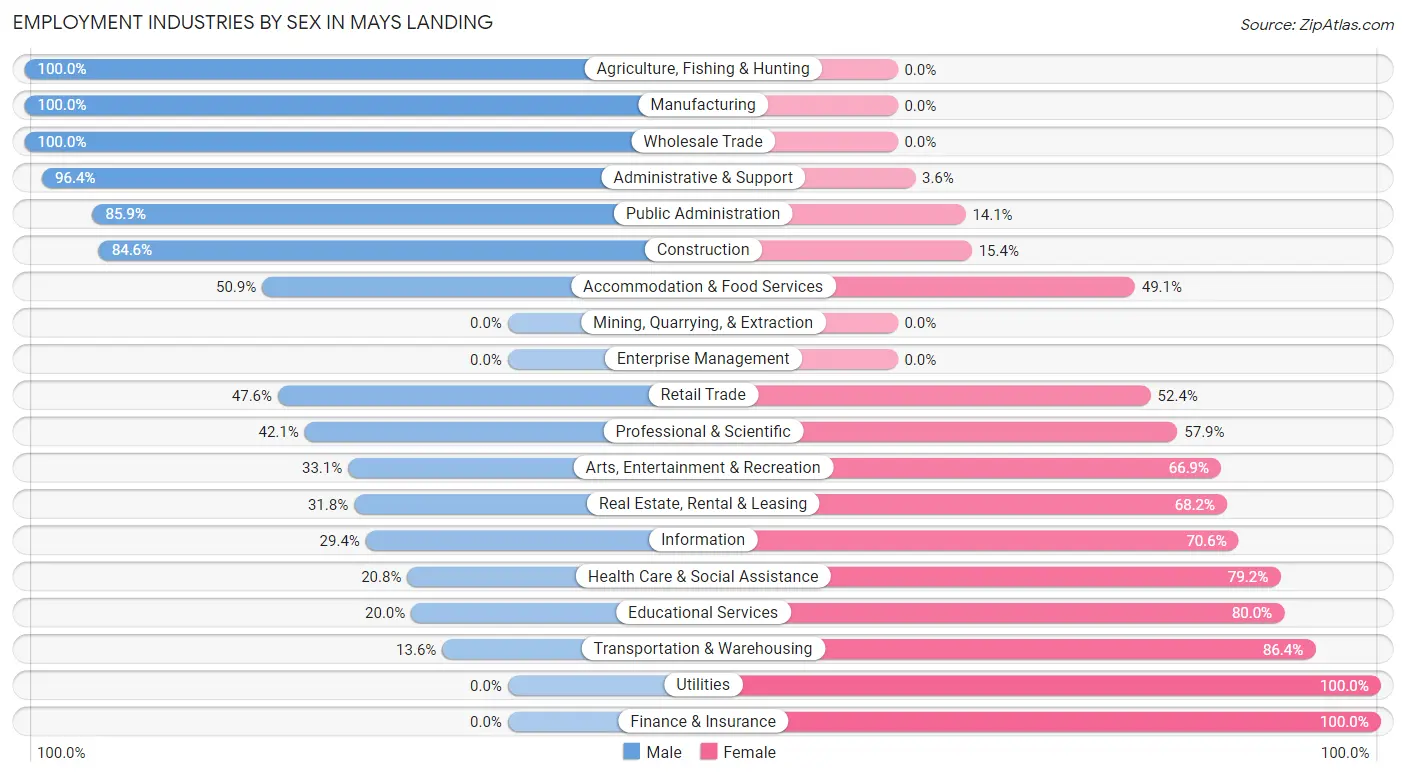
Employment Industries by Sex in Mays Landing
The Mays Landing industries that see more men than women are Agriculture, Fishing & Hunting (100.0%), Manufacturing (100.0%), and Wholesale Trade (100.0%), whereas the industries that tend to have a higher number of women are Utilities (100.0%), Finance & Insurance (100.0%), and Transportation & Warehousing (86.4%).
| Industry | Male | Female |
| Agriculture, Fishing & Hunting | 63 (100.0%) | 0 (0.0%) |
| Mining, Quarrying, & Extraction | 0 (0.0%) | 0 (0.0%) |
| Construction | 77 (84.6%) | 14 (15.4%) |
| Manufacturing | 95 (100.0%) | 0 (0.0%) |
| Wholesale Trade | 39 (100.0%) | 0 (0.0%) |
| Retail Trade | 246 (47.6%) | 271 (52.4%) |
| Transportation & Warehousing | 19 (13.6%) | 121 (86.4%) |
| Utilities | 0 (0.0%) | 7 (100.0%) |
| Information | 5 (29.4%) | 12 (70.6%) |
| Finance & Insurance | 0 (0.0%) | 25 (100.0%) |
| Real Estate, Rental & Leasing | 7 (31.8%) | 15 (68.2%) |
| Professional & Scientific | 53 (42.1%) | 73 (57.9%) |
| Enterprise Management | 0 (0.0%) | 0 (0.0%) |
| Administrative & Support | 238 (96.4%) | 9 (3.6%) |
| Educational Services | 63 (20.0%) | 252 (80.0%) |
| Health Care & Social Assistance | 78 (20.8%) | 297 (79.2%) |
| Arts, Entertainment & Recreation | 40 (33.1%) | 81 (66.9%) |
| Accommodation & Food Services | 177 (50.9%) | 171 (49.1%) |
| Public Administration | 61 (85.9%) | 10 (14.1%) |
| Total | 1,320 (48.8%) | 1,383 (51.2%) |
Education in Mays Landing
School Enrollment in Mays Landing
The most common levels of schooling among the 1,509 students in Mays Landing are middle school (688 | 45.6%), college / undergraduate (312 | 20.7%), and high school (247 | 16.4%).
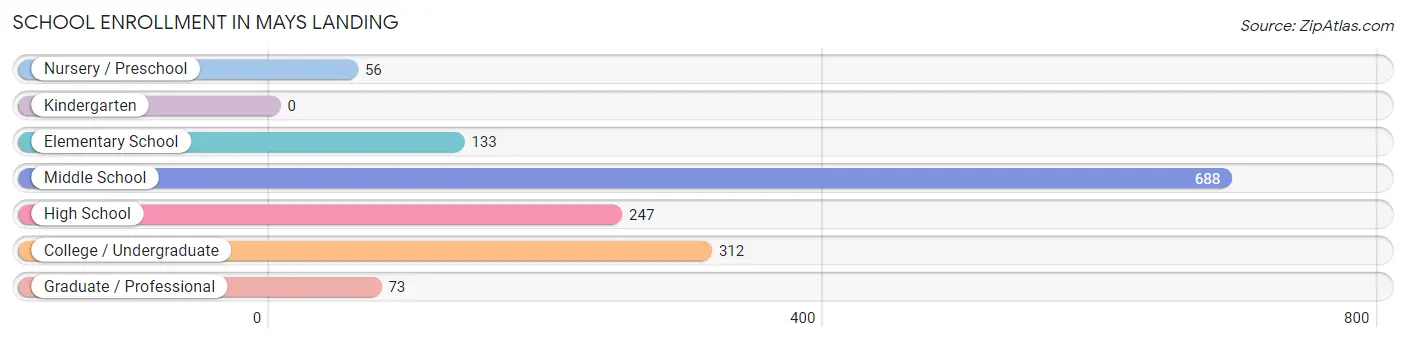
| School Level | # Students | % Students |
| Nursery / Preschool | 56 | 3.7% |
| Kindergarten | 0 | 0.0% |
| Elementary School | 133 | 8.8% |
| Middle School | 688 | 45.6% |
| High School | 247 | 16.4% |
| College / Undergraduate | 312 | 20.7% |
| Graduate / Professional | 73 | 4.8% |
| Total | 1,509 | 100.0% |
School Enrollment by Age by Funding Source in Mays Landing
Out of a total of 1,509 students who are enrolled in schools in Mays Landing, 112 (7.4%) attend a private institution, while the remaining 1,397 (92.6%) are enrolled in public schools. The age group of 35 years and over has the highest likelihood of being enrolled in private schools, with 12 (30.8% in the age bracket) enrolled. Conversely, the age group of 3 to 4 year olds has the lowest likelihood of being enrolled in a private school, with 56 (100.0% in the age bracket) attending a public institution.
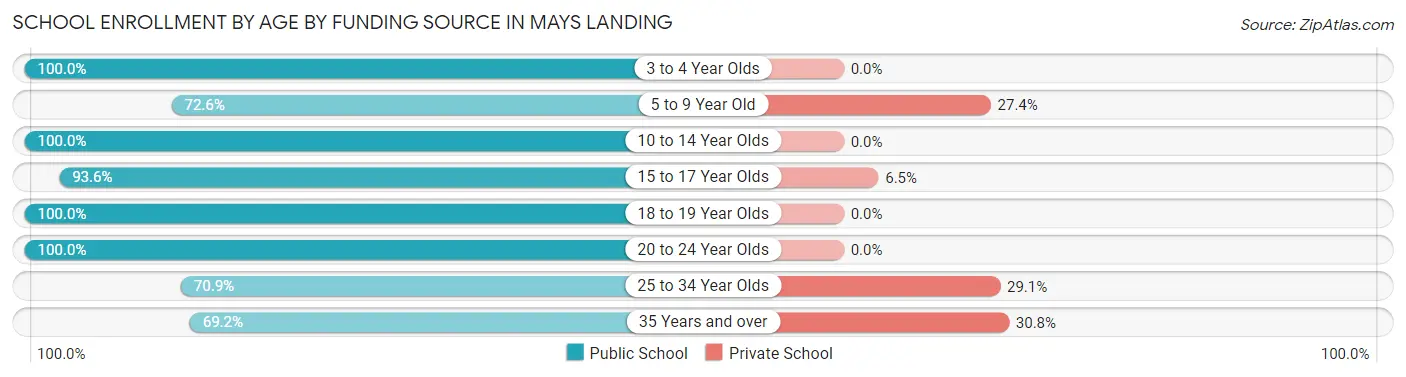
| Age Bracket | Public School | Private School |
| 3 to 4 Year Olds | 56 (100.0%) | 0 (0.0%) |
| 5 to 9 Year Old | 69 (72.6%) | 26 (27.4%) |
| 10 to 14 Year Olds | 641 (100.0%) | 0 (0.0%) |
| 15 to 17 Year Olds | 290 (93.5%) | 20 (6.5%) |
| 18 to 19 Year Olds | 50 (100.0%) | 0 (0.0%) |
| 20 to 24 Year Olds | 136 (100.0%) | 0 (0.0%) |
| 25 to 34 Year Olds | 129 (70.9%) | 53 (29.1%) |
| 35 Years and over | 27 (69.2%) | 12 (30.8%) |
| Total | 1,397 (92.6%) | 112 (7.4%) |
Educational Attainment by Field of Study in Mays Landing
Education (326 | 20.8%), business (258 | 16.5%), science & technology (241 | 15.4%), arts & humanities (144 | 9.2%), and psychology (135 | 8.6%) are the most common fields of study among 1,564 individuals in Mays Landing who have obtained a bachelor's degree or higher.
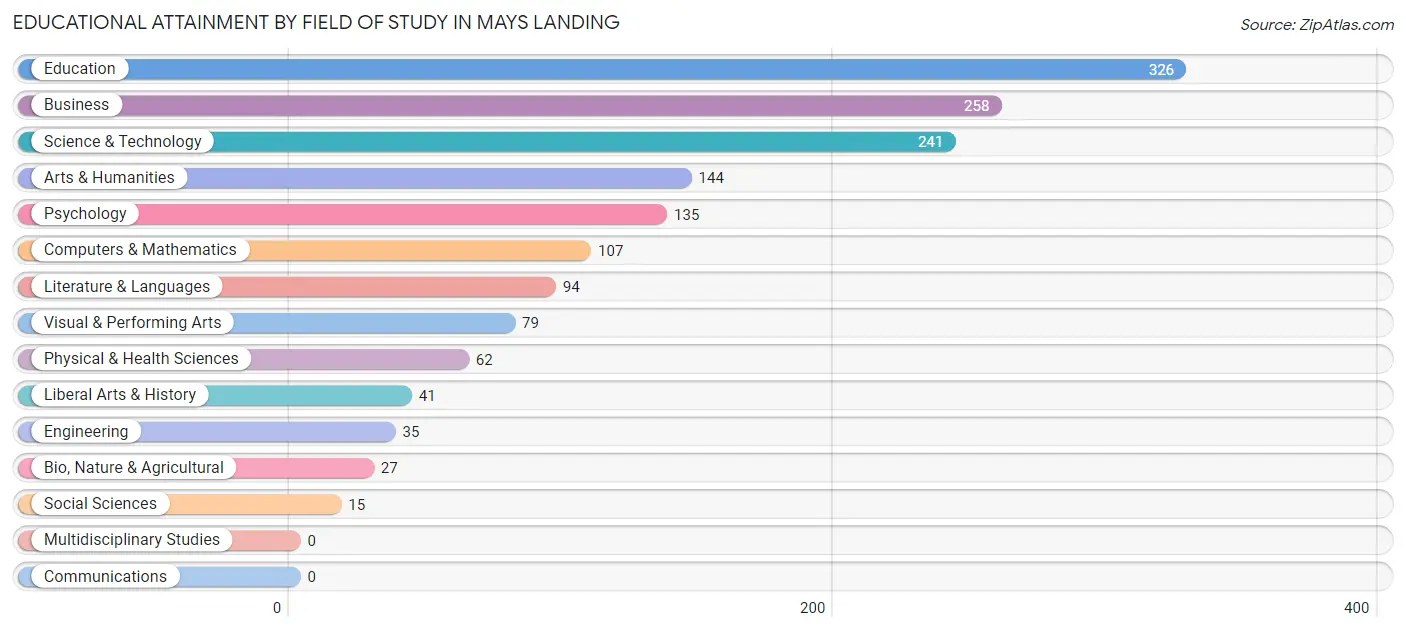
| Field of Study | # Graduates | % Graduates |
| Computers & Mathematics | 107 | 6.8% |
| Bio, Nature & Agricultural | 27 | 1.7% |
| Physical & Health Sciences | 62 | 4.0% |
| Psychology | 135 | 8.6% |
| Social Sciences | 15 | 1.0% |
| Engineering | 35 | 2.2% |
| Multidisciplinary Studies | 0 | 0.0% |
| Science & Technology | 241 | 15.4% |
| Business | 258 | 16.5% |
| Education | 326 | 20.8% |
| Literature & Languages | 94 | 6.0% |
| Liberal Arts & History | 41 | 2.6% |
| Visual & Performing Arts | 79 | 5.1% |
| Communications | 0 | 0.0% |
| Arts & Humanities | 144 | 9.2% |
| Total | 1,564 | 100.0% |
Transportation & Commute in Mays Landing
Vehicle Availability by Sex in Mays Landing
The most prevalent vehicle ownership categories in Mays Landing are males with 2 vehicles (523, accounting for 40.1%) and females with 2 vehicles (747, making up 38.3%).
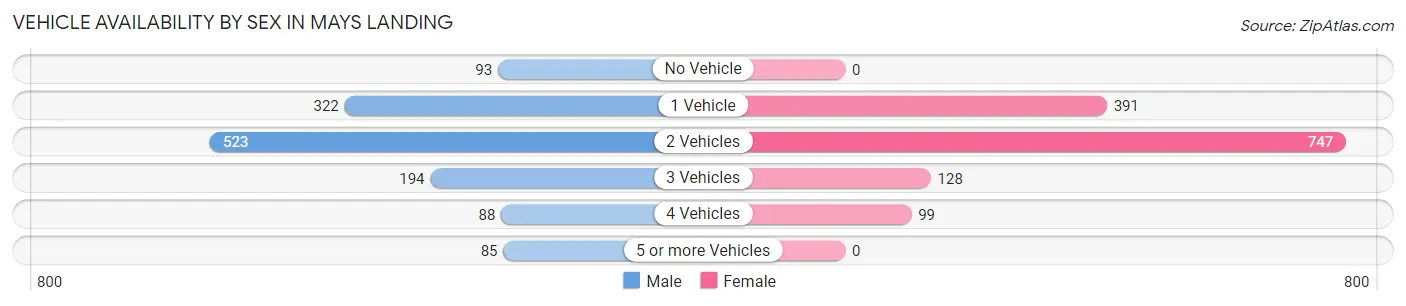
| Vehicles Available | Male | Female |
| No Vehicle | 93 (7.1%) | 0 (0.0%) |
| 1 Vehicle | 322 (24.7%) | 391 (28.6%) |
| 2 Vehicles | 523 (40.1%) | 747 (54.7%) |
| 3 Vehicles | 194 (14.9%) | 128 (9.4%) |
| 4 Vehicles | 88 (6.7%) | 99 (7.2%) |
| 5 or more Vehicles | 85 (6.5%) | 0 (0.0%) |
| Total | 1,305 (100.0%) | 1,365 (100.0%) |
Commute Time in Mays Landing
The most frequently occuring commute durations in Mays Landing are 15 to 19 minutes (461 commuters, 17.9%), 30 to 34 minutes (346 commuters, 13.5%), and 40 to 44 minutes (282 commuters, 11.0%).
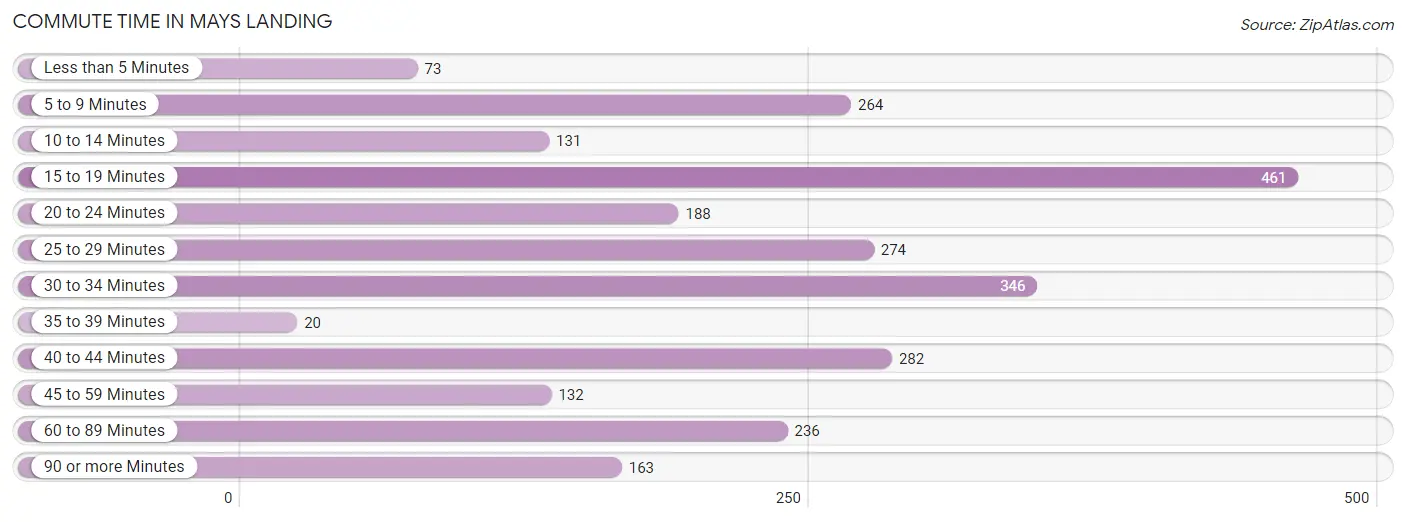
| Commute Time | # Commuters | % Commuters |
| Less than 5 Minutes | 73 | 2.8% |
| 5 to 9 Minutes | 264 | 10.3% |
| 10 to 14 Minutes | 131 | 5.1% |
| 15 to 19 Minutes | 461 | 17.9% |
| 20 to 24 Minutes | 188 | 7.3% |
| 25 to 29 Minutes | 274 | 10.7% |
| 30 to 34 Minutes | 346 | 13.5% |
| 35 to 39 Minutes | 20 | 0.8% |
| 40 to 44 Minutes | 282 | 11.0% |
| 45 to 59 Minutes | 132 | 5.1% |
| 60 to 89 Minutes | 236 | 9.2% |
| 90 or more Minutes | 163 | 6.3% |
Commute Time by Sex in Mays Landing
The most common commute times in Mays Landing are 15 to 19 minutes (262 commuters, 20.7%) for males and 5 to 9 minutes (199 commuters, 15.2%) for females.
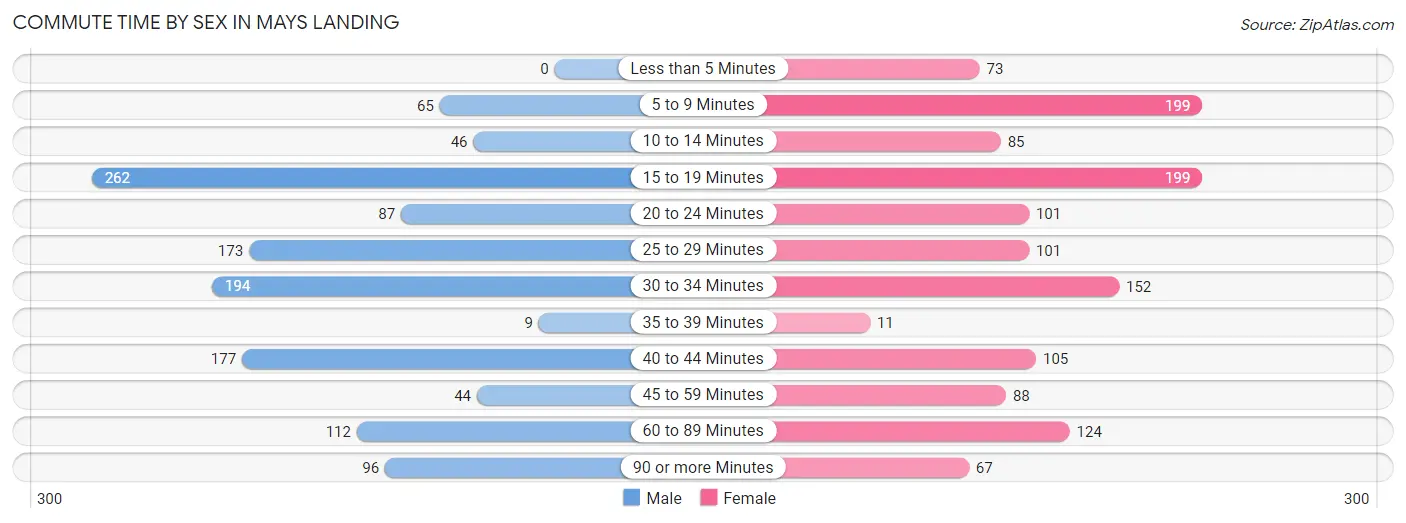
| Commute Time | Male | Female |
| Less than 5 Minutes | 0 (0.0%) | 73 (5.6%) |
| 5 to 9 Minutes | 65 (5.1%) | 199 (15.2%) |
| 10 to 14 Minutes | 46 (3.6%) | 85 (6.5%) |
| 15 to 19 Minutes | 262 (20.7%) | 199 (15.2%) |
| 20 to 24 Minutes | 87 (6.9%) | 101 (7.7%) |
| 25 to 29 Minutes | 173 (13.7%) | 101 (7.7%) |
| 30 to 34 Minutes | 194 (15.3%) | 152 (11.7%) |
| 35 to 39 Minutes | 9 (0.7%) | 11 (0.8%) |
| 40 to 44 Minutes | 177 (14.0%) | 105 (8.1%) |
| 45 to 59 Minutes | 44 (3.5%) | 88 (6.7%) |
| 60 to 89 Minutes | 112 (8.8%) | 124 (9.5%) |
| 90 or more Minutes | 96 (7.6%) | 67 (5.1%) |
Time of Departure to Work by Sex in Mays Landing
The most frequent times of departure to work in Mays Landing are 7:30 AM to 7:59 AM (265, 20.9%) for males and 6:30 AM to 6:59 AM (217, 16.6%) for females.
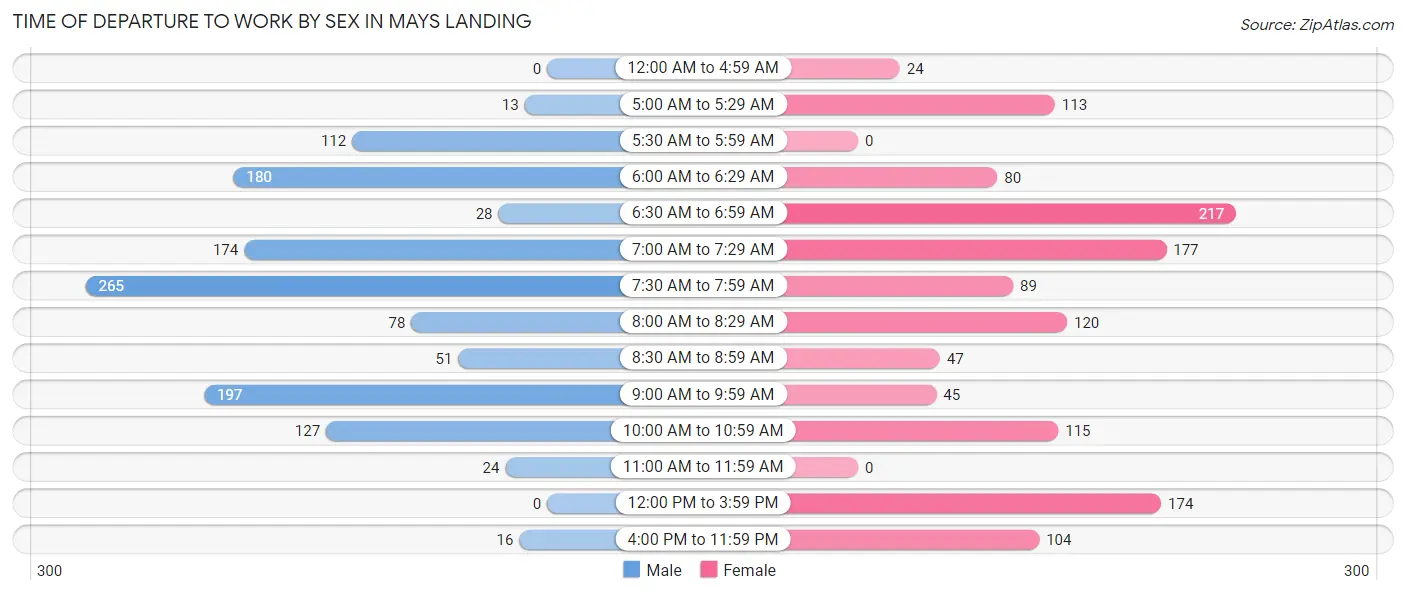
| Time of Departure | Male | Female |
| 12:00 AM to 4:59 AM | 0 (0.0%) | 24 (1.8%) |
| 5:00 AM to 5:29 AM | 13 (1.0%) | 113 (8.7%) |
| 5:30 AM to 5:59 AM | 112 (8.8%) | 0 (0.0%) |
| 6:00 AM to 6:29 AM | 180 (14.2%) | 80 (6.1%) |
| 6:30 AM to 6:59 AM | 28 (2.2%) | 217 (16.6%) |
| 7:00 AM to 7:29 AM | 174 (13.8%) | 177 (13.6%) |
| 7:30 AM to 7:59 AM | 265 (20.9%) | 89 (6.8%) |
| 8:00 AM to 8:29 AM | 78 (6.2%) | 120 (9.2%) |
| 8:30 AM to 8:59 AM | 51 (4.0%) | 47 (3.6%) |
| 9:00 AM to 9:59 AM | 197 (15.6%) | 45 (3.5%) |
| 10:00 AM to 10:59 AM | 127 (10.0%) | 115 (8.8%) |
| 11:00 AM to 11:59 AM | 24 (1.9%) | 0 (0.0%) |
| 12:00 PM to 3:59 PM | 0 (0.0%) | 174 (13.3%) |
| 4:00 PM to 11:59 PM | 16 (1.3%) | 104 (8.0%) |
| Total | 1,265 (100.0%) | 1,305 (100.0%) |
Housing Occupancy in Mays Landing
Occupancy by Ownership in Mays Landing
Of the total 2,460 dwellings in Mays Landing, owner-occupied units account for 1,808 (73.5%), while renter-occupied units make up 652 (26.5%).
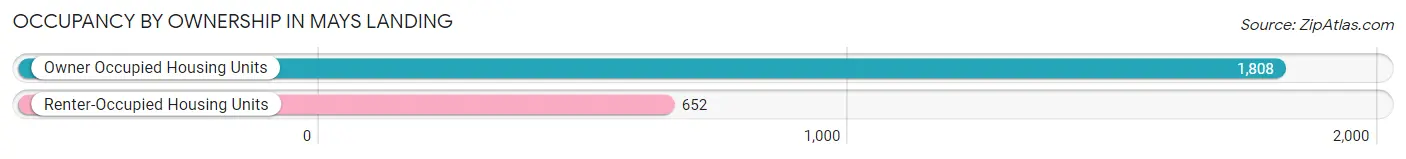
| Occupancy | # Housing Units | % Housing Units |
| Owner Occupied Housing Units | 1,808 | 73.5% |
| Renter-Occupied Housing Units | 652 | 26.5% |
| Total Occupied Housing Units | 2,460 | 100.0% |
Occupancy by Household Size in Mays Landing
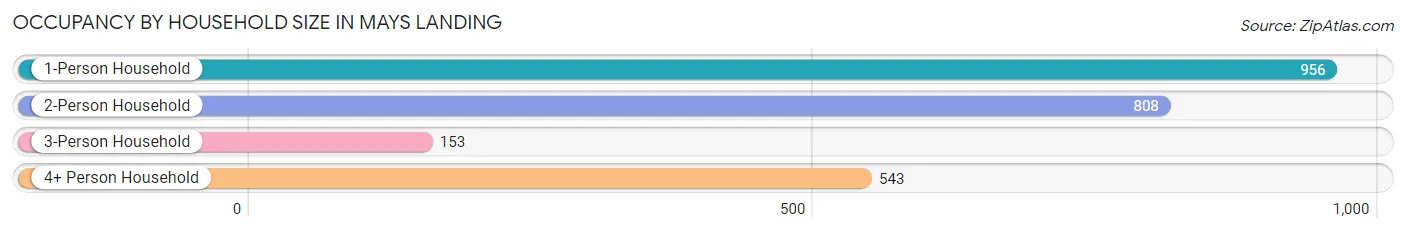
| Household Size | # Housing Units | % Housing Units |
| 1-Person Household | 956 | 38.9% |
| 2-Person Household | 808 | 32.9% |
| 3-Person Household | 153 | 6.2% |
| 4+ Person Household | 543 | 22.1% |
| Total Housing Units | 2,460 | 100.0% |
Occupancy by Ownership by Household Size in Mays Landing
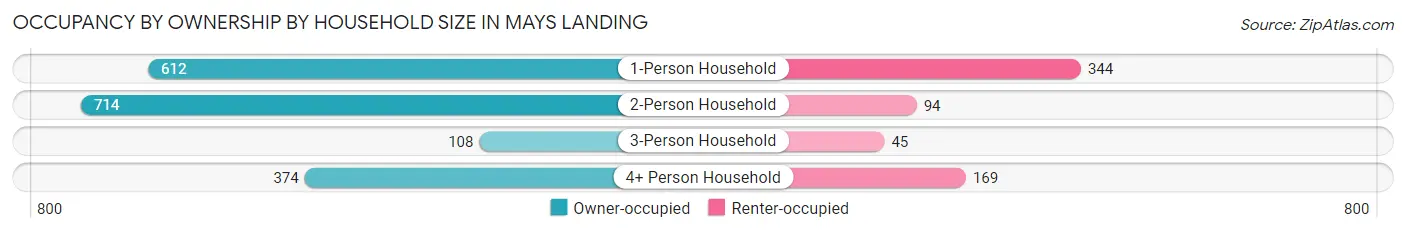
| Household Size | Owner-occupied | Renter-occupied |
| 1-Person Household | 612 (64.0%) | 344 (36.0%) |
| 2-Person Household | 714 (88.4%) | 94 (11.6%) |
| 3-Person Household | 108 (70.6%) | 45 (29.4%) |
| 4+ Person Household | 374 (68.9%) | 169 (31.1%) |
| Total Housing Units | 1,808 (73.5%) | 652 (26.5%) |
Occupancy by Educational Attainment in Mays Landing
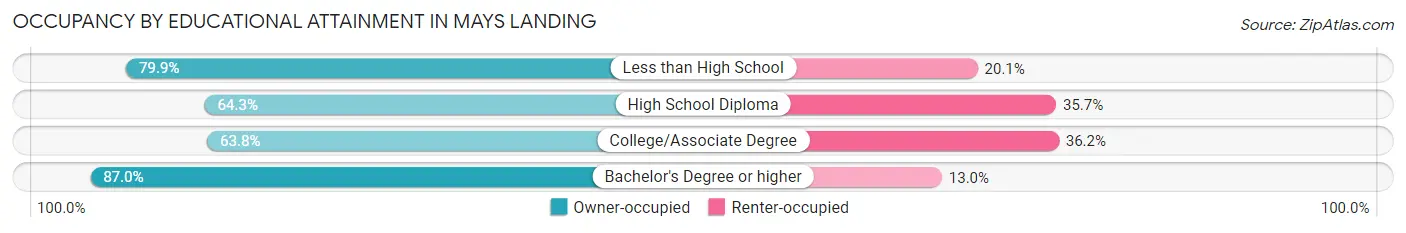
| Household Size | Owner-occupied | Renter-occupied |
| Less than High School | 139 (79.9%) | 35 (20.1%) |
| High School Diploma | 478 (64.3%) | 265 (35.7%) |
| College/Associate Degree | 416 (63.8%) | 236 (36.2%) |
| Bachelor's Degree or higher | 775 (87.0%) | 116 (13.0%) |
Occupancy by Age of Householder in Mays Landing
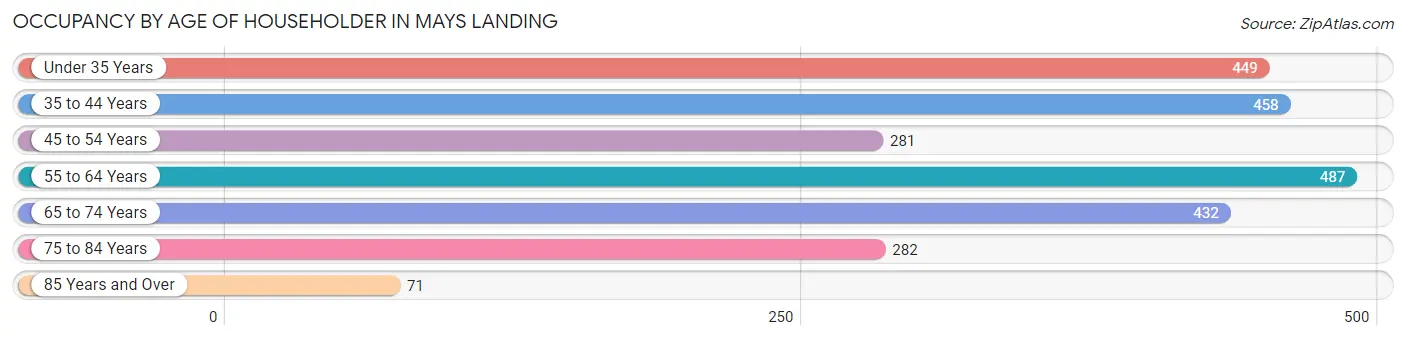
| Age Bracket | # Households | % Households |
| Under 35 Years | 449 | 18.2% |
| 35 to 44 Years | 458 | 18.6% |
| 45 to 54 Years | 281 | 11.4% |
| 55 to 64 Years | 487 | 19.8% |
| 65 to 74 Years | 432 | 17.6% |
| 75 to 84 Years | 282 | 11.5% |
| 85 Years and Over | 71 | 2.9% |
| Total | 2,460 | 100.0% |
Housing Finances in Mays Landing
Median Income by Occupancy in Mays Landing
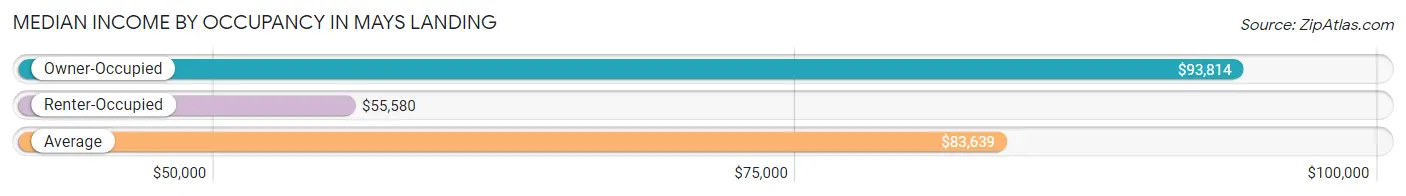
| Occupancy Type | # Households | Median Income |
| Owner-Occupied | 1,808 (73.5%) | $93,814 |
| Renter-Occupied | 652 (26.5%) | $55,580 |
| Average | 2,460 (100.0%) | $83,639 |
Occupancy by Householder Income Bracket in Mays Landing
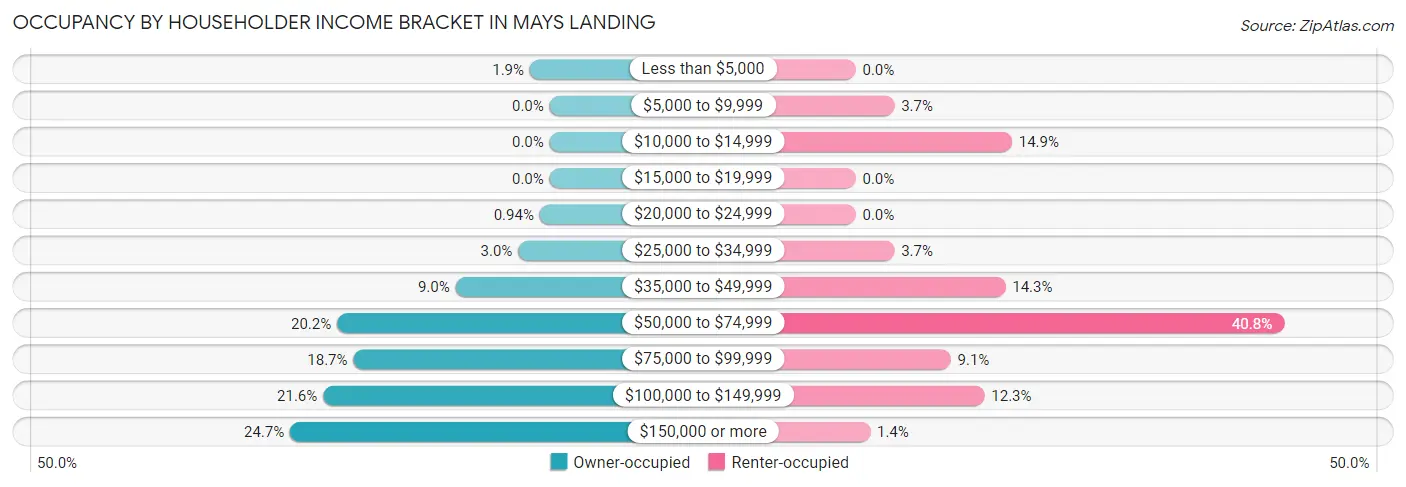
| Income Bracket | Owner-occupied | Renter-occupied |
| Less than $5,000 | 34 (1.9%) | 0 (0.0%) |
| $5,000 to $9,999 | 0 (0.0%) | 24 (3.7%) |
| $10,000 to $14,999 | 0 (0.0%) | 97 (14.9%) |
| $15,000 to $19,999 | 0 (0.0%) | 0 (0.0%) |
| $20,000 to $24,999 | 17 (0.9%) | 0 (0.0%) |
| $25,000 to $34,999 | 54 (3.0%) | 24 (3.7%) |
| $35,000 to $49,999 | 162 (9.0%) | 93 (14.3%) |
| $50,000 to $74,999 | 366 (20.2%) | 266 (40.8%) |
| $75,000 to $99,999 | 338 (18.7%) | 59 (9.0%) |
| $100,000 to $149,999 | 390 (21.6%) | 80 (12.3%) |
| $150,000 or more | 447 (24.7%) | 9 (1.4%) |
| Total | 1,808 (100.0%) | 652 (100.0%) |
Monthly Housing Cost Tiers in Mays Landing
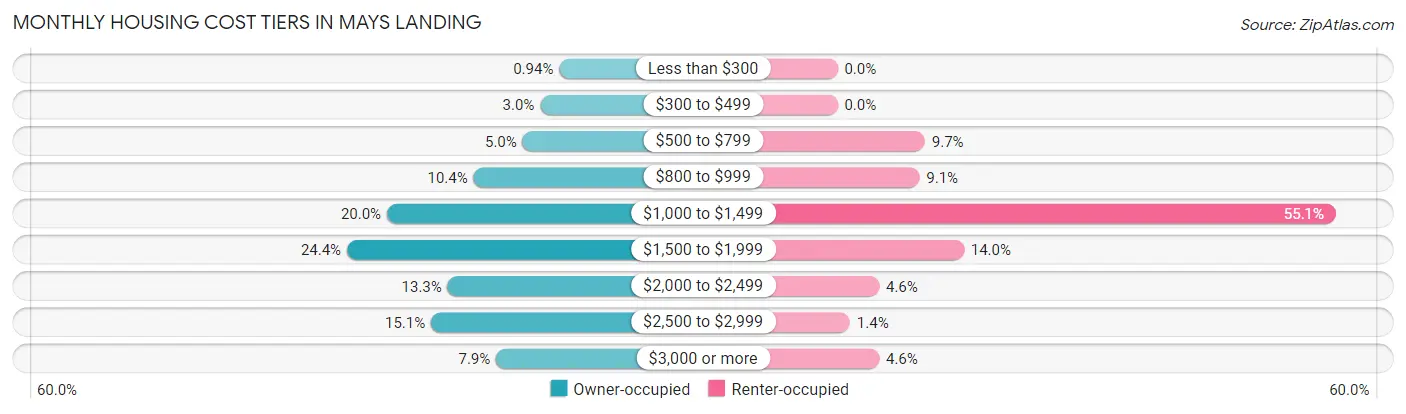
| Monthly Cost | Owner-occupied | Renter-occupied |
| Less than $300 | 17 (0.9%) | 0 (0.0%) |
| $300 to $499 | 55 (3.0%) | 0 (0.0%) |
| $500 to $799 | 90 (5.0%) | 63 (9.7%) |
| $800 to $999 | 188 (10.4%) | 59 (9.0%) |
| $1,000 to $1,499 | 361 (20.0%) | 359 (55.1%) |
| $1,500 to $1,999 | 441 (24.4%) | 91 (14.0%) |
| $2,000 to $2,499 | 240 (13.3%) | 30 (4.6%) |
| $2,500 to $2,999 | 273 (15.1%) | 9 (1.4%) |
| $3,000 or more | 143 (7.9%) | 30 (4.6%) |
| Total | 1,808 (100.0%) | 652 (100.0%) |
Physical Housing Characteristics in Mays Landing
Housing Structures in Mays Landing
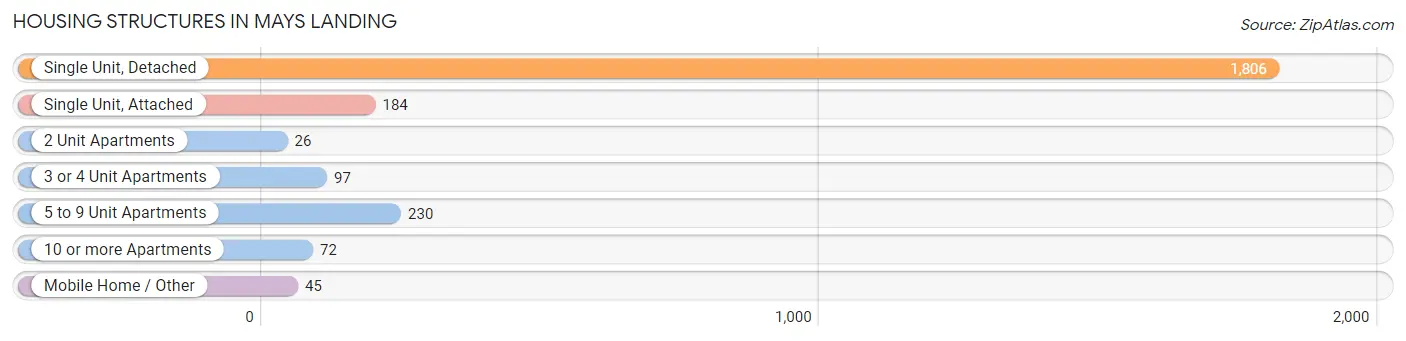
| Structure Type | # Housing Units | % Housing Units |
| Single Unit, Detached | 1,806 | 73.4% |
| Single Unit, Attached | 184 | 7.5% |
| 2 Unit Apartments | 26 | 1.1% |
| 3 or 4 Unit Apartments | 97 | 3.9% |
| 5 to 9 Unit Apartments | 230 | 9.3% |
| 10 or more Apartments | 72 | 2.9% |
| Mobile Home / Other | 45 | 1.8% |
| Total | 2,460 | 100.0% |
Housing Structures by Occupancy in Mays Landing
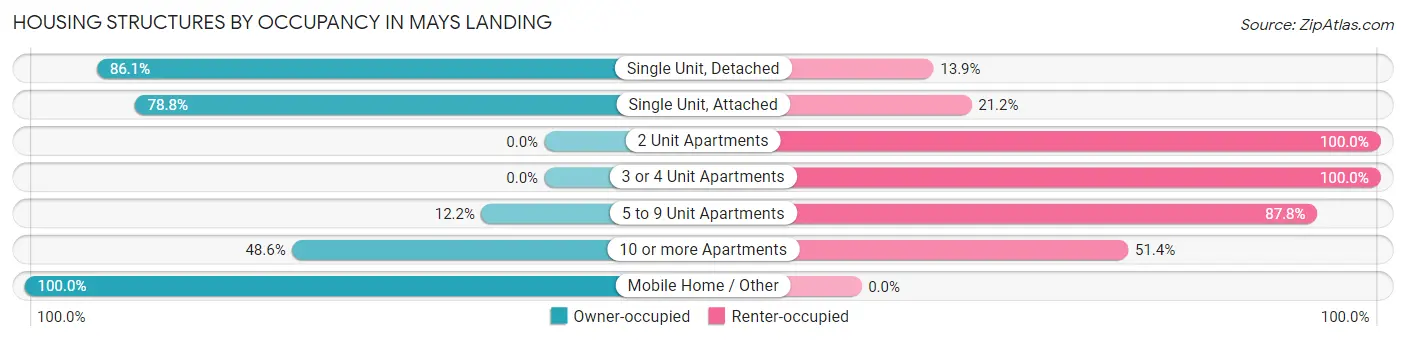
| Structure Type | Owner-occupied | Renter-occupied |
| Single Unit, Detached | 1,555 (86.1%) | 251 (13.9%) |
| Single Unit, Attached | 145 (78.8%) | 39 (21.2%) |
| 2 Unit Apartments | 0 (0.0%) | 26 (100.0%) |
| 3 or 4 Unit Apartments | 0 (0.0%) | 97 (100.0%) |
| 5 to 9 Unit Apartments | 28 (12.2%) | 202 (87.8%) |
| 10 or more Apartments | 35 (48.6%) | 37 (51.4%) |
| Mobile Home / Other | 45 (100.0%) | 0 (0.0%) |
| Total | 1,808 (73.5%) | 652 (26.5%) |
Housing Structures by Number of Rooms in Mays Landing
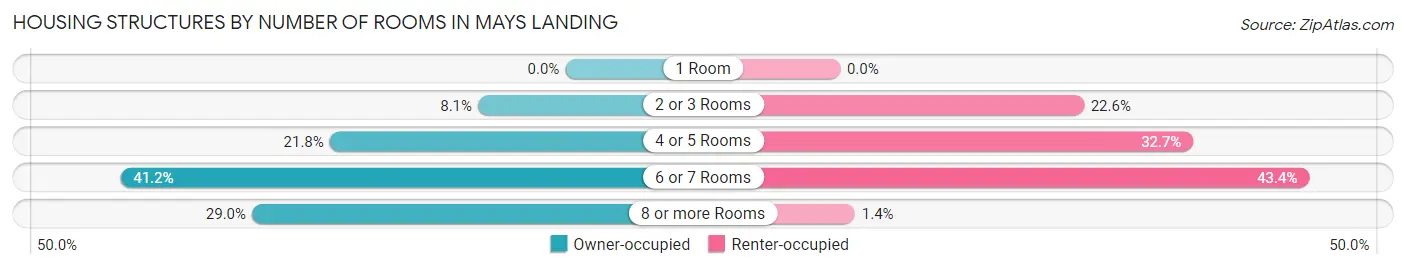
| Number of Rooms | Owner-occupied | Renter-occupied |
| 1 Room | 0 (0.0%) | 0 (0.0%) |
| 2 or 3 Rooms | 146 (8.1%) | 147 (22.6%) |
| 4 or 5 Rooms | 394 (21.8%) | 213 (32.7%) |
| 6 or 7 Rooms | 744 (41.1%) | 283 (43.4%) |
| 8 or more Rooms | 524 (29.0%) | 9 (1.4%) |
| Total | 1,808 (100.0%) | 652 (100.0%) |
Housing Structure by Heating Type in Mays Landing
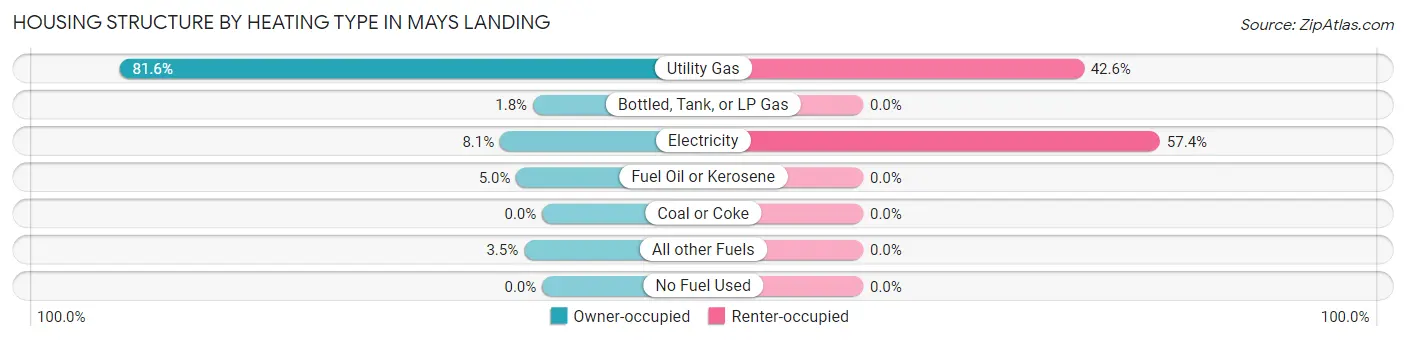
| Heating Type | Owner-occupied | Renter-occupied |
| Utility Gas | 1,476 (81.6%) | 278 (42.6%) |
| Bottled, Tank, or LP Gas | 32 (1.8%) | 0 (0.0%) |
| Electricity | 147 (8.1%) | 374 (57.4%) |
| Fuel Oil or Kerosene | 90 (5.0%) | 0 (0.0%) |
| Coal or Coke | 0 (0.0%) | 0 (0.0%) |
| All other Fuels | 63 (3.5%) | 0 (0.0%) |
| No Fuel Used | 0 (0.0%) | 0 (0.0%) |
| Total | 1,808 (100.0%) | 652 (100.0%) |
Household Vehicle Usage in Mays Landing
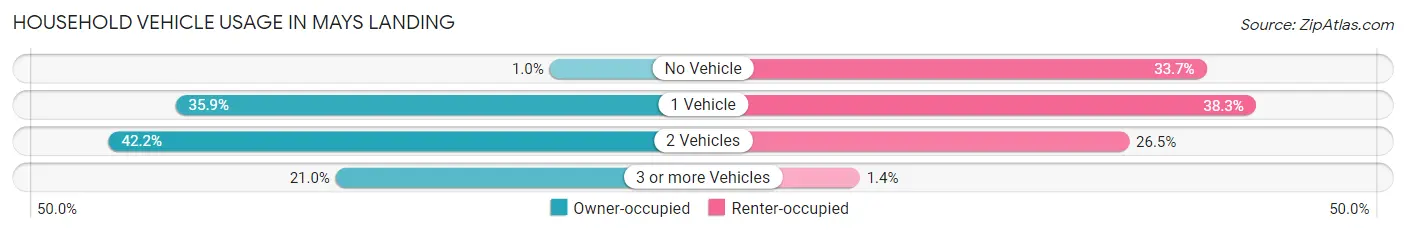
| Vehicles per Household | Owner-occupied | Renter-occupied |
| No Vehicle | 18 (1.0%) | 220 (33.7%) |
| 1 Vehicle | 649 (35.9%) | 250 (38.3%) |
| 2 Vehicles | 762 (42.1%) | 173 (26.5%) |
| 3 or more Vehicles | 379 (21.0%) | 9 (1.4%) |
| Total | 1,808 (100.0%) | 652 (100.0%) |
Real Estate & Mortgages in Mays Landing
Real Estate and Mortgage Overview in Mays Landing
| Characteristic | Without Mortgage | With Mortgage |
| Housing Units | 440 | 1,368 |
| Median Property Value | $246,000 | $239,600 |
| Median Household Income | $103,261 | $357 |
| Monthly Housing Costs | $912 | $143 |
| Real Estate Taxes | $6,624 | $0 |
Property Value by Mortgage Status in Mays Landing
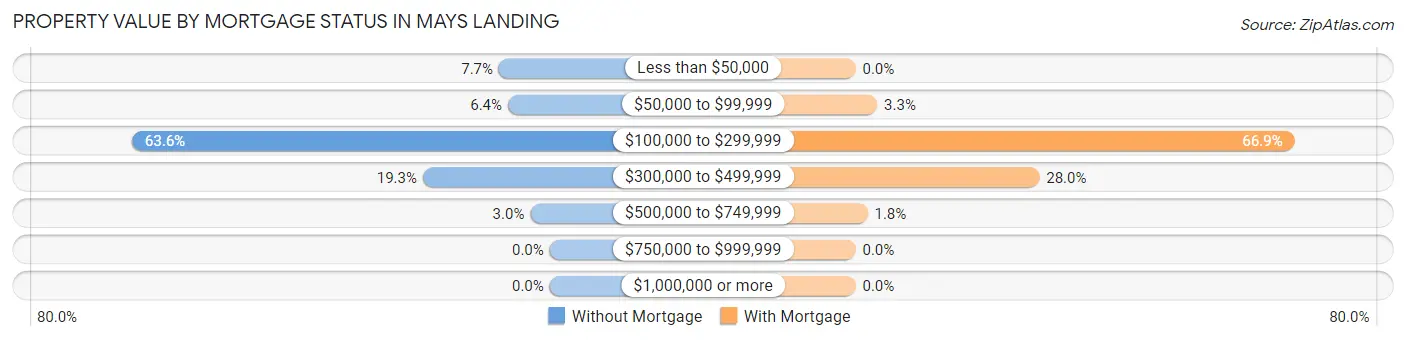
| Property Value | Without Mortgage | With Mortgage |
| Less than $50,000 | 34 (7.7%) | 0 (0.0%) |
| $50,000 to $99,999 | 28 (6.4%) | 45 (3.3%) |
| $100,000 to $299,999 | 280 (63.6%) | 915 (66.9%) |
| $300,000 to $499,999 | 85 (19.3%) | 383 (28.0%) |
| $500,000 to $749,999 | 13 (2.9%) | 25 (1.8%) |
| $750,000 to $999,999 | 0 (0.0%) | 0 (0.0%) |
| $1,000,000 or more | 0 (0.0%) | 0 (0.0%) |
| Total | 440 (100.0%) | 1,368 (100.0%) |
Household Income by Mortgage Status in Mays Landing
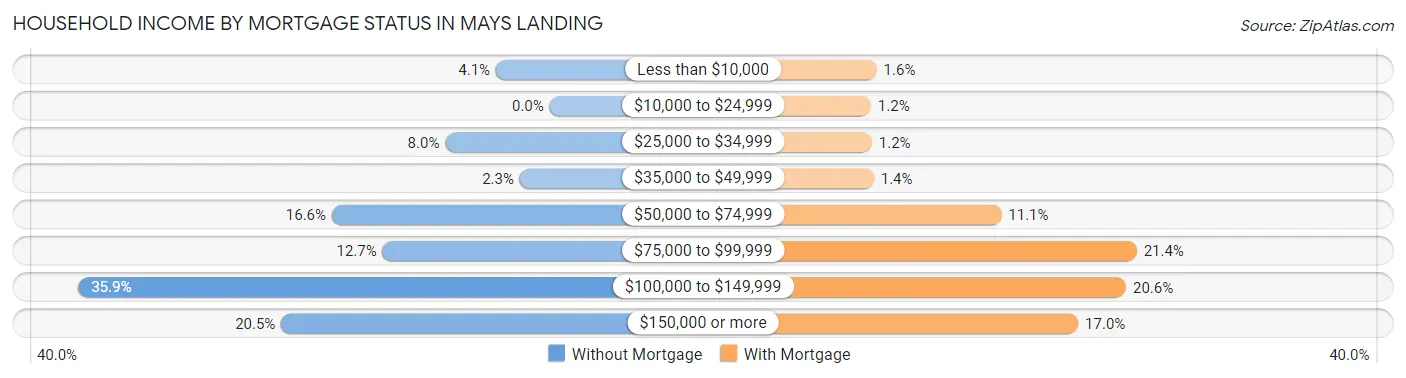
| Household Income | Without Mortgage | With Mortgage |
| Less than $10,000 | 18 (4.1%) | 22 (1.6%) |
| $10,000 to $24,999 | 0 (0.0%) | 16 (1.2%) |
| $25,000 to $34,999 | 35 (8.0%) | 17 (1.2%) |
| $35,000 to $49,999 | 10 (2.3%) | 19 (1.4%) |
| $50,000 to $74,999 | 73 (16.6%) | 152 (11.1%) |
| $75,000 to $99,999 | 56 (12.7%) | 293 (21.4%) |
| $100,000 to $149,999 | 158 (35.9%) | 282 (20.6%) |
| $150,000 or more | 90 (20.4%) | 232 (17.0%) |
| Total | 440 (100.0%) | 1,368 (100.0%) |
Property Value to Household Income Ratio in Mays Landing
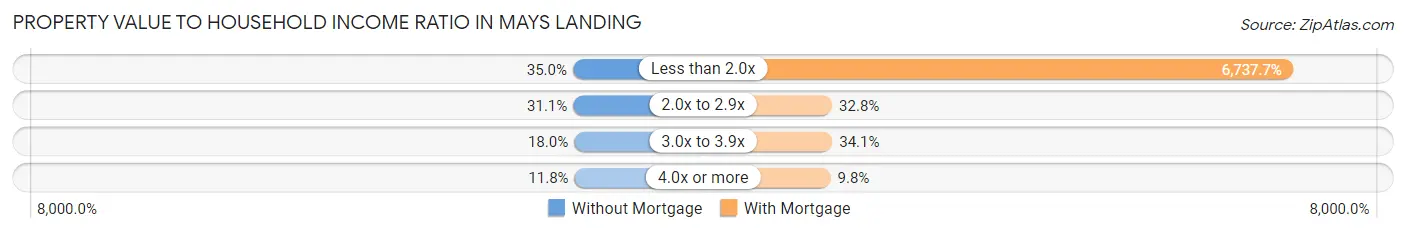
| Value-to-Income Ratio | Without Mortgage | With Mortgage |
| Less than 2.0x | 154 (35.0%) | 92,171 (6,737.6%) |
| 2.0x to 2.9x | 137 (31.1%) | 448 (32.8%) |
| 3.0x to 3.9x | 79 (17.9%) | 467 (34.1%) |
| 4.0x or more | 52 (11.8%) | 134 (9.8%) |
| Total | 440 (100.0%) | 1,368 (100.0%) |
Real Estate Taxes by Mortgage Status in Mays Landing
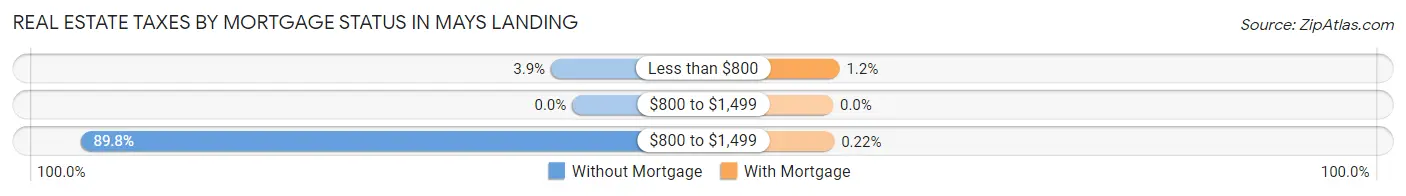
| Property Taxes | Without Mortgage | With Mortgage |
| Less than $800 | 17 (3.9%) | 16 (1.2%) |
| $800 to $1,499 | 0 (0.0%) | 0 (0.0%) |
| $800 to $1,499 | 395 (89.8%) | 3 (0.2%) |
| Total | 440 (100.0%) | 1,368 (100.0%) |
Health & Disability in Mays Landing
Health Insurance Coverage by Age in Mays Landing
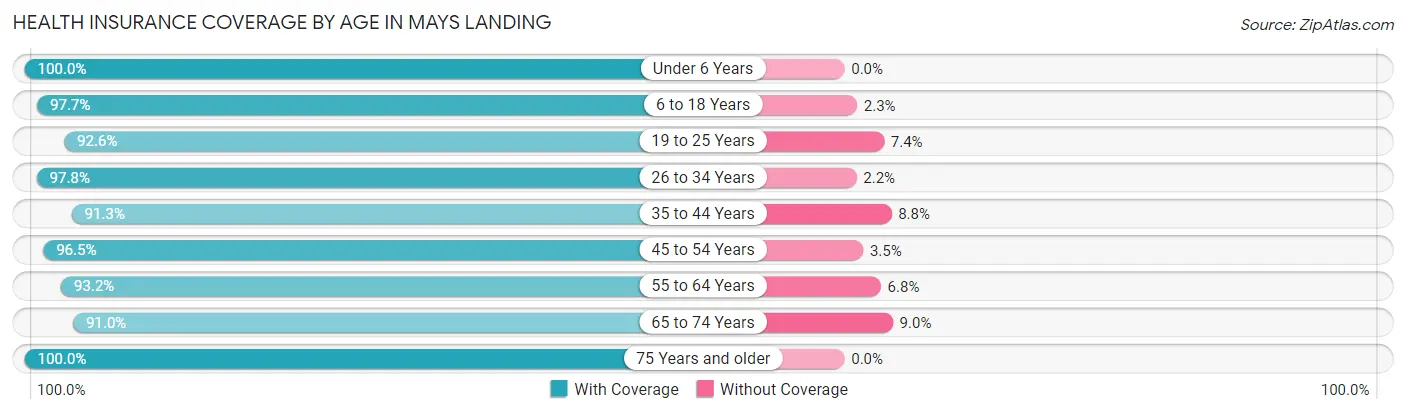
| Age Bracket | With Coverage | Without Coverage |
| Under 6 Years | 348 (100.0%) | 0 (0.0%) |
| 6 to 18 Years | 1,171 (97.7%) | 28 (2.3%) |
| 19 to 25 Years | 377 (92.6%) | 30 (7.4%) |
| 26 to 34 Years | 437 (97.8%) | 10 (2.2%) |
| 35 to 44 Years | 730 (91.2%) | 70 (8.7%) |
| 45 to 54 Years | 444 (96.5%) | 16 (3.5%) |
| 55 to 64 Years | 743 (93.2%) | 54 (6.8%) |
| 65 to 74 Years | 666 (91.0%) | 66 (9.0%) |
| 75 Years and older | 476 (100.0%) | 0 (0.0%) |
| Total | 5,392 (95.2%) | 274 (4.8%) |
Health Insurance Coverage by Citizenship Status in Mays Landing
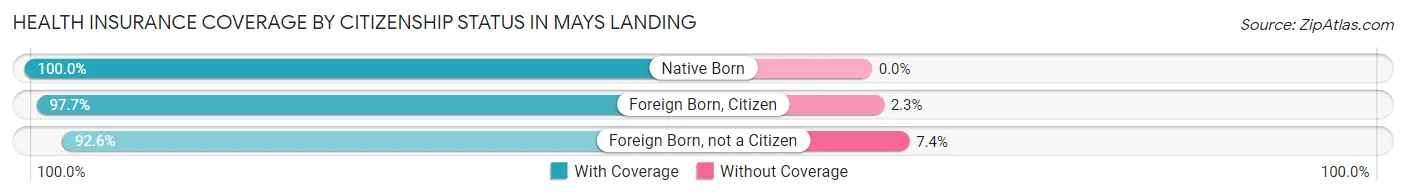
| Citizenship Status | With Coverage | Without Coverage |
| Native Born | 348 (100.0%) | 0 (0.0%) |
| Foreign Born, Citizen | 1,171 (97.7%) | 28 (2.3%) |
| Foreign Born, not a Citizen | 377 (92.6%) | 30 (7.4%) |
Health Insurance Coverage by Household Income in Mays Landing
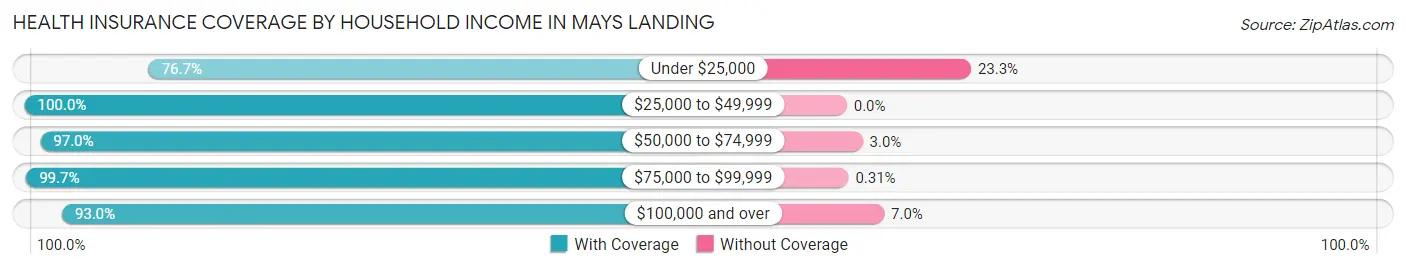
| Household Income | With Coverage | Without Coverage |
| Under $25,000 | 132 (76.7%) | 40 (23.3%) |
| $25,000 to $49,999 | 583 (100.0%) | 0 (0.0%) |
| $50,000 to $74,999 | 985 (97.0%) | 30 (3.0%) |
| $75,000 to $99,999 | 975 (99.7%) | 3 (0.3%) |
| $100,000 and over | 2,673 (93.0%) | 201 (7.0%) |
Public vs Private Health Insurance Coverage by Age in Mays Landing
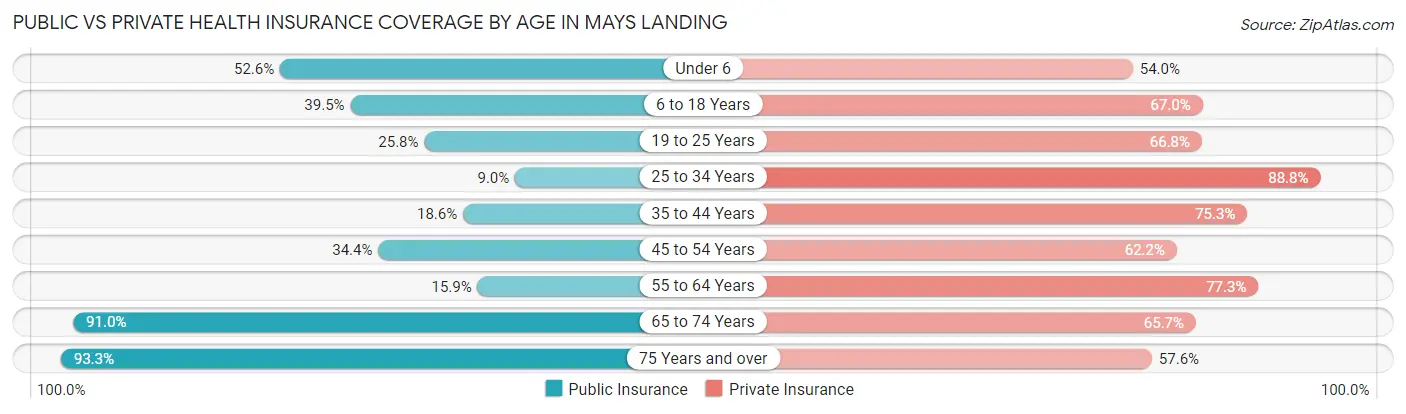
| Age Bracket | Public Insurance | Private Insurance |
| Under 6 | 183 (52.6%) | 188 (54.0%) |
| 6 to 18 Years | 474 (39.5%) | 803 (67.0%) |
| 19 to 25 Years | 105 (25.8%) | 272 (66.8%) |
| 25 to 34 Years | 40 (8.9%) | 397 (88.8%) |
| 35 to 44 Years | 149 (18.6%) | 602 (75.2%) |
| 45 to 54 Years | 158 (34.4%) | 286 (62.2%) |
| 55 to 64 Years | 127 (15.9%) | 616 (77.3%) |
| 65 to 74 Years | 666 (91.0%) | 481 (65.7%) |
| 75 Years and over | 444 (93.3%) | 274 (57.6%) |
| Total | 2,346 (41.4%) | 3,919 (69.2%) |
Disability Status by Sex by Age in Mays Landing
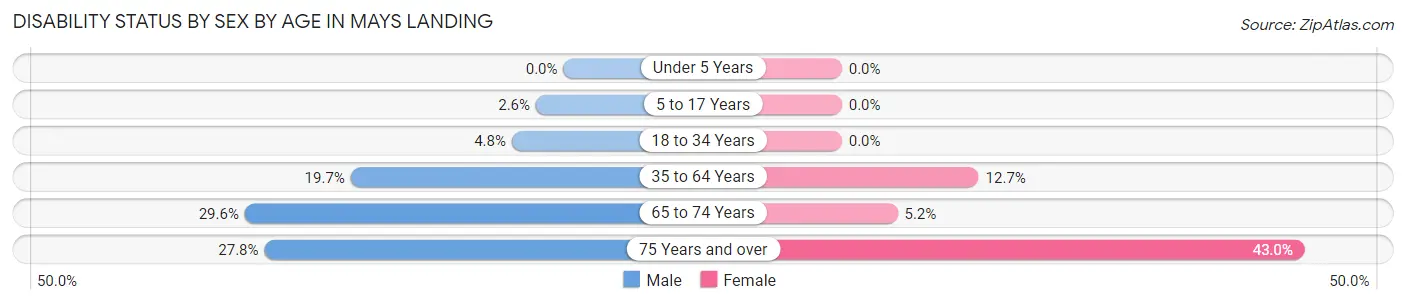
| Age Bracket | Male | Female |
| Under 5 Years | 0 (0.0%) | 0 (0.0%) |
| 5 to 17 Years | 15 (2.5%) | 0 (0.0%) |
| 18 to 34 Years | 17 (4.8%) | 0 (0.0%) |
| 35 to 64 Years | 201 (19.7%) | 132 (12.7%) |
| 65 to 74 Years | 102 (29.6%) | 20 (5.2%) |
| 75 Years and over | 63 (27.8%) | 107 (43.0%) |
Disability Class by Sex by Age in Mays Landing
Disability Class: Hearing Difficulty
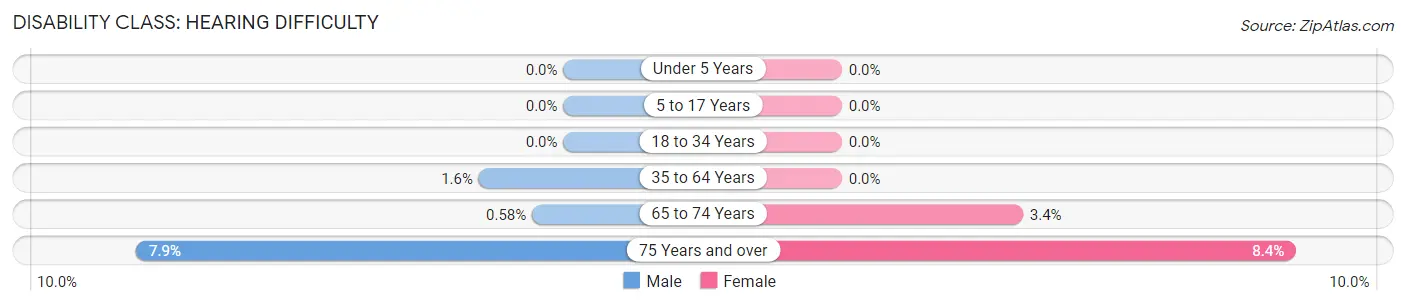
| Age Bracket | Male | Female |
| Under 5 Years | 0 (0.0%) | 0 (0.0%) |
| 5 to 17 Years | 0 (0.0%) | 0 (0.0%) |
| 18 to 34 Years | 0 (0.0%) | 0 (0.0%) |
| 35 to 64 Years | 16 (1.6%) | 0 (0.0%) |
| 65 to 74 Years | 2 (0.6%) | 13 (3.4%) |
| 75 Years and over | 18 (7.9%) | 21 (8.4%) |
Disability Class: Vision Difficulty
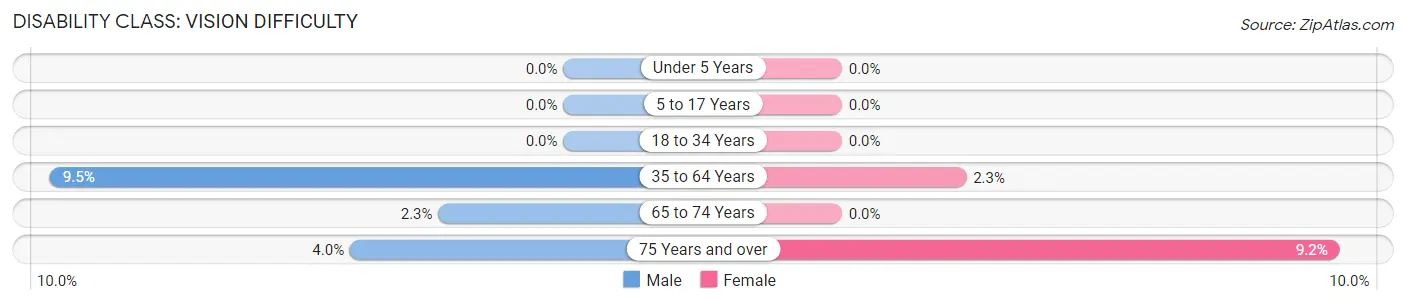
| Age Bracket | Male | Female |
| Under 5 Years | 0 (0.0%) | 0 (0.0%) |
| 5 to 17 Years | 0 (0.0%) | 0 (0.0%) |
| 18 to 34 Years | 0 (0.0%) | 0 (0.0%) |
| 35 to 64 Years | 97 (9.5%) | 24 (2.3%) |
| 65 to 74 Years | 8 (2.3%) | 0 (0.0%) |
| 75 Years and over | 9 (4.0%) | 23 (9.2%) |
Disability Class: Cognitive Difficulty
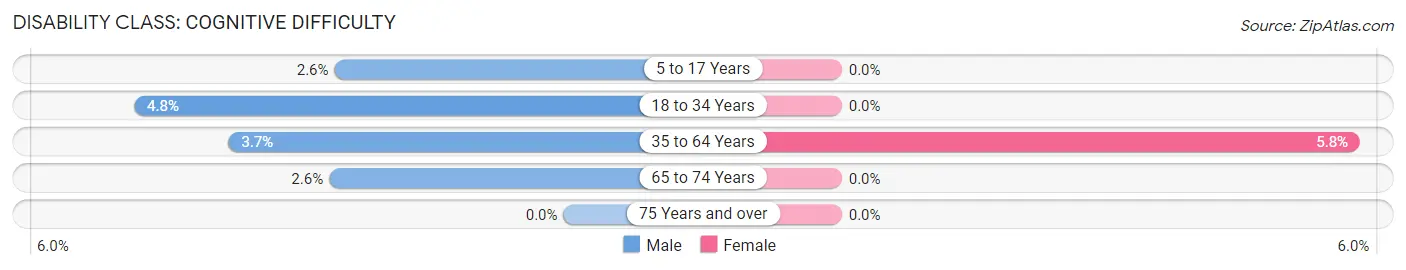
| Age Bracket | Male | Female |
| 5 to 17 Years | 15 (2.5%) | 0 (0.0%) |
| 18 to 34 Years | 17 (4.8%) | 0 (0.0%) |
| 35 to 64 Years | 38 (3.7%) | 60 (5.8%) |
| 65 to 74 Years | 9 (2.6%) | 0 (0.0%) |
| 75 Years and over | 0 (0.0%) | 0 (0.0%) |
Disability Class: Ambulatory Difficulty
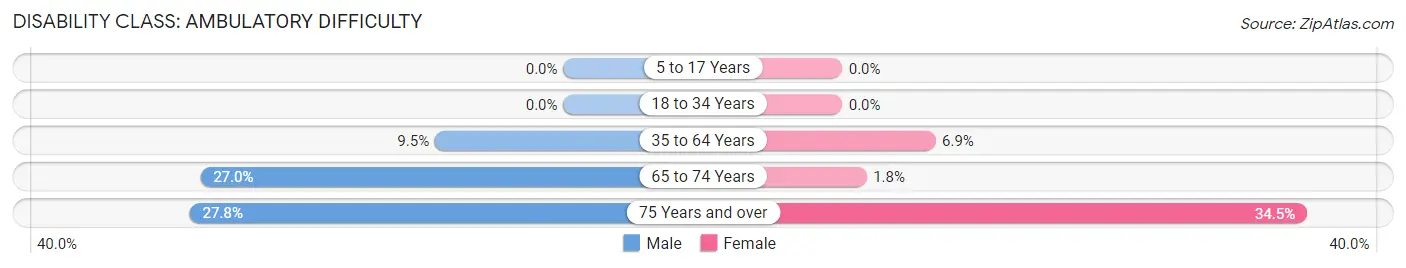
| Age Bracket | Male | Female |
| 5 to 17 Years | 0 (0.0%) | 0 (0.0%) |
| 18 to 34 Years | 0 (0.0%) | 0 (0.0%) |
| 35 to 64 Years | 97 (9.5%) | 72 (6.9%) |
| 65 to 74 Years | 93 (27.0%) | 7 (1.8%) |
| 75 Years and over | 63 (27.8%) | 86 (34.5%) |
Disability Class: Self-Care Difficulty
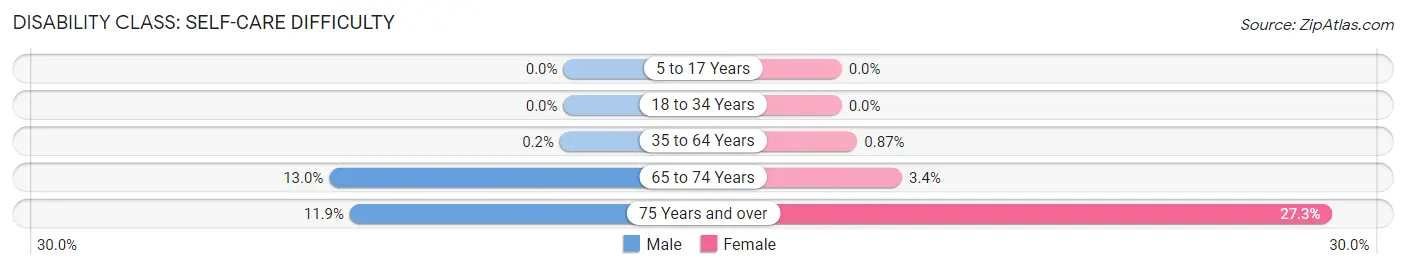
| Age Bracket | Male | Female |
| 5 to 17 Years | 0 (0.0%) | 0 (0.0%) |
| 18 to 34 Years | 0 (0.0%) | 0 (0.0%) |
| 35 to 64 Years | 2 (0.2%) | 9 (0.9%) |
| 65 to 74 Years | 45 (13.0%) | 13 (3.4%) |
| 75 Years and over | 27 (11.9%) | 68 (27.3%) |
Technology Access in Mays Landing
Computing Device Access in Mays Landing
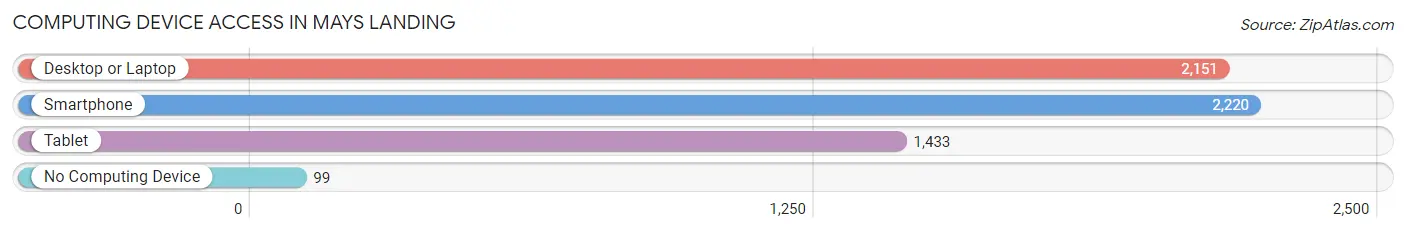
| Device Type | # Households | % Households |
| Desktop or Laptop | 2,151 | 87.4% |
| Smartphone | 2,220 | 90.2% |
| Tablet | 1,433 | 58.3% |
| No Computing Device | 99 | 4.0% |
| Total | 2,460 | 100.0% |
Internet Access in Mays Landing
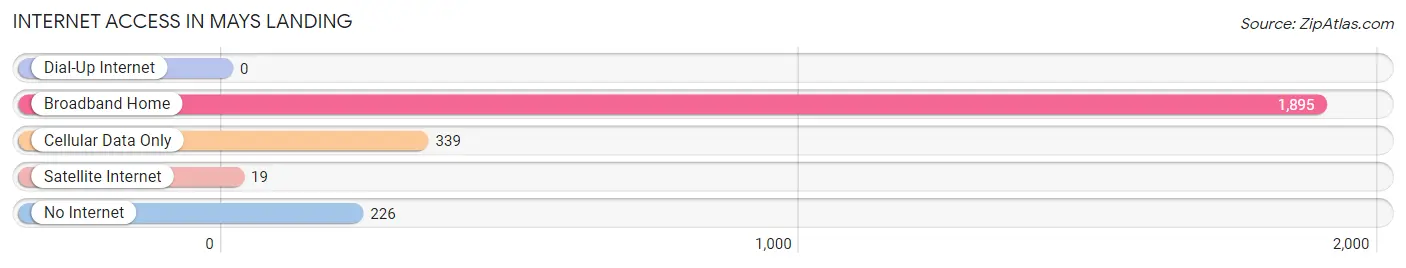
| Internet Type | # Households | % Households |
| Dial-Up Internet | 0 | 0.0% |
| Broadband Home | 1,895 | 77.0% |
| Cellular Data Only | 339 | 13.8% |
| Satellite Internet | 19 | 0.8% |
| No Internet | 226 | 9.2% |
| Total | 2,460 | 100.0% |
Mays Landing Summary
Mays Landing is a census-designated place (CDP) located in Atlantic County, New Jersey, United States. As of the 2010 United States Census, the CDP's population was 2,135.
Geography
Mays Landing is located at 39 27 25 North 74 41 17 West 39 456944 74 688056
According to the United States Census Bureau, the CDP had a total area of 4.845 square miles (12.541 km2), including 4.844 square miles (12.538 km2) of land and 0.001 square miles (0.003 km2) of water (0.02%).
History
Mays Landing was originally known as Maysville, and was founded in 1798 by Captain John Mays. The town was named after him and was the first settlement in what is now Atlantic County. The town was incorporated as a borough in 1867, and was later reincorporated as a township in 1892.
In the early 1900s, Mays Landing was a popular summer resort destination for wealthy Philadelphians. The town was home to several large hotels, including the Mays Landing Hotel, which was built in 1891 and was the largest hotel in the area.
In the 1950s, Mays Landing began to experience a decline in population as people moved away from the area. The town was eventually annexed by Hamilton Township in 1967.
Economy
Mays Landing is home to several businesses, including a variety of retail stores, restaurants, and professional services. The town is also home to the Hamilton Mall, which is the largest shopping mall in Atlantic County.
The town is also home to the Atlantic County Vocational Technical School, which provides vocational and technical education to students in the area.
Demographics
As of the 2010 United States Census, there were 2,135 people, 845 households, and 545 families residing in the CDP. The population density was 441.3 per square mile (170.3/km2). There were 902 housing units at an average density of 186.3 per square mile (71.9/km2). The racial makeup of the CDP was 79.2% White, 11.2% African American, 0.2% Native American, 2.2% Asian, 0.1% Pacific Islander, 4.7% from other races, and 2.6% from two or more races. Hispanic or Latino of any race were 10.2% of the population.
There were 845 households, out of which 28.2% had children under the age of 18 living with them, 44.2% were married couples living together, 14.2% had a female householder with no husband present, and 35.2% were non-families. 28.2% of all households were made up of individuals, and 10.2% had someone living alone who was 65 years of age or older. The average household size was 2.53 and the average family size was 3.09.
In the CDP, the population was spread out, with 23.2% under the age of 18, 8.2% from 18 to 24, 28.2% from 25 to 44, 26.2% from 45 to 64, and 14.2% who were 65 years of age or older. The median age was 38.2 years. For every 100 females, there were 95.2 males. For every 100 females age 18 and over, there were 92.2 males.
The median income for a household in the CDP was $50,938, and the median income for a family was $60,000. Males had a median income of $41,250 versus $30,000 for females. The per capita income for the CDP was $22,945. About 6.2% of families and 8.2% of the population were below the poverty line, including 10.2% of those under age 18 and 8.2% of those age 65 or over.
Common Questions
What is Per Capita Income in Mays Landing?
Per Capita income in Mays Landing is $44,227.
What is the Median Family Income in Mays Landing?
Median Family Income in Mays Landing is $103,591.
What is the Median Household income in Mays Landing?
Median Household Income in Mays Landing is $83,639.
What is Income or Wage Gap in Mays Landing?
Income or Wage Gap in Mays Landing is 21.5%.
Women in Mays Landing earn 78.5 cents for every dollar earned by a man.
What is Inequality or Gini Index in Mays Landing?
Inequality or Gini Index in Mays Landing is 0.43.
What is the Total Population of Mays Landing?
Total Population of Mays Landing is 6,183.
What is the Total Male Population of Mays Landing?
Total Male Population of Mays Landing is 3,248.
What is the Total Female Population of Mays Landing?
Total Female Population of Mays Landing is 2,935.
What is the Ratio of Males per 100 Females in Mays Landing?
There are 110.66 Males per 100 Females in Mays Landing.
What is the Ratio of Females per 100 Males in Mays Landing?
There are 90.36 Females per 100 Males in Mays Landing.
What is the Median Population Age in Mays Landing?
Median Population Age in Mays Landing is 39.7 Years.
What is the Average Family Size in Mays Landing
Average Family Size in Mays Landing is 3.1 People.
What is the Average Household Size in Mays Landing
Average Household Size in Mays Landing is 2.3 People.
How Large is the Labor Force in Mays Landing?
There are 3,114 People in the Labor Forcein in Mays Landing.
What is the Percentage of People in the Labor Force in Mays Landing?
62.9% of People are in the Labor Force in Mays Landing.
What is the Unemployment Rate in Mays Landing?
Unemployment Rate in Mays Landing is 13.1%.