Camden, NJ Map & Demographics
Camden Map
Camden Overview
$18,914
PER CAPITA INCOME
$40,623
AVG FAMILY INCOME
$36,258
AVG HOUSEHOLD INCOME
26.4%
WAGE / INCOME GAP [ % ]
73.6¢/ $1
WAGE / INCOME GAP [ $ ]
$10,911
FAMILY INCOME DEFICIT
0.50
INEQUALITY / GINI INDEX
71,799
TOTAL POPULATION
33,227
MALE POPULATION
38,572
FEMALE POPULATION
86.14
MALES / 100 FEMALES
116.09
FEMALES / 100 MALES
32.1
MEDIAN AGE
3.5
AVG FAMILY SIZE
2.8
AVG HOUSEHOLD SIZE
30,436
LABOR FORCE [ PEOPLE ]
56.7%
PERCENT IN LABOR FORCE
14.6%
UNEMPLOYMENT RATE
Income in Camden
Income Overview in Camden
Per Capita Income in Camden is $18,914, while median incomes of families and households are $40,623 and $36,258 respectively.
| Characteristic | Number | Measure |
| Per Capita Income | 71,799 | $18,914 |
| Median Family Income | 15,948 | $40,623 |
| Mean Family Income | 15,948 | $58,438 |
| Median Household Income | 24,372 | $36,258 |
| Mean Household Income | 24,372 | $53,544 |
| Income Deficit | 15,948 | $10,911 |
| Wage / Income Gap (%) | 71,799 | 26.42% |
| Wage / Income Gap ($) | 71,799 | 73.58¢ per $1 |
| Gini / Inequality Index | 71,799 | 0.50 |
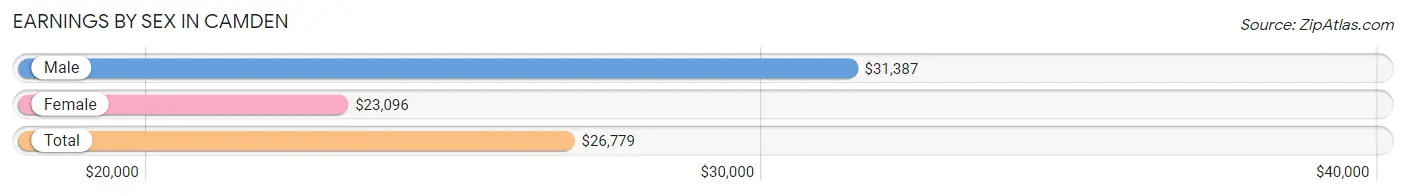
Earnings by Sex in Camden
Average Earnings in Camden are $26,779, $31,387 for men and $23,096 for women, a difference of 26.4%.
| Sex | Number | Average Earnings |
| Male | 14,695 (48.0%) | $31,387 |
| Female | 15,889 (51.9%) | $23,096 |
| Total | 30,584 (100.0%) | $26,779 |
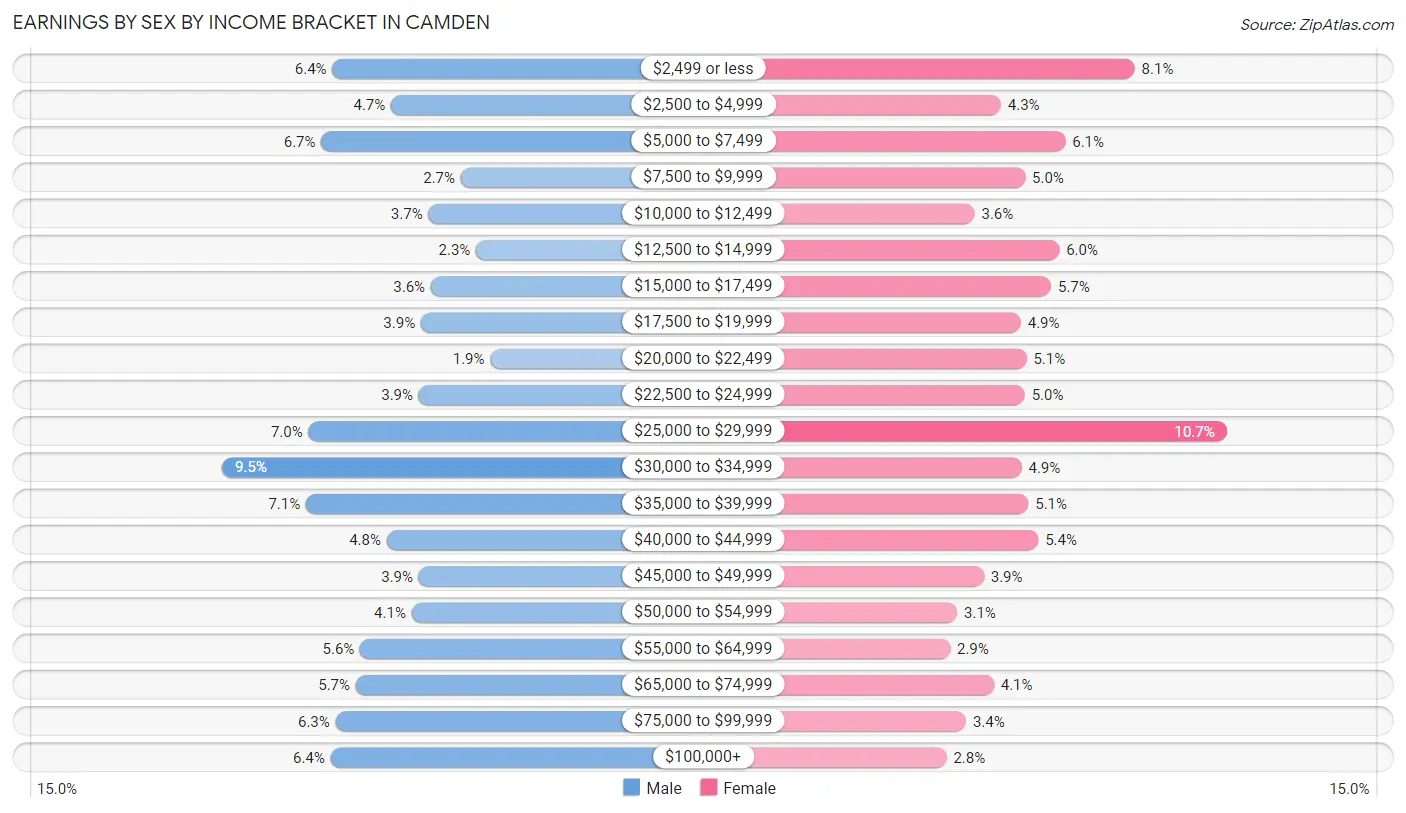
Earnings by Sex by Income Bracket in Camden
The most common earnings brackets in Camden are $30,000 to $34,999 for men (1,388 | 9.5%) and $25,000 to $29,999 for women (1,696 | 10.7%).
| Income | Male | Female |
| $2,499 or less | 933 (6.4%) | 1,285 (8.1%) |
| $2,500 to $4,999 | 691 (4.7%) | 688 (4.3%) |
| $5,000 to $7,499 | 979 (6.7%) | 976 (6.1%) |
| $7,500 to $9,999 | 402 (2.7%) | 796 (5.0%) |
| $10,000 to $12,499 | 536 (3.6%) | 571 (3.6%) |
| $12,500 to $14,999 | 339 (2.3%) | 948 (6.0%) |
| $15,000 to $17,499 | 526 (3.6%) | 912 (5.7%) |
| $17,500 to $19,999 | 567 (3.9%) | 777 (4.9%) |
| $20,000 to $22,499 | 280 (1.9%) | 802 (5.1%) |
| $22,500 to $24,999 | 576 (3.9%) | 795 (5.0%) |
| $25,000 to $29,999 | 1,032 (7.0%) | 1,696 (10.7%) |
| $30,000 to $34,999 | 1,388 (9.5%) | 780 (4.9%) |
| $35,000 to $39,999 | 1,042 (7.1%) | 810 (5.1%) |
| $40,000 to $44,999 | 709 (4.8%) | 855 (5.4%) |
| $45,000 to $49,999 | 576 (3.9%) | 612 (3.8%) |
| $50,000 to $54,999 | 605 (4.1%) | 492 (3.1%) |
| $55,000 to $64,999 | 818 (5.6%) | 461 (2.9%) |
| $65,000 to $74,999 | 836 (5.7%) | 656 (4.1%) |
| $75,000 to $99,999 | 920 (6.3%) | 532 (3.4%) |
| $100,000+ | 940 (6.4%) | 445 (2.8%) |
| Total | 14,695 (100.0%) | 15,889 (100.0%) |
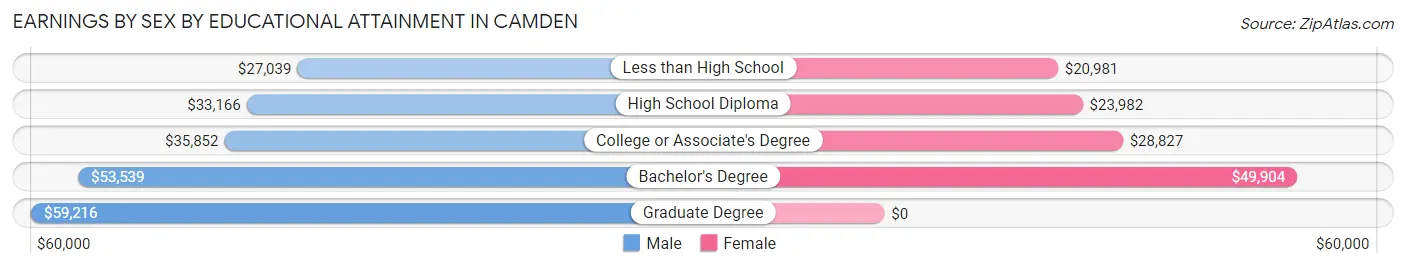
Earnings by Sex by Educational Attainment in Camden
Average earnings in Camden are $34,706 for men and $27,976 for women, a difference of 19.4%. Men with an educational attainment of graduate degree enjoy the highest average annual earnings of $59,216, while those with less than high school education earn the least with $27,039. Women with an educational attainment of bachelor's degree earn the most with the average annual earnings of $49,904, while those with less than high school education have the smallest earnings of $20,981.
| Educational Attainment | Male Income | Female Income |
| Less than High School | $27,039 | $20,981 |
| High School Diploma | $33,166 | $23,982 |
| College or Associate's Degree | $35,852 | $28,827 |
| Bachelor's Degree | $53,539 | $49,904 |
| Graduate Degree | $59,216 | $0 |
| Total | $34,706 | $27,976 |
Family Income in Camden
Family Income Brackets in Camden
According to the Camden family income data, there are 2,472 families falling into the $50,000 to $74,999 income range, which is the most common income bracket and makes up 15.5% of all families. Conversely, the $200,000+ income bracket is the least frequent group with only 462 families (2.9%) belonging to this category.
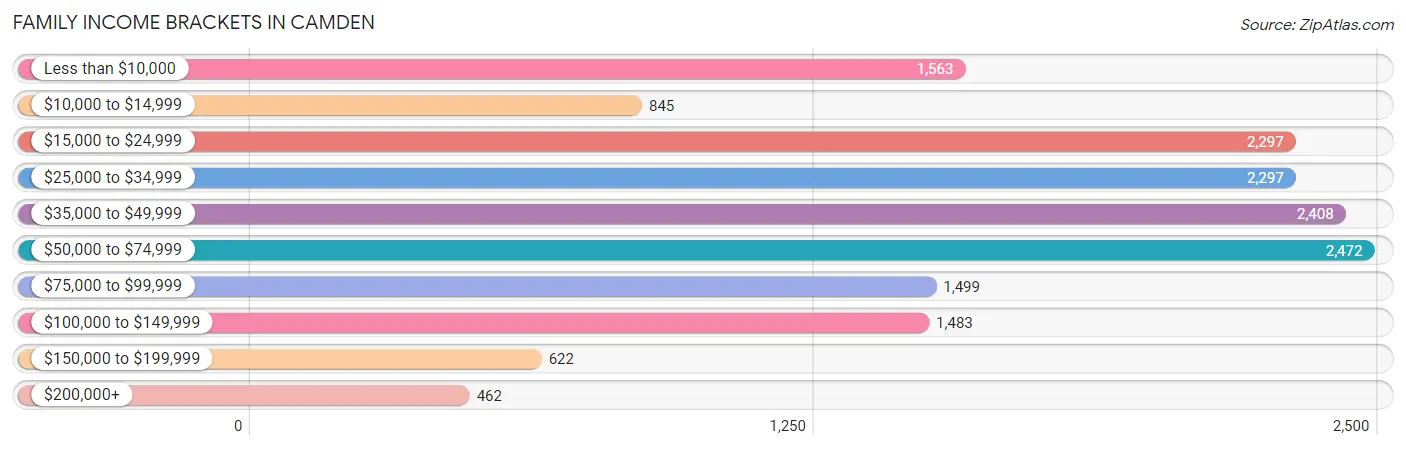
| Income Bracket | # Families | % Families |
| Less than $10,000 | 1,563 | 9.8% |
| $10,000 to $14,999 | 845 | 5.3% |
| $15,000 to $24,999 | 2,297 | 14.4% |
| $25,000 to $34,999 | 2,297 | 14.4% |
| $35,000 to $49,999 | 2,408 | 15.1% |
| $50,000 to $74,999 | 2,472 | 15.5% |
| $75,000 to $99,999 | 1,499 | 9.4% |
| $100,000 to $149,999 | 1,483 | 9.3% |
| $150,000 to $199,999 | 622 | 3.9% |
| $200,000+ | 462 | 2.9% |
Family Income by Famaliy Size in Camden
7+ person families (604 | 3.8%) account for the highest median family income in Camden with $94,375 per family, while 2-person families (5,831 | 36.6%) have the highest median income of $14,728 per family member.
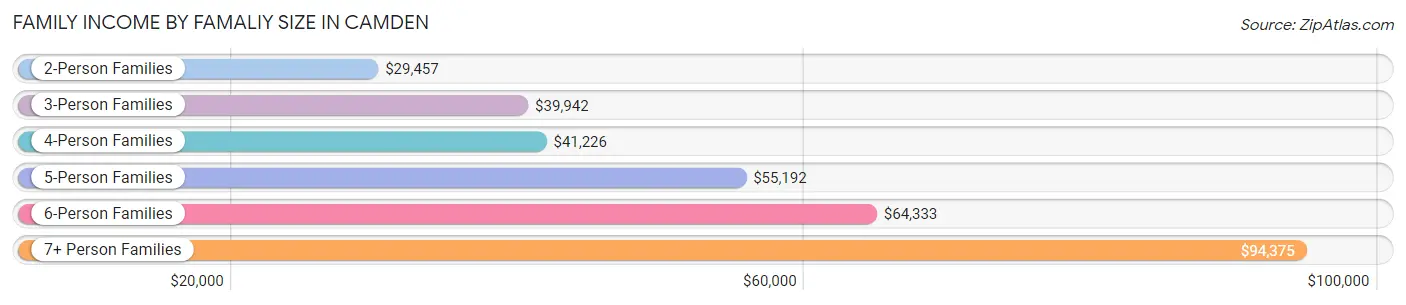
| Income Bracket | # Families | Median Income |
| 2-Person Families | 5,831 (36.6%) | $29,457 |
| 3-Person Families | 4,159 (26.1%) | $39,942 |
| 4-Person Families | 3,360 (21.1%) | $41,226 |
| 5-Person Families | 1,330 (8.3%) | $55,192 |
| 6-Person Families | 664 (4.2%) | $64,333 |
| 7+ Person Families | 604 (3.8%) | $94,375 |
| Total | 15,948 (100.0%) | $40,623 |
Family Income by Number of Earners in Camden
The median family income in Camden is $40,623, with families comprising 3+ earners (1,738) having the highest median family income of $102,368, while families with no earners (2,152) have the lowest median family income of $17,899, accounting for 10.9% and 13.5% of families, respectively.
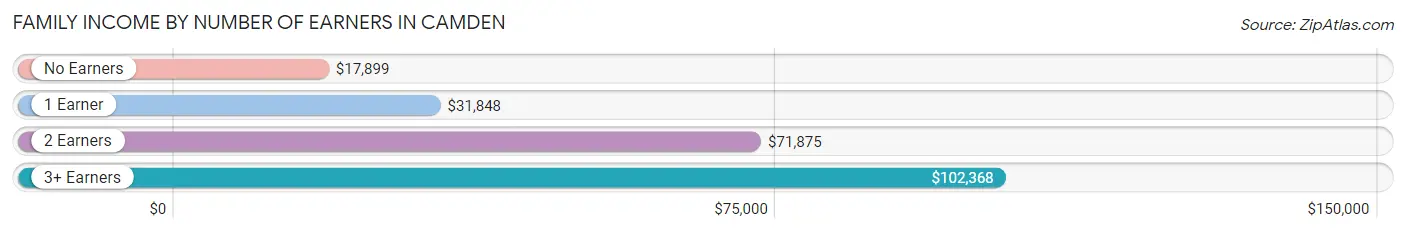
| Number of Earners | # Families | Median Income |
| No Earners | 2,152 (13.5%) | $17,899 |
| 1 Earner | 8,280 (51.9%) | $31,848 |
| 2 Earners | 3,778 (23.7%) | $71,875 |
| 3+ Earners | 1,738 (10.9%) | $102,368 |
| Total | 15,948 (100.0%) | $40,623 |
Household Income in Camden
Household Income Brackets in Camden
With 3,607 households falling in the category, the $50,000 to $74,999 income range is the most frequent in Camden, accounting for 14.8% of all households. In contrast, only 658 households (2.7%) fall into the $200,000+ income bracket, making it the least populous group.
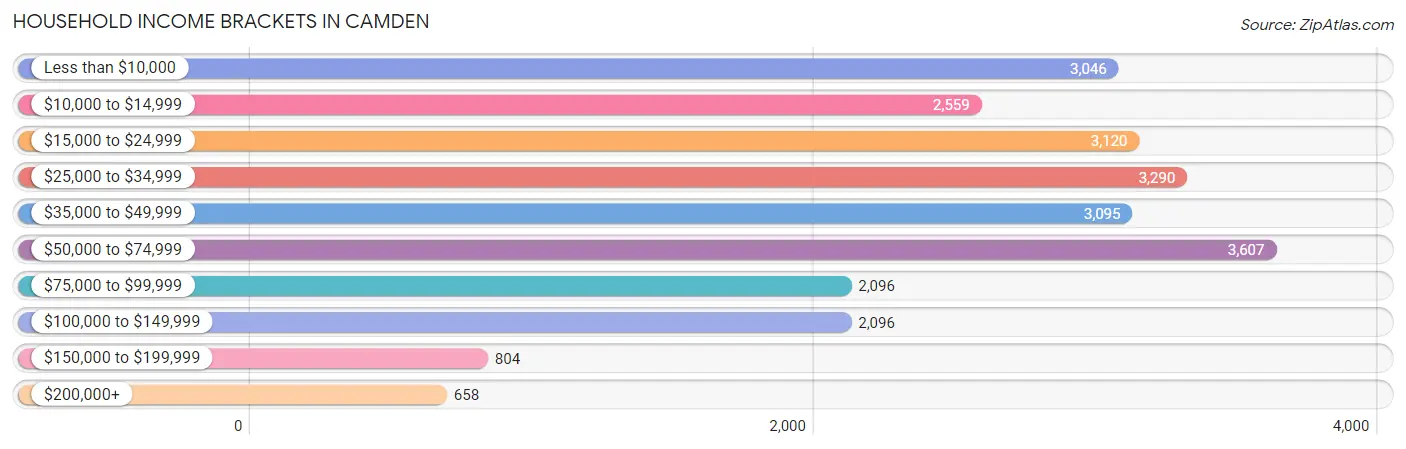
| Income Bracket | # Households | % Households |
| Less than $10,000 | 3,046 | 12.5% |
| $10,000 to $14,999 | 2,559 | 10.5% |
| $15,000 to $24,999 | 3,120 | 12.8% |
| $25,000 to $34,999 | 3,290 | 13.5% |
| $35,000 to $49,999 | 3,095 | 12.7% |
| $50,000 to $74,999 | 3,607 | 14.8% |
| $75,000 to $99,999 | 2,096 | 8.6% |
| $100,000 to $149,999 | 2,096 | 8.6% |
| $150,000 to $199,999 | 804 | 3.3% |
| $200,000+ | 658 | 2.7% |
Household Income by Householder Age in Camden
The median household income in Camden is $36,258, with the highest median household income of $39,226 found in the 45 to 64 years age bracket for the primary householder. A total of 9,660 households (39.6%) fall into this category. Meanwhile, the 65+ years age bracket for the primary householder has the lowest median household income of $30,729, with 5,225 households (21.4%) in this group.
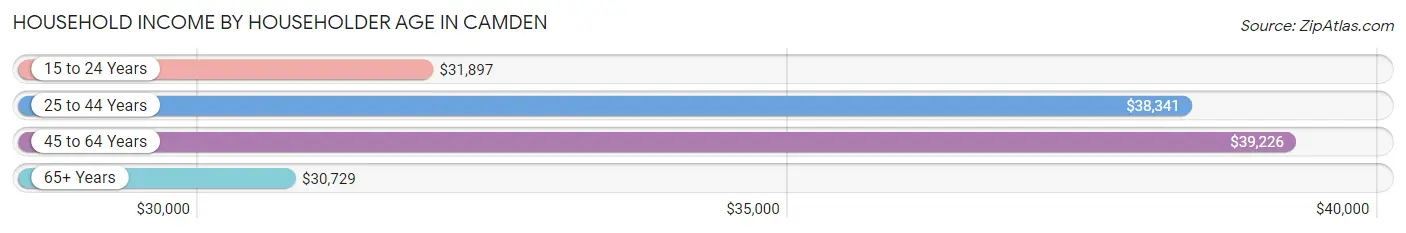
| Income Bracket | # Households | Median Income |
| 15 to 24 Years | 1,064 (4.4%) | $31,897 |
| 25 to 44 Years | 8,423 (34.6%) | $38,341 |
| 45 to 64 Years | 9,660 (39.6%) | $39,226 |
| 65+ Years | 5,225 (21.4%) | $30,729 |
| Total | 24,372 (100.0%) | $36,258 |
Poverty in Camden
Income Below Poverty by Sex and Age in Camden
With 27.7% poverty level for males and 34.9% for females among the residents of Camden, under 5 year old males and 12 to 14 year old females are the most vulnerable to poverty, with 1,080 males (48.8%) and 1,032 females (54.3%) in their respective age groups living below the poverty level.
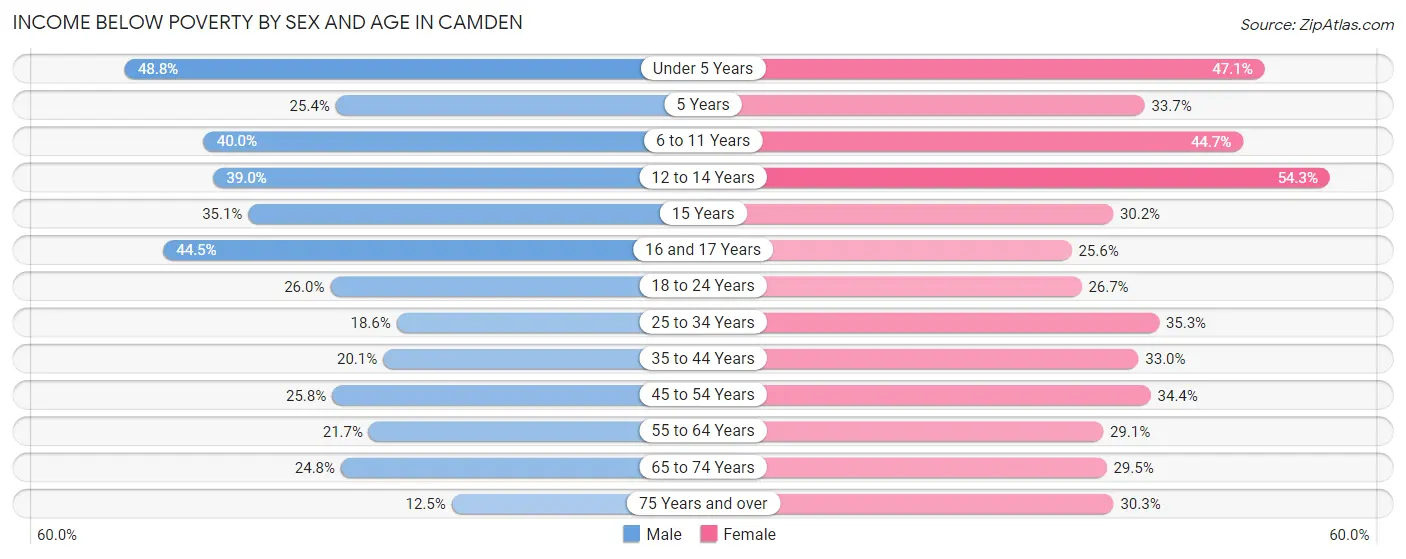
| Age Bracket | Male | Female |
| Under 5 Years | 1,080 (48.8%) | 1,299 (47.1%) |
| 5 Years | 124 (25.4%) | 208 (33.7%) |
| 6 to 11 Years | 1,331 (40.0%) | 1,607 (44.7%) |
| 12 to 14 Years | 675 (39.0%) | 1,032 (54.3%) |
| 15 Years | 179 (35.1%) | 283 (30.2%) |
| 16 and 17 Years | 526 (44.5%) | 244 (25.6%) |
| 18 to 24 Years | 832 (26.0%) | 1,207 (26.7%) |
| 25 to 34 Years | 809 (18.6%) | 1,894 (35.3%) |
| 35 to 44 Years | 832 (20.1%) | 1,549 (33.0%) |
| 45 to 54 Years | 1,048 (25.8%) | 1,445 (34.4%) |
| 55 to 64 Years | 769 (21.7%) | 1,171 (29.1%) |
| 65 to 74 Years | 425 (24.8%) | 720 (29.5%) |
| 75 Years and over | 149 (12.4%) | 598 (30.3%) |
| Total | 8,779 (27.7%) | 13,257 (34.9%) |
Income Above Poverty by Sex and Age in Camden
According to the poverty statistics in Camden, males aged 75 years and over and females aged 16 and 17 years are the age groups that are most secure financially, with 87.5% of males and 74.4% of females in these age groups living above the poverty line.
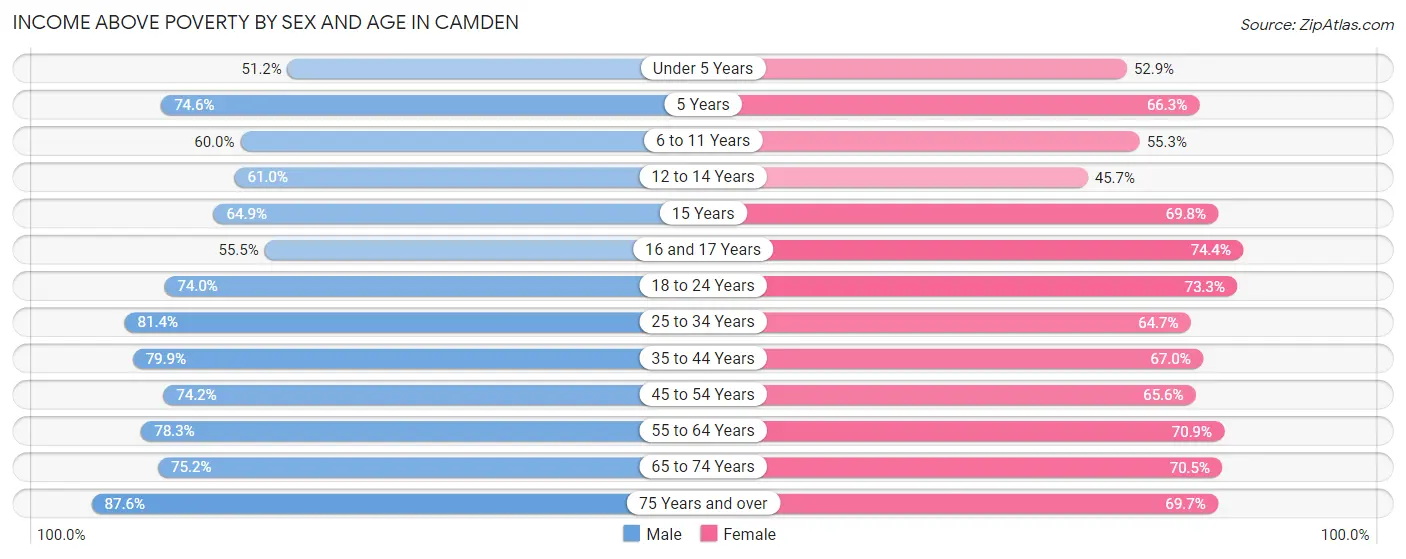
| Age Bracket | Male | Female |
| Under 5 Years | 1,132 (51.2%) | 1,461 (52.9%) |
| 5 Years | 365 (74.6%) | 409 (66.3%) |
| 6 to 11 Years | 1,993 (60.0%) | 1,988 (55.3%) |
| 12 to 14 Years | 1,057 (61.0%) | 867 (45.7%) |
| 15 Years | 331 (64.9%) | 654 (69.8%) |
| 16 and 17 Years | 655 (55.5%) | 710 (74.4%) |
| 18 to 24 Years | 2,373 (74.0%) | 3,315 (73.3%) |
| 25 to 34 Years | 3,546 (81.4%) | 3,469 (64.7%) |
| 35 to 44 Years | 3,312 (79.9%) | 3,140 (67.0%) |
| 45 to 54 Years | 3,020 (74.2%) | 2,757 (65.6%) |
| 55 to 64 Years | 2,780 (78.3%) | 2,855 (70.9%) |
| 65 to 74 Years | 1,290 (75.2%) | 1,722 (70.5%) |
| 75 Years and over | 1,048 (87.5%) | 1,378 (69.7%) |
| Total | 22,902 (72.3%) | 24,725 (65.1%) |
Income Below Poverty Among Married-Couple Families in Camden
The poverty statistics for married-couple families in Camden show that 13.2% or 549 of the total 4,165 families live below the poverty line. Families with 3 or 4 children have the highest poverty rate of 25.9%, comprising of 165 families. On the other hand, families with no children have the lowest poverty rate of 2.9%, which includes 64 families.
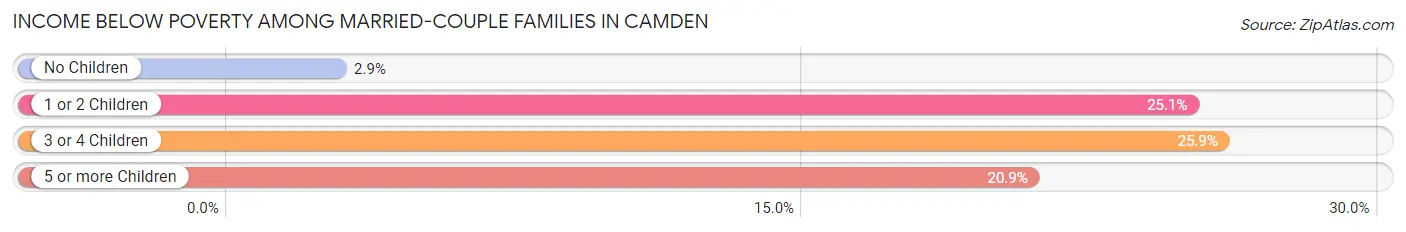
| Children | Above Poverty | Below Poverty |
| No Children | 2,182 (97.2%) | 64 (2.9%) |
| 1 or 2 Children | 928 (74.9%) | 311 (25.1%) |
| 3 or 4 Children | 472 (74.1%) | 165 (25.9%) |
| 5 or more Children | 34 (79.1%) | 9 (20.9%) |
| Total | 3,616 (86.8%) | 549 (13.2%) |
Income Below Poverty Among Single-Parent Households in Camden
According to the poverty data in Camden, 23.0% or 607 single-father households and 36.6% or 3,345 single-mother households are living below the poverty line. Among single-father households, those with 3 or 4 children have the highest poverty rate, with 38 households (41.8%) experiencing poverty. Likewise, among single-mother households, those with 5 or more children have the highest poverty rate, with 142 households (84.0%) falling below the poverty line.
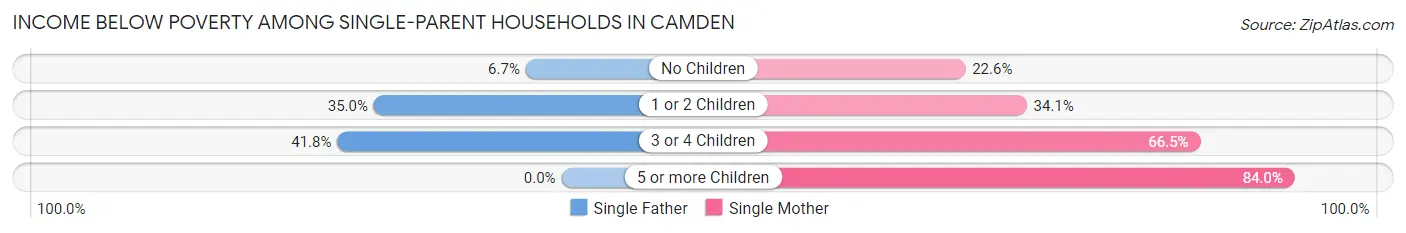
| Children | Single Father | Single Mother |
| No Children | 76 (6.7%) | 677 (22.6%) |
| 1 or 2 Children | 493 (35.0%) | 1,524 (34.1%) |
| 3 or 4 Children | 38 (41.8%) | 1,002 (66.4%) |
| 5 or more Children | 0 (0.0%) | 142 (84.0%) |
| Total | 607 (23.0%) | 3,345 (36.6%) |
Income Below Poverty Among Married-Couple vs Single-Parent Households in Camden
The poverty data for Camden shows that 549 of the married-couple family households (13.2%) and 3,952 of the single-parent households (33.5%) are living below the poverty level. Within the married-couple family households, those with 3 or 4 children have the highest poverty rate, with 165 households (25.9%) falling below the poverty line. Among the single-parent households, those with 5 or more children have the highest poverty rate, with 142 household (84.0%) living below poverty.
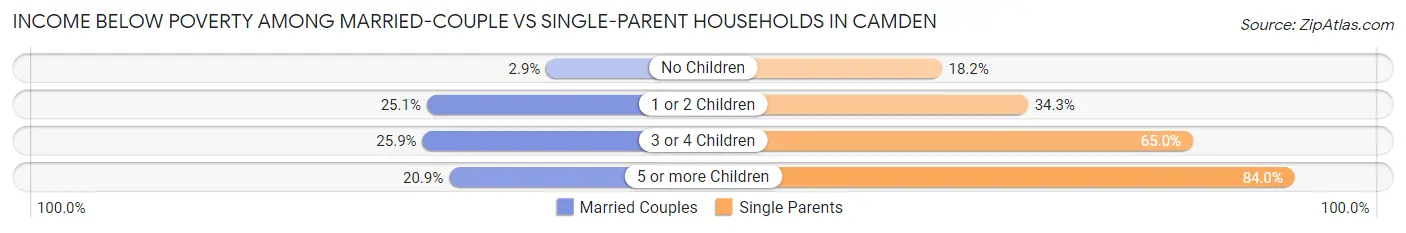
| Children | Married-Couple Families | Single-Parent Households |
| No Children | 64 (2.9%) | 753 (18.2%) |
| 1 or 2 Children | 311 (25.1%) | 2,017 (34.3%) |
| 3 or 4 Children | 165 (25.9%) | 1,040 (65.0%) |
| 5 or more Children | 9 (20.9%) | 142 (84.0%) |
| Total | 549 (13.2%) | 3,952 (33.5%) |
Race in Camden
The most populous races in Camden are Hispanic or Latino (38,264 | 53.3%), Black / African American (30,816 | 42.9%), and Some other Race (25,352 | 35.3%).
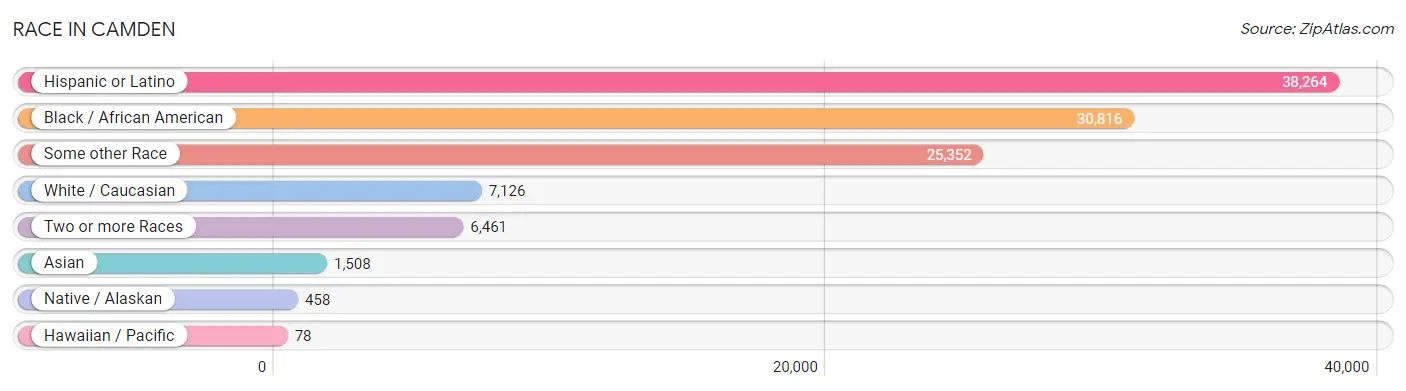
| Race | # Population | % Population |
| Asian | 1,508 | 2.1% |
| Black / African American | 30,816 | 42.9% |
| Hawaiian / Pacific | 78 | 0.1% |
| Hispanic or Latino | 38,264 | 53.3% |
| Native / Alaskan | 458 | 0.6% |
| White / Caucasian | 7,126 | 9.9% |
| Two or more Races | 6,461 | 9.0% |
| Some other Race | 25,352 | 35.3% |
| Total | 71,799 | 100.0% |
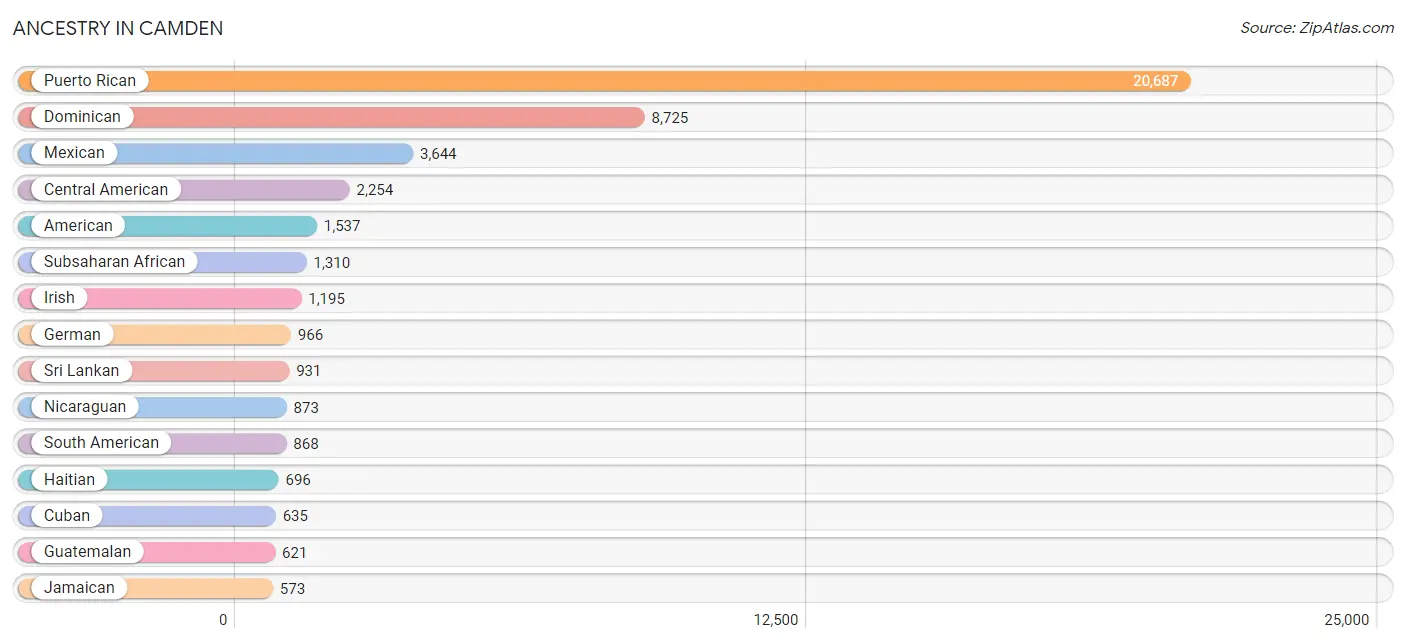
Ancestry in Camden
The most populous ancestries reported in Camden are Puerto Rican (20,687 | 28.8%), Dominican (8,725 | 12.1%), Mexican (3,644 | 5.1%), Central American (2,254 | 3.1%), and American (1,537 | 2.1%), together accounting for 51.3% of all Camden residents.
| Ancestry | # Population | % Population |
| African | 566 | 0.8% |
| American | 1,537 | 2.1% |
| Arab | 242 | 0.3% |
| Argentinean | 15 | 0.0% |
| Bhutanese | 27 | 0.0% |
| Blackfeet | 187 | 0.3% |
| Bolivian | 75 | 0.1% |
| Brazilian | 16 | 0.0% |
| British West Indian | 52 | 0.1% |
| Burmese | 14 | 0.0% |
| Central American | 2,254 | 3.1% |
| Central American Indian | 166 | 0.2% |
| Cherokee | 129 | 0.2% |
| Chilean | 57 | 0.1% |
| Chinese | 100 | 0.1% |
| Chippewa | 4 | 0.0% |
| Colombian | 191 | 0.3% |
| Costa Rican | 13 | 0.0% |
| Cuban | 635 | 0.9% |
| Delaware | 13 | 0.0% |
| Dominican | 8,725 | 12.1% |
| Dutch | 39 | 0.1% |
| Eastern European | 31 | 0.0% |
| Ecuadorian | 481 | 0.7% |
| English | 282 | 0.4% |
| Ethiopian | 59 | 0.1% |
| European | 38 | 0.1% |
| French | 12 | 0.0% |
| German | 966 | 1.3% |
| Ghanaian | 76 | 0.1% |
| Guatemalan | 621 | 0.9% |
| Guyanese | 30 | 0.0% |
| Haitian | 696 | 1.0% |
| Hmong | 36 | 0.1% |
| Honduran | 239 | 0.3% |
| Hungarian | 68 | 0.1% |
| Indian (Asian) | 113 | 0.2% |
| Irish | 1,195 | 1.7% |
| Italian | 488 | 0.7% |
| Jamaican | 573 | 0.8% |
| Japanese | 320 | 0.4% |
| Korean | 195 | 0.3% |
| Mexican | 3,644 | 5.1% |
| Mexican American Indian | 61 | 0.1% |
| Moroccan | 233 | 0.3% |
| Native Hawaiian | 100 | 0.1% |
| Navajo | 53 | 0.1% |
| Nicaraguan | 873 | 1.2% |
| Nigerian | 560 | 0.8% |
| Norwegian | 13 | 0.0% |
| Pakistani | 41 | 0.1% |
| Palestinian | 9 | 0.0% |
| Panamanian | 158 | 0.2% |
| Paraguayan | 10 | 0.0% |
| Pennsylvania German | 10 | 0.0% |
| Peruvian | 39 | 0.1% |
| Polish | 147 | 0.2% |
| Portuguese | 197 | 0.3% |
| Puerto Rican | 20,687 | 28.8% |
| Romanian | 1 | 0.0% |
| Russian | 8 | 0.0% |
| Salvadoran | 350 | 0.5% |
| Scottish | 13 | 0.0% |
| Seminole | 13 | 0.0% |
| South American | 868 | 1.2% |
| Spaniard | 92 | 0.1% |
| Spanish | 55 | 0.1% |
| Spanish American | 128 | 0.2% |
| Sri Lankan | 931 | 1.3% |
| Subsaharan African | 1,310 | 1.8% |
| Swedish | 27 | 0.0% |
| Thai | 66 | 0.1% |
| Trinidadian and Tobagonian | 96 | 0.1% |
| U.S. Virgin Islander | 18 | 0.0% |
| Welsh | 12 | 0.0% |
| West Indian | 258 | 0.4% | View All 76 Rows |
Immigrants in Camden
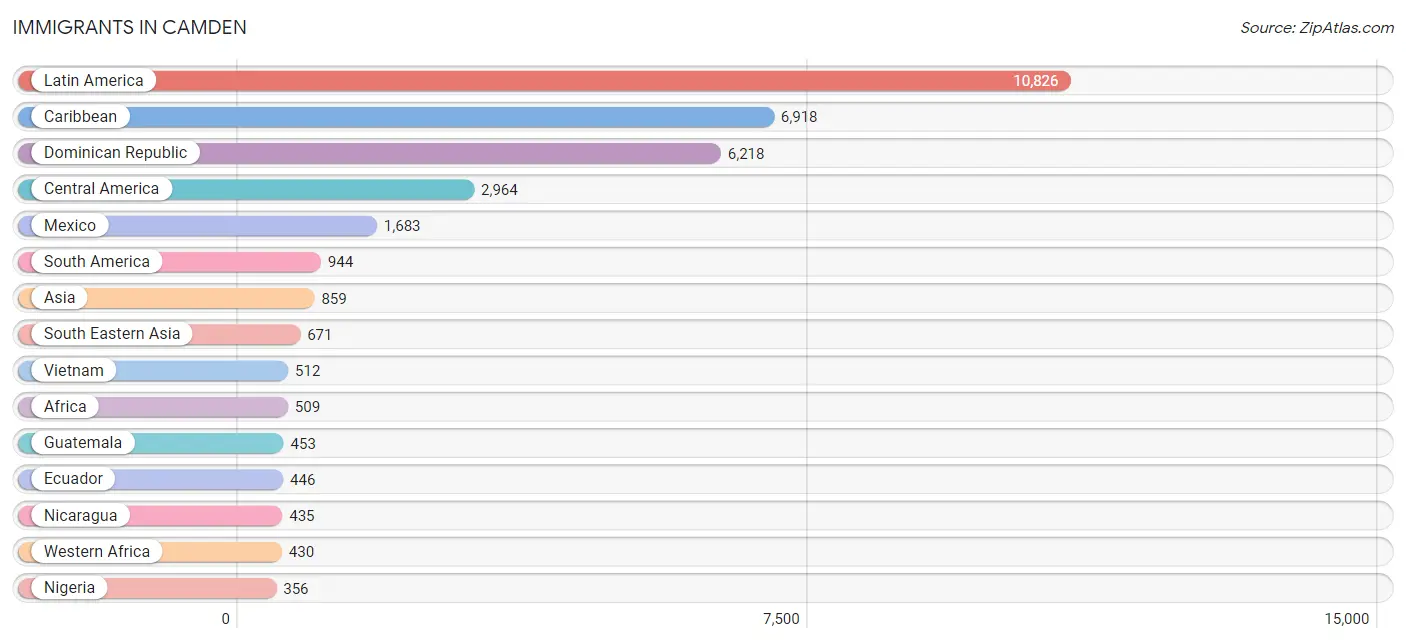
The most numerous immigrant groups reported in Camden came from Latin America (10,826 | 15.1%), Caribbean (6,918 | 9.6%), Dominican Republic (6,218 | 8.7%), Central America (2,964 | 4.1%), and Mexico (1,683 | 2.3%), together accounting for 39.8% of all Camden residents.
| Immigration Origin | # Population | % Population |
| Africa | 509 | 0.7% |
| Asia | 859 | 1.2% |
| Belize | 30 | 0.0% |
| Brazil | 27 | 0.0% |
| Cambodia | 31 | 0.0% |
| Canada | 12 | 0.0% |
| Caribbean | 6,918 | 9.6% |
| Central America | 2,964 | 4.1% |
| Chile | 82 | 0.1% |
| China | 37 | 0.1% |
| Colombia | 321 | 0.4% |
| Cuba | 240 | 0.3% |
| Dominica | 19 | 0.0% |
| Dominican Republic | 6,218 | 8.7% |
| Eastern Africa | 79 | 0.1% |
| Eastern Asia | 41 | 0.1% |
| Eastern Europe | 20 | 0.0% |
| Ecuador | 446 | 0.6% |
| El Salvador | 139 | 0.2% |
| England | 13 | 0.0% |
| Ethiopia | 44 | 0.1% |
| Europe | 128 | 0.2% |
| Germany | 23 | 0.0% |
| Ghana | 8 | 0.0% |
| Grenada | 25 | 0.0% |
| Guatemala | 453 | 0.6% |
| Guyana | 30 | 0.0% |
| Haiti | 57 | 0.1% |
| Honduras | 224 | 0.3% |
| India | 82 | 0.1% |
| Jamaica | 236 | 0.3% |
| Jordan | 9 | 0.0% |
| Korea | 4 | 0.0% |
| Latin America | 10,826 | 15.1% |
| Mexico | 1,683 | 2.3% |
| Nicaragua | 435 | 0.6% |
| Nigeria | 356 | 0.5% |
| Northern Europe | 13 | 0.0% |
| Pakistan | 56 | 0.1% |
| Peru | 28 | 0.0% |
| Philippines | 128 | 0.2% |
| Poland | 20 | 0.0% |
| Portugal | 49 | 0.1% |
| Sierra Leone | 17 | 0.0% |
| South America | 944 | 1.3% |
| South Central Asia | 138 | 0.2% |
| South Eastern Asia | 671 | 0.9% |
| Southern Europe | 72 | 0.1% |
| Spain | 23 | 0.0% |
| Taiwan | 8 | 0.0% |
| Trinidad and Tobago | 96 | 0.1% |
| Uganda | 35 | 0.1% |
| Vietnam | 512 | 0.7% |
| Western Africa | 430 | 0.6% |
| Western Asia | 9 | 0.0% |
| Western Europe | 23 | 0.0% | View All 56 Rows |
Sex and Age in Camden
Sex and Age in Camden
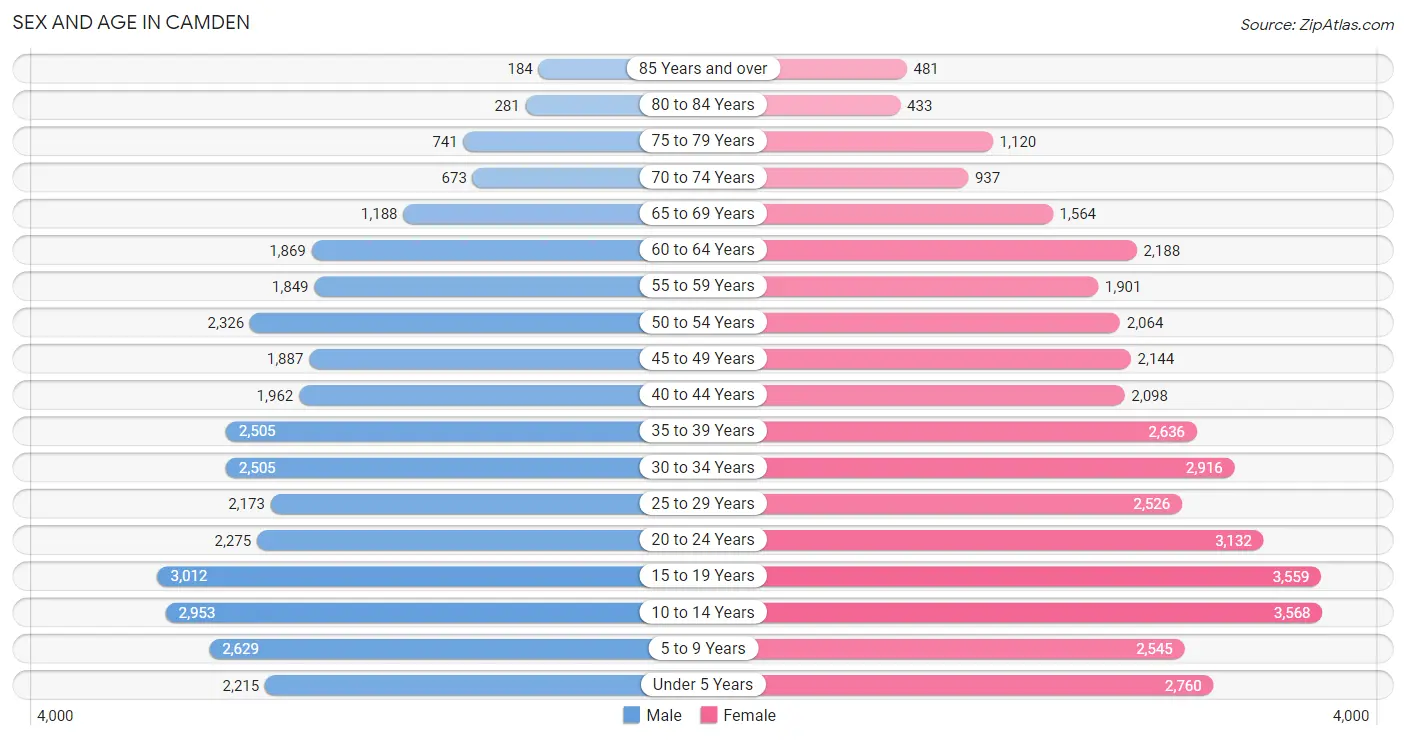
The most populous age groups in Camden are 15 to 19 Years (3,012 | 9.1%) for men and 10 to 14 Years (3,568 | 9.2%) for women.
| Age Bracket | Male | Female |
| Under 5 Years | 2,215 (6.7%) | 2,760 (7.2%) |
| 5 to 9 Years | 2,629 (7.9%) | 2,545 (6.6%) |
| 10 to 14 Years | 2,953 (8.9%) | 3,568 (9.2%) |
| 15 to 19 Years | 3,012 (9.1%) | 3,559 (9.2%) |
| 20 to 24 Years | 2,275 (6.9%) | 3,132 (8.1%) |
| 25 to 29 Years | 2,173 (6.5%) | 2,526 (6.6%) |
| 30 to 34 Years | 2,505 (7.5%) | 2,916 (7.6%) |
| 35 to 39 Years | 2,505 (7.5%) | 2,636 (6.8%) |
| 40 to 44 Years | 1,962 (5.9%) | 2,098 (5.4%) |
| 45 to 49 Years | 1,887 (5.7%) | 2,144 (5.6%) |
| 50 to 54 Years | 2,326 (7.0%) | 2,064 (5.3%) |
| 55 to 59 Years | 1,849 (5.6%) | 1,901 (4.9%) |
| 60 to 64 Years | 1,869 (5.6%) | 2,188 (5.7%) |
| 65 to 69 Years | 1,188 (3.6%) | 1,564 (4.1%) |
| 70 to 74 Years | 673 (2.0%) | 937 (2.4%) |
| 75 to 79 Years | 741 (2.2%) | 1,120 (2.9%) |
| 80 to 84 Years | 281 (0.9%) | 433 (1.1%) |
| 85 Years and over | 184 (0.5%) | 481 (1.3%) |
| Total | 33,227 (100.0%) | 38,572 (100.0%) |
Families and Households in Camden
Median Family Size in Camden
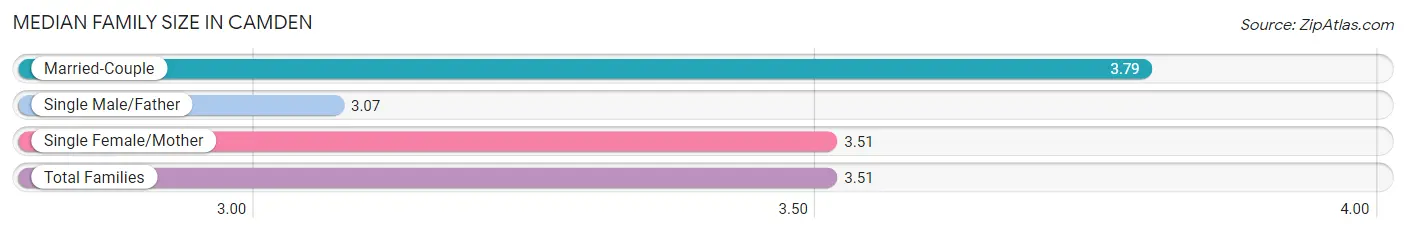
The median family size in Camden is 3.51 persons per family, with married-couple families (4,165 | 26.1%) accounting for the largest median family size of 3.79 persons per family. On the other hand, single male/father families (2,642 | 16.6%) represent the smallest median family size with 3.07 persons per family.
| Family Type | # Families | Family Size |
| Married-Couple | 4,165 (26.1%) | 3.79 |
| Single Male/Father | 2,642 (16.6%) | 3.07 |
| Single Female/Mother | 9,141 (57.3%) | 3.51 |
| Total Families | 15,948 (100.0%) | 3.51 |
Median Household Size in Camden
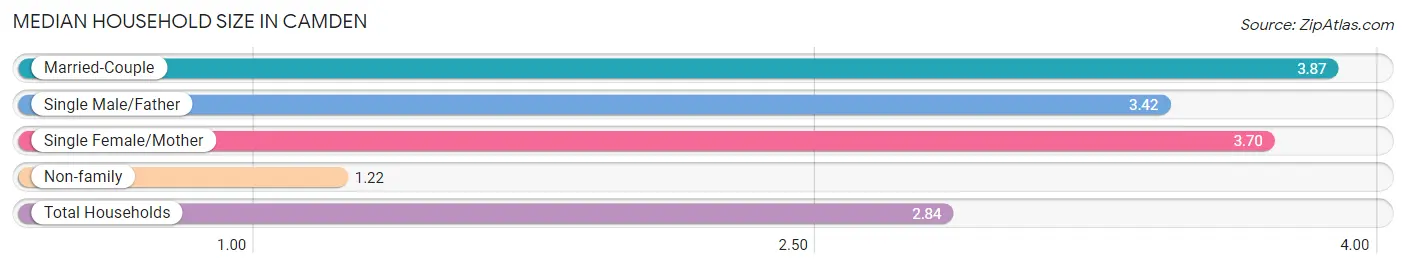
The median household size in Camden is 2.84 persons per household, with married-couple households (4,165 | 17.1%) accounting for the largest median household size of 3.87 persons per household. non-family households (8,424 | 34.6%) represent the smallest median household size with 1.22 persons per household.
| Household Type | # Households | Household Size |
| Married-Couple | 4,165 (17.1%) | 3.87 |
| Single Male/Father | 2,642 (10.8%) | 3.42 |
| Single Female/Mother | 9,141 (37.5%) | 3.70 |
| Non-family | 8,424 (34.6%) | 1.22 |
| Total Households | 24,372 (100.0%) | 2.84 |
Household Size by Marriage Status in Camden
Out of a total of 24,372 households in Camden, 15,948 (65.4%) are family households, while 8,424 (34.6%) are nonfamily households. The most numerous type of family households are 2-person households, comprising 4,996, and the most common type of nonfamily households are 1-person households, comprising 7,180.
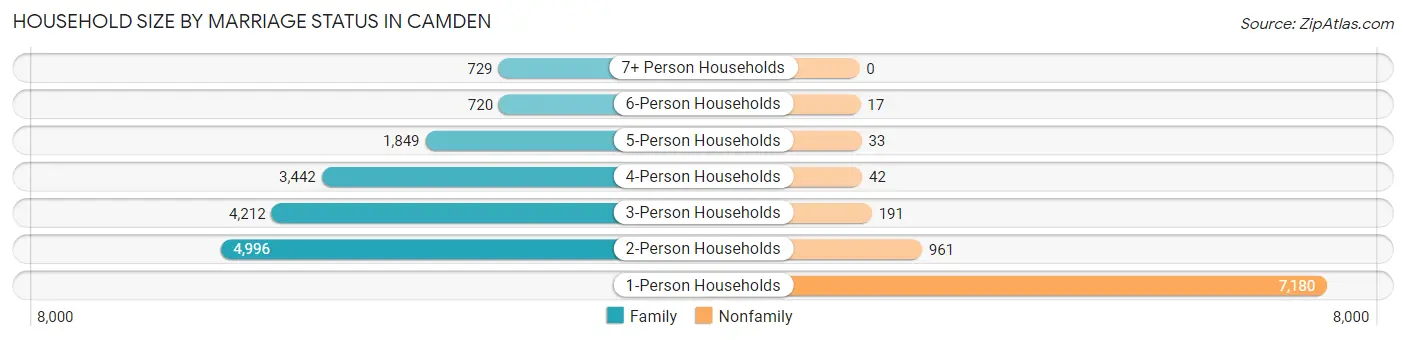
| Household Size | Family Households | Nonfamily Households |
| 1-Person Households | - | 7,180 (29.5%) |
| 2-Person Households | 4,996 (20.5%) | 961 (3.9%) |
| 3-Person Households | 4,212 (17.3%) | 191 (0.8%) |
| 4-Person Households | 3,442 (14.1%) | 42 (0.2%) |
| 5-Person Households | 1,849 (7.6%) | 33 (0.1%) |
| 6-Person Households | 720 (2.9%) | 17 (0.1%) |
| 7+ Person Households | 729 (3.0%) | 0 (0.0%) |
| Total | 15,948 (65.4%) | 8,424 (34.6%) |
Female Fertility in Camden
Fertility by Age in Camden
Average fertility rate in Camden is 60.0 births per 1,000 women. Women in the age bracket of 20 to 34 years have the highest fertility rate with 109.0 births per 1,000 women. Women in the age bracket of 20 to 34 years acount for 79.6% of all women with births.
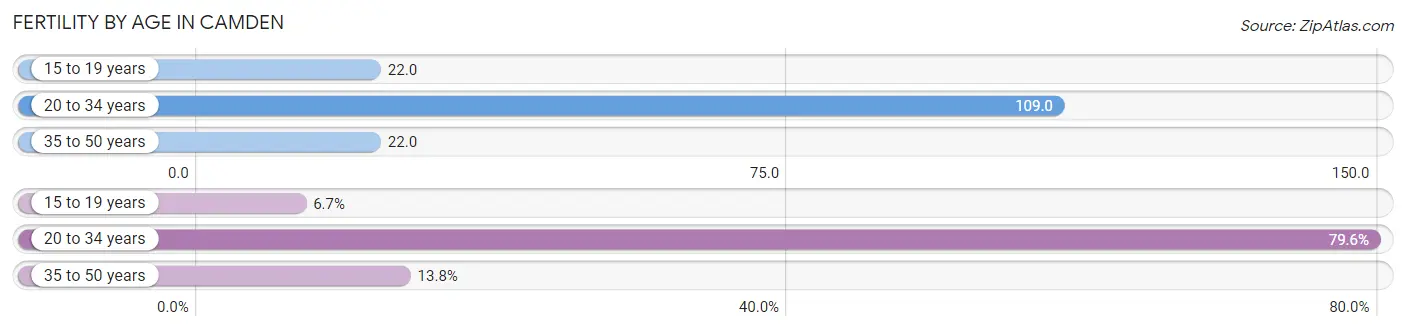
| Age Bracket | Women with Births | Births / 1,000 Women |
| 15 to 19 years | 78 (6.7%) | 22.0 |
| 20 to 34 years | 932 (79.6%) | 109.0 |
| 35 to 50 years | 161 (13.8%) | 22.0 |
| Total | 1,171 (100.0%) | 60.0 |
Fertility by Age by Marriage Status in Camden
25.4% of women with births (1,171) in Camden are married. The highest percentage of unmarried women with births falls into 15 to 19 years age bracket with 100.0% of them unmarried at the time of birth, while the lowest percentage of unmarried women with births belong to 35 to 50 years age bracket with 72.0% of them unmarried.
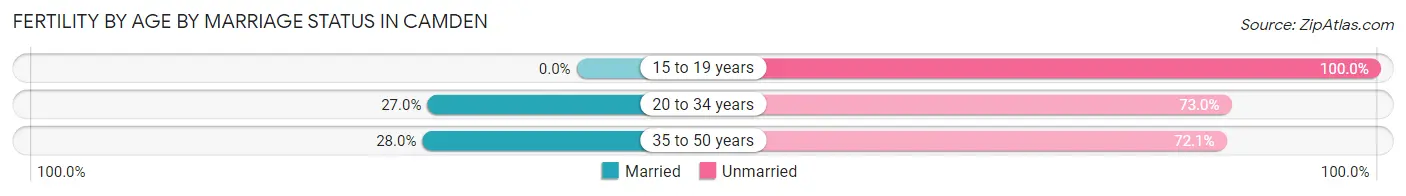
| Age Bracket | Married | Unmarried |
| 15 to 19 years | 0 (0.0%) | 78 (100.0%) |
| 20 to 34 years | 252 (27.0%) | 680 (73.0%) |
| 35 to 50 years | 45 (28.0%) | 116 (72.1%) |
| Total | 297 (25.4%) | 874 (74.6%) |
Fertility by Education in Camden
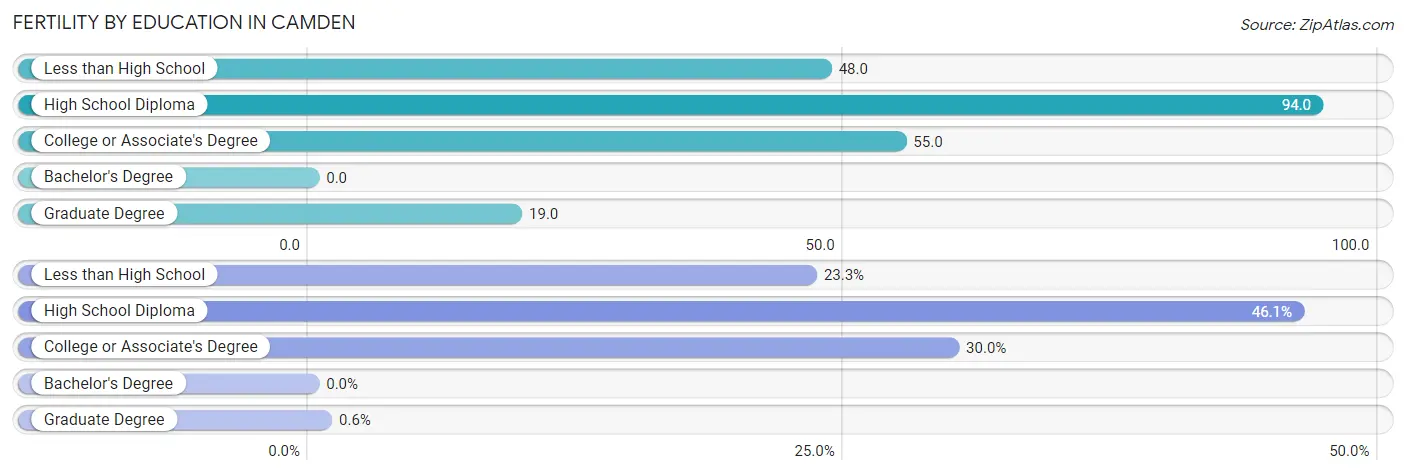
| Educational Attainment | Women with Births | Births / 1,000 Women |
| Less than High School | 273 (23.3%) | 48.0 |
| High School Diploma | 540 (46.1%) | 94.0 |
| College or Associate's Degree | 351 (30.0%) | 55.0 |
| Bachelor's Degree | 0 (0.0%) | 0.0 |
| Graduate Degree | 7 (0.6%) | 19.0 |
| Total | 1,171 (100.0%) | 60.0 |
Fertility by Education by Marriage Status in Camden
74.6% of women with births in Camden are unmarried. Women with the educational attainment of high school diploma are most likely to be married with 43.5% of them married at childbirth, while women with the educational attainment of less than high school are least likely to be married with 100.0% of them unmarried at childbirth.
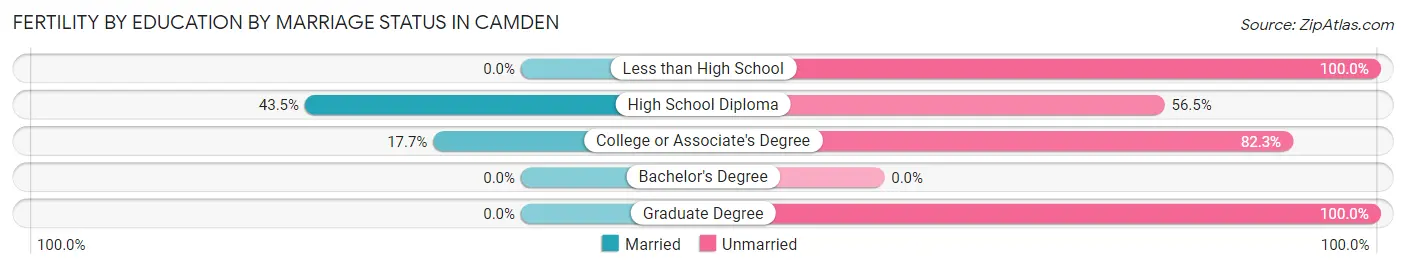
| Educational Attainment | Married | Unmarried |
| Less than High School | 0 (0.0%) | 273 (100.0%) |
| High School Diploma | 235 (43.5%) | 305 (56.5%) |
| College or Associate's Degree | 62 (17.7%) | 289 (82.3%) |
| Bachelor's Degree | 0 (0.0%) | 0 (0.0%) |
| Graduate Degree | 0 (0.0%) | 7 (100.0%) |
| Total | 297 (25.4%) | 874 (74.6%) |
Employment Characteristics in Camden
Employment by Class of Employer in Camden
Among the 24,827 employed individuals in Camden, private company employees (18,546 | 74.7%), not-for-profit organizations (2,305 | 9.3%), and local government employees (1,358 | 5.5%) make up the most common classes of employment.
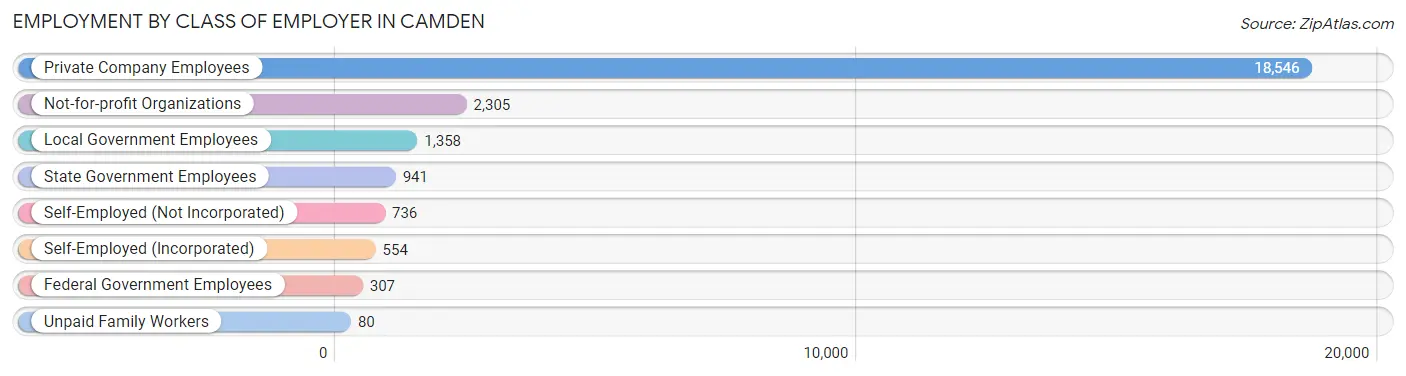
| Employer Class | # Employees | % Employees |
| Private Company Employees | 18,546 | 74.7% |
| Self-Employed (Incorporated) | 554 | 2.2% |
| Self-Employed (Not Incorporated) | 736 | 3.0% |
| Not-for-profit Organizations | 2,305 | 9.3% |
| Local Government Employees | 1,358 | 5.5% |
| State Government Employees | 941 | 3.8% |
| Federal Government Employees | 307 | 1.2% |
| Unpaid Family Workers | 80 | 0.3% |
| Total | 24,827 | 100.0% |
Employment Status by Age in Camden
According to the labor force statistics for Camden, out of the total population over 16 years of age (53,679), 56.7% or 30,436 individuals are in the labor force, with 14.6% or 4,444 of them unemployed. The age group with the highest labor force participation rate is 25 to 29 years, with 73.5% or 3,454 individuals in the labor force. Within the labor force, the 16 to 19 years age range has the highest percentage of unemployed individuals, with 22.5% or 488 of them being unemployed.
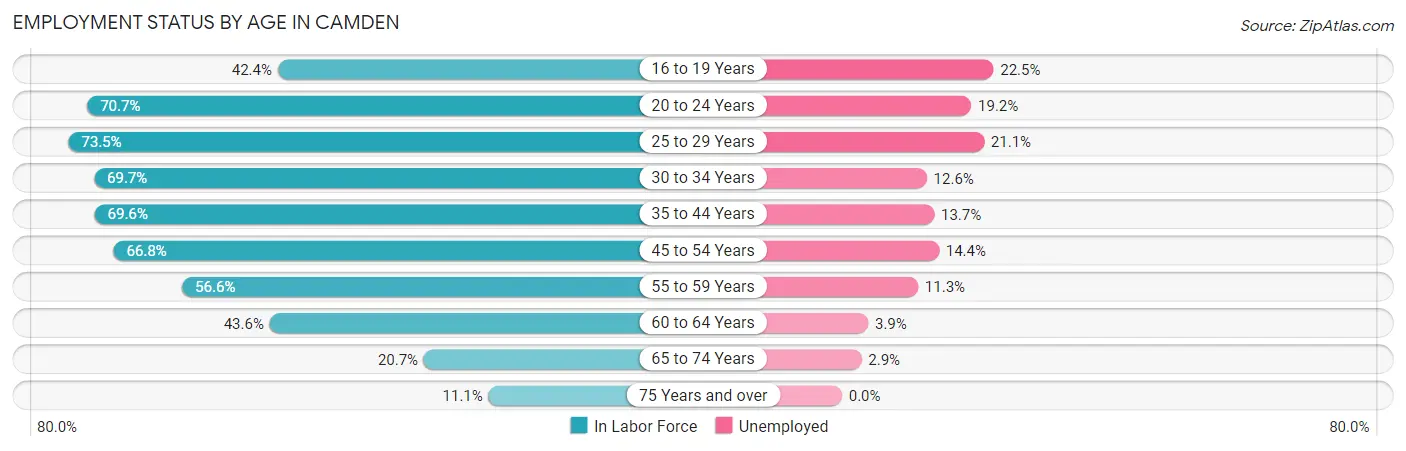
| Age Bracket | In Labor Force | Unemployed |
| 16 to 19 Years | 2,171 (42.4%) | 488 (22.5%) |
| 20 to 24 Years | 3,823 (70.7%) | 734 (19.2%) |
| 25 to 29 Years | 3,454 (73.5%) | 729 (21.1%) |
| 30 to 34 Years | 3,778 (69.7%) | 476 (12.6%) |
| 35 to 44 Years | 6,404 (69.6%) | 877 (13.7%) |
| 45 to 54 Years | 5,625 (66.8%) | 810 (14.4%) |
| 55 to 59 Years | 2,122 (56.6%) | 240 (11.3%) |
| 60 to 64 Years | 1,769 (43.6%) | 69 (3.9%) |
| 65 to 74 Years | 903 (20.7%) | 26 (2.9%) |
| 75 Years and over | 360 (11.1%) | 0 (0.0%) |
| Total | 30,436 (56.7%) | 4,444 (14.6%) |
Employment Status by Educational Attainment in Camden
According to labor force statistics for Camden, 65.1% of individuals (23,142) out of the total population between 25 and 64 years of age (35,549) are in the labor force, with 13.8% or 3,194 of them being unemployed. The group with the highest labor force participation rate are those with the educational attainment of bachelor's degree or higher, with 89.5% or 2,941 individuals in the labor force. Within the labor force, individuals with college / associate degree education have the highest percentage of unemployment, with 14.8% or 1,030 of them being unemployed.
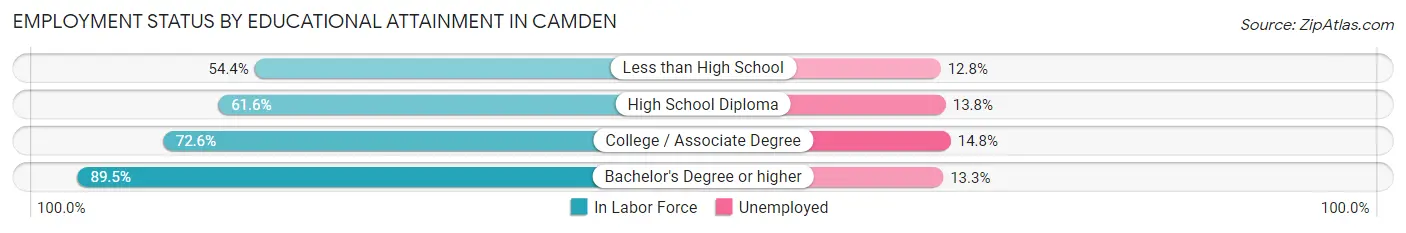
| Educational Attainment | In Labor Force | Unemployed |
| Less than High School | 5,321 (54.4%) | 1,252 (12.8%) |
| High School Diploma | 7,946 (61.6%) | 1,780 (13.8%) |
| College / Associate Degree | 6,957 (72.6%) | 1,418 (14.8%) |
| Bachelor's Degree or higher | 2,941 (89.5%) | 437 (13.3%) |
| Total | 23,142 (65.1%) | 4,906 (13.8%) |
Employment Occupations by Sex in Camden
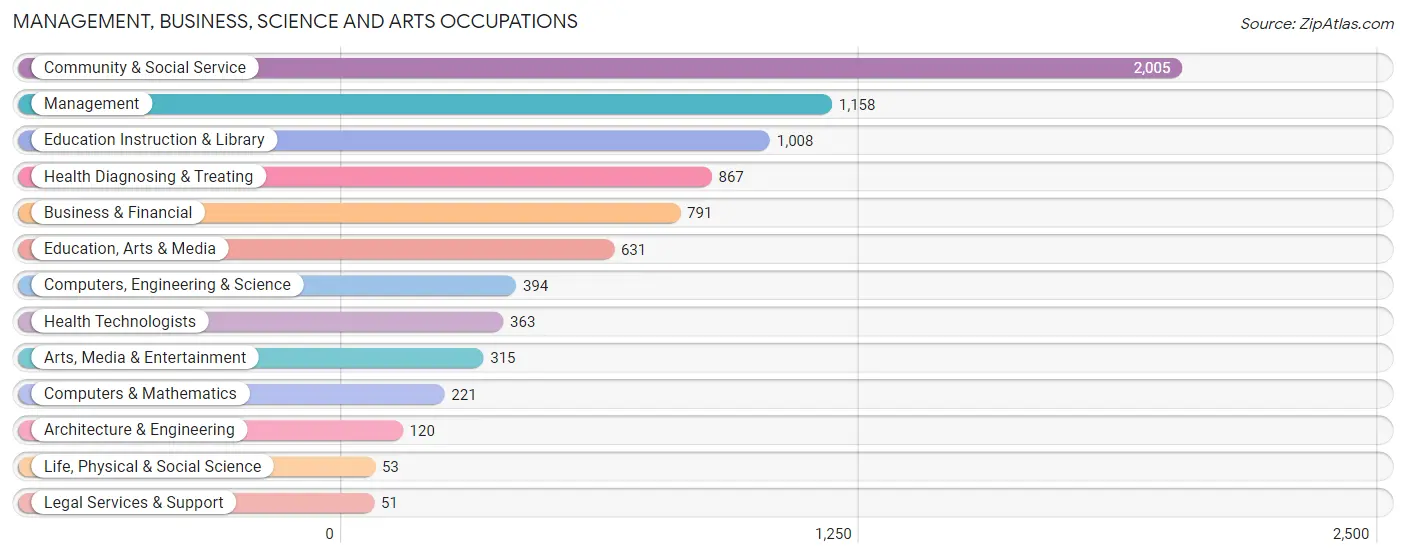
Management, Business, Science and Arts Occupations
The most common Management, Business, Science and Arts occupations in Camden are Community & Social Service (2,005 | 7.7%), Management (1,158 | 4.5%), Education Instruction & Library (1,008 | 3.9%), Health Diagnosing & Treating (867 | 3.3%), and Business & Financial (791 | 3.0%).
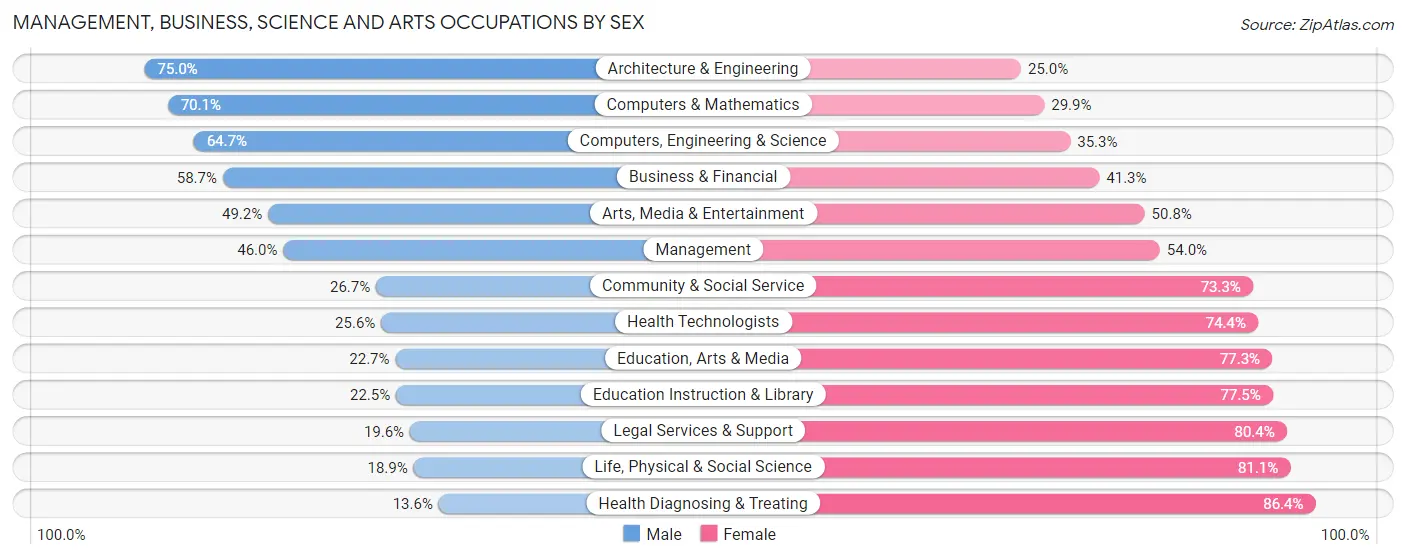
Management, Business, Science and Arts Occupations by Sex
Within the Management, Business, Science and Arts occupations in Camden, the most male-oriented occupations are Architecture & Engineering (75.0%), Computers & Mathematics (70.1%), and Computers, Engineering & Science (64.7%), while the most female-oriented occupations are Health Diagnosing & Treating (86.4%), Life, Physical & Social Science (81.1%), and Legal Services & Support (80.4%).
| Occupation | Male | Female |
| Management | 533 (46.0%) | 625 (54.0%) |
| Business & Financial | 464 (58.7%) | 327 (41.3%) |
| Computers, Engineering & Science | 255 (64.7%) | 139 (35.3%) |
| Computers & Mathematics | 155 (70.1%) | 66 (29.9%) |
| Architecture & Engineering | 90 (75.0%) | 30 (25.0%) |
| Life, Physical & Social Science | 10 (18.9%) | 43 (81.1%) |
| Community & Social Service | 535 (26.7%) | 1,470 (73.3%) |
| Education, Arts & Media | 143 (22.7%) | 488 (77.3%) |
| Legal Services & Support | 10 (19.6%) | 41 (80.4%) |
| Education Instruction & Library | 227 (22.5%) | 781 (77.5%) |
| Arts, Media & Entertainment | 155 (49.2%) | 160 (50.8%) |
| Health Diagnosing & Treating | 118 (13.6%) | 749 (86.4%) |
| Health Technologists | 93 (25.6%) | 270 (74.4%) |
| Total (Category) | 1,905 (36.5%) | 3,310 (63.5%) |
| Total (Overall) | 12,611 (48.6%) | 13,353 (51.4%) |
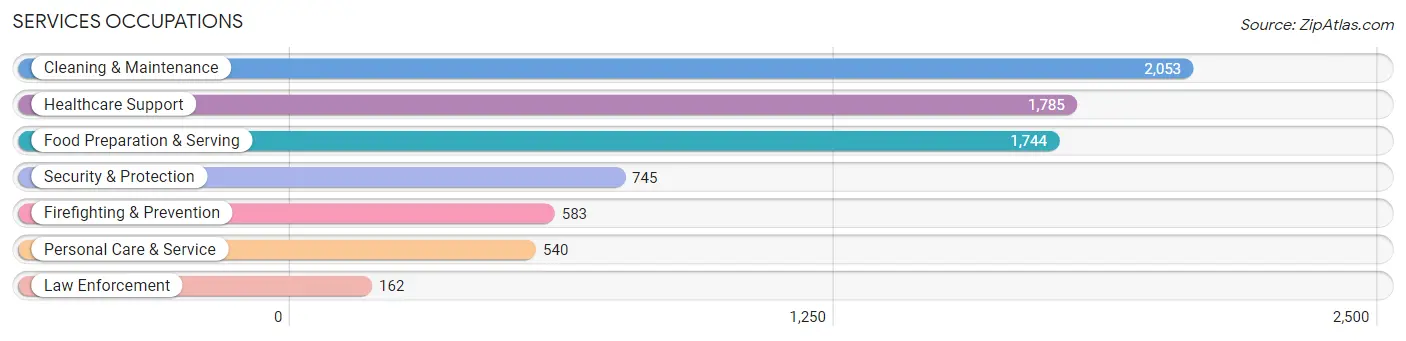
Services Occupations
The most common Services occupations in Camden are Cleaning & Maintenance (2,053 | 7.9%), Healthcare Support (1,785 | 6.9%), Food Preparation & Serving (1,744 | 6.7%), Security & Protection (745 | 2.9%), and Firefighting & Prevention (583 | 2.2%).
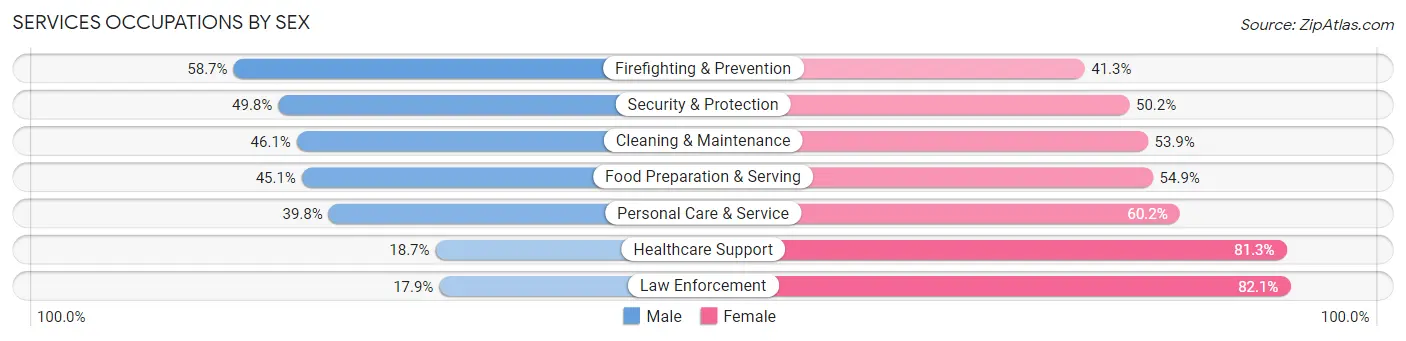
Services Occupations by Sex
Within the Services occupations in Camden, the most male-oriented occupations are Firefighting & Prevention (58.7%), Security & Protection (49.8%), and Cleaning & Maintenance (46.1%), while the most female-oriented occupations are Law Enforcement (82.1%), Healthcare Support (81.3%), and Personal Care & Service (60.2%).
| Occupation | Male | Female |
| Healthcare Support | 333 (18.7%) | 1,452 (81.3%) |
| Security & Protection | 371 (49.8%) | 374 (50.2%) |
| Firefighting & Prevention | 342 (58.7%) | 241 (41.3%) |
| Law Enforcement | 29 (17.9%) | 133 (82.1%) |
| Food Preparation & Serving | 787 (45.1%) | 957 (54.9%) |
| Cleaning & Maintenance | 947 (46.1%) | 1,106 (53.9%) |
| Personal Care & Service | 215 (39.8%) | 325 (60.2%) |
| Total (Category) | 2,653 (38.6%) | 4,214 (61.4%) |
| Total (Overall) | 12,611 (48.6%) | 13,353 (51.4%) |
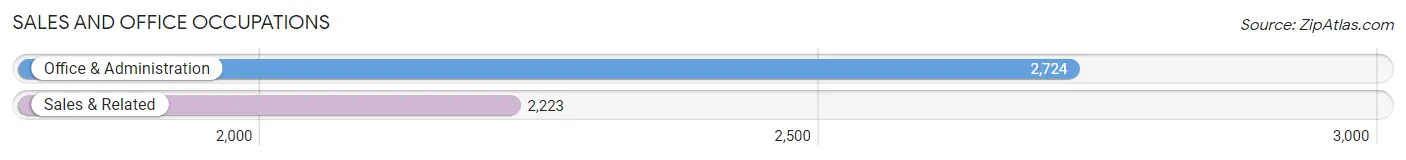
Sales and Office Occupations
The most common Sales and Office occupations in Camden are Office & Administration (2,724 | 10.5%), and Sales & Related (2,223 | 8.6%).
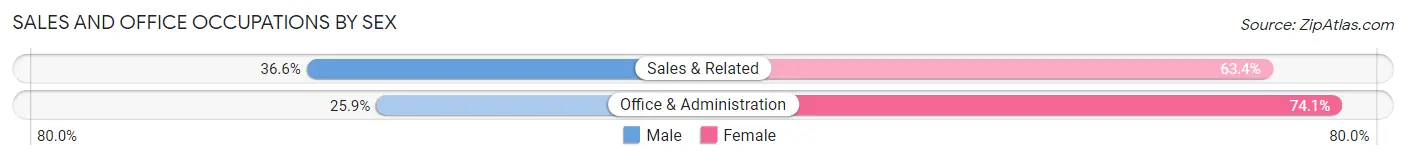
Sales and Office Occupations by Sex
| Occupation | Male | Female |
| Sales & Related | 814 (36.6%) | 1,409 (63.4%) |
| Office & Administration | 706 (25.9%) | 2,018 (74.1%) |
| Total (Category) | 1,520 (30.7%) | 3,427 (69.3%) |
| Total (Overall) | 12,611 (48.6%) | 13,353 (51.4%) |
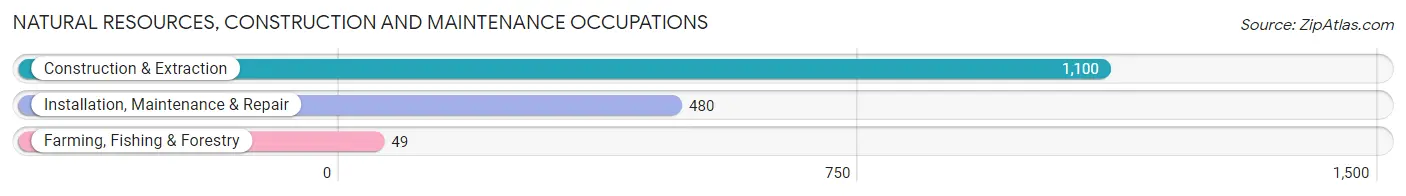
Natural Resources, Construction and Maintenance Occupations
The most common Natural Resources, Construction and Maintenance occupations in Camden are Construction & Extraction (1,100 | 4.2%), Installation, Maintenance & Repair (480 | 1.8%), and Farming, Fishing & Forestry (49 | 0.2%).
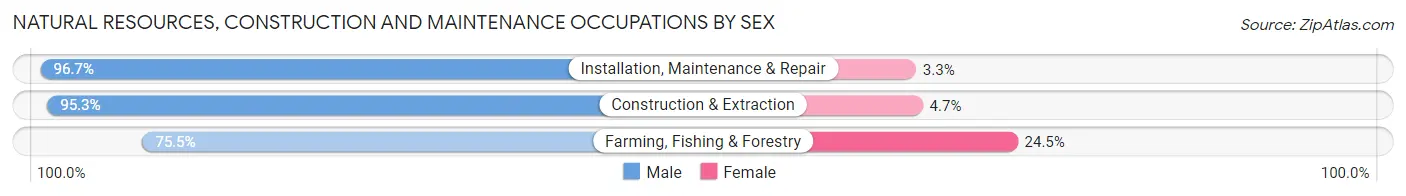
Natural Resources, Construction and Maintenance Occupations by Sex
| Occupation | Male | Female |
| Farming, Fishing & Forestry | 37 (75.5%) | 12 (24.5%) |
| Construction & Extraction | 1,048 (95.3%) | 52 (4.7%) |
| Installation, Maintenance & Repair | 464 (96.7%) | 16 (3.3%) |
| Total (Category) | 1,549 (95.1%) | 80 (4.9%) |
| Total (Overall) | 12,611 (48.6%) | 13,353 (51.4%) |
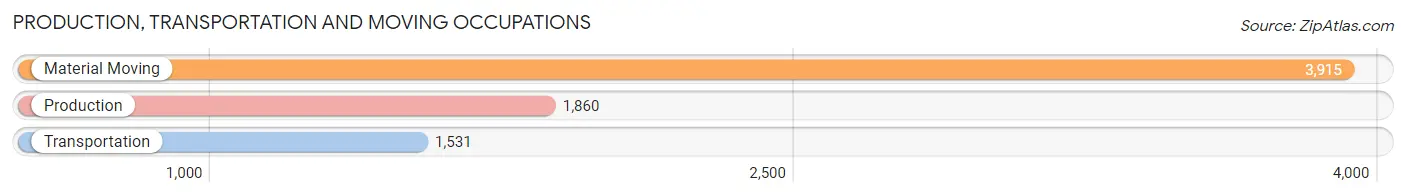
Production, Transportation and Moving Occupations
The most common Production, Transportation and Moving occupations in Camden are Material Moving (3,915 | 15.1%), Production (1,860 | 7.2%), and Transportation (1,531 | 5.9%).
Production, Transportation and Moving Occupations by Sex
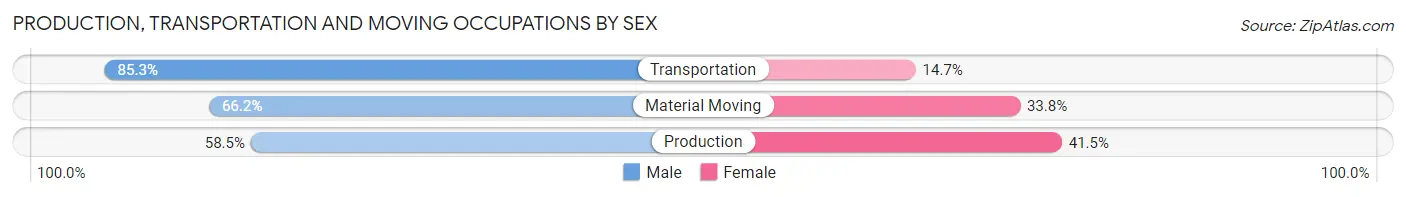
| Occupation | Male | Female |
| Production | 1,088 (58.5%) | 772 (41.5%) |
| Transportation | 1,306 (85.3%) | 225 (14.7%) |
| Material Moving | 2,590 (66.2%) | 1,325 (33.8%) |
| Total (Category) | 4,984 (68.2%) | 2,322 (31.8%) |
| Total (Overall) | 12,611 (48.6%) | 13,353 (51.4%) |
Employment Industries by Sex in Camden
Employment Industries in Camden
The major employment industries in Camden include Health Care & Social Assistance (4,464 | 17.2%), Retail Trade (3,959 | 15.2%), Manufacturing (2,785 | 10.7%), Transportation & Warehousing (2,599 | 10.0%), and Accommodation & Food Services (2,308 | 8.9%).

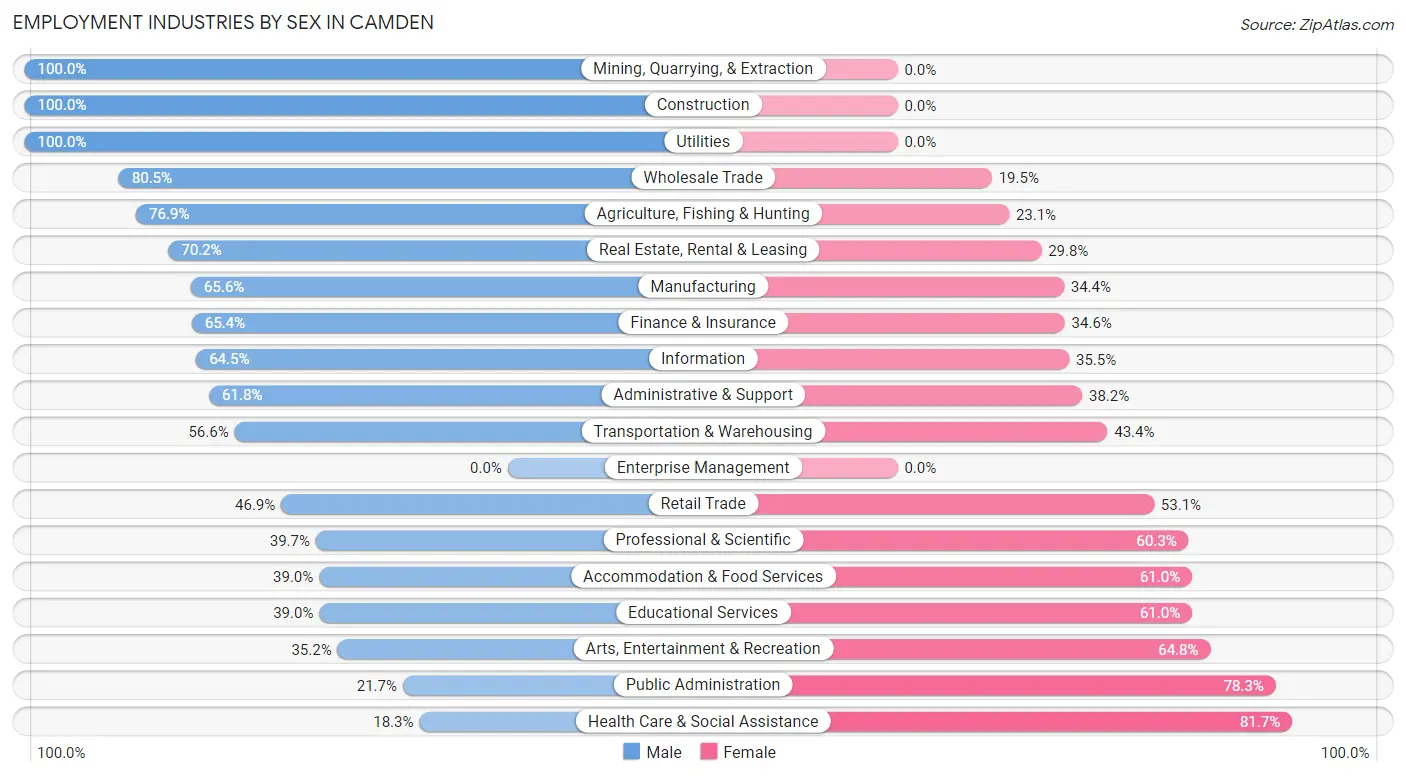
Employment Industries by Sex in Camden
The Camden industries that see more men than women are Mining, Quarrying, & Extraction (100.0%), Construction (100.0%), and Utilities (100.0%), whereas the industries that tend to have a higher number of women are Health Care & Social Assistance (81.7%), Public Administration (78.3%), and Arts, Entertainment & Recreation (64.8%).
| Industry | Male | Female |
| Agriculture, Fishing & Hunting | 40 (76.9%) | 12 (23.1%) |
| Mining, Quarrying, & Extraction | 16 (100.0%) | 0 (0.0%) |
| Construction | 1,225 (100.0%) | 0 (0.0%) |
| Manufacturing | 1,826 (65.6%) | 959 (34.4%) |
| Wholesale Trade | 643 (80.5%) | 156 (19.5%) |
| Retail Trade | 1,857 (46.9%) | 2,102 (53.1%) |
| Transportation & Warehousing | 1,470 (56.6%) | 1,129 (43.4%) |
| Utilities | 40 (100.0%) | 0 (0.0%) |
| Information | 127 (64.5%) | 70 (35.5%) |
| Finance & Insurance | 457 (65.4%) | 242 (34.6%) |
| Real Estate, Rental & Leasing | 262 (70.2%) | 111 (29.8%) |
| Professional & Scientific | 317 (39.7%) | 481 (60.3%) |
| Enterprise Management | 0 (0.0%) | 0 (0.0%) |
| Administrative & Support | 1,038 (61.8%) | 642 (38.2%) |
| Educational Services | 588 (39.0%) | 919 (61.0%) |
| Health Care & Social Assistance | 817 (18.3%) | 3,647 (81.7%) |
| Arts, Entertainment & Recreation | 142 (35.2%) | 261 (64.8%) |
| Accommodation & Food Services | 901 (39.0%) | 1,407 (61.0%) |
| Public Administration | 173 (21.7%) | 624 (78.3%) |
| Total | 12,611 (48.6%) | 13,353 (51.4%) |
Education in Camden
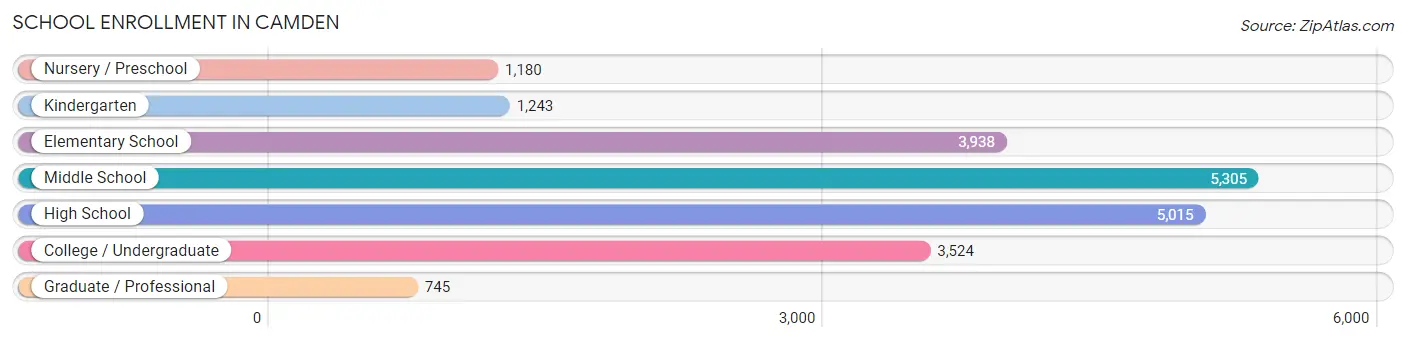
School Enrollment in Camden
The most common levels of schooling among the 20,950 students in Camden are middle school (5,305 | 25.3%), high school (5,015 | 23.9%), and elementary school (3,938 | 18.8%).
| School Level | # Students | % Students |
| Nursery / Preschool | 1,180 | 5.6% |
| Kindergarten | 1,243 | 5.9% |
| Elementary School | 3,938 | 18.8% |
| Middle School | 5,305 | 25.3% |
| High School | 5,015 | 23.9% |
| College / Undergraduate | 3,524 | 16.8% |
| Graduate / Professional | 745 | 3.6% |
| Total | 20,950 | 100.0% |
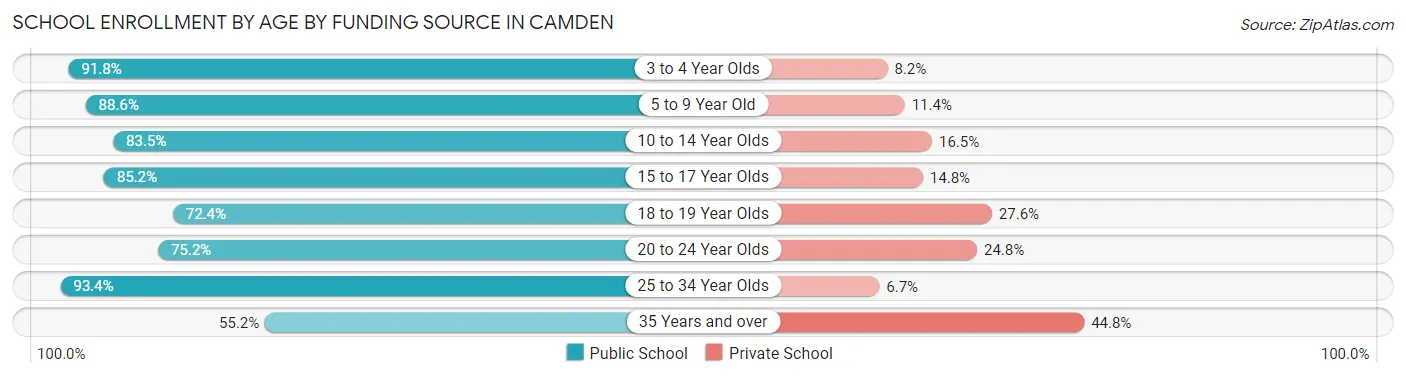
School Enrollment by Age by Funding Source in Camden
Out of a total of 20,950 students who are enrolled in schools in Camden, 3,666 (17.5%) attend a private institution, while the remaining 17,284 (82.5%) are enrolled in public schools. The age group of 35 years and over has the highest likelihood of being enrolled in private schools, with 478 (44.8% in the age bracket) enrolled. Conversely, the age group of 25 to 34 year olds has the lowest likelihood of being enrolled in a private school, with 618 (93.3% in the age bracket) attending a public institution.
| Age Bracket | Public School | Private School |
| 3 to 4 Year Olds | 910 (91.8%) | 81 (8.2%) |
| 5 to 9 Year Old | 4,248 (88.6%) | 545 (11.4%) |
| 10 to 14 Year Olds | 5,346 (83.5%) | 1,054 (16.5%) |
| 15 to 17 Year Olds | 2,761 (85.2%) | 478 (14.8%) |
| 18 to 19 Year Olds | 1,374 (72.4%) | 524 (27.6%) |
| 20 to 24 Year Olds | 1,428 (75.2%) | 472 (24.8%) |
| 25 to 34 Year Olds | 618 (93.3%) | 44 (6.7%) |
| 35 Years and over | 589 (55.2%) | 478 (44.8%) |
| Total | 17,284 (82.5%) | 3,666 (17.5%) |
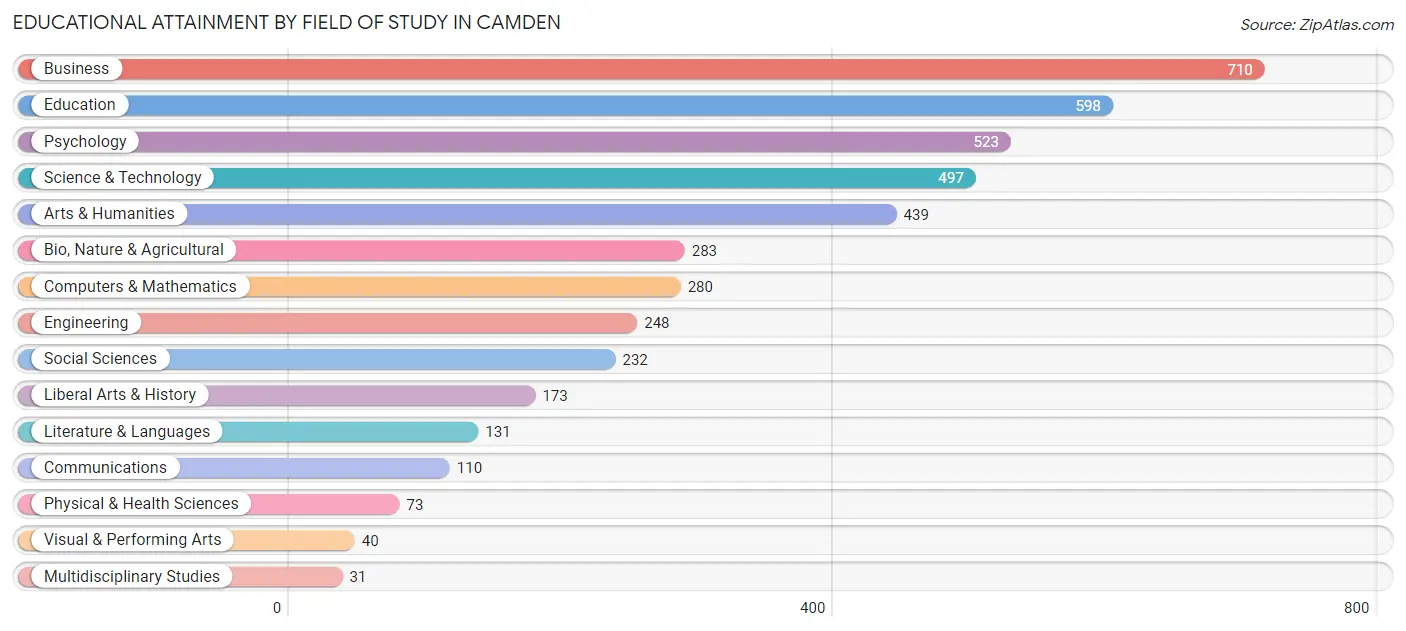
Educational Attainment by Field of Study in Camden
Business (710 | 16.3%), education (598 | 13.7%), psychology (523 | 12.0%), science & technology (497 | 11.4%), and arts & humanities (439 | 10.1%) are the most common fields of study among 4,368 individuals in Camden who have obtained a bachelor's degree or higher.
| Field of Study | # Graduates | % Graduates |
| Computers & Mathematics | 280 | 6.4% |
| Bio, Nature & Agricultural | 283 | 6.5% |
| Physical & Health Sciences | 73 | 1.7% |
| Psychology | 523 | 12.0% |
| Social Sciences | 232 | 5.3% |
| Engineering | 248 | 5.7% |
| Multidisciplinary Studies | 31 | 0.7% |
| Science & Technology | 497 | 11.4% |
| Business | 710 | 16.3% |
| Education | 598 | 13.7% |
| Literature & Languages | 131 | 3.0% |
| Liberal Arts & History | 173 | 4.0% |
| Visual & Performing Arts | 40 | 0.9% |
| Communications | 110 | 2.5% |
| Arts & Humanities | 439 | 10.1% |
| Total | 4,368 | 100.0% |
Transportation & Commute in Camden
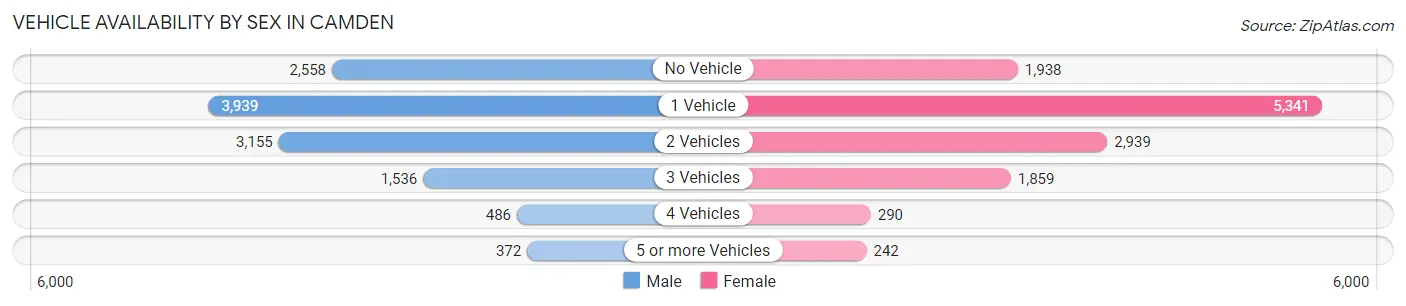
Vehicle Availability by Sex in Camden
The most prevalent vehicle ownership categories in Camden are males with 1 vehicle (3,939, accounting for 32.7%) and females with 1 vehicle (5,341, making up 31.2%).
| Vehicles Available | Male | Female |
| No Vehicle | 2,558 (21.2%) | 1,938 (15.4%) |
| 1 Vehicle | 3,939 (32.7%) | 5,341 (42.4%) |
| 2 Vehicles | 3,155 (26.2%) | 2,939 (23.3%) |
| 3 Vehicles | 1,536 (12.8%) | 1,859 (14.7%) |
| 4 Vehicles | 486 (4.0%) | 290 (2.3%) |
| 5 or more Vehicles | 372 (3.1%) | 242 (1.9%) |
| Total | 12,046 (100.0%) | 12,609 (100.0%) |
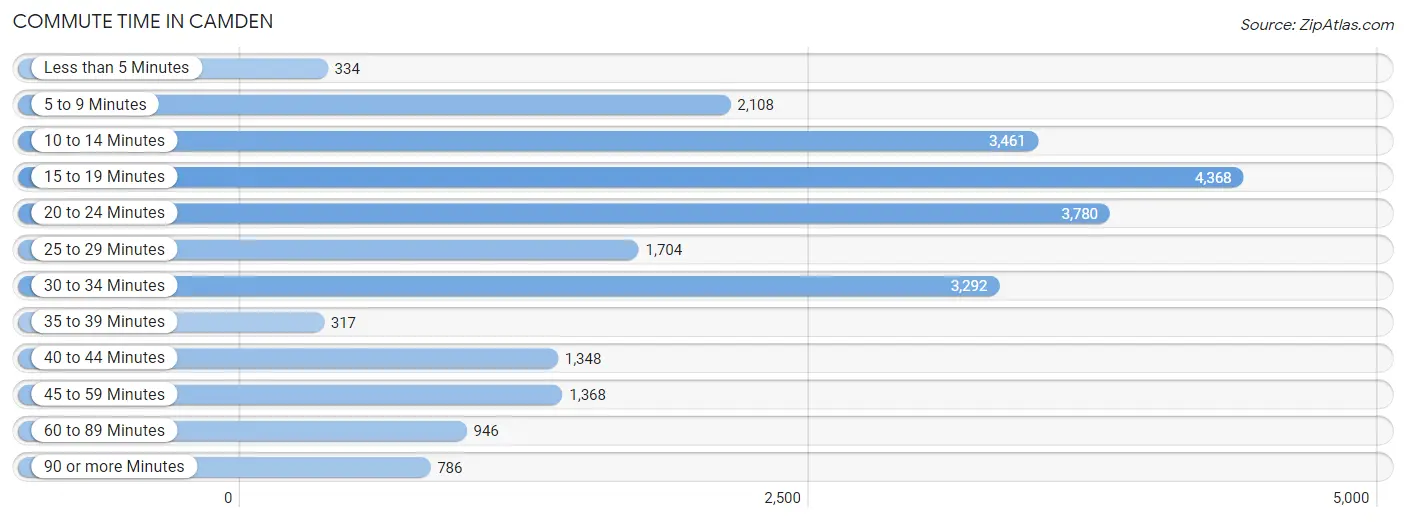
Commute Time in Camden
The most frequently occuring commute durations in Camden are 15 to 19 minutes (4,368 commuters, 18.3%), 20 to 24 minutes (3,780 commuters, 15.9%), and 10 to 14 minutes (3,461 commuters, 14.5%).
| Commute Time | # Commuters | % Commuters |
| Less than 5 Minutes | 334 | 1.4% |
| 5 to 9 Minutes | 2,108 | 8.8% |
| 10 to 14 Minutes | 3,461 | 14.5% |
| 15 to 19 Minutes | 4,368 | 18.3% |
| 20 to 24 Minutes | 3,780 | 15.9% |
| 25 to 29 Minutes | 1,704 | 7.2% |
| 30 to 34 Minutes | 3,292 | 13.8% |
| 35 to 39 Minutes | 317 | 1.3% |
| 40 to 44 Minutes | 1,348 | 5.7% |
| 45 to 59 Minutes | 1,368 | 5.8% |
| 60 to 89 Minutes | 946 | 4.0% |
| 90 or more Minutes | 786 | 3.3% |
Commute Time by Sex in Camden
The most common commute times in Camden are 30 to 34 minutes (1,911 commuters, 16.3%) for males and 15 to 19 minutes (2,463 commuters, 20.3%) for females.
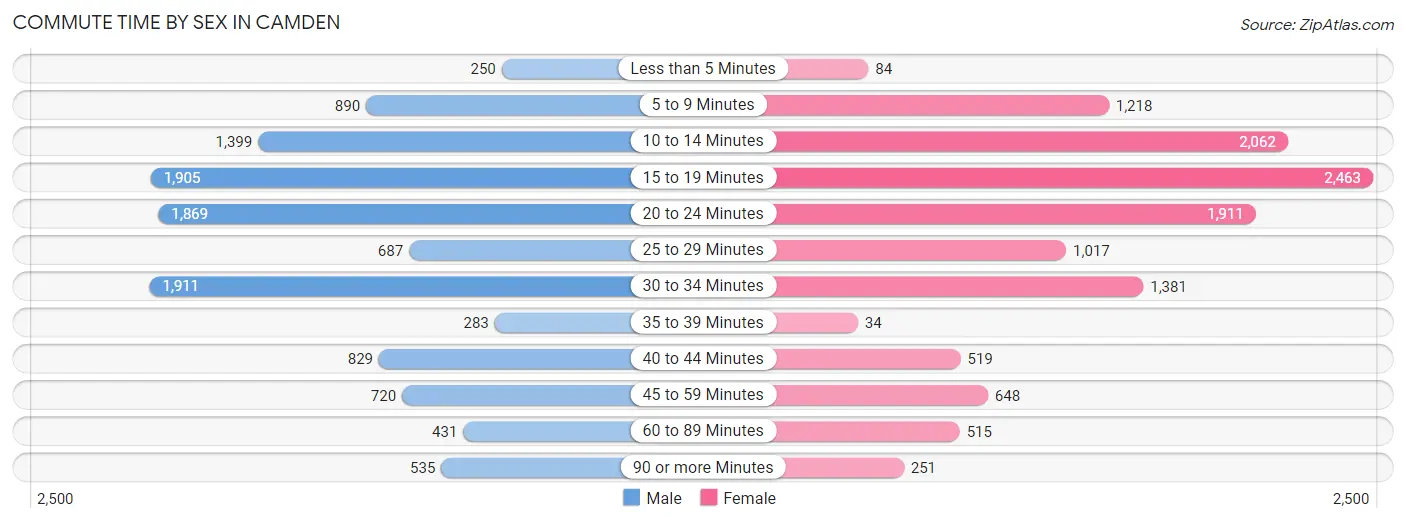
| Commute Time | Male | Female |
| Less than 5 Minutes | 250 (2.1%) | 84 (0.7%) |
| 5 to 9 Minutes | 890 (7.6%) | 1,218 (10.1%) |
| 10 to 14 Minutes | 1,399 (11.9%) | 2,062 (17.0%) |
| 15 to 19 Minutes | 1,905 (16.3%) | 2,463 (20.3%) |
| 20 to 24 Minutes | 1,869 (16.0%) | 1,911 (15.8%) |
| 25 to 29 Minutes | 687 (5.9%) | 1,017 (8.4%) |
| 30 to 34 Minutes | 1,911 (16.3%) | 1,381 (11.4%) |
| 35 to 39 Minutes | 283 (2.4%) | 34 (0.3%) |
| 40 to 44 Minutes | 829 (7.1%) | 519 (4.3%) |
| 45 to 59 Minutes | 720 (6.1%) | 648 (5.3%) |
| 60 to 89 Minutes | 431 (3.7%) | 515 (4.3%) |
| 90 or more Minutes | 535 (4.6%) | 251 (2.1%) |
Time of Departure to Work by Sex in Camden
The most frequent times of departure to work in Camden are 6:00 AM to 6:29 AM (1,715, 14.6%) for males and 8:00 AM to 8:29 AM (1,865, 15.4%) for females.
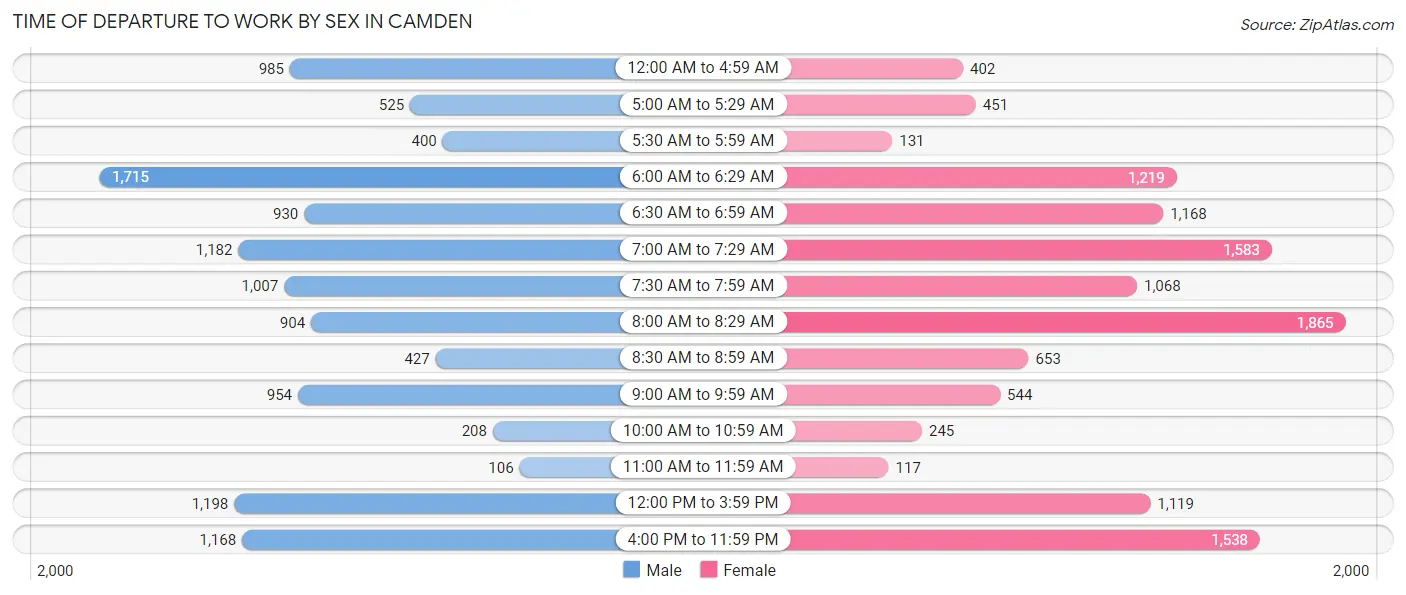
| Time of Departure | Male | Female |
| 12:00 AM to 4:59 AM | 985 (8.4%) | 402 (3.3%) |
| 5:00 AM to 5:29 AM | 525 (4.5%) | 451 (3.7%) |
| 5:30 AM to 5:59 AM | 400 (3.4%) | 131 (1.1%) |
| 6:00 AM to 6:29 AM | 1,715 (14.6%) | 1,219 (10.1%) |
| 6:30 AM to 6:59 AM | 930 (7.9%) | 1,168 (9.7%) |
| 7:00 AM to 7:29 AM | 1,182 (10.1%) | 1,583 (13.1%) |
| 7:30 AM to 7:59 AM | 1,007 (8.6%) | 1,068 (8.8%) |
| 8:00 AM to 8:29 AM | 904 (7.7%) | 1,865 (15.4%) |
| 8:30 AM to 8:59 AM | 427 (3.6%) | 653 (5.4%) |
| 9:00 AM to 9:59 AM | 954 (8.2%) | 544 (4.5%) |
| 10:00 AM to 10:59 AM | 208 (1.8%) | 245 (2.0%) |
| 11:00 AM to 11:59 AM | 106 (0.9%) | 117 (1.0%) |
| 12:00 PM to 3:59 PM | 1,198 (10.2%) | 1,119 (9.2%) |
| 4:00 PM to 11:59 PM | 1,168 (10.0%) | 1,538 (12.7%) |
| Total | 11,709 (100.0%) | 12,103 (100.0%) |
Housing Occupancy in Camden
Occupancy by Ownership in Camden
Of the total 24,372 dwellings in Camden, owner-occupied units account for 9,075 (37.2%), while renter-occupied units make up 15,297 (62.8%).
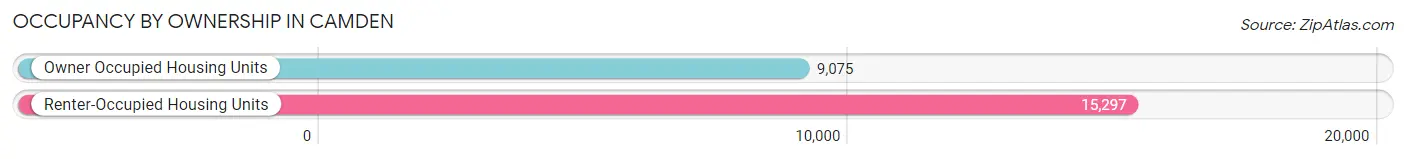
| Occupancy | # Housing Units | % Housing Units |
| Owner Occupied Housing Units | 9,075 | 37.2% |
| Renter-Occupied Housing Units | 15,297 | 62.8% |
| Total Occupied Housing Units | 24,372 | 100.0% |
Occupancy by Household Size in Camden
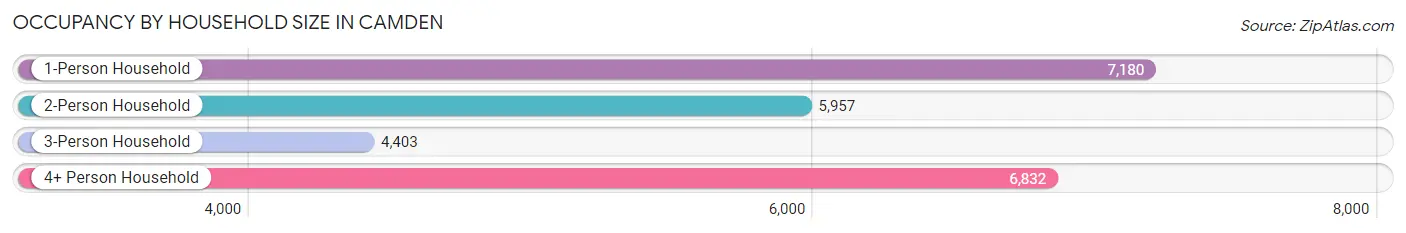
| Household Size | # Housing Units | % Housing Units |
| 1-Person Household | 7,180 | 29.5% |
| 2-Person Household | 5,957 | 24.4% |
| 3-Person Household | 4,403 | 18.1% |
| 4+ Person Household | 6,832 | 28.0% |
| Total Housing Units | 24,372 | 100.0% |
Occupancy by Ownership by Household Size in Camden
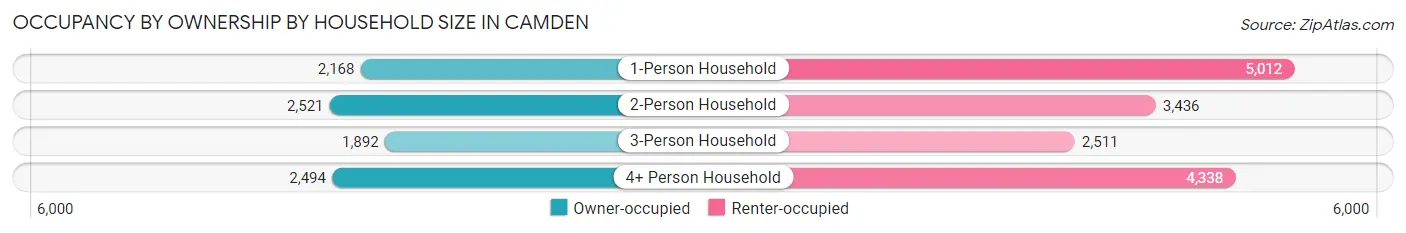
| Household Size | Owner-occupied | Renter-occupied |
| 1-Person Household | 2,168 (30.2%) | 5,012 (69.8%) |
| 2-Person Household | 2,521 (42.3%) | 3,436 (57.7%) |
| 3-Person Household | 1,892 (43.0%) | 2,511 (57.0%) |
| 4+ Person Household | 2,494 (36.5%) | 4,338 (63.5%) |
| Total Housing Units | 9,075 (37.2%) | 15,297 (62.8%) |
Occupancy by Educational Attainment in Camden
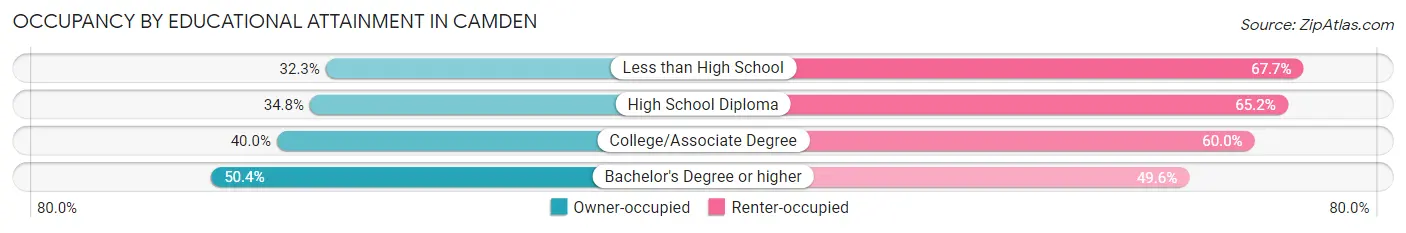
| Household Size | Owner-occupied | Renter-occupied |
| Less than High School | 2,035 (32.3%) | 4,273 (67.7%) |
| High School Diploma | 3,015 (34.8%) | 5,657 (65.2%) |
| College/Associate Degree | 2,727 (40.0%) | 4,089 (60.0%) |
| Bachelor's Degree or higher | 1,298 (50.4%) | 1,278 (49.6%) |
Occupancy by Age of Householder in Camden
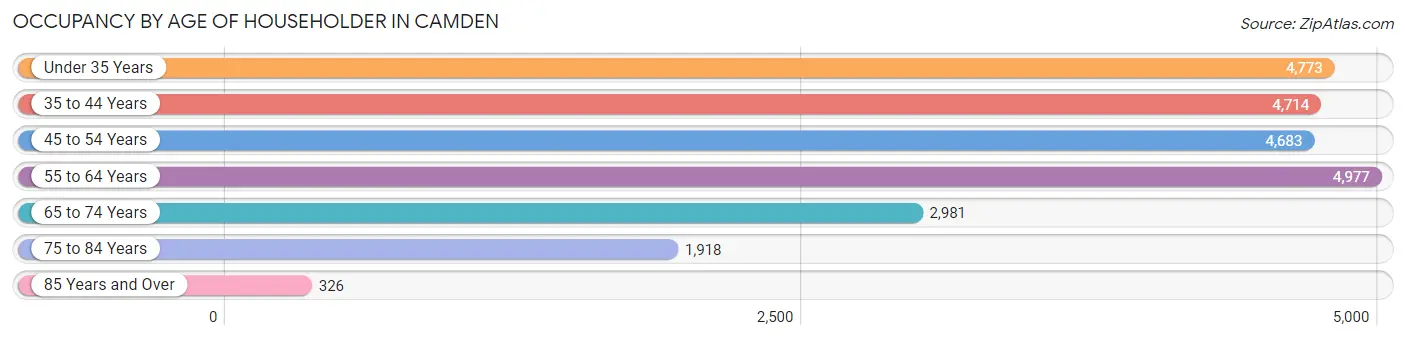
| Age Bracket | # Households | % Households |
| Under 35 Years | 4,773 | 19.6% |
| 35 to 44 Years | 4,714 | 19.3% |
| 45 to 54 Years | 4,683 | 19.2% |
| 55 to 64 Years | 4,977 | 20.4% |
| 65 to 74 Years | 2,981 | 12.2% |
| 75 to 84 Years | 1,918 | 7.9% |
| 85 Years and Over | 326 | 1.3% |
| Total | 24,372 | 100.0% |
Housing Finances in Camden
Median Income by Occupancy in Camden
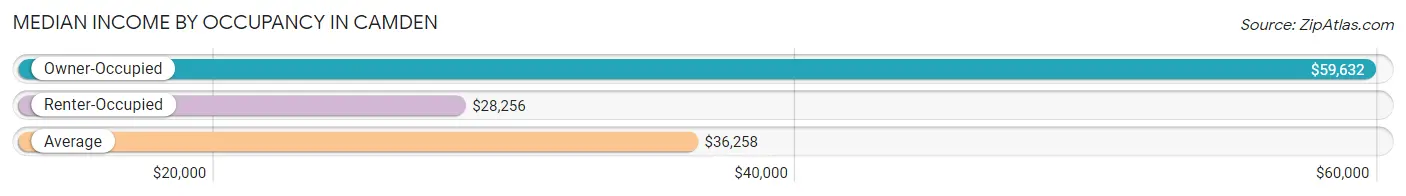
| Occupancy Type | # Households | Median Income |
| Owner-Occupied | 9,075 (37.2%) | $59,632 |
| Renter-Occupied | 15,297 (62.8%) | $28,256 |
| Average | 24,372 (100.0%) | $36,258 |
Occupancy by Householder Income Bracket in Camden
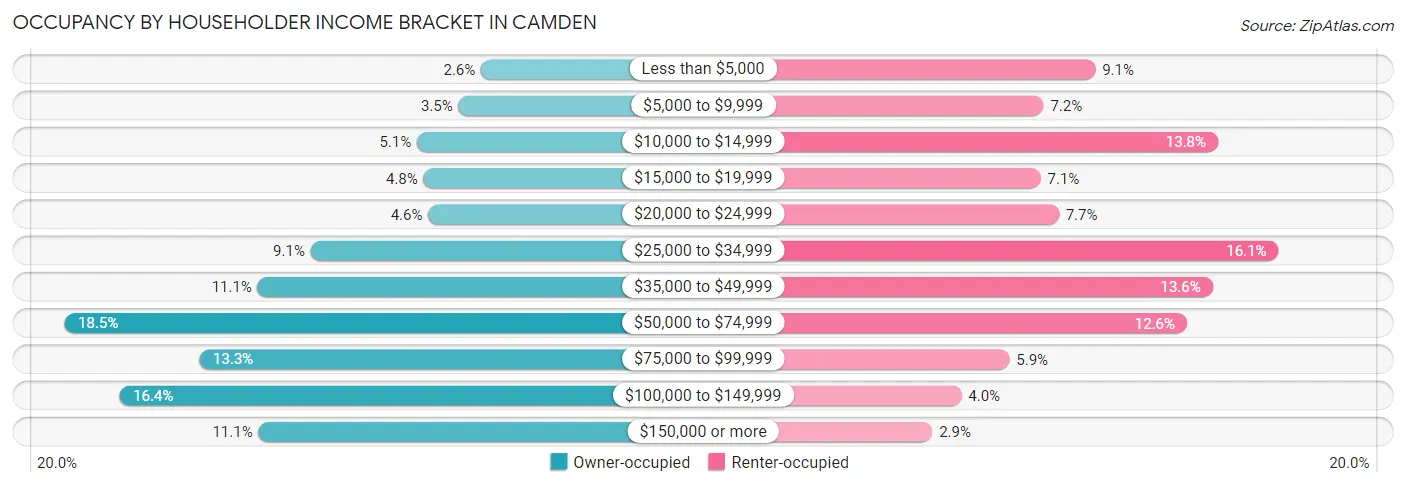
| Income Bracket | Owner-occupied | Renter-occupied |
| Less than $5,000 | 237 (2.6%) | 1,396 (9.1%) |
| $5,000 to $9,999 | 315 (3.5%) | 1,096 (7.2%) |
| $10,000 to $14,999 | 458 (5.1%) | 2,111 (13.8%) |
| $15,000 to $19,999 | 436 (4.8%) | 1,078 (7.0%) |
| $20,000 to $24,999 | 419 (4.6%) | 1,184 (7.7%) |
| $25,000 to $34,999 | 826 (9.1%) | 2,464 (16.1%) |
| $35,000 to $49,999 | 1,009 (11.1%) | 2,080 (13.6%) |
| $50,000 to $74,999 | 1,675 (18.5%) | 1,930 (12.6%) |
| $75,000 to $99,999 | 1,209 (13.3%) | 896 (5.9%) |
| $100,000 to $149,999 | 1,485 (16.4%) | 616 (4.0%) |
| $150,000 or more | 1,006 (11.1%) | 446 (2.9%) |
| Total | 9,075 (100.0%) | 15,297 (100.0%) |
Monthly Housing Cost Tiers in Camden
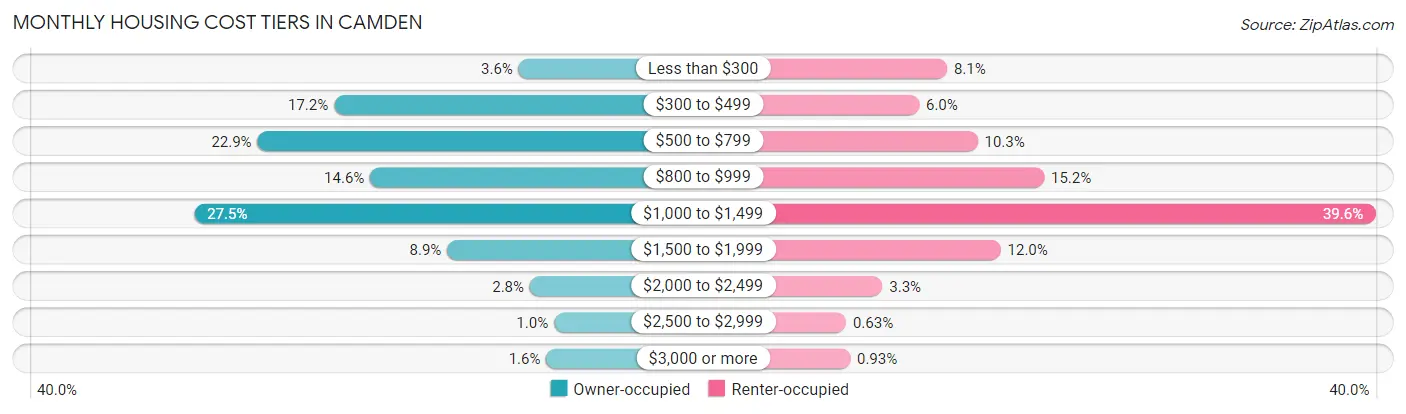
| Monthly Cost | Owner-occupied | Renter-occupied |
| Less than $300 | 328 (3.6%) | 1,235 (8.1%) |
| $300 to $499 | 1,562 (17.2%) | 920 (6.0%) |
| $500 to $799 | 2,074 (22.9%) | 1,578 (10.3%) |
| $800 to $999 | 1,320 (14.5%) | 2,328 (15.2%) |
| $1,000 to $1,499 | 2,497 (27.5%) | 6,056 (39.6%) |
| $1,500 to $1,999 | 806 (8.9%) | 1,839 (12.0%) |
| $2,000 to $2,499 | 253 (2.8%) | 507 (3.3%) |
| $2,500 to $2,999 | 92 (1.0%) | 97 (0.6%) |
| $3,000 or more | 143 (1.6%) | 142 (0.9%) |
| Total | 9,075 (100.0%) | 15,297 (100.0%) |
Physical Housing Characteristics in Camden
Housing Structures in Camden
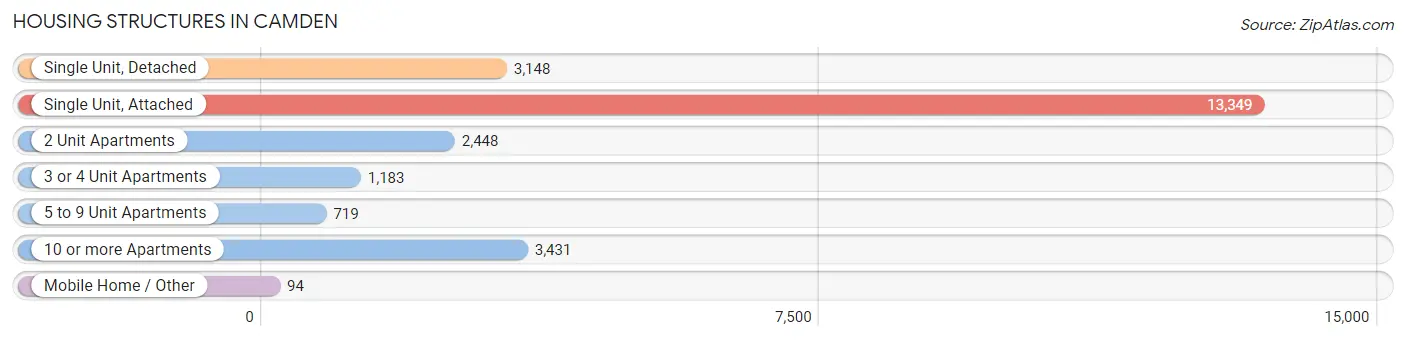
| Structure Type | # Housing Units | % Housing Units |
| Single Unit, Detached | 3,148 | 12.9% |
| Single Unit, Attached | 13,349 | 54.8% |
| 2 Unit Apartments | 2,448 | 10.0% |
| 3 or 4 Unit Apartments | 1,183 | 4.9% |
| 5 to 9 Unit Apartments | 719 | 2.9% |
| 10 or more Apartments | 3,431 | 14.1% |
| Mobile Home / Other | 94 | 0.4% |
| Total | 24,372 | 100.0% |
Housing Structures by Occupancy in Camden
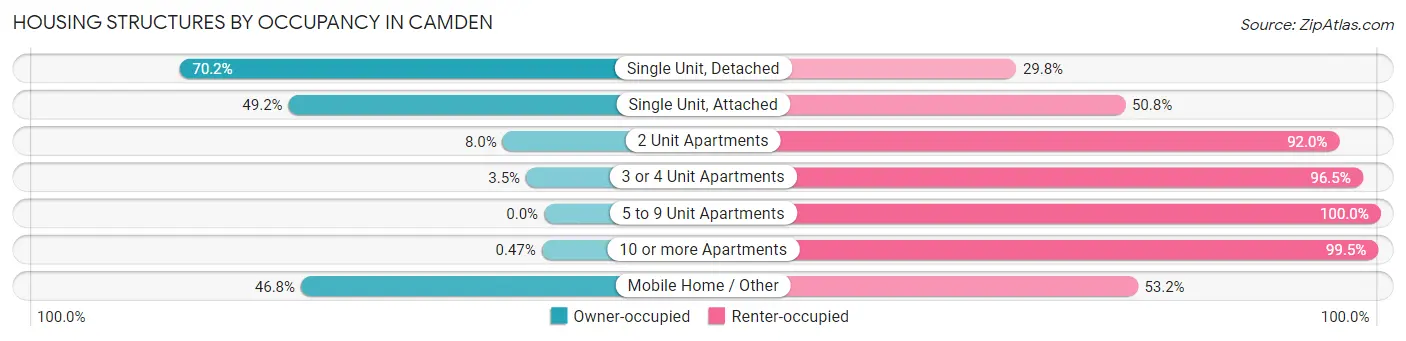
| Structure Type | Owner-occupied | Renter-occupied |
| Single Unit, Detached | 2,210 (70.2%) | 938 (29.8%) |
| Single Unit, Attached | 6,569 (49.2%) | 6,780 (50.8%) |
| 2 Unit Apartments | 195 (8.0%) | 2,253 (92.0%) |
| 3 or 4 Unit Apartments | 41 (3.5%) | 1,142 (96.5%) |
| 5 to 9 Unit Apartments | 0 (0.0%) | 719 (100.0%) |
| 10 or more Apartments | 16 (0.5%) | 3,415 (99.5%) |
| Mobile Home / Other | 44 (46.8%) | 50 (53.2%) |
| Total | 9,075 (37.2%) | 15,297 (62.8%) |
Housing Structures by Number of Rooms in Camden
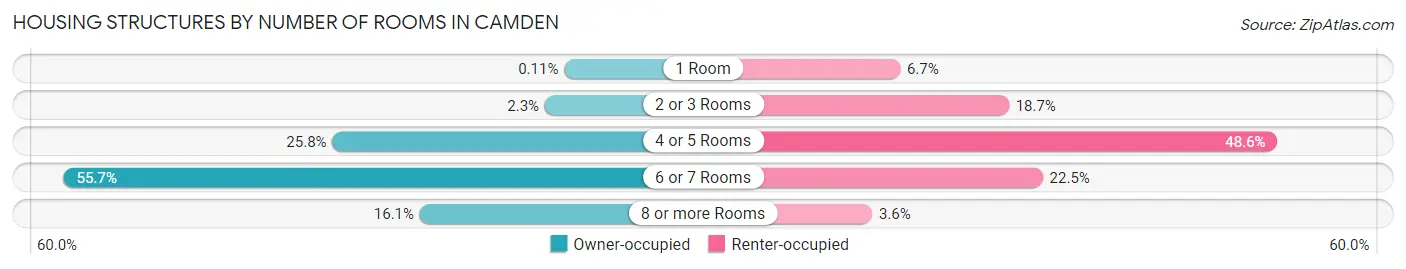
| Number of Rooms | Owner-occupied | Renter-occupied |
| 1 Room | 10 (0.1%) | 1,019 (6.7%) |
| 2 or 3 Rooms | 204 (2.2%) | 2,865 (18.7%) |
| 4 or 5 Rooms | 2,345 (25.8%) | 7,427 (48.5%) |
| 6 or 7 Rooms | 5,052 (55.7%) | 3,442 (22.5%) |
| 8 or more Rooms | 1,464 (16.1%) | 544 (3.6%) |
| Total | 9,075 (100.0%) | 15,297 (100.0%) |
Housing Structure by Heating Type in Camden
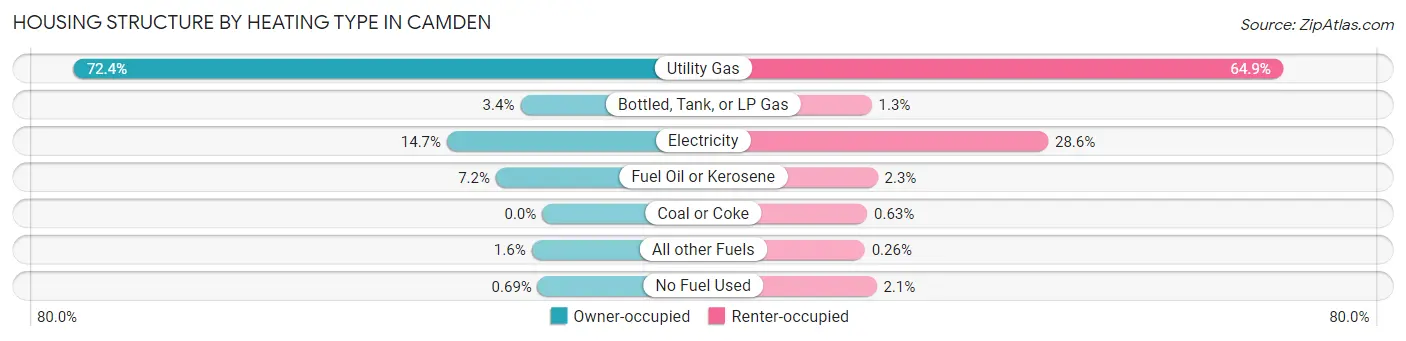
| Heating Type | Owner-occupied | Renter-occupied |
| Utility Gas | 6,570 (72.4%) | 9,921 (64.9%) |
| Bottled, Tank, or LP Gas | 307 (3.4%) | 202 (1.3%) |
| Electricity | 1,336 (14.7%) | 4,375 (28.6%) |
| Fuel Oil or Kerosene | 650 (7.2%) | 344 (2.2%) |
| Coal or Coke | 0 (0.0%) | 97 (0.6%) |
| All other Fuels | 149 (1.6%) | 40 (0.3%) |
| No Fuel Used | 63 (0.7%) | 318 (2.1%) |
| Total | 9,075 (100.0%) | 15,297 (100.0%) |
Household Vehicle Usage in Camden
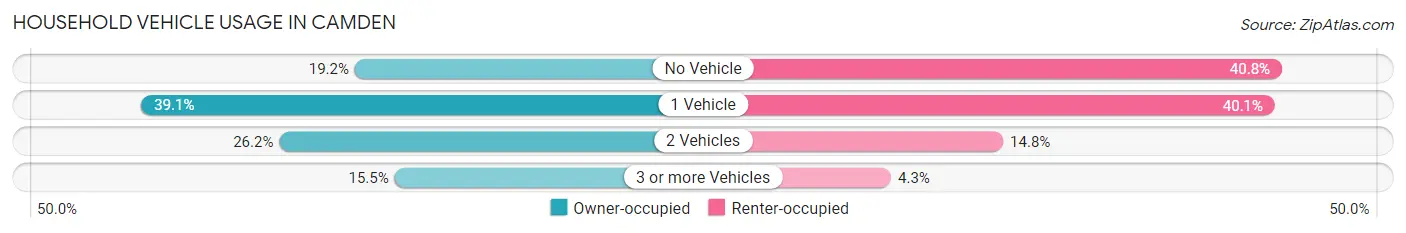
| Vehicles per Household | Owner-occupied | Renter-occupied |
| No Vehicle | 1,741 (19.2%) | 6,239 (40.8%) |
| 1 Vehicle | 3,550 (39.1%) | 6,139 (40.1%) |
| 2 Vehicles | 2,380 (26.2%) | 2,260 (14.8%) |
| 3 or more Vehicles | 1,404 (15.5%) | 659 (4.3%) |
| Total | 9,075 (100.0%) | 15,297 (100.0%) |
Real Estate & Mortgages in Camden
Real Estate and Mortgage Overview in Camden
| Characteristic | Without Mortgage | With Mortgage |
| Housing Units | 4,082 | 4,993 |
| Median Property Value | $89,500 | $102,900 |
| Median Household Income | $55,560 | $655 |
| Monthly Housing Costs | $529 | $143 |
| Real Estate Taxes | $1,986 | $193 |
Property Value by Mortgage Status in Camden
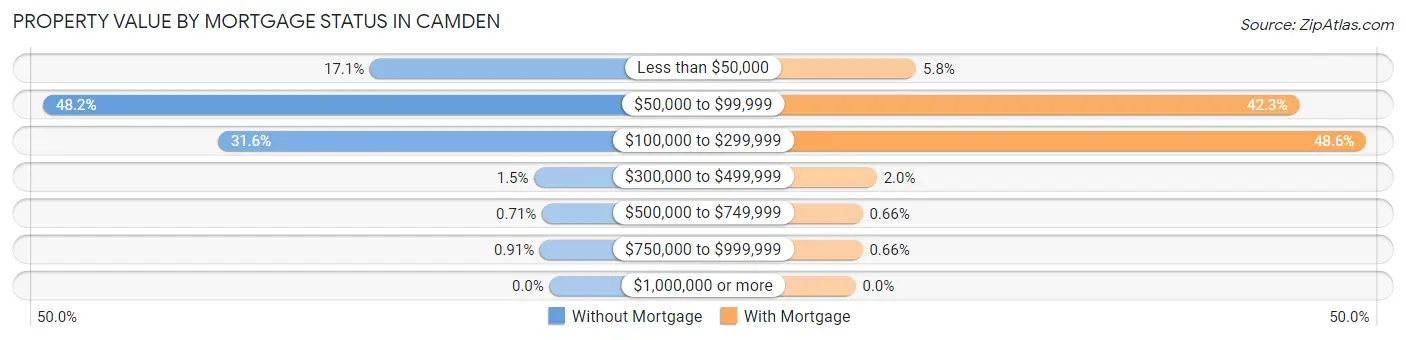
| Property Value | Without Mortgage | With Mortgage |
| Less than $50,000 | 698 (17.1%) | 288 (5.8%) |
| $50,000 to $99,999 | 1,969 (48.2%) | 2,110 (42.3%) |
| $100,000 to $299,999 | 1,290 (31.6%) | 2,428 (48.6%) |
| $300,000 to $499,999 | 59 (1.5%) | 101 (2.0%) |
| $500,000 to $749,999 | 29 (0.7%) | 33 (0.7%) |
| $750,000 to $999,999 | 37 (0.9%) | 33 (0.7%) |
| $1,000,000 or more | 0 (0.0%) | 0 (0.0%) |
| Total | 4,082 (100.0%) | 4,993 (100.0%) |
Household Income by Mortgage Status in Camden
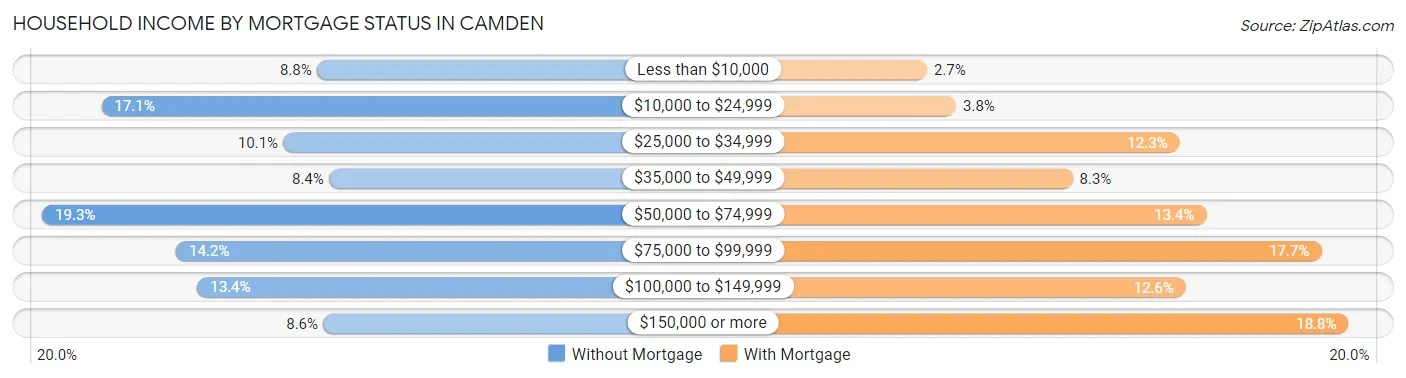
| Household Income | Without Mortgage | With Mortgage |
| Less than $10,000 | 361 (8.8%) | 136 (2.7%) |
| $10,000 to $24,999 | 697 (17.1%) | 191 (3.8%) |
| $25,000 to $34,999 | 413 (10.1%) | 616 (12.3%) |
| $35,000 to $49,999 | 342 (8.4%) | 413 (8.3%) |
| $50,000 to $74,999 | 789 (19.3%) | 667 (13.4%) |
| $75,000 to $99,999 | 581 (14.2%) | 886 (17.7%) |
| $100,000 to $149,999 | 548 (13.4%) | 628 (12.6%) |
| $150,000 or more | 351 (8.6%) | 937 (18.8%) |
| Total | 4,082 (100.0%) | 4,993 (100.0%) |
Property Value to Household Income Ratio in Camden
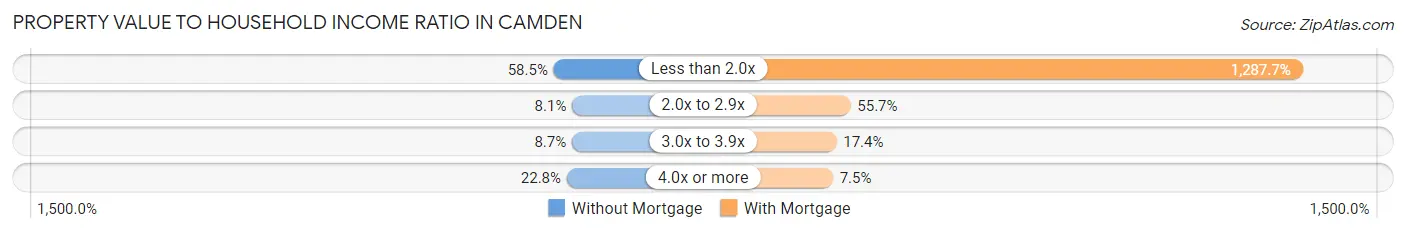
| Value-to-Income Ratio | Without Mortgage | With Mortgage |
| Less than 2.0x | 2,389 (58.5%) | 64,294 (1,287.7%) |
| 2.0x to 2.9x | 332 (8.1%) | 2,782 (55.7%) |
| 3.0x to 3.9x | 353 (8.6%) | 869 (17.4%) |
| 4.0x or more | 932 (22.8%) | 376 (7.5%) |
| Total | 4,082 (100.0%) | 4,993 (100.0%) |
Real Estate Taxes by Mortgage Status in Camden
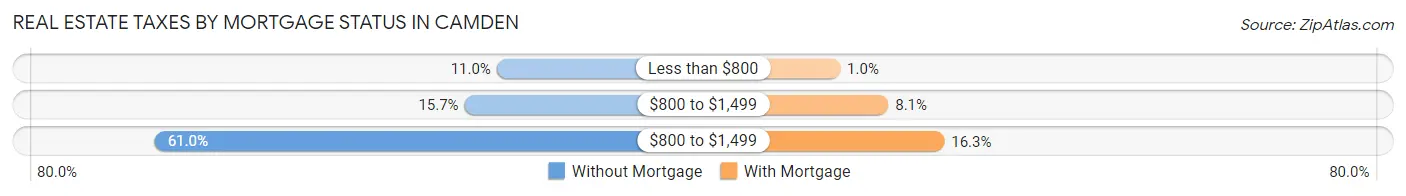
| Property Taxes | Without Mortgage | With Mortgage |
| Less than $800 | 450 (11.0%) | 52 (1.0%) |
| $800 to $1,499 | 642 (15.7%) | 403 (8.1%) |
| $800 to $1,499 | 2,489 (61.0%) | 812 (16.3%) |
| Total | 4,082 (100.0%) | 4,993 (100.0%) |
Health & Disability in Camden
Health Insurance Coverage by Age in Camden
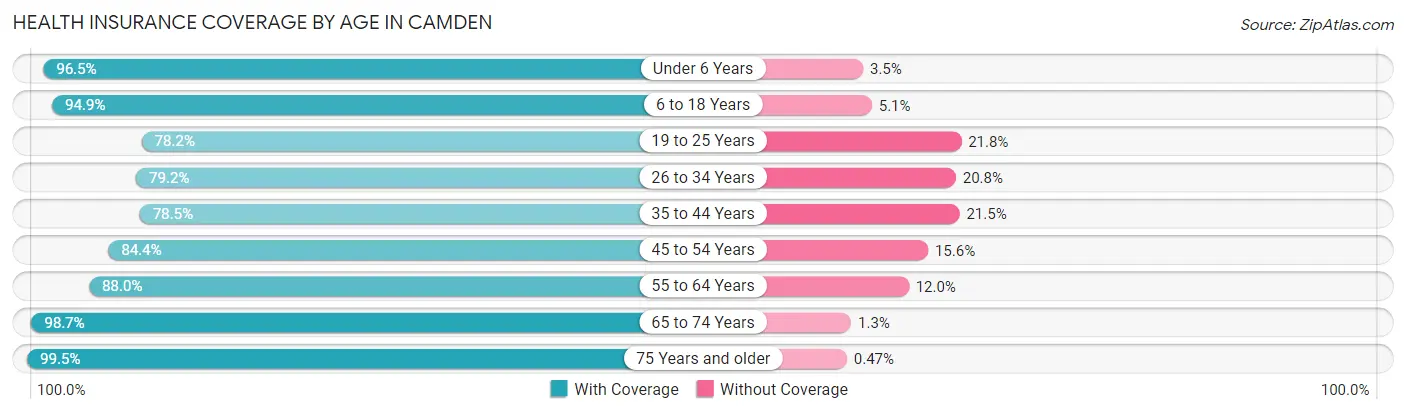
| Age Bracket | With Coverage | Without Coverage |
| Under 6 Years | 5,868 (96.5%) | 213 (3.5%) |
| 6 to 18 Years | 14,795 (94.9%) | 800 (5.1%) |
| 19 to 25 Years | 6,128 (78.2%) | 1,708 (21.8%) |
| 26 to 34 Years | 6,878 (79.2%) | 1,806 (20.8%) |
| 35 to 44 Years | 6,936 (78.5%) | 1,897 (21.5%) |
| 45 to 54 Years | 6,979 (84.4%) | 1,291 (15.6%) |
| 55 to 64 Years | 6,665 (88.0%) | 910 (12.0%) |
| 65 to 74 Years | 4,104 (98.7%) | 53 (1.3%) |
| 75 Years and older | 3,158 (99.5%) | 15 (0.5%) |
| Total | 61,511 (87.6%) | 8,693 (12.4%) |
Health Insurance Coverage by Citizenship Status in Camden
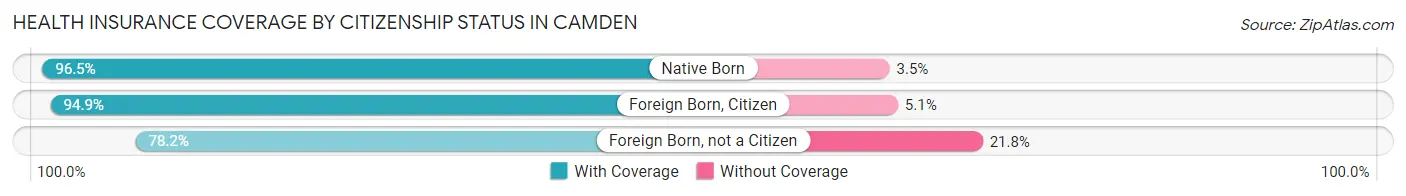
| Citizenship Status | With Coverage | Without Coverage |
| Native Born | 5,868 (96.5%) | 213 (3.5%) |
| Foreign Born, Citizen | 14,795 (94.9%) | 800 (5.1%) |
| Foreign Born, not a Citizen | 6,128 (78.2%) | 1,708 (21.8%) |
Health Insurance Coverage by Household Income in Camden
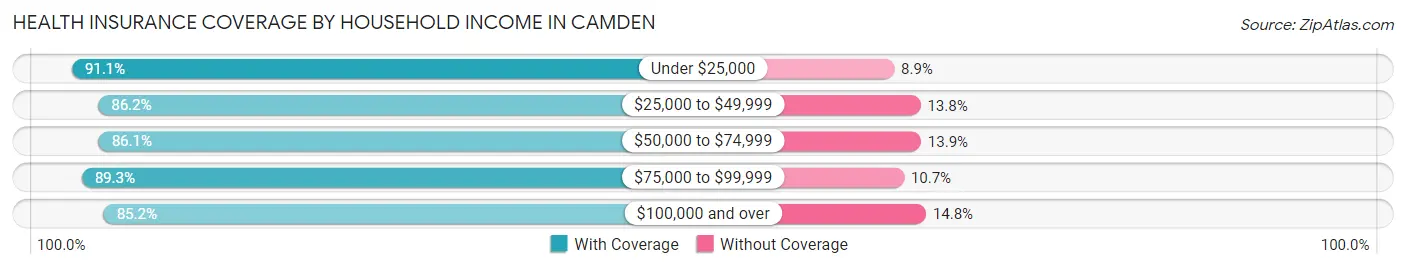
| Household Income | With Coverage | Without Coverage |
| Under $25,000 | 16,549 (91.1%) | 1,608 (8.9%) |
| $25,000 to $49,999 | 16,066 (86.2%) | 2,575 (13.8%) |
| $50,000 to $74,999 | 9,148 (86.1%) | 1,476 (13.9%) |
| $75,000 to $99,999 | 6,854 (89.3%) | 822 (10.7%) |
| $100,000 and over | 12,022 (85.2%) | 2,094 (14.8%) |
Public vs Private Health Insurance Coverage by Age in Camden
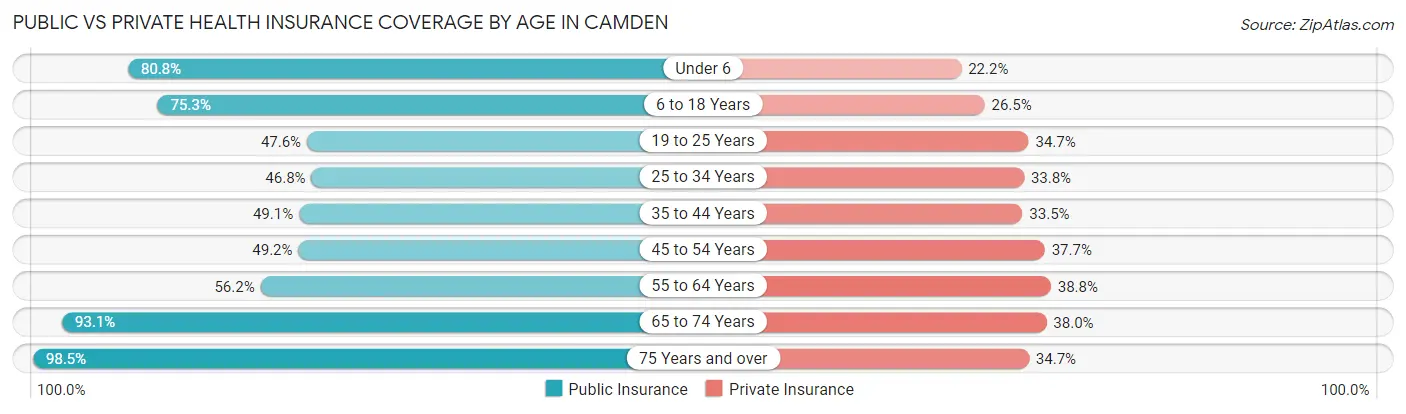
| Age Bracket | Public Insurance | Private Insurance |
| Under 6 | 4,915 (80.8%) | 1,348 (22.2%) |
| 6 to 18 Years | 11,748 (75.3%) | 4,133 (26.5%) |
| 19 to 25 Years | 3,729 (47.6%) | 2,716 (34.7%) |
| 25 to 34 Years | 4,061 (46.8%) | 2,936 (33.8%) |
| 35 to 44 Years | 4,334 (49.1%) | 2,961 (33.5%) |
| 45 to 54 Years | 4,068 (49.2%) | 3,115 (37.7%) |
| 55 to 64 Years | 4,259 (56.2%) | 2,938 (38.8%) |
| 65 to 74 Years | 3,869 (93.1%) | 1,579 (38.0%) |
| 75 Years and over | 3,124 (98.5%) | 1,102 (34.7%) |
| Total | 44,107 (62.8%) | 22,828 (32.5%) |
Disability Status by Sex by Age in Camden
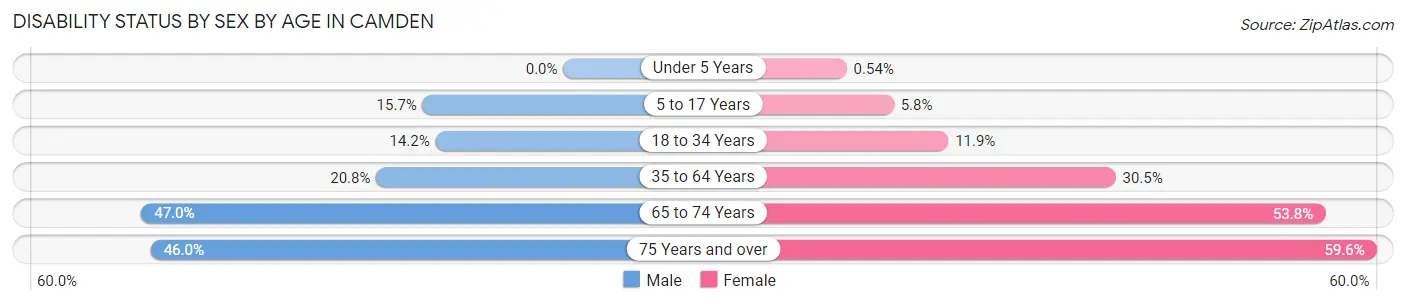
| Age Bracket | Male | Female |
| Under 5 Years | 0 (0.0%) | 15 (0.5%) |
| 5 to 17 Years | 1,145 (15.7%) | 463 (5.8%) |
| 18 to 34 Years | 1,109 (14.2%) | 1,199 (11.8%) |
| 35 to 64 Years | 2,450 (20.8%) | 3,939 (30.5%) |
| 65 to 74 Years | 806 (47.0%) | 1,314 (53.8%) |
| 75 Years and over | 550 (46.0%) | 1,177 (59.6%) |
Disability Class by Sex by Age in Camden
Disability Class: Hearing Difficulty
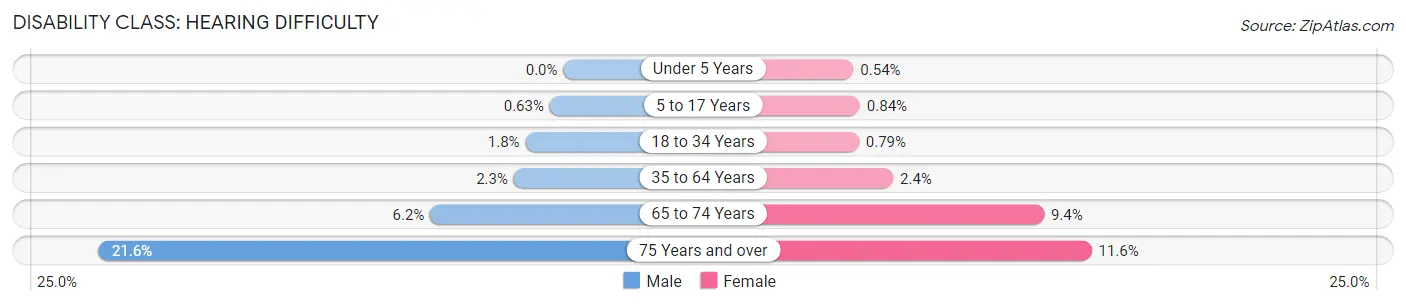
| Age Bracket | Male | Female |
| Under 5 Years | 0 (0.0%) | 15 (0.5%) |
| 5 to 17 Years | 46 (0.6%) | 67 (0.8%) |
| 18 to 34 Years | 137 (1.8%) | 80 (0.8%) |
| 35 to 64 Years | 270 (2.3%) | 307 (2.4%) |
| 65 to 74 Years | 106 (6.2%) | 229 (9.4%) |
| 75 Years and over | 258 (21.5%) | 229 (11.6%) |
Disability Class: Vision Difficulty
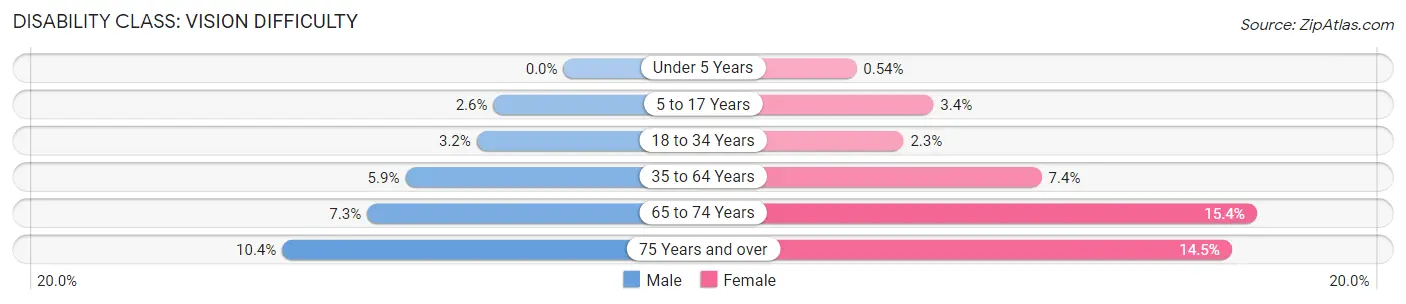
| Age Bracket | Male | Female |
| Under 5 Years | 0 (0.0%) | 15 (0.5%) |
| 5 to 17 Years | 190 (2.6%) | 272 (3.4%) |
| 18 to 34 Years | 251 (3.2%) | 232 (2.3%) |
| 35 to 64 Years | 690 (5.9%) | 959 (7.4%) |
| 65 to 74 Years | 125 (7.3%) | 376 (15.4%) |
| 75 Years and over | 125 (10.4%) | 286 (14.5%) |
Disability Class: Cognitive Difficulty
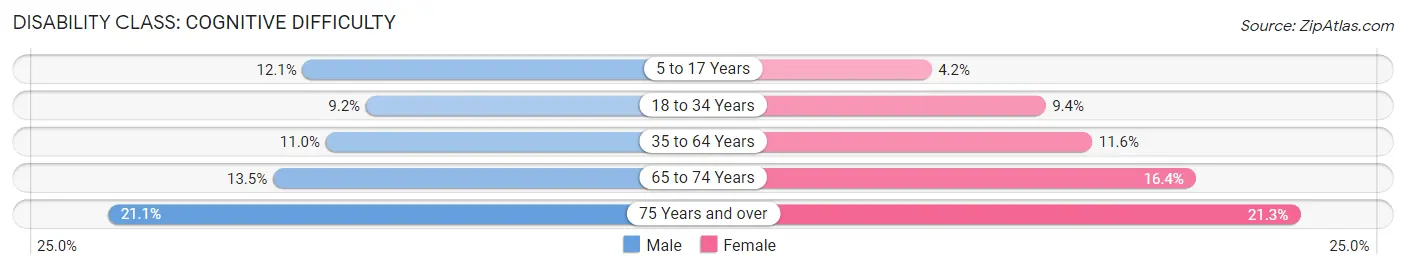
| Age Bracket | Male | Female |
| 5 to 17 Years | 884 (12.1%) | 332 (4.2%) |
| 18 to 34 Years | 714 (9.2%) | 955 (9.4%) |
| 35 to 64 Years | 1,296 (11.0%) | 1,498 (11.6%) |
| 65 to 74 Years | 231 (13.5%) | 401 (16.4%) |
| 75 Years and over | 253 (21.1%) | 420 (21.3%) |
Disability Class: Ambulatory Difficulty
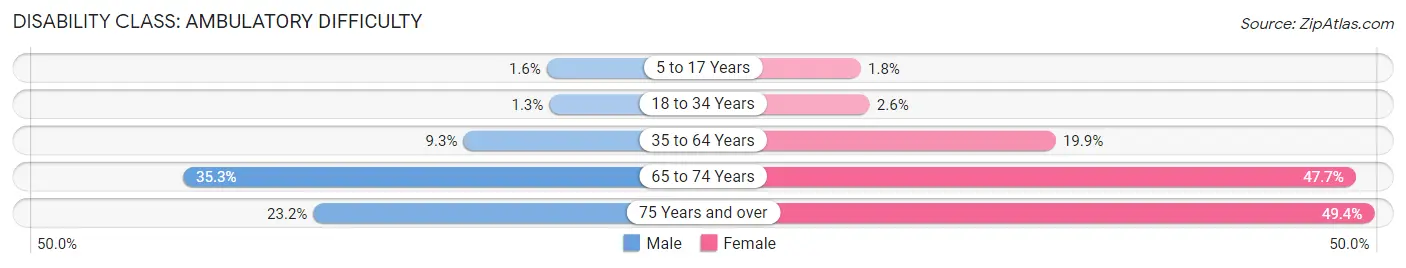
| Age Bracket | Male | Female |
| 5 to 17 Years | 114 (1.6%) | 143 (1.8%) |
| 18 to 34 Years | 103 (1.3%) | 264 (2.6%) |
| 35 to 64 Years | 1,093 (9.3%) | 2,568 (19.9%) |
| 65 to 74 Years | 605 (35.3%) | 1,164 (47.7%) |
| 75 Years and over | 278 (23.2%) | 976 (49.4%) |
Disability Class: Self-Care Difficulty
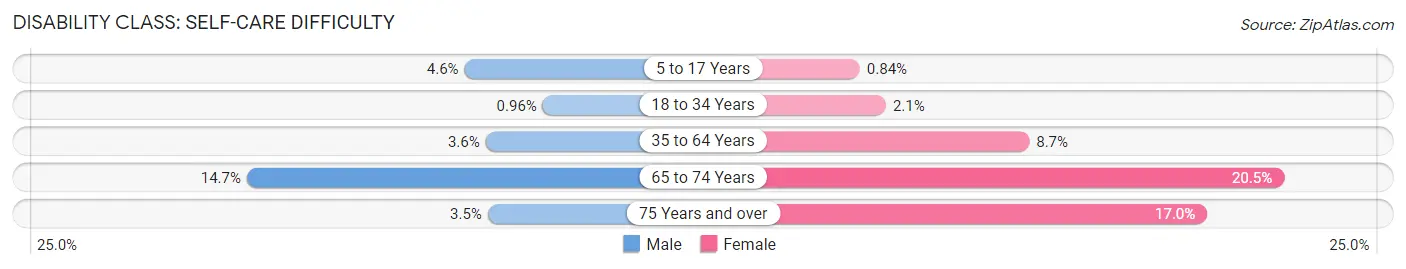
| Age Bracket | Male | Female |
| 5 to 17 Years | 335 (4.6%) | 67 (0.8%) |
| 18 to 34 Years | 75 (1.0%) | 207 (2.1%) |
| 35 to 64 Years | 425 (3.6%) | 1,124 (8.7%) |
| 65 to 74 Years | 252 (14.7%) | 501 (20.5%) |
| 75 Years and over | 42 (3.5%) | 335 (17.0%) |
Technology Access in Camden
Computing Device Access in Camden
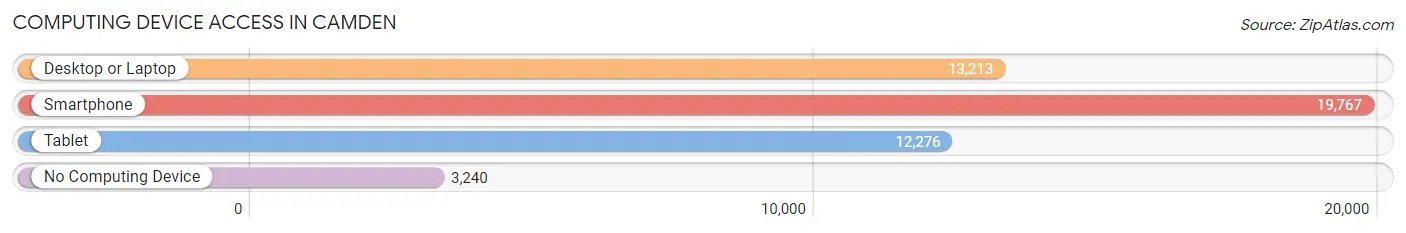
| Device Type | # Households | % Households |
| Desktop or Laptop | 13,213 | 54.2% |
| Smartphone | 19,767 | 81.1% |
| Tablet | 12,276 | 50.4% |
| No Computing Device | 3,240 | 13.3% |
| Total | 24,372 | 100.0% |
Internet Access in Camden
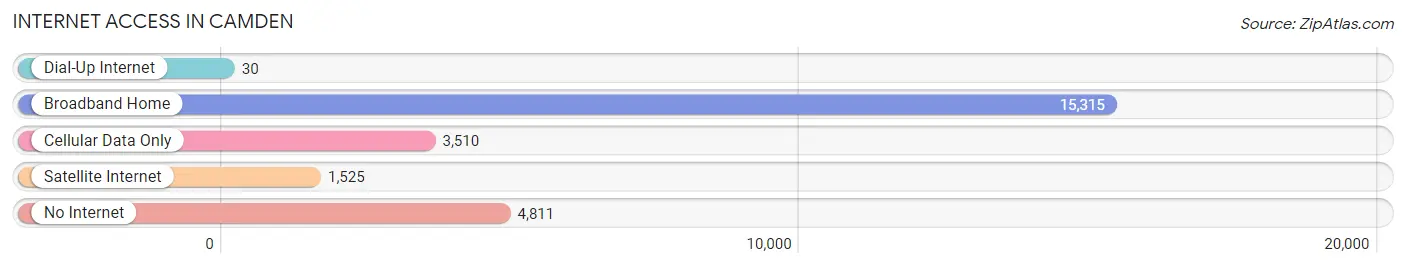
| Internet Type | # Households | % Households |
| Dial-Up Internet | 30 | 0.1% |
| Broadband Home | 15,315 | 62.8% |
| Cellular Data Only | 3,510 | 14.4% |
| Satellite Internet | 1,525 | 6.3% |
| No Internet | 4,811 | 19.7% |
| Total | 24,372 | 100.0% |
Camden Summary
Camden, New Jersey is a city located in Camden County, New Jersey, United States. It is located directly across the Delaware River from Philadelphia, Pennsylvania. As of the 2010 United States Census, the city had a total population of 77,344, making it the state's 12th-largest municipality. Camden is the county seat of Camden County. The city was incorporated on February 13, 1828.
Geography
Camden is located at 39°56′N 75°7′W (39.937, -75.118). According to the United States Census Bureau, the city has a total area of 8.7 square miles (22.5 km2), of which 8.5 square miles (22.1 km2) is land and 0.2 square miles (0.4 km2) (2.17%) is water.
Camden is located on the Delaware River, directly across from Philadelphia, Pennsylvania. The city is bounded by the Delaware River to the east, the Cooper River to the south, and the Pennsauken Creek to the west. The city is located in the Delaware Valley, a region of the United States that is home to many major cities.
Demographics
As of the 2010 United States Census, there were 77,344 people, 28,845 households, and 17,945 families residing in the city. The population density was 9,068.2 per square mile (3,500.2/km2). There were 32,845 housing units at an average density of 3,845.2 per square mile (1,485.2/km2). The racial makeup of the city was 44.2% (34,092) White, 39.2% (30,323) African American, 0.4% (323) Native American, 1.2% (937) Asian, 0.1% (68) Pacific Islander, 11.7% (9,072) from other races, and 3.2% (2,479) from two or more races. Hispanic or Latino of any race were 24.2% (18,717) of the population.
Economy
Camden is home to a number of major employers, including Campbell Soup Company, Subaru of America, and Holtec International. The city is also home to a number of smaller businesses, including restaurants, retail stores, and professional services.
The city is also home to a number of educational institutions, including Rutgers University-Camden, Camden County College, and the Cooper Medical School of Rowan University.
The city is also home to a number of cultural attractions, including the Camden Children's Garden, the Adventure Aquarium, and the Camden Waterfront.
Conclusion
Camden, New Jersey is a city located in Camden County, New Jersey, United States. It is located directly across the Delaware River from Philadelphia, Pennsylvania. As of the 2010 United States Census, the city had a total population of 77,344, making it the state's 12th-largest municipality. Camden is the county seat of Camden County. The city is bounded by the Delaware River to the east, the Cooper River to the south, and the Pennsauken Creek to the west. The city is located in the Delaware Valley, a region of the United States that is home to many major cities. As of the 2010 United States Census, there were 77,344 people, 28,845 households, and 17,945 families residing in the city. The population density was 9,068.2 per square mile (3,500.2/km2). Camden is home to a number of major employers, including Campbell Soup Company, Subaru of America, and Holtec International. The city is also home to a number of smaller businesses, including restaurants, retail stores, and professional services. The city is also home to a number of educational institutions, including Rutgers University-Camden, Camden County College, and the Cooper Medical School of Rowan University. The city is also home to a number of cultural attractions, including the Camden Children's Garden, the Adventure Aquarium, and the Camden Waterfront.
Common Questions
What is Per Capita Income in Camden?
Per Capita income in Camden is $18,914.
What is the Median Family Income in Camden?
Median Family Income in Camden is $40,623.
What is the Median Household income in Camden?
Median Household Income in Camden is $36,258.
What is Income or Wage Gap in Camden?
Income or Wage Gap in Camden is 26.4%.
Women in Camden earn 73.6 cents for every dollar earned by a man.
What is Family Income Deficit in Camden?
Family Income Deficit in Camden is $10,911.
Families that are below poverty line in Camden earn $10,911 less on average than the poverty threshold level.
What is Inequality or Gini Index in Camden?
Inequality or Gini Index in Camden is 0.50.
What is the Total Population of Camden?
Total Population of Camden is 71,799.
What is the Total Male Population of Camden?
Total Male Population of Camden is 33,227.
What is the Total Female Population of Camden?
Total Female Population of Camden is 38,572.
What is the Ratio of Males per 100 Females in Camden?
There are 86.14 Males per 100 Females in Camden.
What is the Ratio of Females per 100 Males in Camden?
There are 116.09 Females per 100 Males in Camden.
What is the Median Population Age in Camden?
Median Population Age in Camden is 32.1 Years.
What is the Average Family Size in Camden
Average Family Size in Camden is 3.5 People.
What is the Average Household Size in Camden
Average Household Size in Camden is 2.8 People.
How Large is the Labor Force in Camden?
There are 30,436 People in the Labor Forcein in Camden.
What is the Percentage of People in the Labor Force in Camden?
56.7% of People are in the Labor Force in Camden.
What is the Unemployment Rate in Camden?
Unemployment Rate in Camden is 14.6%.