Somers Point, NJ Map & Demographics
Somers Point Map
Somers Point Overview
$39,729
PER CAPITA INCOME
$86,642
AVG FAMILY INCOME
$68,262
AVG HOUSEHOLD INCOME
31.7%
WAGE / INCOME GAP [ % ]
68.3¢/ $1
WAGE / INCOME GAP [ $ ]
$14,158
FAMILY INCOME DEFICIT
0.45
INEQUALITY / GINI INDEX
10,482
TOTAL POPULATION
5,090
MALE POPULATION
5,392
FEMALE POPULATION
94.40
MALES / 100 FEMALES
105.93
FEMALES / 100 MALES
44.3
MEDIAN AGE
3.0
AVG FAMILY SIZE
2.2
AVG HOUSEHOLD SIZE
5,846
LABOR FORCE [ PEOPLE ]
67.5%
PERCENT IN LABOR FORCE
9.2%
UNEMPLOYMENT RATE
Somers Point Zip Codes
Somers Point Area Codes
Income in Somers Point
Income Overview in Somers Point
Per Capita Income in Somers Point is $39,729, while median incomes of families and households are $86,642 and $68,262 respectively.
| Characteristic | Number | Measure |
| Per Capita Income | 10,482 | $39,729 |
| Median Family Income | 2,599 | $86,642 |
| Mean Family Income | 2,599 | $104,086 |
| Median Household Income | 4,650 | $68,262 |
| Mean Household Income | 4,650 | $89,025 |
| Income Deficit | 2,599 | $14,158 |
| Wage / Income Gap (%) | 10,482 | 31.65% |
| Wage / Income Gap ($) | 10,482 | 68.35¢ per $1 |
| Gini / Inequality Index | 10,482 | 0.45 |
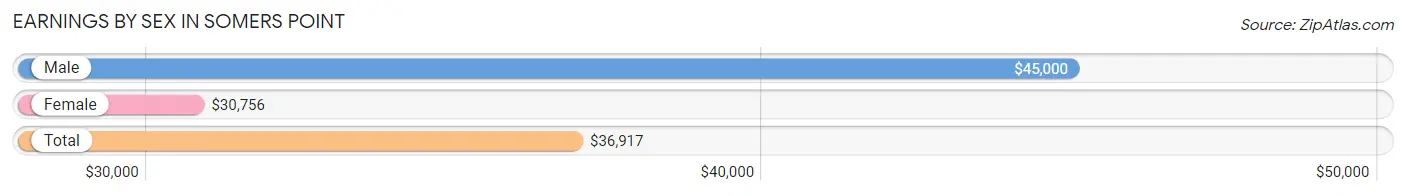
Earnings by Sex in Somers Point
Average Earnings in Somers Point are $36,917, $45,000 for men and $30,756 for women, a difference of 31.7%.
| Sex | Number | Average Earnings |
| Male | 2,974 (50.4%) | $45,000 |
| Female | 2,931 (49.6%) | $30,756 |
| Total | 5,905 (100.0%) | $36,917 |
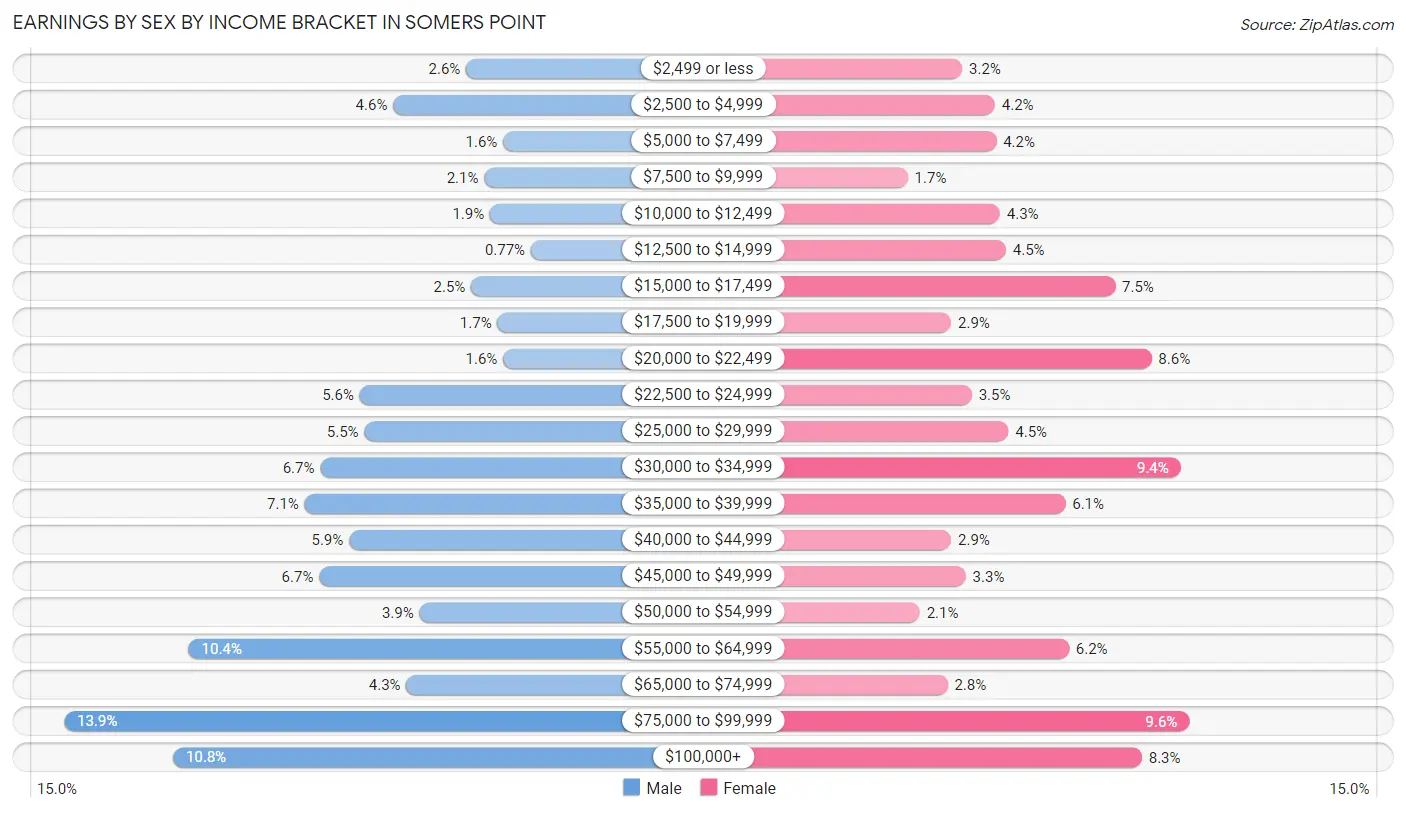
Earnings by Sex by Income Bracket in Somers Point
The most common earnings brackets in Somers Point are $75,000 to $99,999 for men (413 | 13.9%) and $75,000 to $99,999 for women (282 | 9.6%).
| Income | Male | Female |
| $2,499 or less | 77 (2.6%) | 95 (3.2%) |
| $2,500 to $4,999 | 138 (4.6%) | 122 (4.2%) |
| $5,000 to $7,499 | 46 (1.5%) | 123 (4.2%) |
| $7,500 to $9,999 | 62 (2.1%) | 50 (1.7%) |
| $10,000 to $12,499 | 57 (1.9%) | 126 (4.3%) |
| $12,500 to $14,999 | 23 (0.8%) | 131 (4.5%) |
| $15,000 to $17,499 | 73 (2.5%) | 221 (7.5%) |
| $17,500 to $19,999 | 51 (1.7%) | 86 (2.9%) |
| $20,000 to $22,499 | 46 (1.5%) | 251 (8.6%) |
| $22,500 to $24,999 | 166 (5.6%) | 103 (3.5%) |
| $25,000 to $29,999 | 162 (5.4%) | 133 (4.5%) |
| $30,000 to $34,999 | 199 (6.7%) | 275 (9.4%) |
| $35,000 to $39,999 | 212 (7.1%) | 180 (6.1%) |
| $40,000 to $44,999 | 175 (5.9%) | 86 (2.9%) |
| $45,000 to $49,999 | 200 (6.7%) | 98 (3.3%) |
| $50,000 to $54,999 | 116 (3.9%) | 60 (2.1%) |
| $55,000 to $64,999 | 309 (10.4%) | 183 (6.2%) |
| $65,000 to $74,999 | 127 (4.3%) | 83 (2.8%) |
| $75,000 to $99,999 | 413 (13.9%) | 282 (9.6%) |
| $100,000+ | 322 (10.8%) | 243 (8.3%) |
| Total | 2,974 (100.0%) | 2,931 (100.0%) |
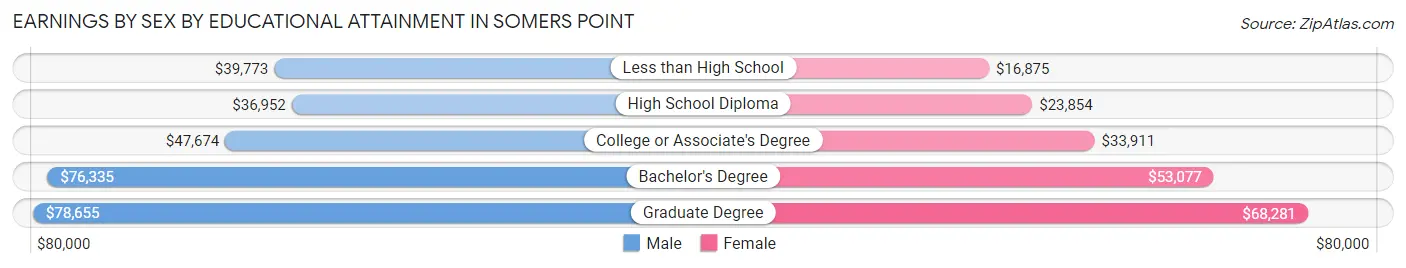
Earnings by Sex by Educational Attainment in Somers Point
Average earnings in Somers Point are $48,717 for men and $32,614 for women, a difference of 33.1%. Men with an educational attainment of graduate degree enjoy the highest average annual earnings of $78,655, while those with high school diploma education earn the least with $36,952. Women with an educational attainment of graduate degree earn the most with the average annual earnings of $68,281, while those with less than high school education have the smallest earnings of $16,875.
| Educational Attainment | Male Income | Female Income |
| Less than High School | $39,773 | $16,875 |
| High School Diploma | $36,952 | $23,854 |
| College or Associate's Degree | $47,674 | $33,911 |
| Bachelor's Degree | $76,335 | $53,077 |
| Graduate Degree | $78,655 | $68,281 |
| Total | $48,717 | $32,614 |
Family Income in Somers Point
Family Income Brackets in Somers Point
According to the Somers Point family income data, there are 582 families falling into the $75,000 to $99,999 income range, which is the most common income bracket and makes up 22.4% of all families. Conversely, the $10,000 to $14,999 income bracket is the least frequent group with only 57 families (2.2%) belonging to this category.
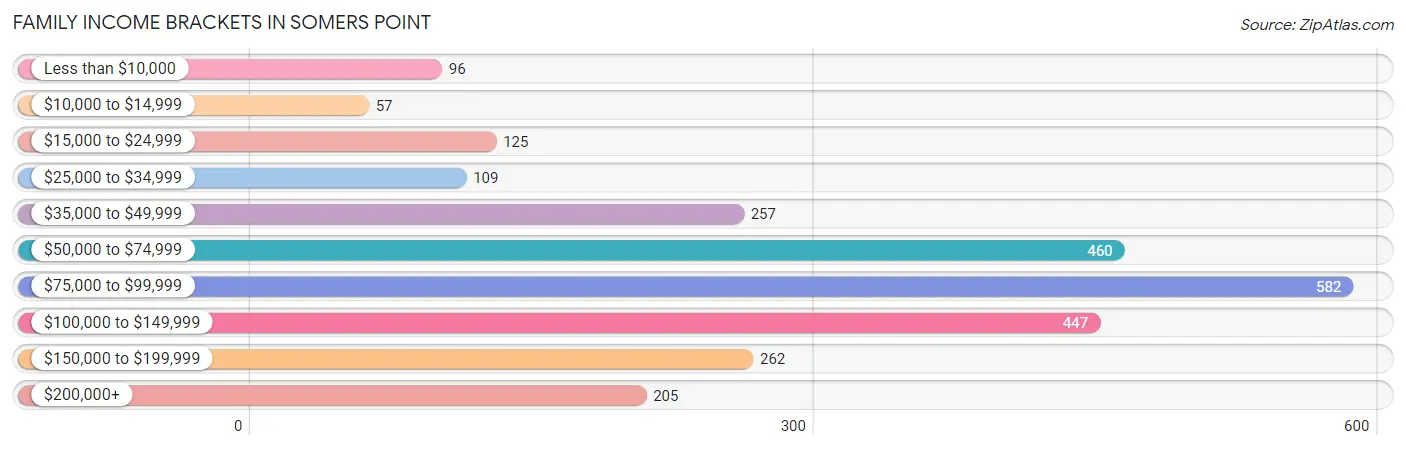
| Income Bracket | # Families | % Families |
| Less than $10,000 | 96 | 3.7% |
| $10,000 to $14,999 | 57 | 2.2% |
| $15,000 to $24,999 | 125 | 4.8% |
| $25,000 to $34,999 | 109 | 4.2% |
| $35,000 to $49,999 | 257 | 9.9% |
| $50,000 to $74,999 | 460 | 17.7% |
| $75,000 to $99,999 | 582 | 22.4% |
| $100,000 to $149,999 | 447 | 17.2% |
| $150,000 to $199,999 | 262 | 10.1% |
| $200,000+ | 205 | 7.9% |
Family Income by Famaliy Size in Somers Point
6-person families (35 | 1.3%) account for the highest median family income in Somers Point with $169,821 per family, while 2-person families (1,286 | 49.5%) have the highest median income of $47,969 per family member.
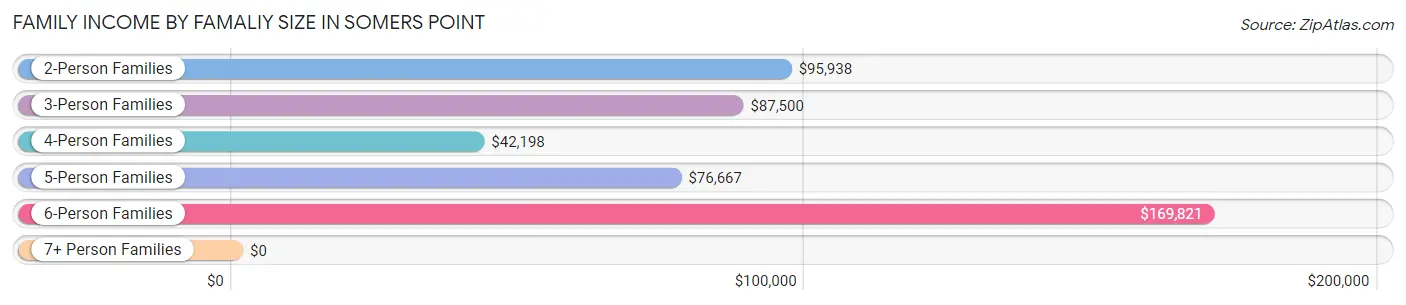
| Income Bracket | # Families | Median Income |
| 2-Person Families | 1,286 (49.5%) | $95,938 |
| 3-Person Families | 672 (25.9%) | $87,500 |
| 4-Person Families | 405 (15.6%) | $42,198 |
| 5-Person Families | 152 (5.9%) | $76,667 |
| 6-Person Families | 35 (1.3%) | $169,821 |
| 7+ Person Families | 49 (1.9%) | $0 |
| Total | 2,599 (100.0%) | $86,642 |
Family Income by Number of Earners in Somers Point
The median family income in Somers Point is $86,642, with families comprising 3+ earners (249) having the highest median family income of $135,078, while families with no earners (338) have the lowest median family income of $51,563, accounting for 9.6% and 13.0% of families, respectively.
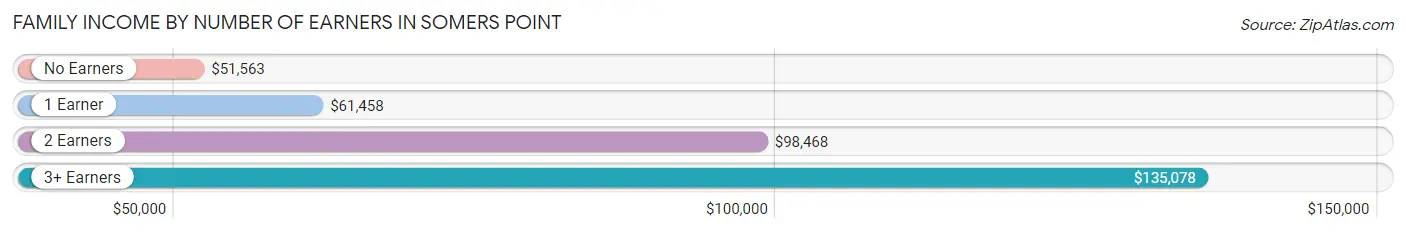
| Number of Earners | # Families | Median Income |
| No Earners | 338 (13.0%) | $51,563 |
| 1 Earner | 898 (34.5%) | $61,458 |
| 2 Earners | 1,114 (42.9%) | $98,468 |
| 3+ Earners | 249 (9.6%) | $135,078 |
| Total | 2,599 (100.0%) | $86,642 |
Household Income in Somers Point
Household Income Brackets in Somers Point
With 781 households falling in the category, the $50,000 to $74,999 income range is the most frequent in Somers Point, accounting for 16.8% of all households. In contrast, only 163 households (3.5%) fall into the $10,000 to $14,999 income bracket, making it the least populous group.
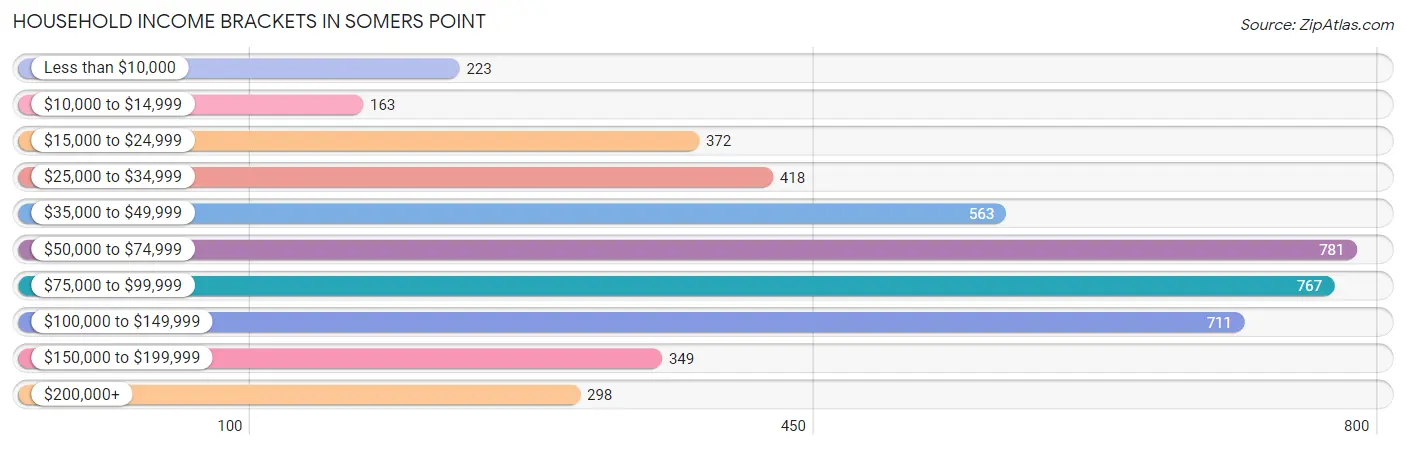
| Income Bracket | # Households | % Households |
| Less than $10,000 | 223 | 4.8% |
| $10,000 to $14,999 | 163 | 3.5% |
| $15,000 to $24,999 | 372 | 8.0% |
| $25,000 to $34,999 | 418 | 9.0% |
| $35,000 to $49,999 | 563 | 12.1% |
| $50,000 to $74,999 | 781 | 16.8% |
| $75,000 to $99,999 | 767 | 16.5% |
| $100,000 to $149,999 | 711 | 15.3% |
| $150,000 to $199,999 | 349 | 7.5% |
| $200,000+ | 298 | 6.4% |
Household Income by Householder Age in Somers Point
The median household income in Somers Point is $68,262, with the highest median household income of $96,230 found in the 45 to 64 years age bracket for the primary householder. A total of 1,851 households (39.8%) fall into this category. Meanwhile, the 25 to 44 years age bracket for the primary householder has the lowest median household income of $46,484, with 1,141 households (24.5%) in this group.
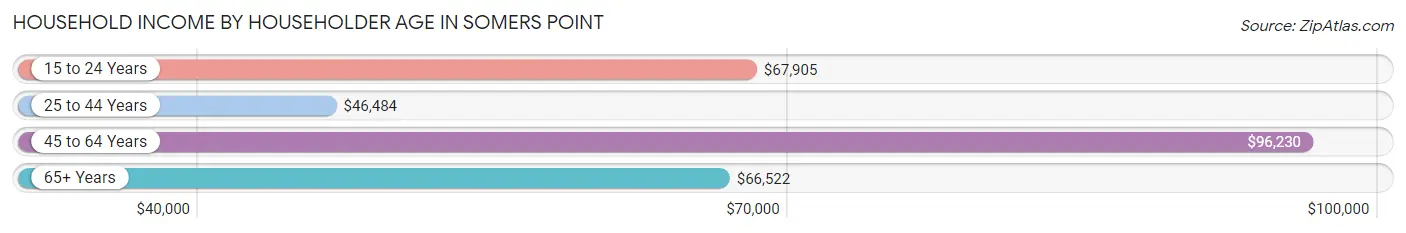
| Income Bracket | # Households | Median Income |
| 15 to 24 Years | 268 (5.8%) | $67,905 |
| 25 to 44 Years | 1,141 (24.5%) | $46,484 |
| 45 to 64 Years | 1,851 (39.8%) | $96,230 |
| 65+ Years | 1,390 (29.9%) | $66,522 |
| Total | 4,650 (100.0%) | $68,262 |
Poverty in Somers Point
Income Below Poverty by Sex and Age in Somers Point
With 9.2% poverty level for males and 13.3% for females among the residents of Somers Point, 12 to 14 year old males and 5 year old females are the most vulnerable to poverty, with 55 males (31.1%) and 9 females (45.0%) in their respective age groups living below the poverty level.
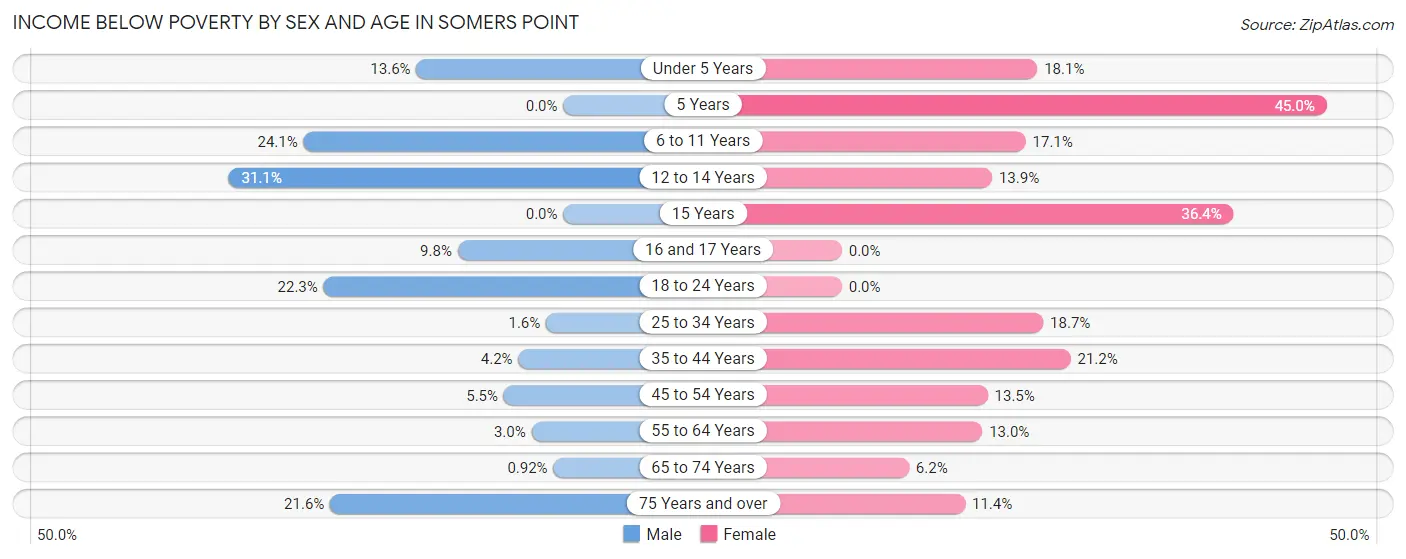
| Age Bracket | Male | Female |
| Under 5 Years | 78 (13.6%) | 41 (18.1%) |
| 5 Years | 0 (0.0%) | 9 (45.0%) |
| 6 to 11 Years | 54 (24.1%) | 43 (17.1%) |
| 12 to 14 Years | 55 (31.1%) | 40 (13.9%) |
| 15 Years | 0 (0.0%) | 16 (36.4%) |
| 16 and 17 Years | 15 (9.8%) | 0 (0.0%) |
| 18 to 24 Years | 103 (22.3%) | 0 (0.0%) |
| 25 to 34 Years | 10 (1.6%) | 114 (18.7%) |
| 35 to 44 Years | 24 (4.2%) | 124 (21.2%) |
| 45 to 54 Years | 34 (5.5%) | 120 (13.5%) |
| 55 to 64 Years | 24 (2.9%) | 110 (13.0%) |
| 65 to 74 Years | 5 (0.9%) | 36 (6.2%) |
| 75 Years and over | 66 (21.6%) | 65 (11.4%) |
| Total | 468 (9.2%) | 718 (13.3%) |
Income Above Poverty by Sex and Age in Somers Point
According to the poverty statistics in Somers Point, males aged 5 years and females aged 16 and 17 years are the age groups that are most secure financially, with 100.0% of males and 100.0% of females in these age groups living above the poverty line.
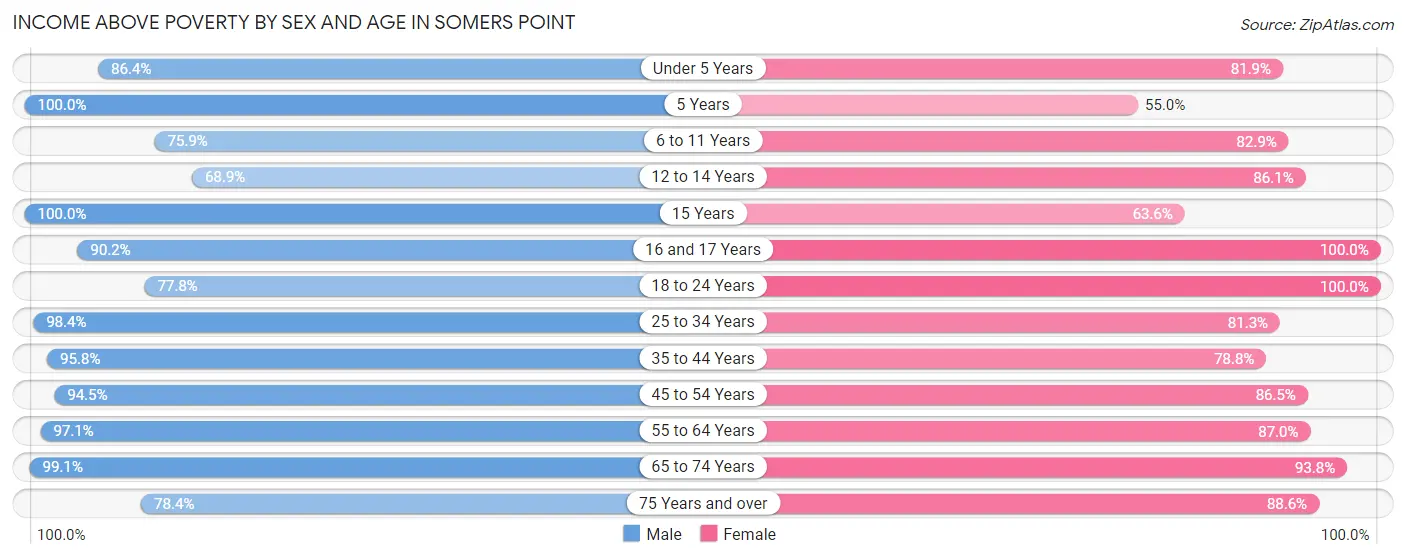
| Age Bracket | Male | Female |
| Under 5 Years | 494 (86.4%) | 185 (81.9%) |
| 5 Years | 13 (100.0%) | 11 (55.0%) |
| 6 to 11 Years | 170 (75.9%) | 209 (82.9%) |
| 12 to 14 Years | 122 (68.9%) | 247 (86.1%) |
| 15 Years | 7 (100.0%) | 28 (63.6%) |
| 16 and 17 Years | 138 (90.2%) | 120 (100.0%) |
| 18 to 24 Years | 360 (77.7%) | 372 (100.0%) |
| 25 to 34 Years | 616 (98.4%) | 496 (81.3%) |
| 35 to 44 Years | 551 (95.8%) | 460 (78.8%) |
| 45 to 54 Years | 582 (94.5%) | 767 (86.5%) |
| 55 to 64 Years | 790 (97.1%) | 734 (87.0%) |
| 65 to 74 Years | 540 (99.1%) | 542 (93.8%) |
| 75 Years and over | 239 (78.4%) | 503 (88.6%) |
| Total | 4,622 (90.8%) | 4,674 (86.7%) |
Income Below Poverty Among Married-Couple Families in Somers Point
The poverty statistics for married-couple families in Somers Point show that 2.0% or 39 of the total 1,932 families live below the poverty line. Families with no children have the highest poverty rate of 2.5%, comprising of 30 families. On the other hand, families with 3 or 4 children have the lowest poverty rate of 0.0%, which includes 0 families.
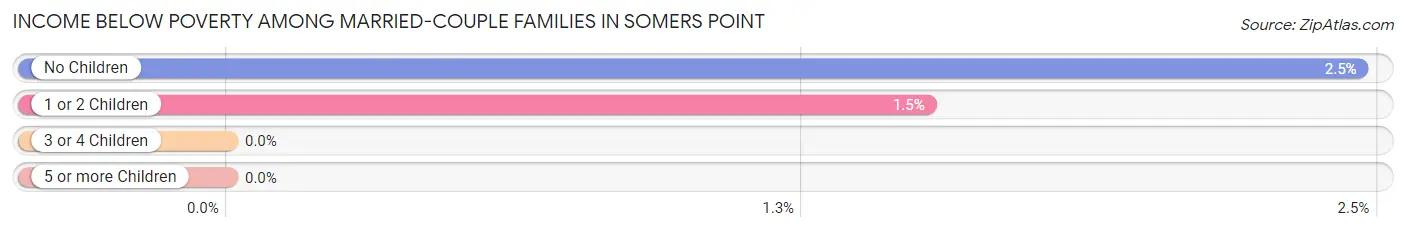
| Children | Above Poverty | Below Poverty |
| No Children | 1,188 (97.5%) | 30 (2.5%) |
| 1 or 2 Children | 582 (98.5%) | 9 (1.5%) |
| 3 or 4 Children | 86 (100.0%) | 0 (0.0%) |
| 5 or more Children | 37 (100.0%) | 0 (0.0%) |
| Total | 1,893 (98.0%) | 39 (2.0%) |
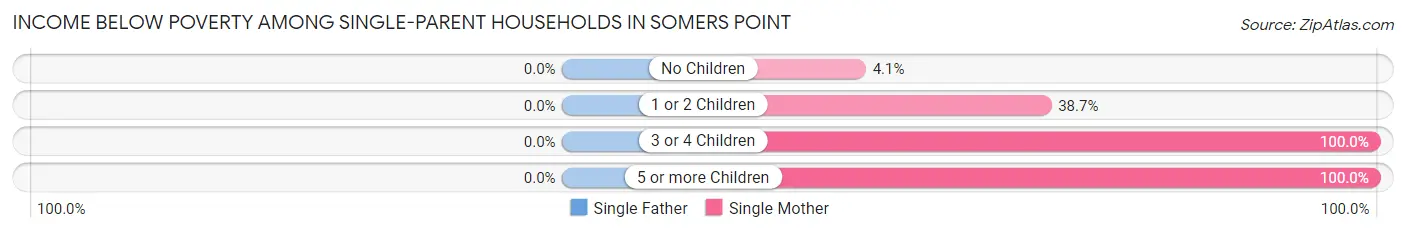
Income Below Poverty Among Single-Parent Households in Somers Point
| Children | Single Father | Single Mother |
| No Children | 0 (0.0%) | 8 (4.1%) |
| 1 or 2 Children | 0 (0.0%) | 104 (38.7%) |
| 3 or 4 Children | 0 (0.0%) | 38 (100.0%) |
| 5 or more Children | 0 (0.0%) | 12 (100.0%) |
| Total | 0 (0.0%) | 162 (31.5%) |
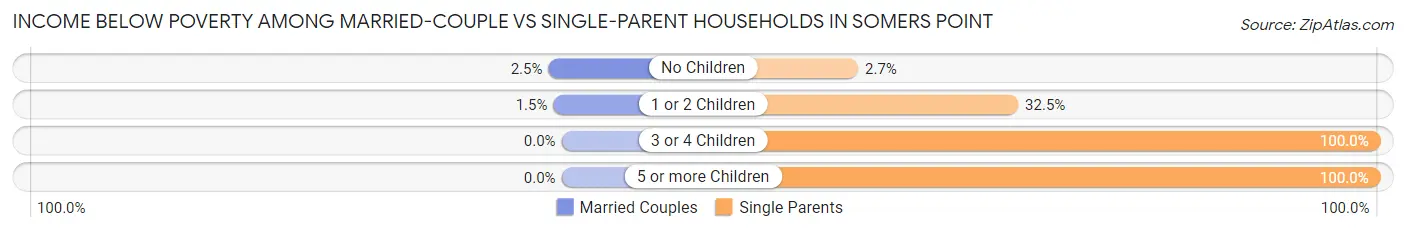
Income Below Poverty Among Married-Couple vs Single-Parent Households in Somers Point
The poverty data for Somers Point shows that 39 of the married-couple family households (2.0%) and 162 of the single-parent households (24.3%) are living below the poverty level. Within the married-couple family households, those with no children have the highest poverty rate, with 30 households (2.5%) falling below the poverty line. Among the single-parent households, those with 3 or 4 children have the highest poverty rate, with 38 household (100.0%) living below poverty.
| Children | Married-Couple Families | Single-Parent Households |
| No Children | 30 (2.5%) | 8 (2.7%) |
| 1 or 2 Children | 9 (1.5%) | 104 (32.5%) |
| 3 or 4 Children | 0 (0.0%) | 38 (100.0%) |
| 5 or more Children | 0 (0.0%) | 12 (100.0%) |
| Total | 39 (2.0%) | 162 (24.3%) |
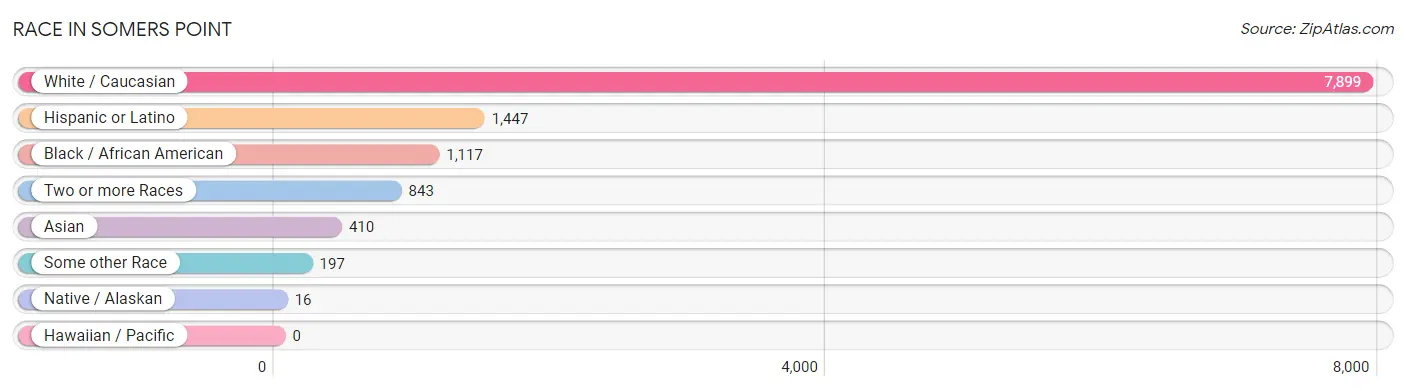
Race in Somers Point
The most populous races in Somers Point are White / Caucasian (7,899 | 75.4%), Hispanic or Latino (1,447 | 13.8%), and Black / African American (1,117 | 10.7%).
| Race | # Population | % Population |
| Asian | 410 | 3.9% |
| Black / African American | 1,117 | 10.7% |
| Hawaiian / Pacific | 0 | 0.0% |
| Hispanic or Latino | 1,447 | 13.8% |
| Native / Alaskan | 16 | 0.2% |
| White / Caucasian | 7,899 | 75.4% |
| Two or more Races | 843 | 8.0% |
| Some other Race | 197 | 1.9% |
| Total | 10,482 | 100.0% |
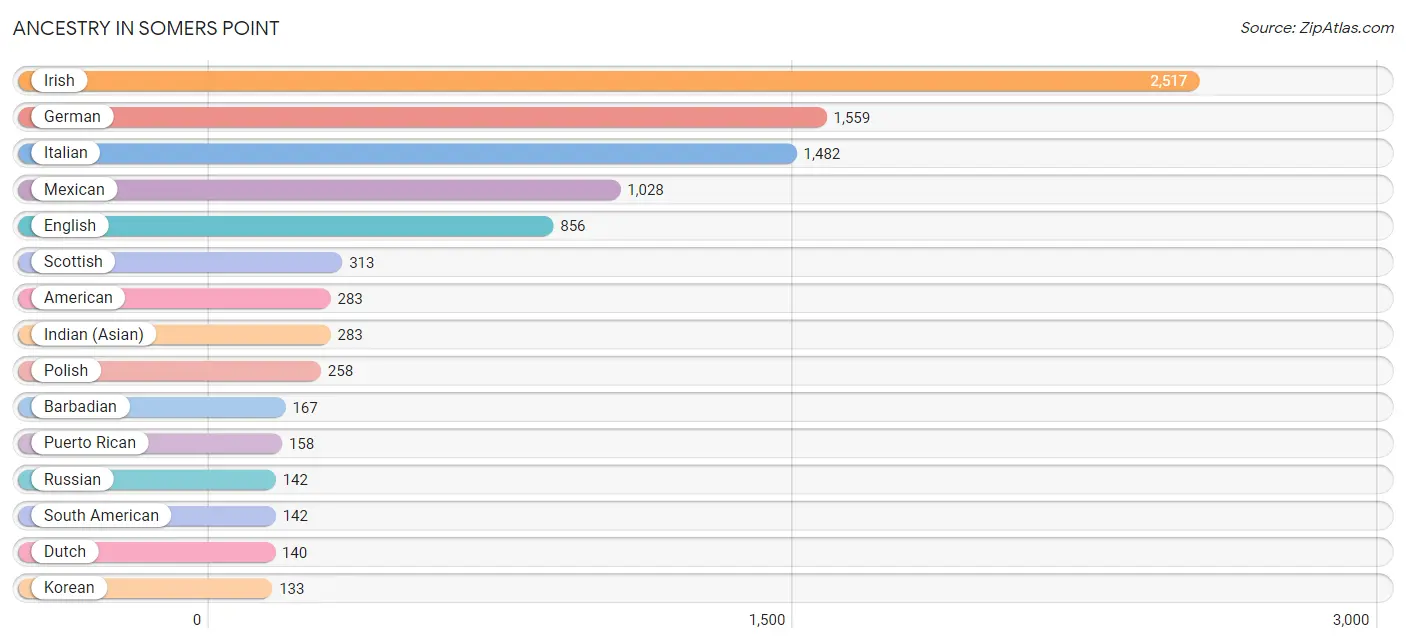
Ancestry in Somers Point
The most populous ancestries reported in Somers Point are Irish (2,517 | 24.0%), German (1,559 | 14.9%), Italian (1,482 | 14.1%), Mexican (1,028 | 9.8%), and English (856 | 8.2%), together accounting for 71.0% of all Somers Point residents.
| Ancestry | # Population | % Population |
| African | 76 | 0.7% |
| Albanian | 41 | 0.4% |
| American | 283 | 2.7% |
| Arab | 20 | 0.2% |
| Argentinean | 35 | 0.3% |
| Australian | 37 | 0.4% |
| Austrian | 15 | 0.1% |
| Barbadian | 167 | 1.6% |
| Belgian | 15 | 0.1% |
| Blackfeet | 13 | 0.1% |
| Burmese | 2 | 0.0% |
| Canadian | 13 | 0.1% |
| Celtic | 3 | 0.0% |
| Central American | 31 | 0.3% |
| Cherokee | 1 | 0.0% |
| Colombian | 41 | 0.4% |
| Croatian | 10 | 0.1% |
| Cuban | 71 | 0.7% |
| Danish | 3 | 0.0% |
| Dominican | 17 | 0.2% |
| Dutch | 140 | 1.3% |
| Eastern European | 67 | 0.6% |
| English | 856 | 8.2% |
| European | 120 | 1.1% |
| French | 89 | 0.9% |
| French Canadian | 51 | 0.5% |
| German | 1,559 | 14.9% |
| Greek | 105 | 1.0% |
| Hungarian | 96 | 0.9% |
| Indian (Asian) | 283 | 2.7% |
| Iranian | 9 | 0.1% |
| Irish | 2,517 | 24.0% |
| Israeli | 20 | 0.2% |
| Italian | 1,482 | 14.1% |
| Korean | 133 | 1.3% |
| Latvian | 7 | 0.1% |
| Lebanese | 12 | 0.1% |
| Lithuanian | 50 | 0.5% |
| Mexican | 1,028 | 9.8% |
| Moroccan | 8 | 0.1% |
| Nicaraguan | 31 | 0.3% |
| Norwegian | 40 | 0.4% |
| Peruvian | 66 | 0.6% |
| Polish | 258 | 2.5% |
| Portuguese | 26 | 0.3% |
| Puerto Rican | 158 | 1.5% |
| Romanian | 71 | 0.7% |
| Russian | 142 | 1.3% |
| Scotch-Irish | 131 | 1.3% |
| Scottish | 313 | 3.0% |
| Serbian | 24 | 0.2% |
| Slavic | 15 | 0.1% |
| Slovak | 23 | 0.2% |
| South American | 142 | 1.3% |
| Subsaharan African | 76 | 0.7% |
| Swedish | 26 | 0.3% |
| Swiss | 8 | 0.1% |
| Ukrainian | 68 | 0.6% |
| Ute | 4 | 0.0% |
| Welsh | 117 | 1.1% | View All 60 Rows |
Immigrants in Somers Point
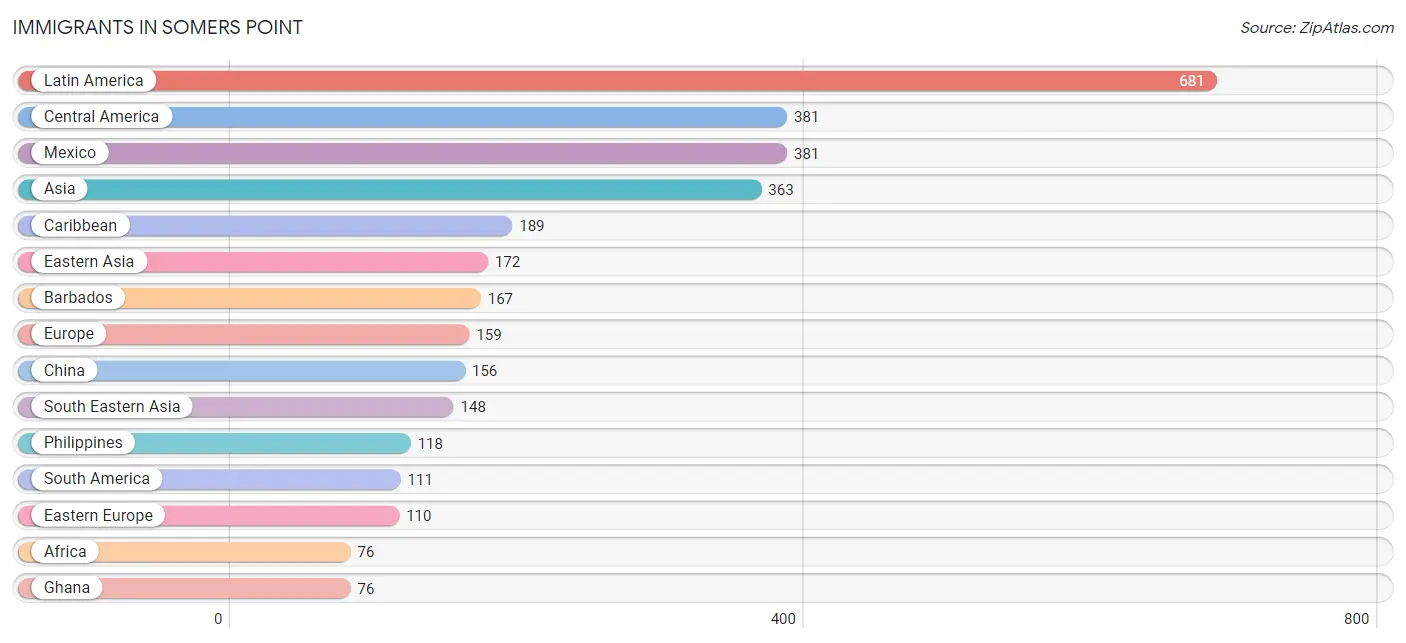
The most numerous immigrant groups reported in Somers Point came from Latin America (681 | 6.5%), Central America (381 | 3.6%), Mexico (381 | 3.6%), Asia (363 | 3.5%), and Caribbean (189 | 1.8%), together accounting for 19.0% of all Somers Point residents.
| Immigration Origin | # Population | % Population |
| Africa | 76 | 0.7% |
| Albania | 41 | 0.4% |
| Argentina | 16 | 0.2% |
| Asia | 363 | 3.5% |
| Australia | 10 | 0.1% |
| Barbados | 167 | 1.6% |
| Bulgaria | 11 | 0.1% |
| Canada | 13 | 0.1% |
| Caribbean | 189 | 1.8% |
| Central America | 381 | 3.6% |
| China | 156 | 1.5% |
| Colombia | 29 | 0.3% |
| Cuba | 13 | 0.1% |
| Dominican Republic | 9 | 0.1% |
| Eastern Asia | 172 | 1.6% |
| Eastern Europe | 110 | 1.1% |
| England | 9 | 0.1% |
| Europe | 159 | 1.5% |
| France | 2 | 0.0% |
| Ghana | 76 | 0.7% |
| Greece | 27 | 0.3% |
| India | 5 | 0.1% |
| Indonesia | 24 | 0.2% |
| Iran | 9 | 0.1% |
| Ireland | 11 | 0.1% |
| Israel | 29 | 0.3% |
| Korea | 16 | 0.2% |
| Latin America | 681 | 6.5% |
| Mexico | 381 | 3.6% |
| Northern Europe | 20 | 0.2% |
| Oceania | 10 | 0.1% |
| Peru | 66 | 0.6% |
| Philippines | 118 | 1.1% |
| Poland | 9 | 0.1% |
| Romania | 33 | 0.3% |
| Russia | 16 | 0.2% |
| South America | 111 | 1.1% |
| South Central Asia | 14 | 0.1% |
| South Eastern Asia | 148 | 1.4% |
| Southern Europe | 27 | 0.3% |
| Vietnam | 6 | 0.1% |
| Western Africa | 76 | 0.7% |
| Western Asia | 29 | 0.3% |
| Western Europe | 2 | 0.0% | View All 44 Rows |
Sex and Age in Somers Point
Sex and Age in Somers Point
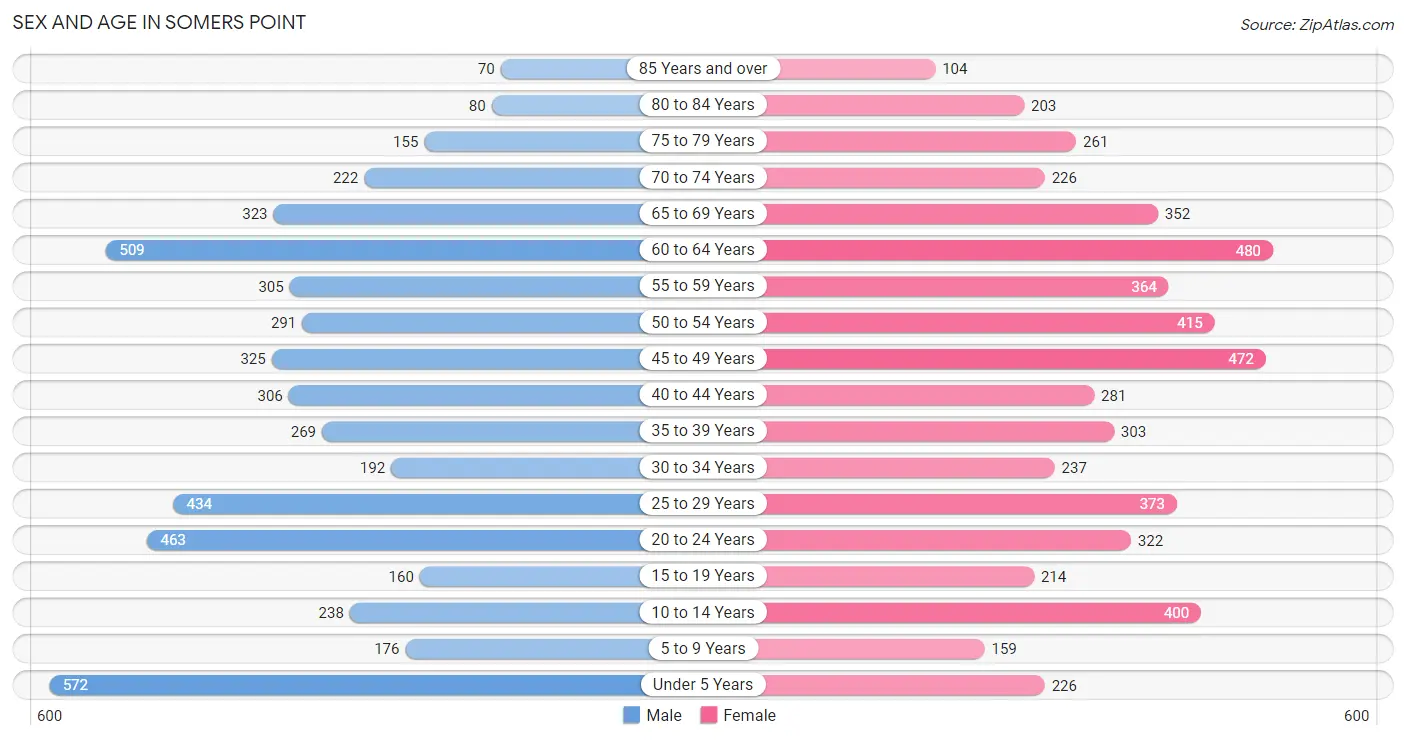
The most populous age groups in Somers Point are Under 5 Years (572 | 11.2%) for men and 60 to 64 Years (480 | 8.9%) for women.
| Age Bracket | Male | Female |
| Under 5 Years | 572 (11.2%) | 226 (4.2%) |
| 5 to 9 Years | 176 (3.5%) | 159 (2.9%) |
| 10 to 14 Years | 238 (4.7%) | 400 (7.4%) |
| 15 to 19 Years | 160 (3.1%) | 214 (4.0%) |
| 20 to 24 Years | 463 (9.1%) | 322 (6.0%) |
| 25 to 29 Years | 434 (8.5%) | 373 (6.9%) |
| 30 to 34 Years | 192 (3.8%) | 237 (4.4%) |
| 35 to 39 Years | 269 (5.3%) | 303 (5.6%) |
| 40 to 44 Years | 306 (6.0%) | 281 (5.2%) |
| 45 to 49 Years | 325 (6.4%) | 472 (8.7%) |
| 50 to 54 Years | 291 (5.7%) | 415 (7.7%) |
| 55 to 59 Years | 305 (6.0%) | 364 (6.8%) |
| 60 to 64 Years | 509 (10.0%) | 480 (8.9%) |
| 65 to 69 Years | 323 (6.4%) | 352 (6.5%) |
| 70 to 74 Years | 222 (4.4%) | 226 (4.2%) |
| 75 to 79 Years | 155 (3.0%) | 261 (4.8%) |
| 80 to 84 Years | 80 (1.6%) | 203 (3.8%) |
| 85 Years and over | 70 (1.4%) | 104 (1.9%) |
| Total | 5,090 (100.0%) | 5,392 (100.0%) |
Families and Households in Somers Point
Median Family Size in Somers Point
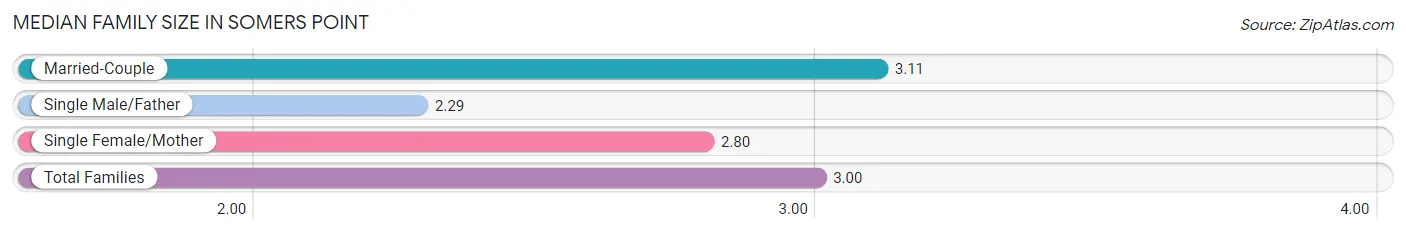
The median family size in Somers Point is 3.00 persons per family, with married-couple families (1,932 | 74.3%) accounting for the largest median family size of 3.11 persons per family. On the other hand, single male/father families (153 | 5.9%) represent the smallest median family size with 2.29 persons per family.
| Family Type | # Families | Family Size |
| Married-Couple | 1,932 (74.3%) | 3.11 |
| Single Male/Father | 153 (5.9%) | 2.29 |
| Single Female/Mother | 514 (19.8%) | 2.80 |
| Total Families | 2,599 (100.0%) | 3.00 |
Median Household Size in Somers Point
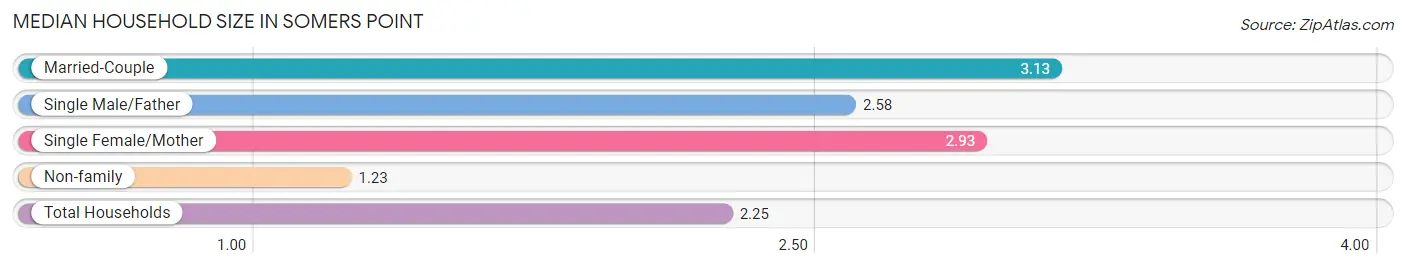
The median household size in Somers Point is 2.25 persons per household, with married-couple households (1,932 | 41.5%) accounting for the largest median household size of 3.13 persons per household. non-family households (2,051 | 44.1%) represent the smallest median household size with 1.23 persons per household.
| Household Type | # Households | Household Size |
| Married-Couple | 1,932 (41.5%) | 3.13 |
| Single Male/Father | 153 (3.3%) | 2.58 |
| Single Female/Mother | 514 (11.1%) | 2.93 |
| Non-family | 2,051 (44.1%) | 1.23 |
| Total Households | 4,650 (100.0%) | 2.25 |
Household Size by Marriage Status in Somers Point
Out of a total of 4,650 households in Somers Point, 2,599 (55.9%) are family households, while 2,051 (44.1%) are nonfamily households. The most numerous type of family households are 2-person households, comprising 1,251, and the most common type of nonfamily households are 1-person households, comprising 1,590.
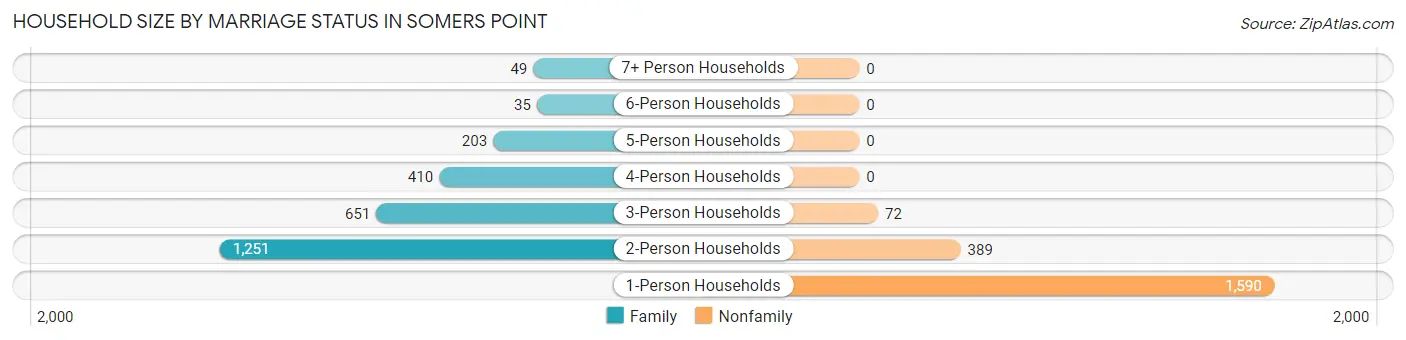
| Household Size | Family Households | Nonfamily Households |
| 1-Person Households | - | 1,590 (34.2%) |
| 2-Person Households | 1,251 (26.9%) | 389 (8.4%) |
| 3-Person Households | 651 (14.0%) | 72 (1.5%) |
| 4-Person Households | 410 (8.8%) | 0 (0.0%) |
| 5-Person Households | 203 (4.4%) | 0 (0.0%) |
| 6-Person Households | 35 (0.7%) | 0 (0.0%) |
| 7+ Person Households | 49 (1.1%) | 0 (0.0%) |
| Total | 2,599 (55.9%) | 2,051 (44.1%) |
Female Fertility in Somers Point
Fertility by Age in Somers Point
Average fertility rate in Somers Point is 77.0 births per 1,000 women. Women in the age bracket of 20 to 34 years have the highest fertility rate with 127.0 births per 1,000 women. Women in the age bracket of 20 to 34 years acount for 67.4% of all women with births.
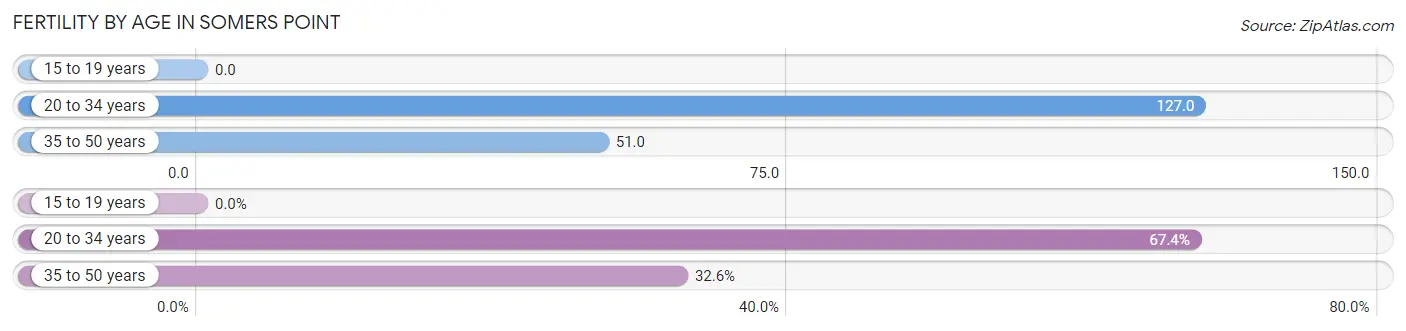
| Age Bracket | Women with Births | Births / 1,000 Women |
| 15 to 19 years | 0 (0.0%) | 0.0 |
| 20 to 34 years | 118 (67.4%) | 127.0 |
| 35 to 50 years | 57 (32.6%) | 51.0 |
| Total | 175 (100.0%) | 77.0 |
Fertility by Age by Marriage Status in Somers Point
81.7% of women with births (175) in Somers Point are married. The highest percentage of unmarried women with births falls into 20 to 34 years age bracket with 27.1% of them unmarried at the time of birth, while the lowest percentage of unmarried women with births belong to 35 to 50 years age bracket with 0.0% of them unmarried.
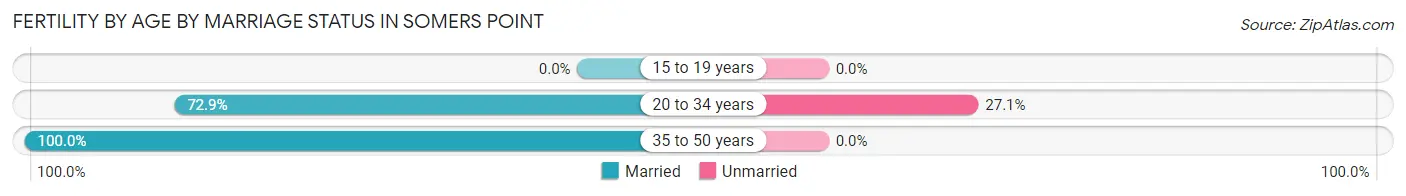
| Age Bracket | Married | Unmarried |
| 15 to 19 years | 0 (0.0%) | 0 (0.0%) |
| 20 to 34 years | 86 (72.9%) | 32 (27.1%) |
| 35 to 50 years | 57 (100.0%) | 0 (0.0%) |
| Total | 143 (81.7%) | 32 (18.3%) |
Fertility by Education in Somers Point
Average fertility rate in Somers Point is 77.0 births per 1,000 women. Women with the education attainment of less than high school have the highest fertility rate of 140.0 births per 1,000 women, while women with the education attainment of high school diploma have the lowest fertility at 24.0 births per 1,000 women. Women with the education attainment of less than high school represent 37.7% of all women with births.
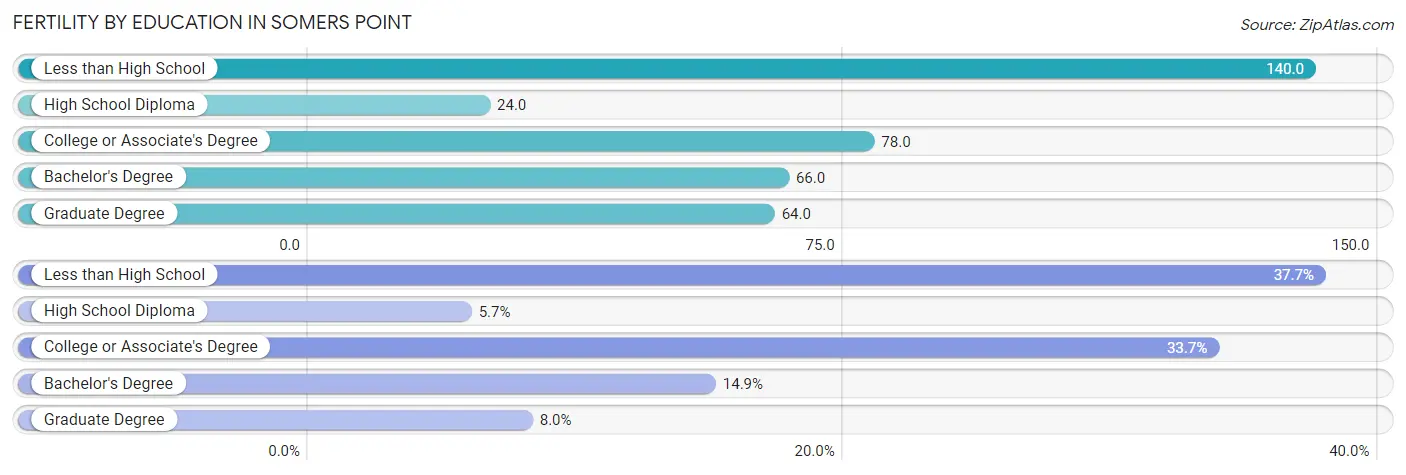
| Educational Attainment | Women with Births | Births / 1,000 Women |
| Less than High School | 66 (37.7%) | 140.0 |
| High School Diploma | 10 (5.7%) | 24.0 |
| College or Associate's Degree | 59 (33.7%) | 78.0 |
| Bachelor's Degree | 26 (14.9%) | 66.0 |
| Graduate Degree | 14 (8.0%) | 64.0 |
| Total | 175 (100.0%) | 77.0 |
Fertility by Education by Marriage Status in Somers Point
18.3% of women with births in Somers Point are unmarried. Women with the educational attainment of less than high school are most likely to be married with 100.0% of them married at childbirth, while women with the educational attainment of college or associate's degree are least likely to be married with 54.2% of them unmarried at childbirth.
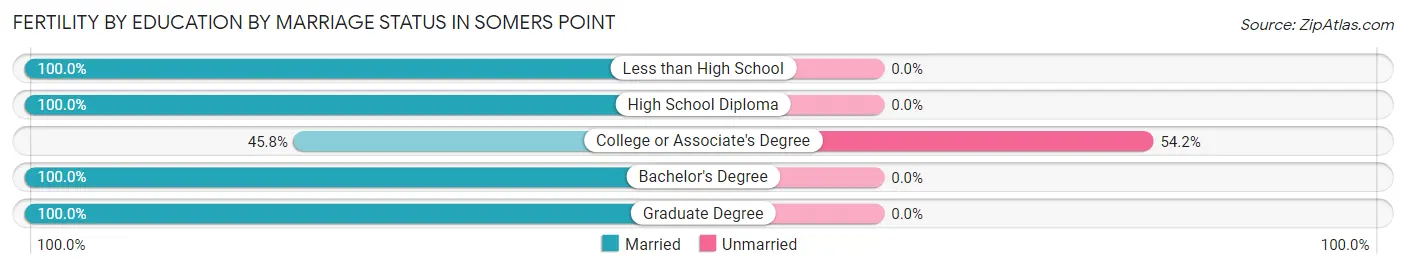
| Educational Attainment | Married | Unmarried |
| Less than High School | 66 (100.0%) | 0 (0.0%) |
| High School Diploma | 10 (100.0%) | 0 (0.0%) |
| College or Associate's Degree | 27 (45.8%) | 32 (54.2%) |
| Bachelor's Degree | 26 (100.0%) | 0 (0.0%) |
| Graduate Degree | 14 (100.0%) | 0 (0.0%) |
| Total | 143 (81.7%) | 32 (18.3%) |
Employment Characteristics in Somers Point
Employment by Class of Employer in Somers Point
Among the 5,125 employed individuals in Somers Point, private company employees (3,275 | 63.9%), local government employees (494 | 9.6%), and not-for-profit organizations (420 | 8.2%) make up the most common classes of employment.
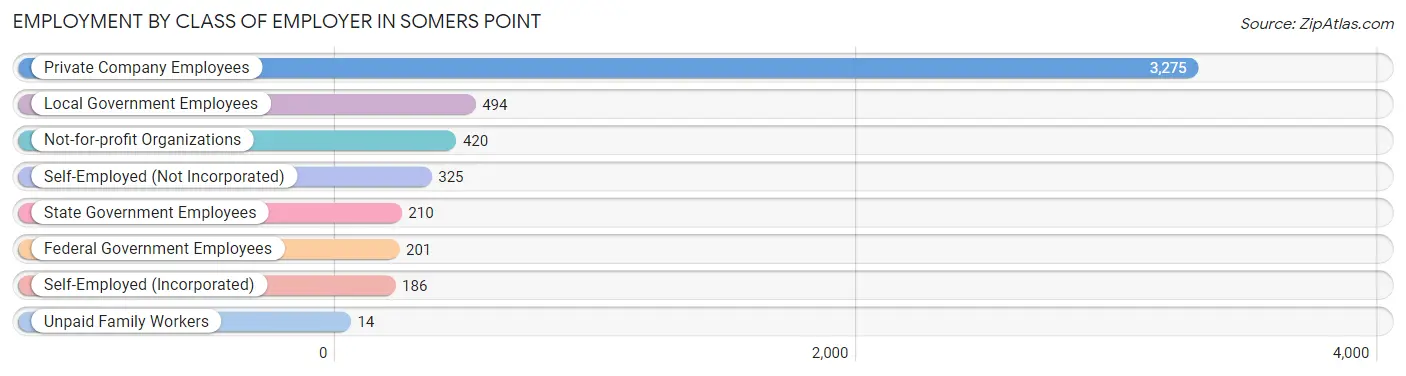
| Employer Class | # Employees | % Employees |
| Private Company Employees | 3,275 | 63.9% |
| Self-Employed (Incorporated) | 186 | 3.6% |
| Self-Employed (Not Incorporated) | 325 | 6.3% |
| Not-for-profit Organizations | 420 | 8.2% |
| Local Government Employees | 494 | 9.6% |
| State Government Employees | 210 | 4.1% |
| Federal Government Employees | 201 | 3.9% |
| Unpaid Family Workers | 14 | 0.3% |
| Total | 5,125 | 100.0% |
Employment Status by Age in Somers Point
According to the labor force statistics for Somers Point, out of the total population over 16 years of age (8,660), 67.5% or 5,846 individuals are in the labor force, with 9.2% or 538 of them unemployed. The age group with the highest labor force participation rate is 45 to 54 years, with 89.1% or 1,339 individuals in the labor force. Within the labor force, the 65 to 74 years age range has the highest percentage of unemployed individuals, with 16.3% or 62 of them being unemployed.
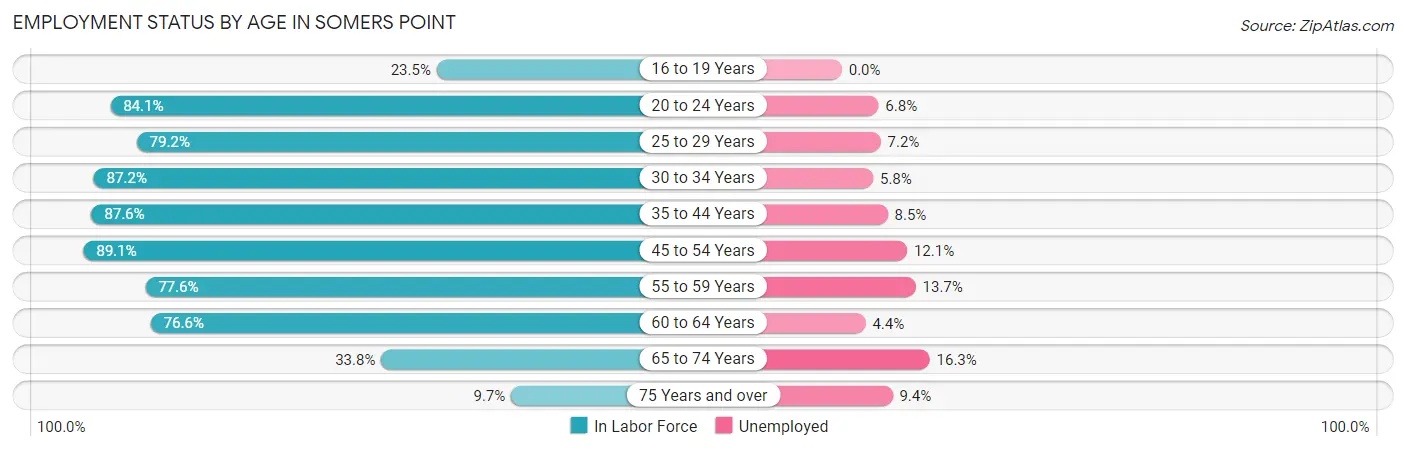
| Age Bracket | In Labor Force | Unemployed |
| 16 to 19 Years | 76 (23.5%) | 0 (0.0%) |
| 20 to 24 Years | 660 (84.1%) | 45 (6.8%) |
| 25 to 29 Years | 639 (79.2%) | 46 (7.2%) |
| 30 to 34 Years | 374 (87.2%) | 22 (5.8%) |
| 35 to 44 Years | 1,015 (87.6%) | 86 (8.5%) |
| 45 to 54 Years | 1,339 (89.1%) | 162 (12.1%) |
| 55 to 59 Years | 519 (77.6%) | 71 (13.7%) |
| 60 to 64 Years | 758 (76.6%) | 33 (4.4%) |
| 65 to 74 Years | 380 (33.8%) | 62 (16.3%) |
| 75 Years and over | 85 (9.7%) | 8 (9.4%) |
| Total | 5,846 (67.5%) | 538 (9.2%) |
Employment Status by Educational Attainment in Somers Point
According to labor force statistics for Somers Point, 83.6% of individuals (4,645) out of the total population between 25 and 64 years of age (5,556) are in the labor force, with 9.1% or 423 of them being unemployed. The group with the highest labor force participation rate are those with the educational attainment of bachelor's degree or higher, with 88.5% or 1,369 individuals in the labor force. Within the labor force, individuals with college / associate degree education have the highest percentage of unemployment, with 14.8% or 216 of them being unemployed.
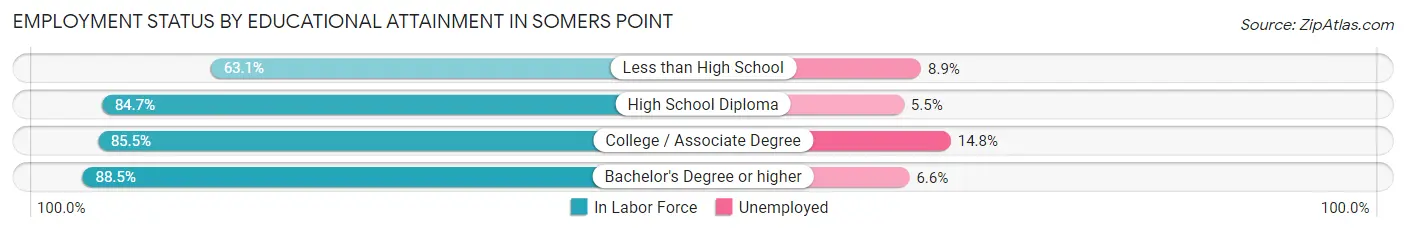
| Educational Attainment | In Labor Force | Unemployed |
| Less than High School | 395 (63.1%) | 56 (8.9%) |
| High School Diploma | 1,421 (84.7%) | 92 (5.5%) |
| College / Associate Degree | 1,458 (85.5%) | 252 (14.8%) |
| Bachelor's Degree or higher | 1,369 (88.5%) | 102 (6.6%) |
| Total | 4,645 (83.6%) | 506 (9.1%) |
Employment Occupations by Sex in Somers Point
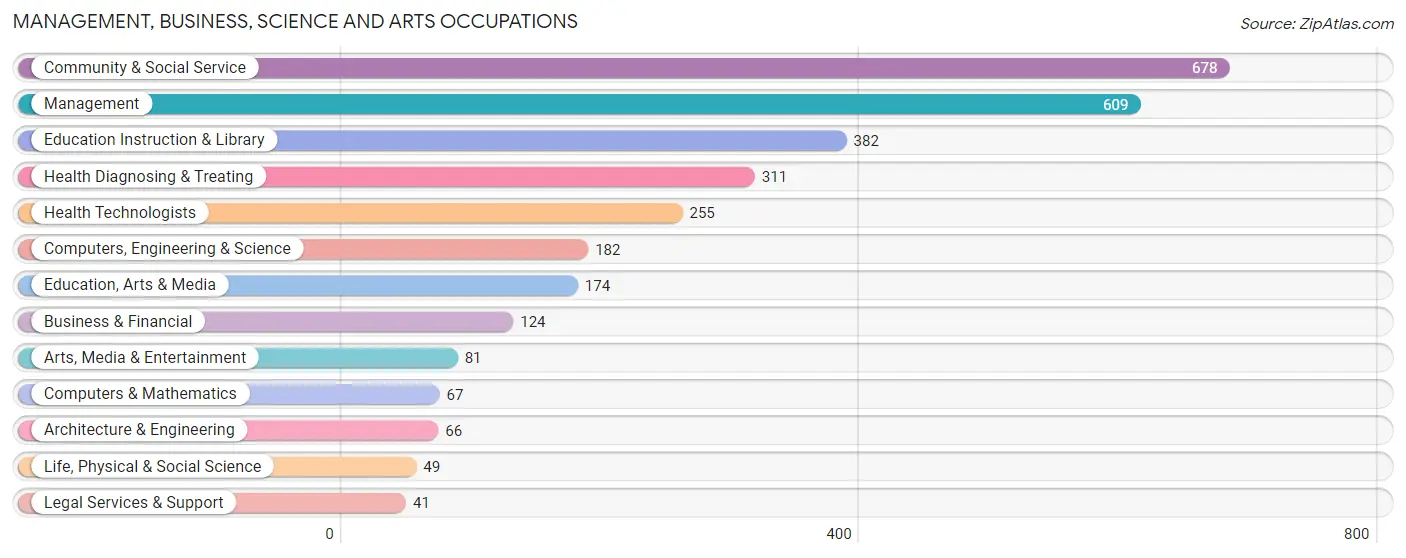
Management, Business, Science and Arts Occupations
The most common Management, Business, Science and Arts occupations in Somers Point are Community & Social Service (678 | 12.8%), Management (609 | 11.5%), Education Instruction & Library (382 | 7.2%), Health Diagnosing & Treating (311 | 5.9%), and Health Technologists (255 | 4.8%).
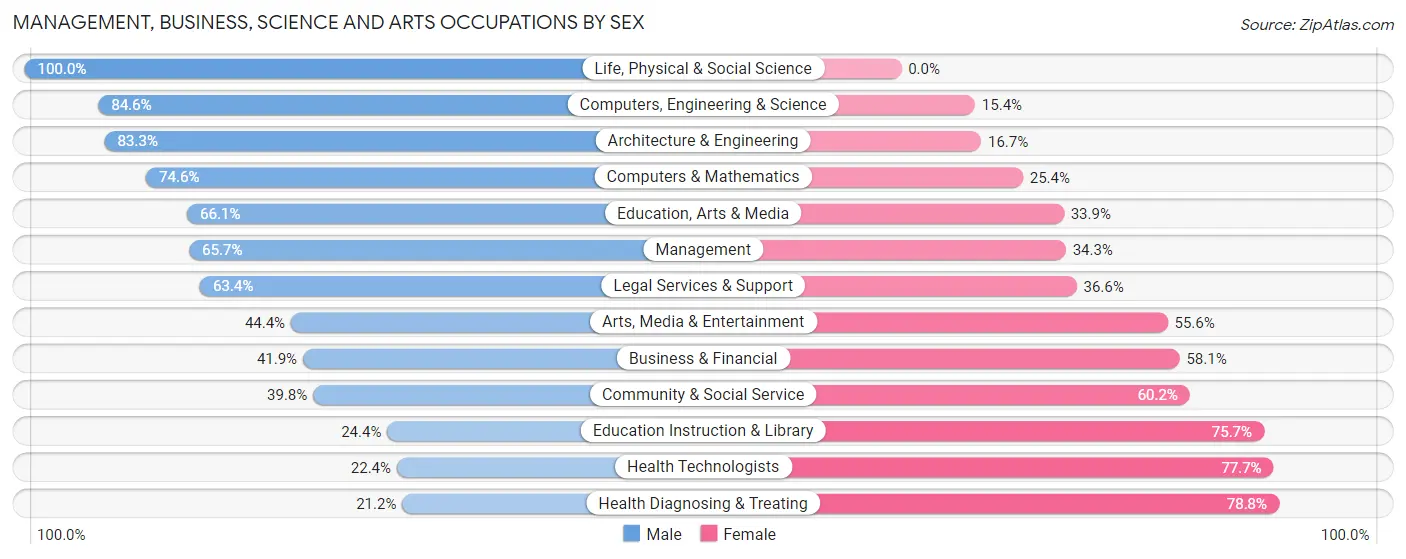
Management, Business, Science and Arts Occupations by Sex
Within the Management, Business, Science and Arts occupations in Somers Point, the most male-oriented occupations are Life, Physical & Social Science (100.0%), Computers, Engineering & Science (84.6%), and Architecture & Engineering (83.3%), while the most female-oriented occupations are Health Diagnosing & Treating (78.8%), Health Technologists (77.6%), and Education Instruction & Library (75.6%).
| Occupation | Male | Female |
| Management | 400 (65.7%) | 209 (34.3%) |
| Business & Financial | 52 (41.9%) | 72 (58.1%) |
| Computers, Engineering & Science | 154 (84.6%) | 28 (15.4%) |
| Computers & Mathematics | 50 (74.6%) | 17 (25.4%) |
| Architecture & Engineering | 55 (83.3%) | 11 (16.7%) |
| Life, Physical & Social Science | 49 (100.0%) | 0 (0.0%) |
| Community & Social Service | 270 (39.8%) | 408 (60.2%) |
| Education, Arts & Media | 115 (66.1%) | 59 (33.9%) |
| Legal Services & Support | 26 (63.4%) | 15 (36.6%) |
| Education Instruction & Library | 93 (24.3%) | 289 (75.6%) |
| Arts, Media & Entertainment | 36 (44.4%) | 45 (55.6%) |
| Health Diagnosing & Treating | 66 (21.2%) | 245 (78.8%) |
| Health Technologists | 57 (22.4%) | 198 (77.6%) |
| Total (Category) | 942 (49.5%) | 962 (50.5%) |
| Total (Overall) | 2,719 (51.3%) | 2,577 (48.7%) |
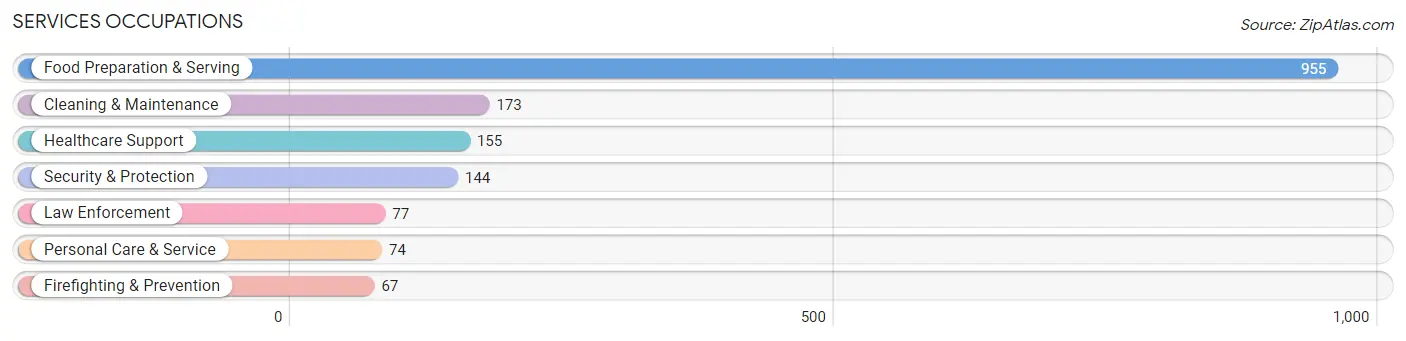
Services Occupations
The most common Services occupations in Somers Point are Food Preparation & Serving (955 | 18.0%), Cleaning & Maintenance (173 | 3.3%), Healthcare Support (155 | 2.9%), Security & Protection (144 | 2.7%), and Law Enforcement (77 | 1.5%).
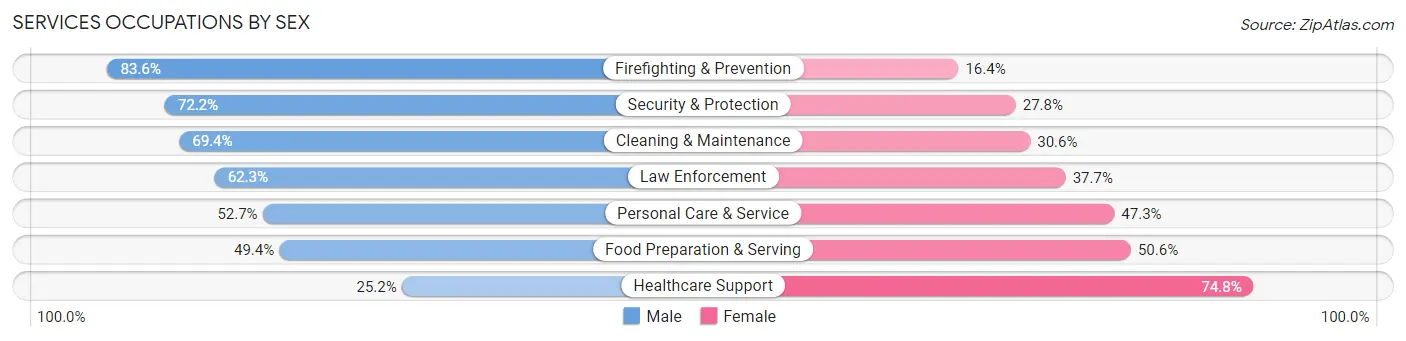
Services Occupations by Sex
Within the Services occupations in Somers Point, the most male-oriented occupations are Firefighting & Prevention (83.6%), Security & Protection (72.2%), and Cleaning & Maintenance (69.4%), while the most female-oriented occupations are Healthcare Support (74.8%), Food Preparation & Serving (50.6%), and Personal Care & Service (47.3%).
| Occupation | Male | Female |
| Healthcare Support | 39 (25.2%) | 116 (74.8%) |
| Security & Protection | 104 (72.2%) | 40 (27.8%) |
| Firefighting & Prevention | 56 (83.6%) | 11 (16.4%) |
| Law Enforcement | 48 (62.3%) | 29 (37.7%) |
| Food Preparation & Serving | 472 (49.4%) | 483 (50.6%) |
| Cleaning & Maintenance | 120 (69.4%) | 53 (30.6%) |
| Personal Care & Service | 39 (52.7%) | 35 (47.3%) |
| Total (Category) | 774 (51.6%) | 727 (48.4%) |
| Total (Overall) | 2,719 (51.3%) | 2,577 (48.7%) |
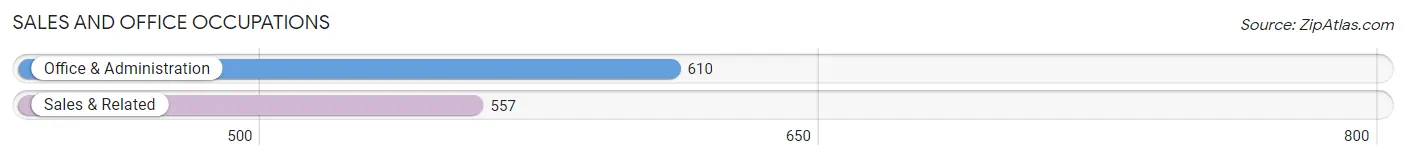
Sales and Office Occupations
The most common Sales and Office occupations in Somers Point are Office & Administration (610 | 11.5%), and Sales & Related (557 | 10.5%).
Sales and Office Occupations by Sex
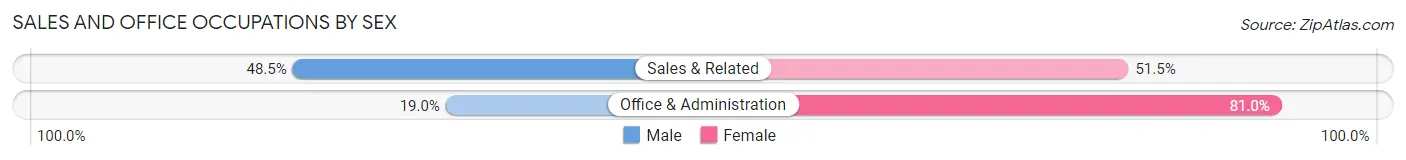
| Occupation | Male | Female |
| Sales & Related | 270 (48.5%) | 287 (51.5%) |
| Office & Administration | 116 (19.0%) | 494 (81.0%) |
| Total (Category) | 386 (33.1%) | 781 (66.9%) |
| Total (Overall) | 2,719 (51.3%) | 2,577 (48.7%) |
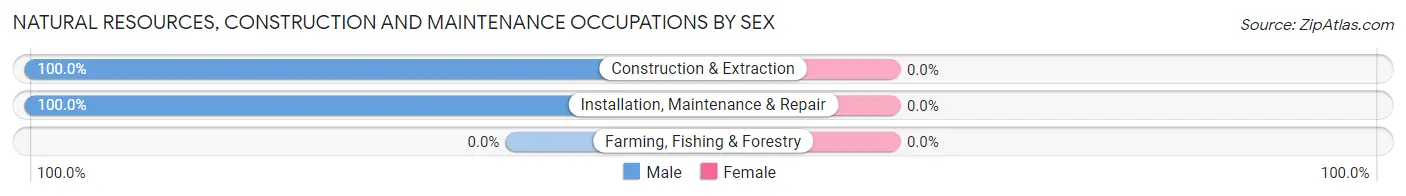
Natural Resources, Construction and Maintenance Occupations
The most common Natural Resources, Construction and Maintenance occupations in Somers Point are Installation, Maintenance & Repair (121 | 2.3%), and Construction & Extraction (102 | 1.9%).

Natural Resources, Construction and Maintenance Occupations by Sex
| Occupation | Male | Female |
| Farming, Fishing & Forestry | 0 (0.0%) | 0 (0.0%) |
| Construction & Extraction | 102 (100.0%) | 0 (0.0%) |
| Installation, Maintenance & Repair | 121 (100.0%) | 0 (0.0%) |
| Total (Category) | 223 (100.0%) | 0 (0.0%) |
| Total (Overall) | 2,719 (51.3%) | 2,577 (48.7%) |
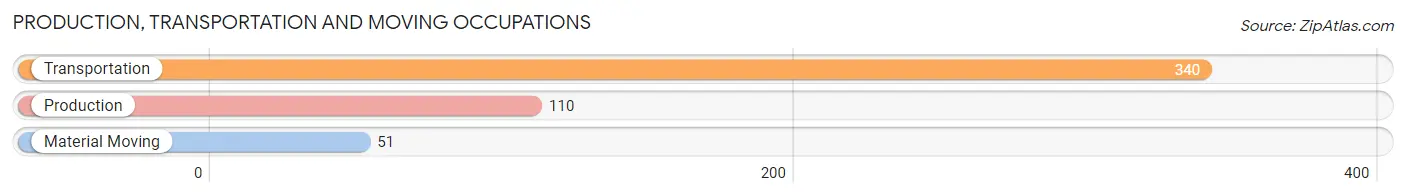
Production, Transportation and Moving Occupations
The most common Production, Transportation and Moving occupations in Somers Point are Transportation (340 | 6.4%), Production (110 | 2.1%), and Material Moving (51 | 1.0%).
Production, Transportation and Moving Occupations by Sex
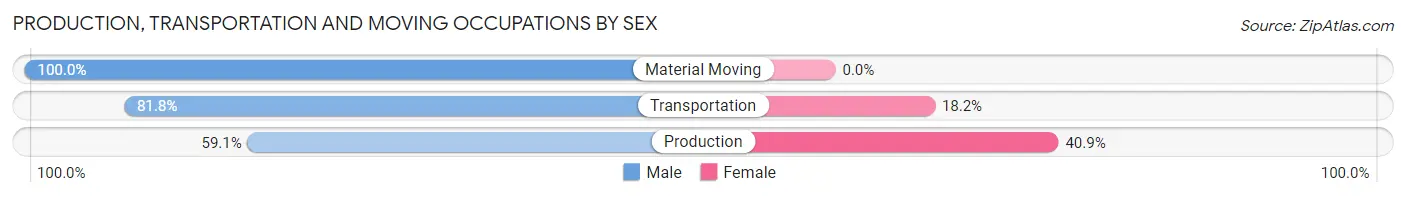
| Occupation | Male | Female |
| Production | 65 (59.1%) | 45 (40.9%) |
| Transportation | 278 (81.8%) | 62 (18.2%) |
| Material Moving | 51 (100.0%) | 0 (0.0%) |
| Total (Category) | 394 (78.6%) | 107 (21.4%) |
| Total (Overall) | 2,719 (51.3%) | 2,577 (48.7%) |
Employment Industries by Sex in Somers Point
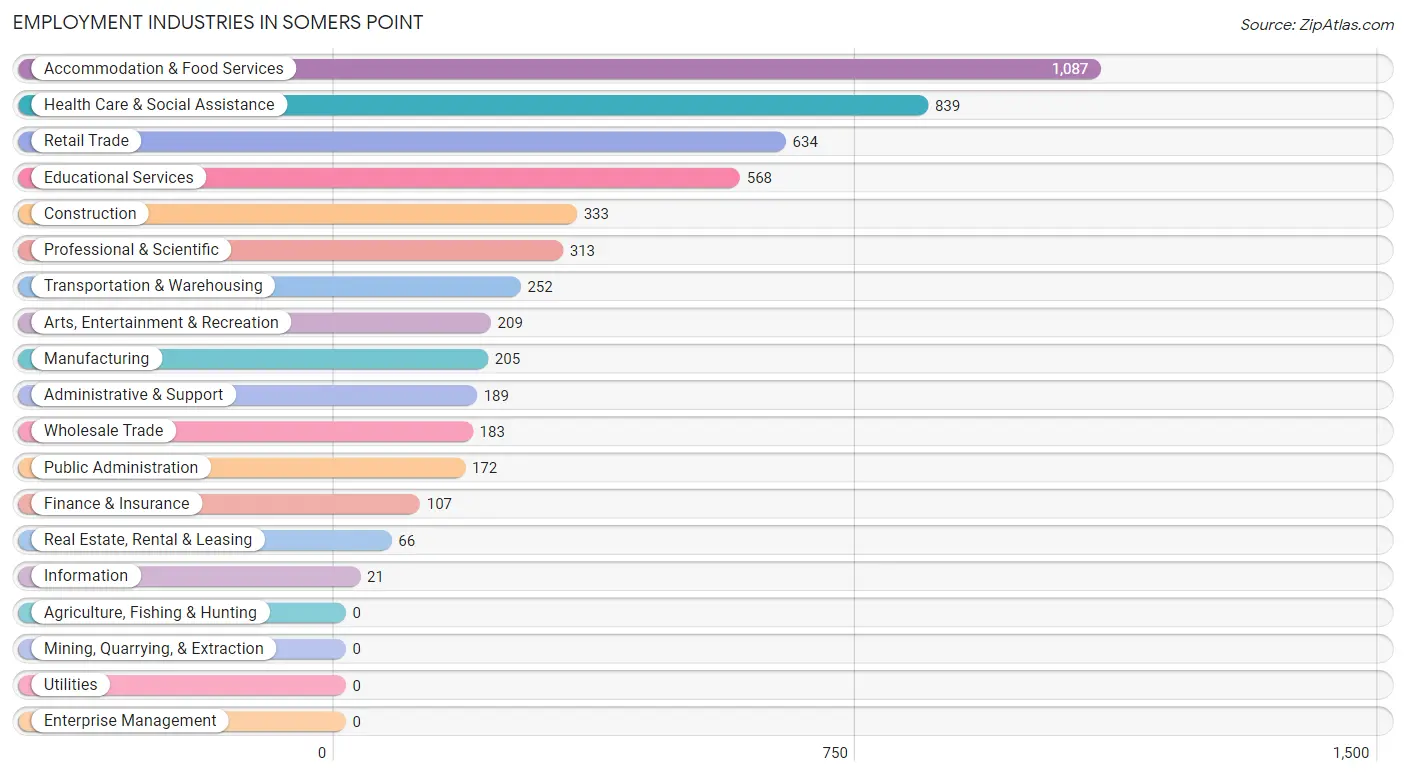
Employment Industries in Somers Point
The major employment industries in Somers Point include Accommodation & Food Services (1,087 | 20.5%), Health Care & Social Assistance (839 | 15.8%), Retail Trade (634 | 12.0%), Educational Services (568 | 10.7%), and Construction (333 | 6.3%).
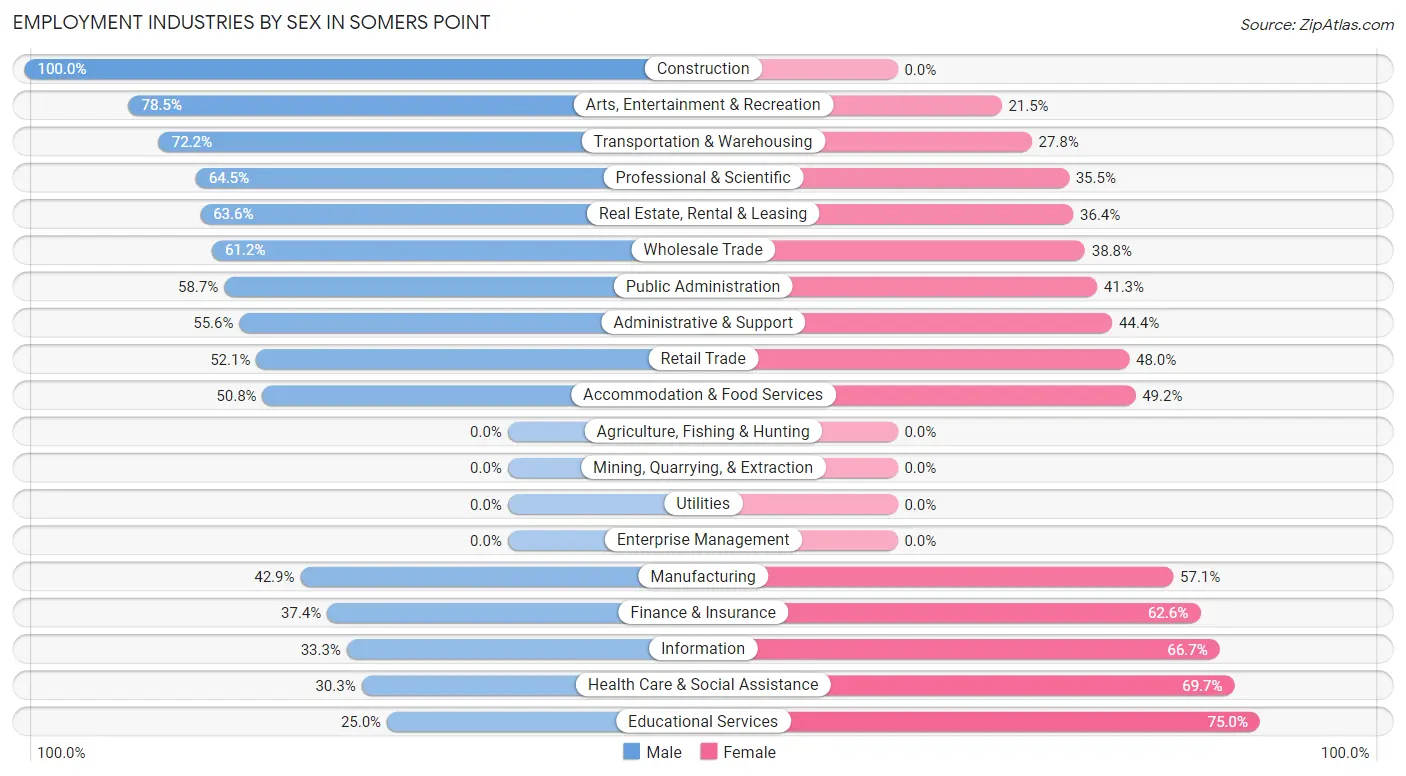
Employment Industries by Sex in Somers Point
The Somers Point industries that see more men than women are Construction (100.0%), Arts, Entertainment & Recreation (78.5%), and Transportation & Warehousing (72.2%), whereas the industries that tend to have a higher number of women are Educational Services (75.0%), Health Care & Social Assistance (69.7%), and Information (66.7%).
| Industry | Male | Female |
| Agriculture, Fishing & Hunting | 0 (0.0%) | 0 (0.0%) |
| Mining, Quarrying, & Extraction | 0 (0.0%) | 0 (0.0%) |
| Construction | 333 (100.0%) | 0 (0.0%) |
| Manufacturing | 88 (42.9%) | 117 (57.1%) |
| Wholesale Trade | 112 (61.2%) | 71 (38.8%) |
| Retail Trade | 330 (52.0%) | 304 (47.9%) |
| Transportation & Warehousing | 182 (72.2%) | 70 (27.8%) |
| Utilities | 0 (0.0%) | 0 (0.0%) |
| Information | 7 (33.3%) | 14 (66.7%) |
| Finance & Insurance | 40 (37.4%) | 67 (62.6%) |
| Real Estate, Rental & Leasing | 42 (63.6%) | 24 (36.4%) |
| Professional & Scientific | 202 (64.5%) | 111 (35.5%) |
| Enterprise Management | 0 (0.0%) | 0 (0.0%) |
| Administrative & Support | 105 (55.6%) | 84 (44.4%) |
| Educational Services | 142 (25.0%) | 426 (75.0%) |
| Health Care & Social Assistance | 254 (30.3%) | 585 (69.7%) |
| Arts, Entertainment & Recreation | 164 (78.5%) | 45 (21.5%) |
| Accommodation & Food Services | 552 (50.8%) | 535 (49.2%) |
| Public Administration | 101 (58.7%) | 71 (41.3%) |
| Total | 2,719 (51.3%) | 2,577 (48.7%) |
Education in Somers Point
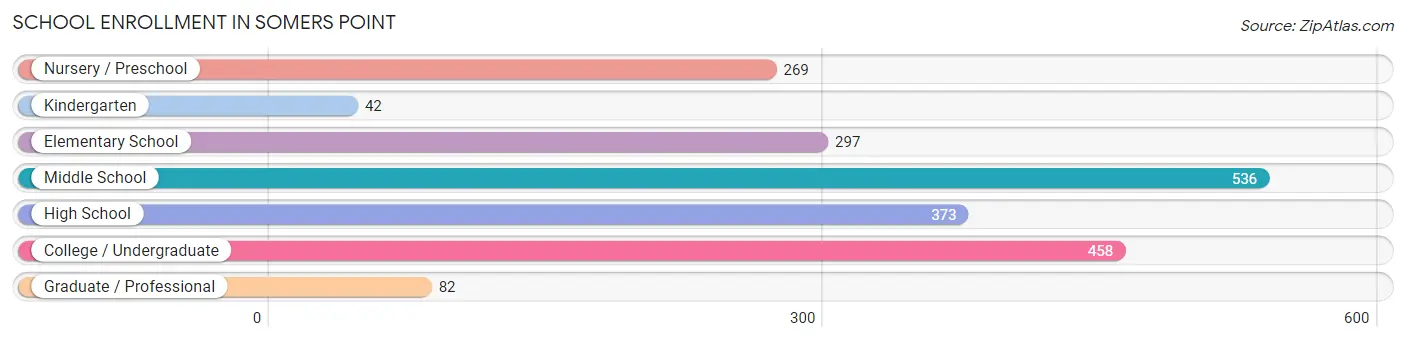
School Enrollment in Somers Point
The most common levels of schooling among the 2,057 students in Somers Point are middle school (536 | 26.1%), college / undergraduate (458 | 22.3%), and high school (373 | 18.1%).
| School Level | # Students | % Students |
| Nursery / Preschool | 269 | 13.1% |
| Kindergarten | 42 | 2.0% |
| Elementary School | 297 | 14.4% |
| Middle School | 536 | 26.1% |
| High School | 373 | 18.1% |
| College / Undergraduate | 458 | 22.3% |
| Graduate / Professional | 82 | 4.0% |
| Total | 2,057 | 100.0% |
School Enrollment by Age by Funding Source in Somers Point
Out of a total of 2,057 students who are enrolled in schools in Somers Point, 130 (6.3%) attend a private institution, while the remaining 1,927 (93.7%) are enrolled in public schools. The age group of 35 years and over has the highest likelihood of being enrolled in private schools, with 10 (18.9% in the age bracket) enrolled. Conversely, the age group of 15 to 17 year olds has the lowest likelihood of being enrolled in a private school, with 297 (100.0% in the age bracket) attending a public institution.
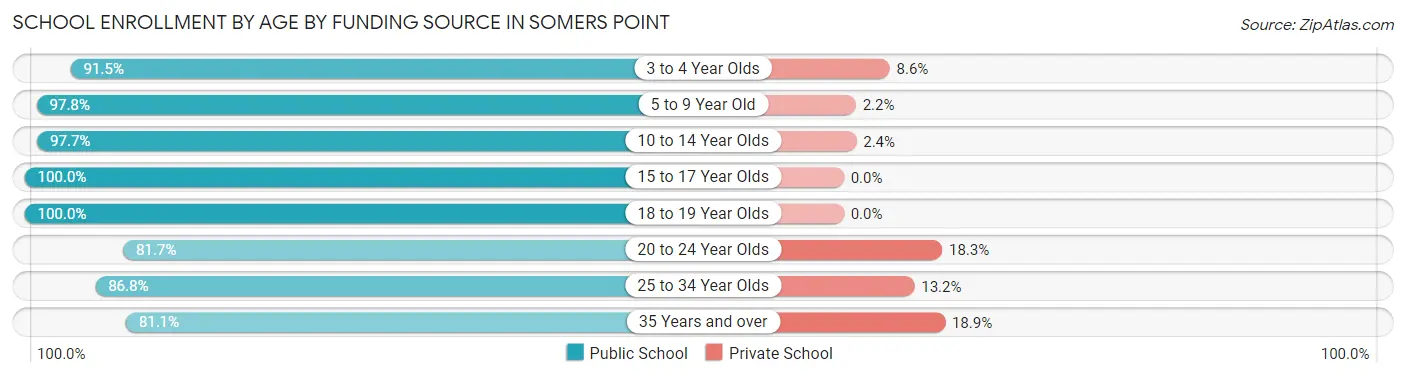
| Age Bracket | Public School | Private School |
| 3 to 4 Year Olds | 246 (91.4%) | 23 (8.6%) |
| 5 to 9 Year Old | 306 (97.8%) | 7 (2.2%) |
| 10 to 14 Year Olds | 623 (97.7%) | 15 (2.4%) |
| 15 to 17 Year Olds | 297 (100.0%) | 0 (0.0%) |
| 18 to 19 Year Olds | 19 (100.0%) | 0 (0.0%) |
| 20 to 24 Year Olds | 196 (81.7%) | 44 (18.3%) |
| 25 to 34 Year Olds | 198 (86.8%) | 30 (13.2%) |
| 35 Years and over | 43 (81.1%) | 10 (18.9%) |
| Total | 1,927 (93.7%) | 130 (6.3%) |
Educational Attainment by Field of Study in Somers Point
Business (425 | 18.8%), education (311 | 13.8%), science & technology (230 | 10.2%), engineering (196 | 8.7%), and bio, nature & agricultural (177 | 7.8%) are the most common fields of study among 2,258 individuals in Somers Point who have obtained a bachelor's degree or higher.
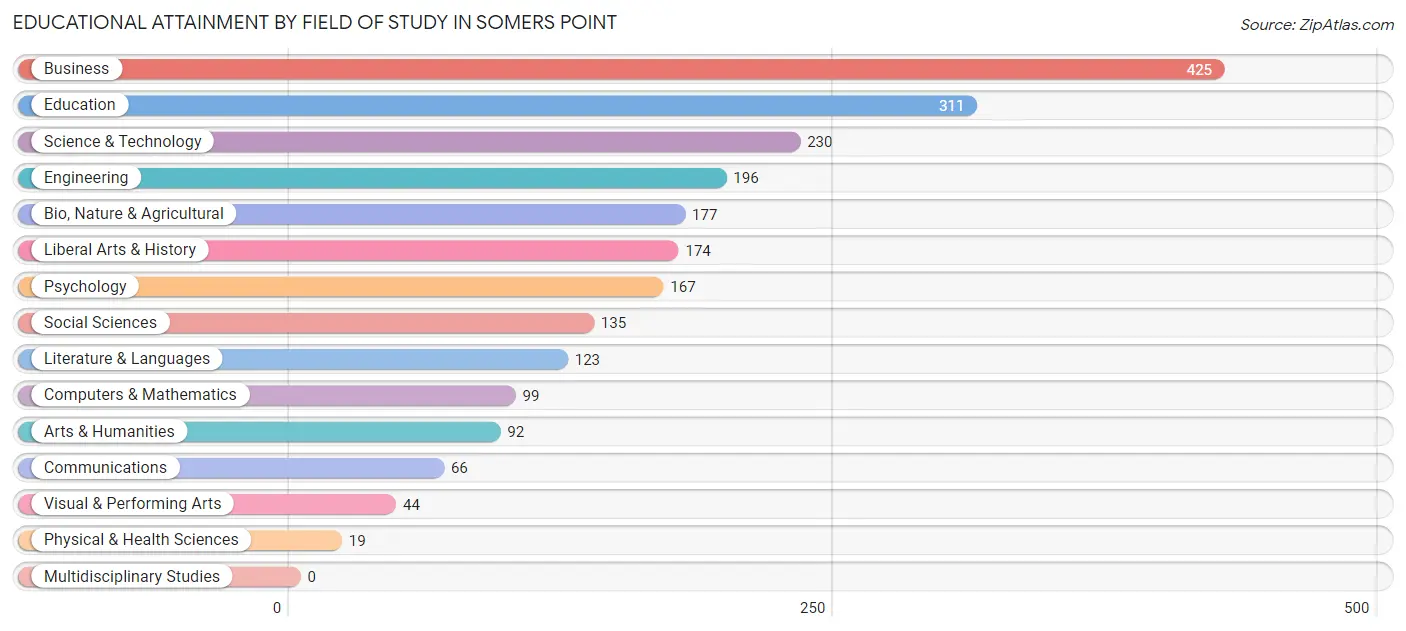
| Field of Study | # Graduates | % Graduates |
| Computers & Mathematics | 99 | 4.4% |
| Bio, Nature & Agricultural | 177 | 7.8% |
| Physical & Health Sciences | 19 | 0.8% |
| Psychology | 167 | 7.4% |
| Social Sciences | 135 | 6.0% |
| Engineering | 196 | 8.7% |
| Multidisciplinary Studies | 0 | 0.0% |
| Science & Technology | 230 | 10.2% |
| Business | 425 | 18.8% |
| Education | 311 | 13.8% |
| Literature & Languages | 123 | 5.4% |
| Liberal Arts & History | 174 | 7.7% |
| Visual & Performing Arts | 44 | 1.9% |
| Communications | 66 | 2.9% |
| Arts & Humanities | 92 | 4.1% |
| Total | 2,258 | 100.0% |
Transportation & Commute in Somers Point
Vehicle Availability by Sex in Somers Point
The most prevalent vehicle ownership categories in Somers Point are males with 2 vehicles (1,168, accounting for 43.4%) and females with 2 vehicles (983, making up 48.0%).
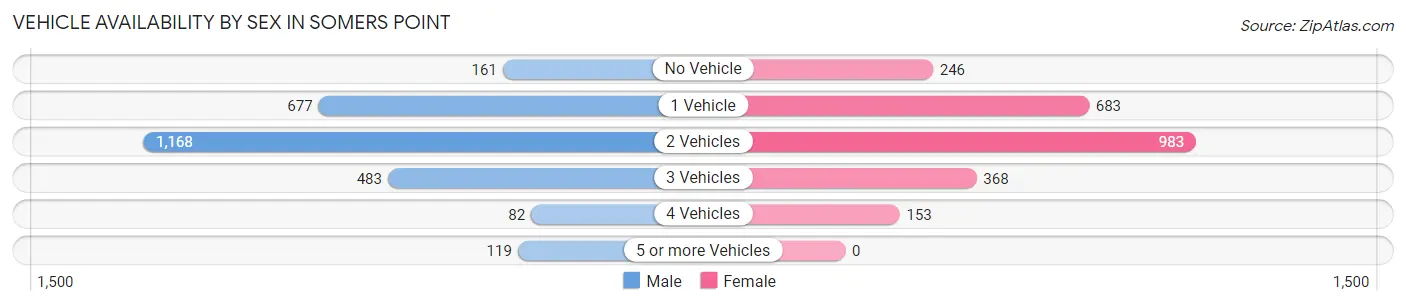
| Vehicles Available | Male | Female |
| No Vehicle | 161 (6.0%) | 246 (10.1%) |
| 1 Vehicle | 677 (25.2%) | 683 (28.1%) |
| 2 Vehicles | 1,168 (43.4%) | 983 (40.4%) |
| 3 Vehicles | 483 (18.0%) | 368 (15.1%) |
| 4 Vehicles | 82 (3.0%) | 153 (6.3%) |
| 5 or more Vehicles | 119 (4.4%) | 0 (0.0%) |
| Total | 2,690 (100.0%) | 2,433 (100.0%) |
Commute Time in Somers Point
The most frequently occuring commute durations in Somers Point are 20 to 24 minutes (906 commuters, 18.8%), 5 to 9 minutes (709 commuters, 14.7%), and 15 to 19 minutes (636 commuters, 13.2%).
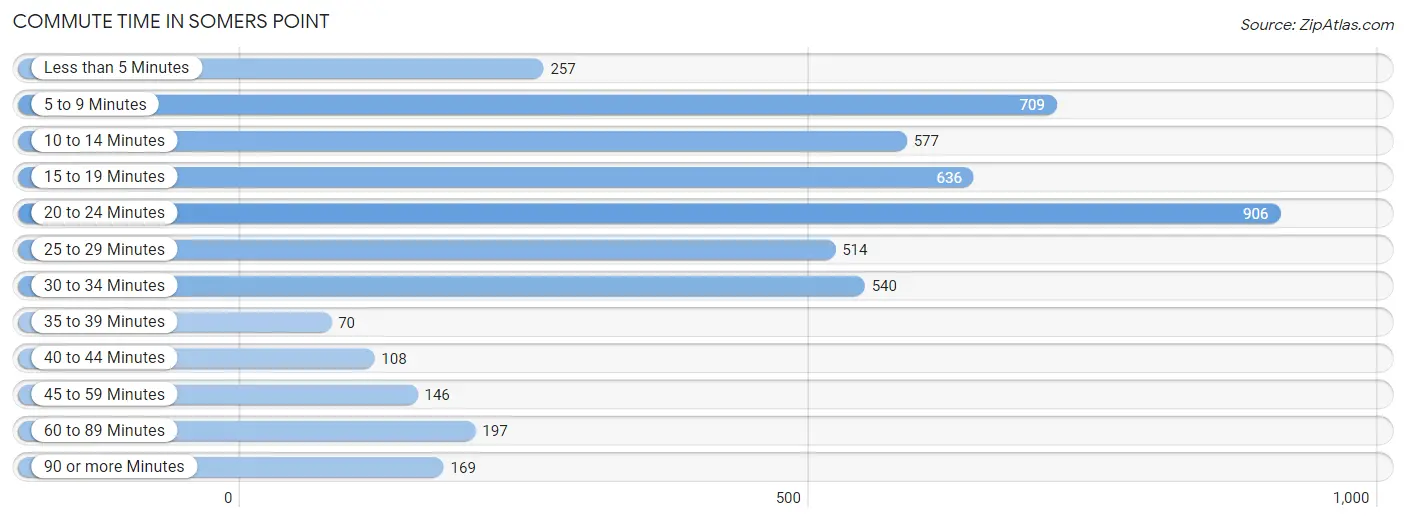
| Commute Time | # Commuters | % Commuters |
| Less than 5 Minutes | 257 | 5.3% |
| 5 to 9 Minutes | 709 | 14.7% |
| 10 to 14 Minutes | 577 | 11.9% |
| 15 to 19 Minutes | 636 | 13.2% |
| 20 to 24 Minutes | 906 | 18.8% |
| 25 to 29 Minutes | 514 | 10.6% |
| 30 to 34 Minutes | 540 | 11.2% |
| 35 to 39 Minutes | 70 | 1.5% |
| 40 to 44 Minutes | 108 | 2.2% |
| 45 to 59 Minutes | 146 | 3.0% |
| 60 to 89 Minutes | 197 | 4.1% |
| 90 or more Minutes | 169 | 3.5% |
Commute Time by Sex in Somers Point
The most common commute times in Somers Point are 20 to 24 minutes (494 commuters, 19.3%) for males and 20 to 24 minutes (412 commuters, 18.1%) for females.
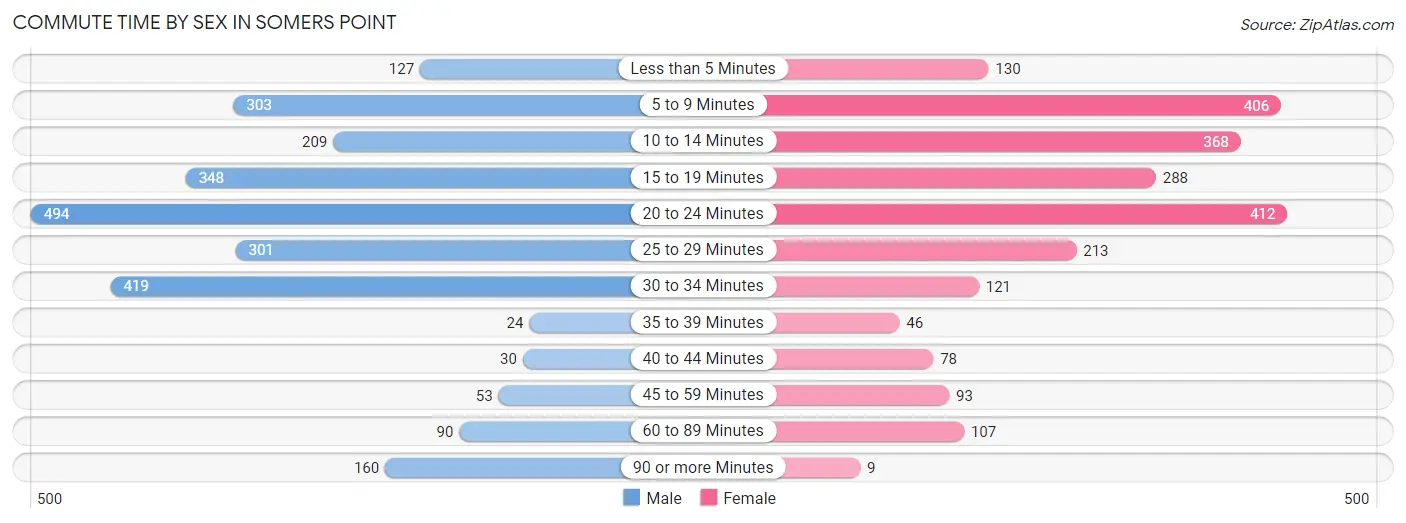
| Commute Time | Male | Female |
| Less than 5 Minutes | 127 (5.0%) | 130 (5.7%) |
| 5 to 9 Minutes | 303 (11.8%) | 406 (17.9%) |
| 10 to 14 Minutes | 209 (8.2%) | 368 (16.2%) |
| 15 to 19 Minutes | 348 (13.6%) | 288 (12.7%) |
| 20 to 24 Minutes | 494 (19.3%) | 412 (18.1%) |
| 25 to 29 Minutes | 301 (11.8%) | 213 (9.4%) |
| 30 to 34 Minutes | 419 (16.4%) | 121 (5.3%) |
| 35 to 39 Minutes | 24 (0.9%) | 46 (2.0%) |
| 40 to 44 Minutes | 30 (1.2%) | 78 (3.4%) |
| 45 to 59 Minutes | 53 (2.1%) | 93 (4.1%) |
| 60 to 89 Minutes | 90 (3.5%) | 107 (4.7%) |
| 90 or more Minutes | 160 (6.2%) | 9 (0.4%) |
Time of Departure to Work by Sex in Somers Point
The most frequent times of departure to work in Somers Point are 12:00 PM to 3:59 PM (441, 17.2%) for males and 7:30 AM to 7:59 AM (482, 21.2%) for females.
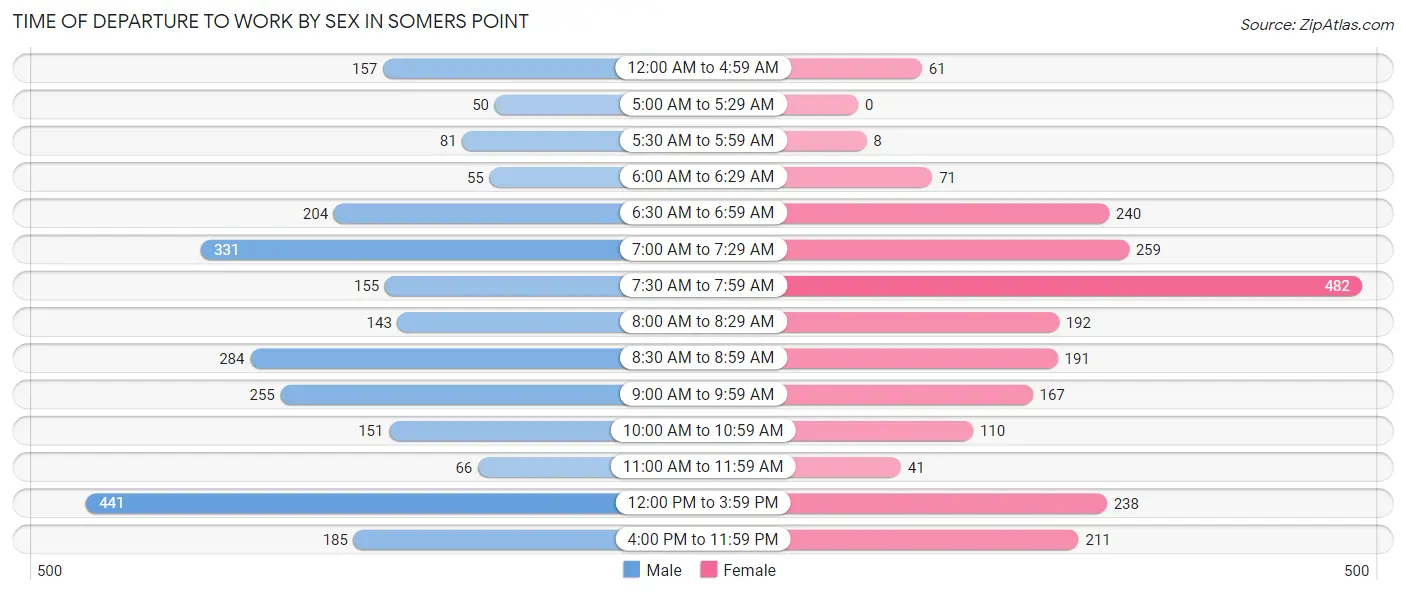
| Time of Departure | Male | Female |
| 12:00 AM to 4:59 AM | 157 (6.1%) | 61 (2.7%) |
| 5:00 AM to 5:29 AM | 50 (1.9%) | 0 (0.0%) |
| 5:30 AM to 5:59 AM | 81 (3.2%) | 8 (0.4%) |
| 6:00 AM to 6:29 AM | 55 (2.1%) | 71 (3.1%) |
| 6:30 AM to 6:59 AM | 204 (8.0%) | 240 (10.6%) |
| 7:00 AM to 7:29 AM | 331 (12.9%) | 259 (11.4%) |
| 7:30 AM to 7:59 AM | 155 (6.1%) | 482 (21.2%) |
| 8:00 AM to 8:29 AM | 143 (5.6%) | 192 (8.5%) |
| 8:30 AM to 8:59 AM | 284 (11.1%) | 191 (8.4%) |
| 9:00 AM to 9:59 AM | 255 (10.0%) | 167 (7.3%) |
| 10:00 AM to 10:59 AM | 151 (5.9%) | 110 (4.8%) |
| 11:00 AM to 11:59 AM | 66 (2.6%) | 41 (1.8%) |
| 12:00 PM to 3:59 PM | 441 (17.2%) | 238 (10.5%) |
| 4:00 PM to 11:59 PM | 185 (7.2%) | 211 (9.3%) |
| Total | 2,558 (100.0%) | 2,271 (100.0%) |
Housing Occupancy in Somers Point
Occupancy by Ownership in Somers Point
Of the total 4,650 dwellings in Somers Point, owner-occupied units account for 2,449 (52.7%), while renter-occupied units make up 2,201 (47.3%).
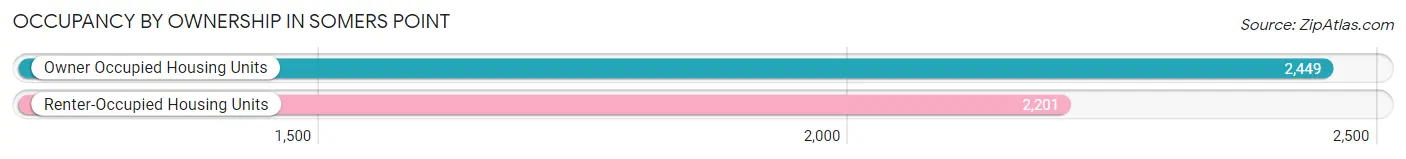
| Occupancy | # Housing Units | % Housing Units |
| Owner Occupied Housing Units | 2,449 | 52.7% |
| Renter-Occupied Housing Units | 2,201 | 47.3% |
| Total Occupied Housing Units | 4,650 | 100.0% |
Occupancy by Household Size in Somers Point
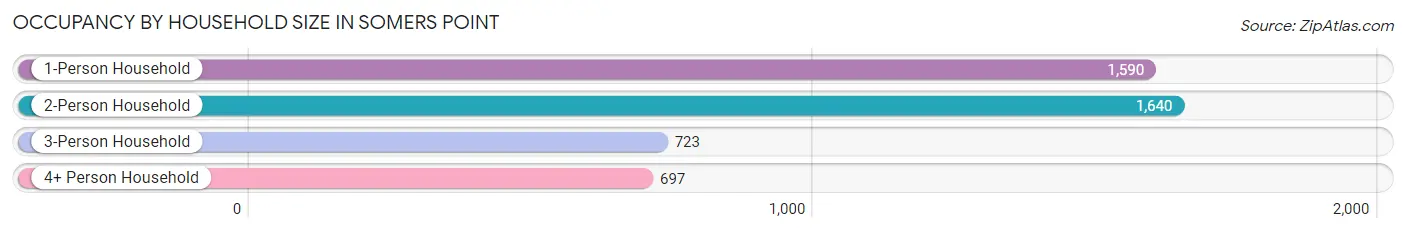
| Household Size | # Housing Units | % Housing Units |
| 1-Person Household | 1,590 | 34.2% |
| 2-Person Household | 1,640 | 35.3% |
| 3-Person Household | 723 | 15.5% |
| 4+ Person Household | 697 | 15.0% |
| Total Housing Units | 4,650 | 100.0% |
Occupancy by Ownership by Household Size in Somers Point
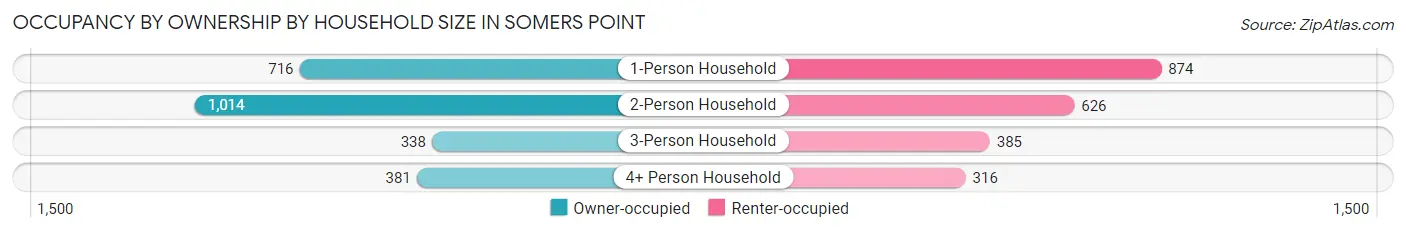
| Household Size | Owner-occupied | Renter-occupied |
| 1-Person Household | 716 (45.0%) | 874 (55.0%) |
| 2-Person Household | 1,014 (61.8%) | 626 (38.2%) |
| 3-Person Household | 338 (46.8%) | 385 (53.2%) |
| 4+ Person Household | 381 (54.7%) | 316 (45.3%) |
| Total Housing Units | 2,449 (52.7%) | 2,201 (47.3%) |
Occupancy by Educational Attainment in Somers Point
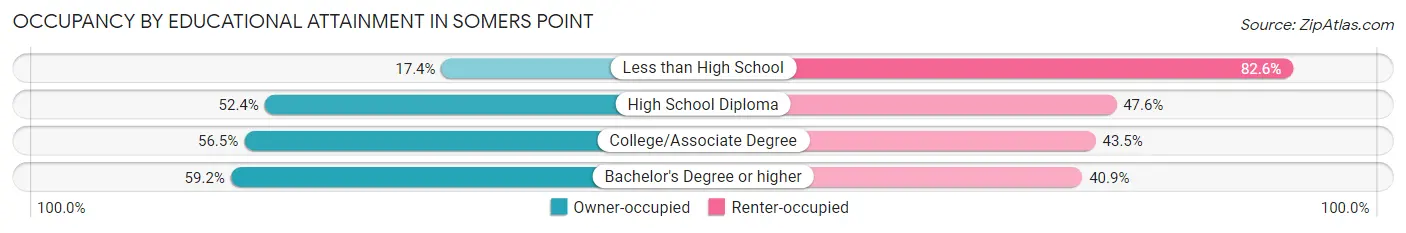
| Household Size | Owner-occupied | Renter-occupied |
| Less than High School | 70 (17.4%) | 333 (82.6%) |
| High School Diploma | 762 (52.4%) | 692 (47.6%) |
| College/Associate Degree | 744 (56.5%) | 573 (43.5%) |
| Bachelor's Degree or higher | 873 (59.2%) | 603 (40.8%) |
Occupancy by Age of Householder in Somers Point
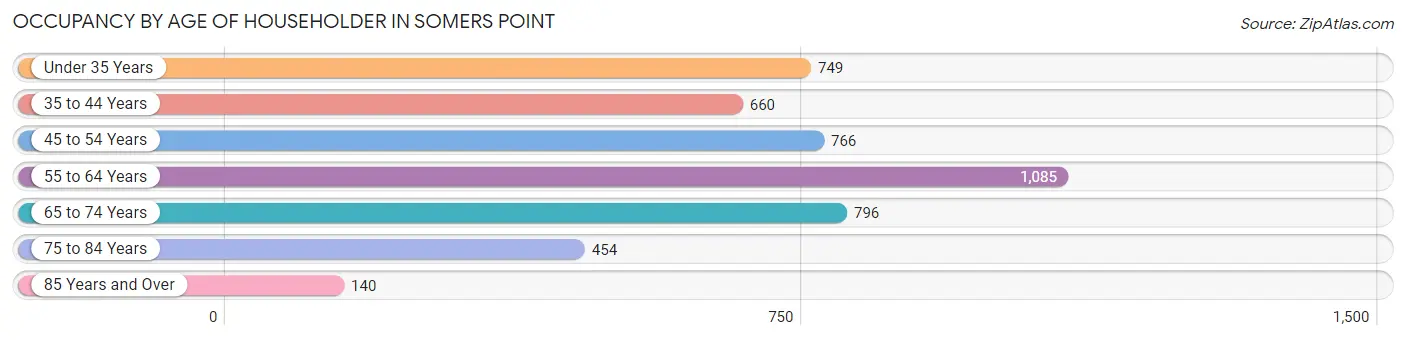
| Age Bracket | # Households | % Households |
| Under 35 Years | 749 | 16.1% |
| 35 to 44 Years | 660 | 14.2% |
| 45 to 54 Years | 766 | 16.5% |
| 55 to 64 Years | 1,085 | 23.3% |
| 65 to 74 Years | 796 | 17.1% |
| 75 to 84 Years | 454 | 9.8% |
| 85 Years and Over | 140 | 3.0% |
| Total | 4,650 | 100.0% |
Housing Finances in Somers Point
Median Income by Occupancy in Somers Point
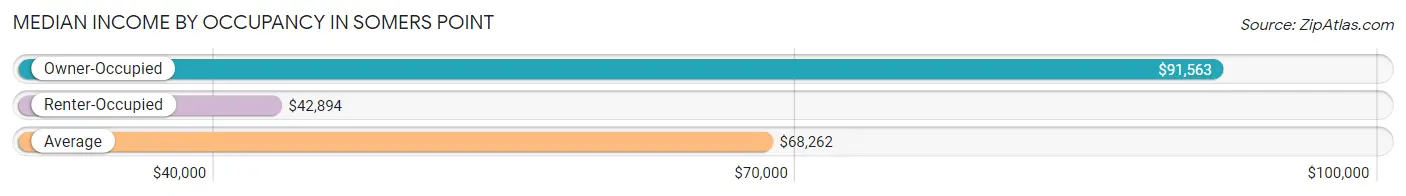
| Occupancy Type | # Households | Median Income |
| Owner-Occupied | 2,449 (52.7%) | $91,563 |
| Renter-Occupied | 2,201 (47.3%) | $42,894 |
| Average | 4,650 (100.0%) | $68,262 |
Occupancy by Householder Income Bracket in Somers Point
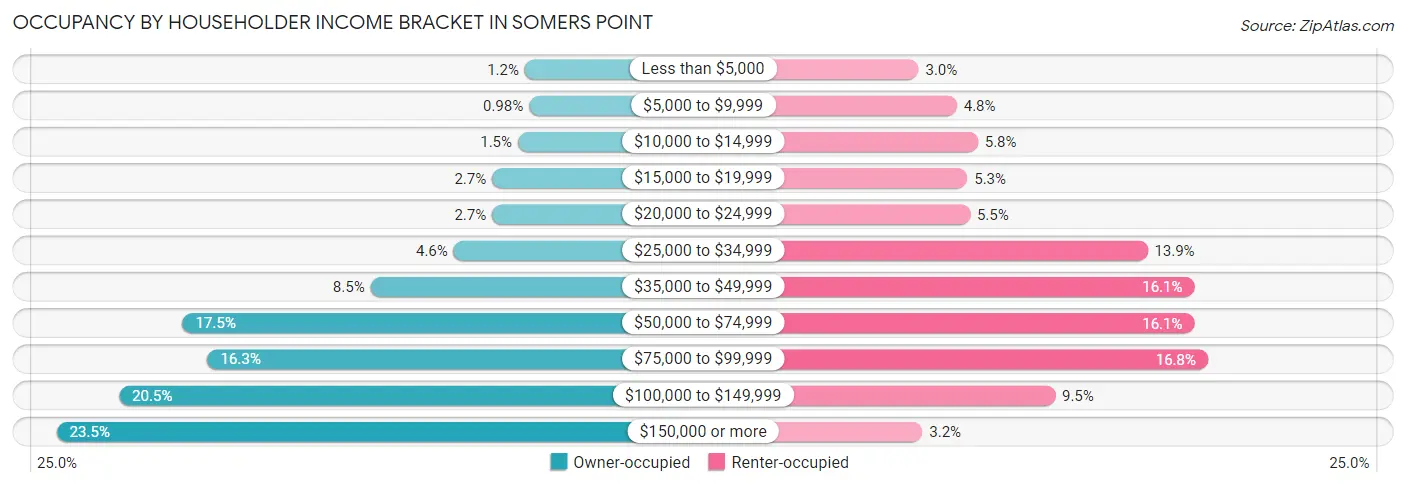
| Income Bracket | Owner-occupied | Renter-occupied |
| Less than $5,000 | 29 (1.2%) | 66 (3.0%) |
| $5,000 to $9,999 | 24 (1.0%) | 106 (4.8%) |
| $10,000 to $14,999 | 37 (1.5%) | 128 (5.8%) |
| $15,000 to $19,999 | 67 (2.7%) | 117 (5.3%) |
| $20,000 to $24,999 | 67 (2.7%) | 120 (5.4%) |
| $25,000 to $34,999 | 112 (4.6%) | 306 (13.9%) |
| $35,000 to $49,999 | 209 (8.5%) | 355 (16.1%) |
| $50,000 to $74,999 | 428 (17.5%) | 355 (16.1%) |
| $75,000 to $99,999 | 399 (16.3%) | 369 (16.8%) |
| $100,000 to $149,999 | 502 (20.5%) | 209 (9.5%) |
| $150,000 or more | 575 (23.5%) | 70 (3.2%) |
| Total | 2,449 (100.0%) | 2,201 (100.0%) |
Monthly Housing Cost Tiers in Somers Point
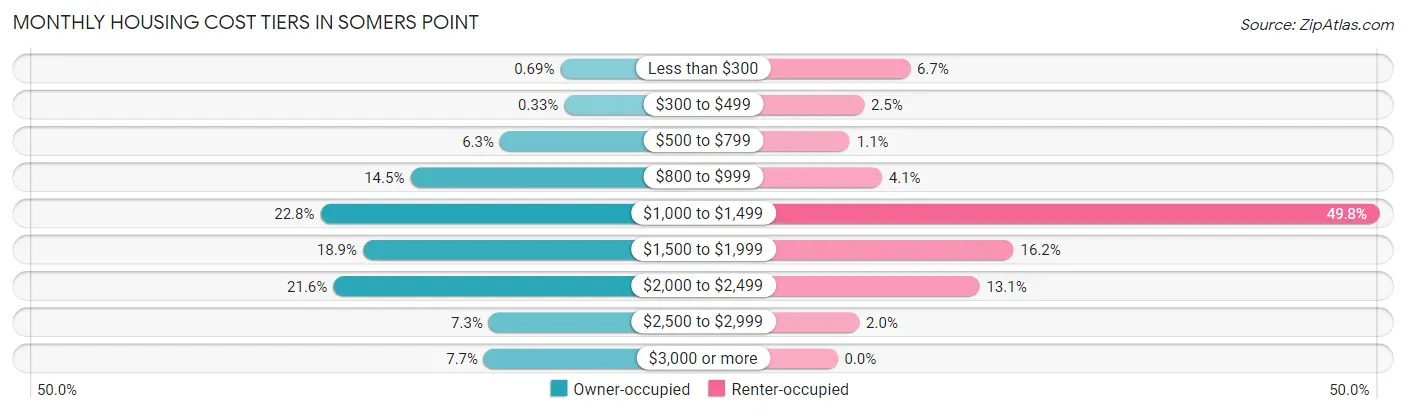
| Monthly Cost | Owner-occupied | Renter-occupied |
| Less than $300 | 17 (0.7%) | 147 (6.7%) |
| $300 to $499 | 8 (0.3%) | 54 (2.5%) |
| $500 to $799 | 153 (6.2%) | 25 (1.1%) |
| $800 to $999 | 355 (14.5%) | 90 (4.1%) |
| $1,000 to $1,499 | 558 (22.8%) | 1,097 (49.8%) |
| $1,500 to $1,999 | 462 (18.9%) | 357 (16.2%) |
| $2,000 to $2,499 | 529 (21.6%) | 288 (13.1%) |
| $2,500 to $2,999 | 178 (7.3%) | 44 (2.0%) |
| $3,000 or more | 189 (7.7%) | 0 (0.0%) |
| Total | 2,449 (100.0%) | 2,201 (100.0%) |
Physical Housing Characteristics in Somers Point
Housing Structures in Somers Point
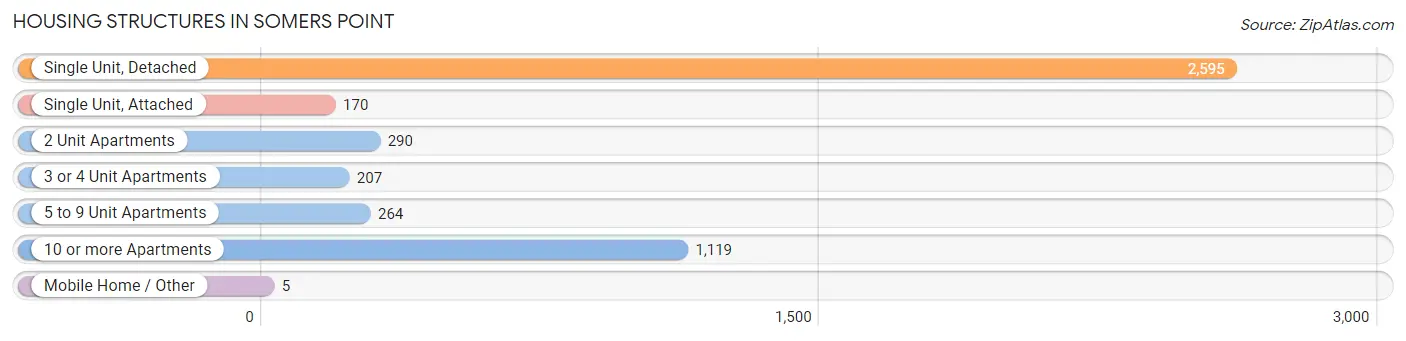
| Structure Type | # Housing Units | % Housing Units |
| Single Unit, Detached | 2,595 | 55.8% |
| Single Unit, Attached | 170 | 3.7% |
| 2 Unit Apartments | 290 | 6.2% |
| 3 or 4 Unit Apartments | 207 | 4.4% |
| 5 to 9 Unit Apartments | 264 | 5.7% |
| 10 or more Apartments | 1,119 | 24.1% |
| Mobile Home / Other | 5 | 0.1% |
| Total | 4,650 | 100.0% |
Housing Structures by Occupancy in Somers Point
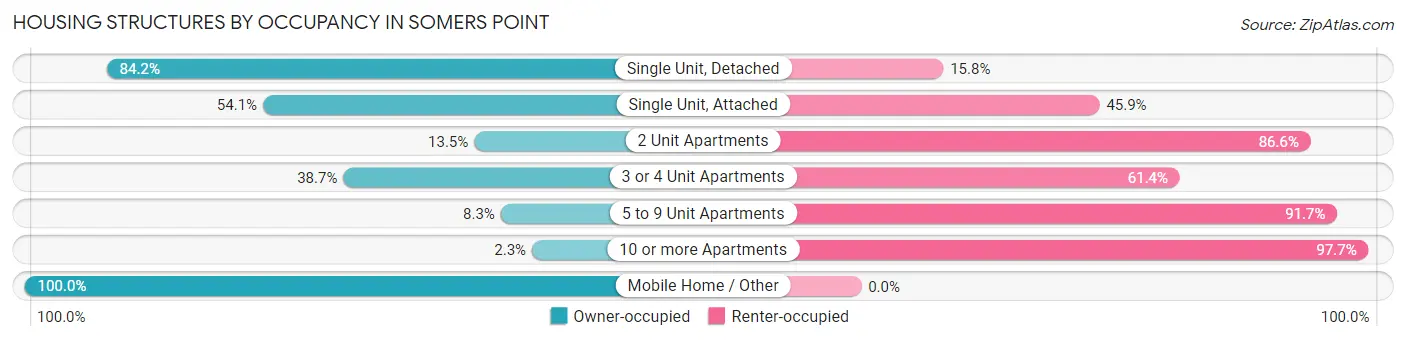
| Structure Type | Owner-occupied | Renter-occupied |
| Single Unit, Detached | 2,185 (84.2%) | 410 (15.8%) |
| Single Unit, Attached | 92 (54.1%) | 78 (45.9%) |
| 2 Unit Apartments | 39 (13.5%) | 251 (86.6%) |
| 3 or 4 Unit Apartments | 80 (38.7%) | 127 (61.4%) |
| 5 to 9 Unit Apartments | 22 (8.3%) | 242 (91.7%) |
| 10 or more Apartments | 26 (2.3%) | 1,093 (97.7%) |
| Mobile Home / Other | 5 (100.0%) | 0 (0.0%) |
| Total | 2,449 (52.7%) | 2,201 (47.3%) |
Housing Structures by Number of Rooms in Somers Point
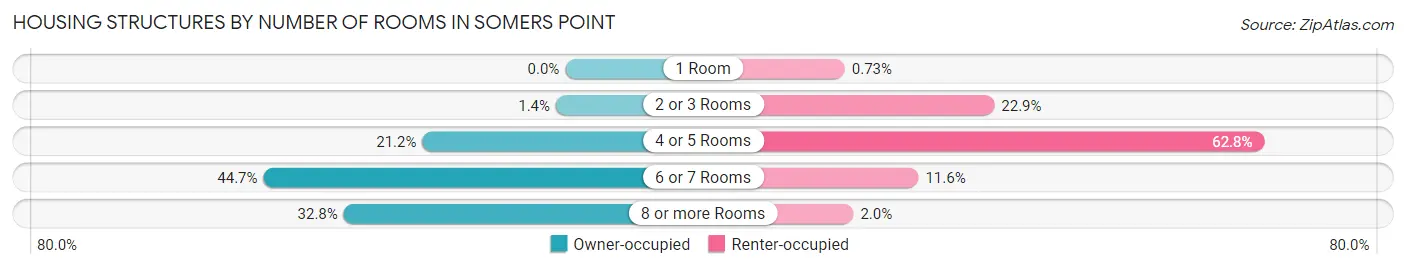
| Number of Rooms | Owner-occupied | Renter-occupied |
| 1 Room | 0 (0.0%) | 16 (0.7%) |
| 2 or 3 Rooms | 34 (1.4%) | 503 (22.9%) |
| 4 or 5 Rooms | 518 (21.1%) | 1,382 (62.8%) |
| 6 or 7 Rooms | 1,094 (44.7%) | 256 (11.6%) |
| 8 or more Rooms | 803 (32.8%) | 44 (2.0%) |
| Total | 2,449 (100.0%) | 2,201 (100.0%) |
Housing Structure by Heating Type in Somers Point
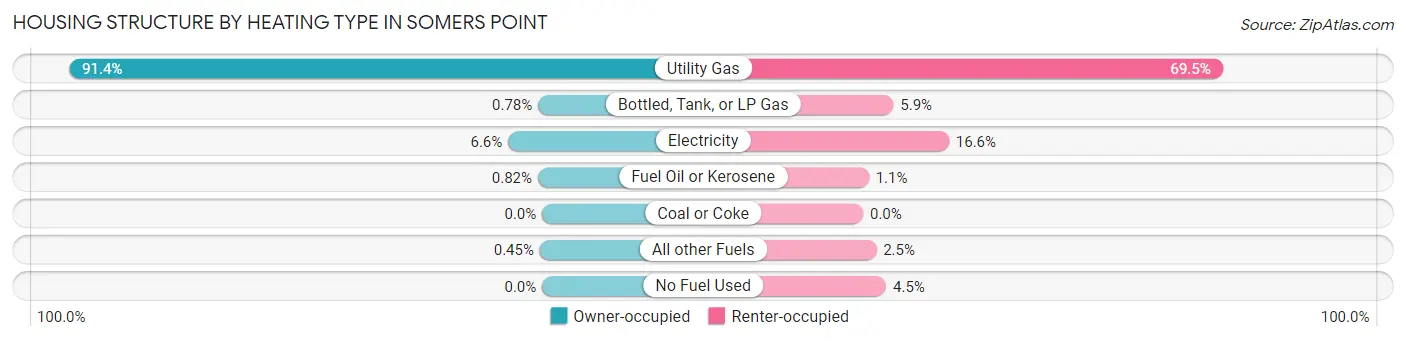
| Heating Type | Owner-occupied | Renter-occupied |
| Utility Gas | 2,238 (91.4%) | 1,529 (69.5%) |
| Bottled, Tank, or LP Gas | 19 (0.8%) | 129 (5.9%) |
| Electricity | 161 (6.6%) | 365 (16.6%) |
| Fuel Oil or Kerosene | 20 (0.8%) | 24 (1.1%) |
| Coal or Coke | 0 (0.0%) | 0 (0.0%) |
| All other Fuels | 11 (0.4%) | 56 (2.5%) |
| No Fuel Used | 0 (0.0%) | 98 (4.4%) |
| Total | 2,449 (100.0%) | 2,201 (100.0%) |
Household Vehicle Usage in Somers Point
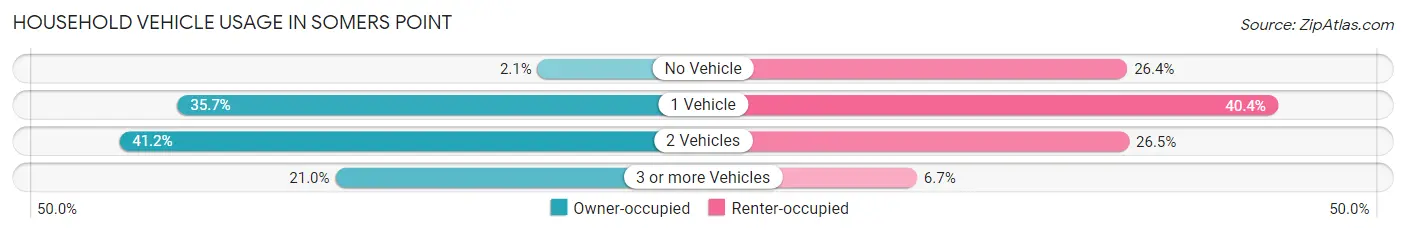
| Vehicles per Household | Owner-occupied | Renter-occupied |
| No Vehicle | 52 (2.1%) | 580 (26.4%) |
| 1 Vehicle | 875 (35.7%) | 889 (40.4%) |
| 2 Vehicles | 1,008 (41.2%) | 584 (26.5%) |
| 3 or more Vehicles | 514 (21.0%) | 148 (6.7%) |
| Total | 2,449 (100.0%) | 2,201 (100.0%) |
Real Estate & Mortgages in Somers Point
Real Estate and Mortgage Overview in Somers Point
| Characteristic | Without Mortgage | With Mortgage |
| Housing Units | 1,126 | 1,323 |
| Median Property Value | $255,700 | $248,100 |
| Median Household Income | $83,723 | $367 |
| Monthly Housing Costs | $1,037 | $182 |
| Real Estate Taxes | $6,931 | $21 |
Property Value by Mortgage Status in Somers Point
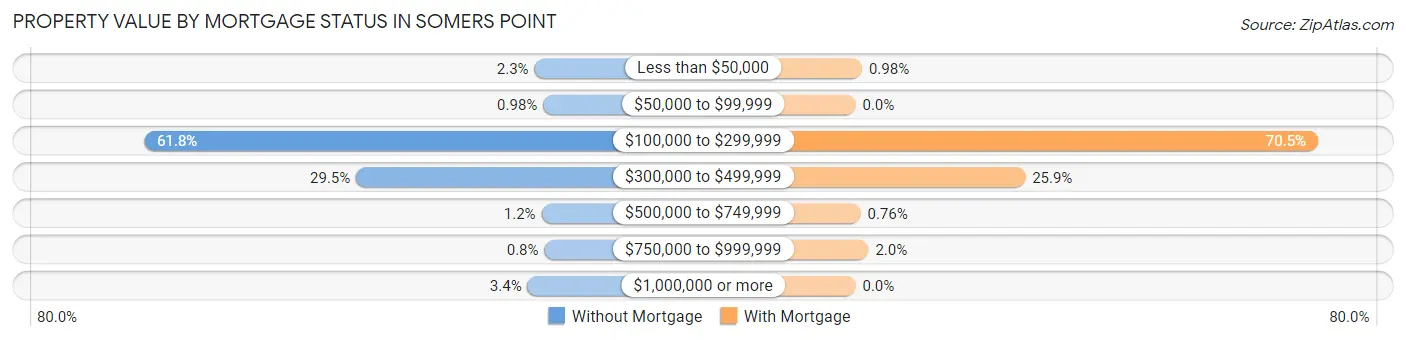
| Property Value | Without Mortgage | With Mortgage |
| Less than $50,000 | 26 (2.3%) | 13 (1.0%) |
| $50,000 to $99,999 | 11 (1.0%) | 0 (0.0%) |
| $100,000 to $299,999 | 696 (61.8%) | 932 (70.5%) |
| $300,000 to $499,999 | 332 (29.5%) | 342 (25.9%) |
| $500,000 to $749,999 | 14 (1.2%) | 10 (0.8%) |
| $750,000 to $999,999 | 9 (0.8%) | 26 (2.0%) |
| $1,000,000 or more | 38 (3.4%) | 0 (0.0%) |
| Total | 1,126 (100.0%) | 1,323 (100.0%) |
Household Income by Mortgage Status in Somers Point
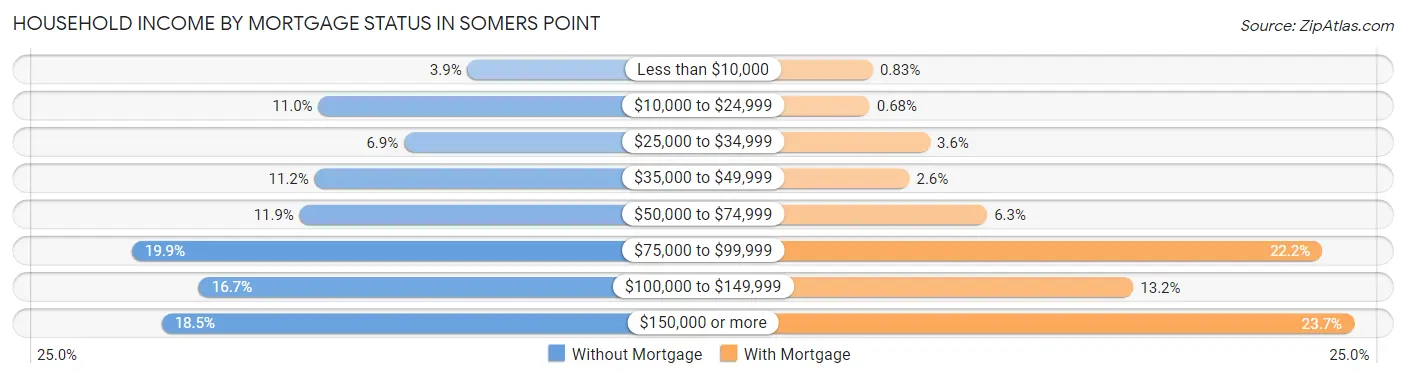
| Household Income | Without Mortgage | With Mortgage |
| Less than $10,000 | 44 (3.9%) | 11 (0.8%) |
| $10,000 to $24,999 | 124 (11.0%) | 9 (0.7%) |
| $25,000 to $34,999 | 78 (6.9%) | 47 (3.5%) |
| $35,000 to $49,999 | 126 (11.2%) | 34 (2.6%) |
| $50,000 to $74,999 | 134 (11.9%) | 83 (6.3%) |
| $75,000 to $99,999 | 224 (19.9%) | 294 (22.2%) |
| $100,000 to $149,999 | 188 (16.7%) | 175 (13.2%) |
| $150,000 or more | 208 (18.5%) | 314 (23.7%) |
| Total | 1,126 (100.0%) | 1,323 (100.0%) |
Property Value to Household Income Ratio in Somers Point
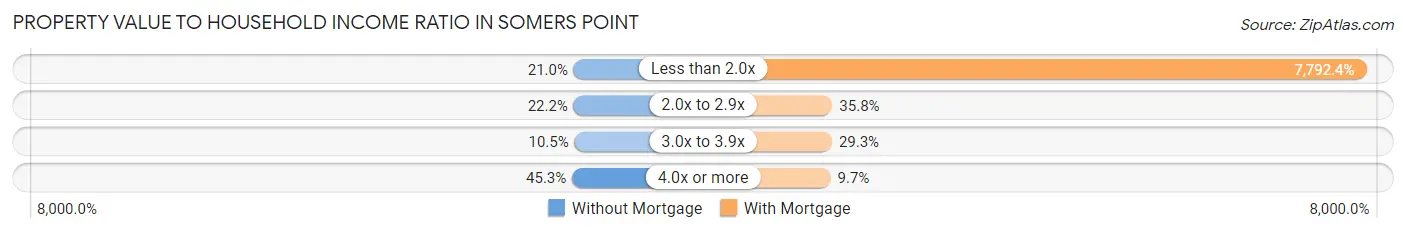
| Value-to-Income Ratio | Without Mortgage | With Mortgage |
| Less than 2.0x | 236 (21.0%) | 103,094 (7,792.4%) |
| 2.0x to 2.9x | 250 (22.2%) | 474 (35.8%) |
| 3.0x to 3.9x | 118 (10.5%) | 388 (29.3%) |
| 4.0x or more | 510 (45.3%) | 128 (9.7%) |
| Total | 1,126 (100.0%) | 1,323 (100.0%) |
Real Estate Taxes by Mortgage Status in Somers Point
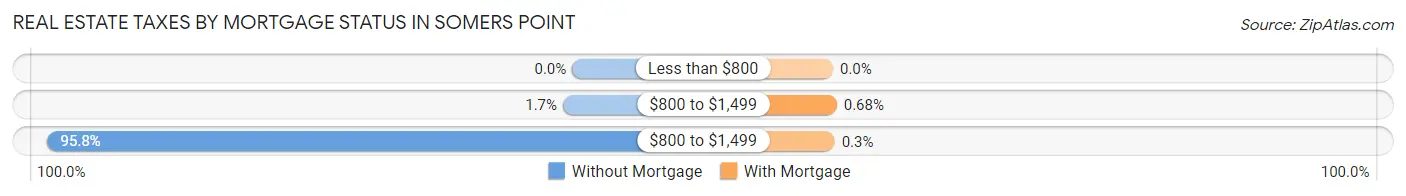
| Property Taxes | Without Mortgage | With Mortgage |
| Less than $800 | 0 (0.0%) | 0 (0.0%) |
| $800 to $1,499 | 19 (1.7%) | 9 (0.7%) |
| $800 to $1,499 | 1,079 (95.8%) | 4 (0.3%) |
| Total | 1,126 (100.0%) | 1,323 (100.0%) |
Health & Disability in Somers Point
Health Insurance Coverage by Age in Somers Point
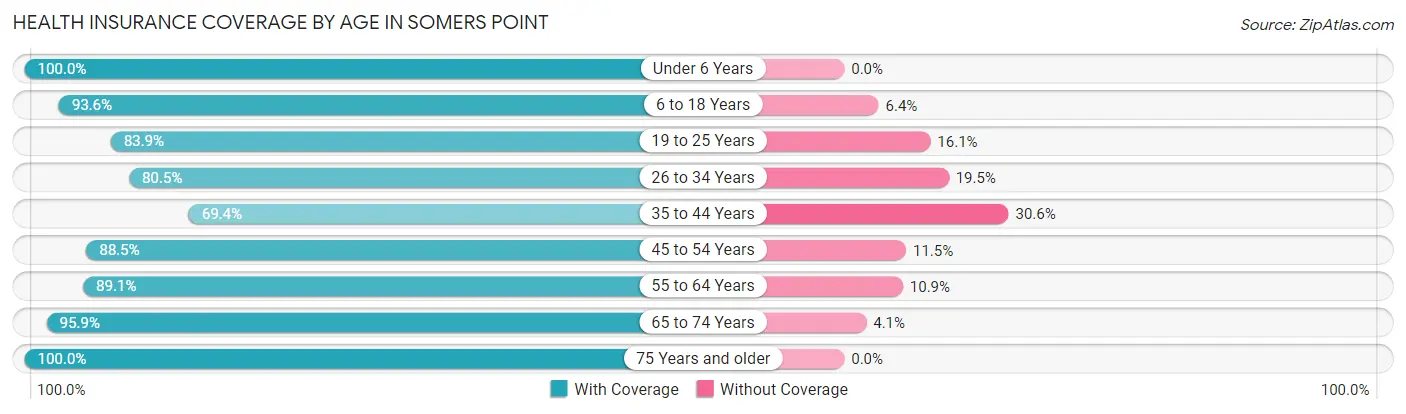
| Age Bracket | With Coverage | Without Coverage |
| Under 6 Years | 831 (100.0%) | 0 (0.0%) |
| 6 to 18 Years | 1,230 (93.6%) | 84 (6.4%) |
| 19 to 25 Years | 826 (83.9%) | 158 (16.1%) |
| 26 to 34 Years | 823 (80.5%) | 199 (19.5%) |
| 35 to 44 Years | 804 (69.4%) | 355 (30.6%) |
| 45 to 54 Years | 1,330 (88.5%) | 173 (11.5%) |
| 55 to 64 Years | 1,477 (89.1%) | 181 (10.9%) |
| 65 to 74 Years | 1,077 (95.9%) | 46 (4.1%) |
| 75 Years and older | 873 (100.0%) | 0 (0.0%) |
| Total | 9,271 (88.6%) | 1,196 (11.4%) |
Health Insurance Coverage by Citizenship Status in Somers Point
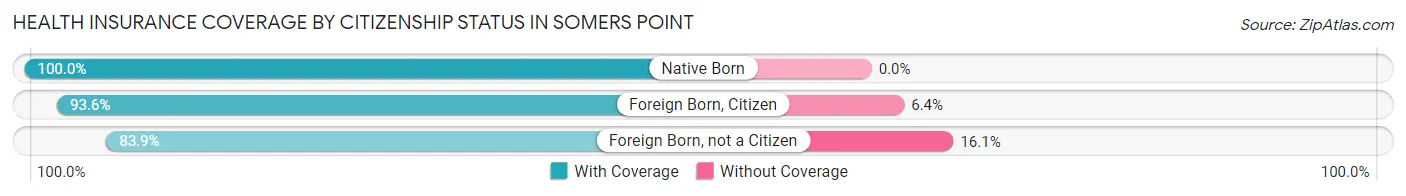
| Citizenship Status | With Coverage | Without Coverage |
| Native Born | 831 (100.0%) | 0 (0.0%) |
| Foreign Born, Citizen | 1,230 (93.6%) | 84 (6.4%) |
| Foreign Born, not a Citizen | 826 (83.9%) | 158 (16.1%) |
Health Insurance Coverage by Household Income in Somers Point
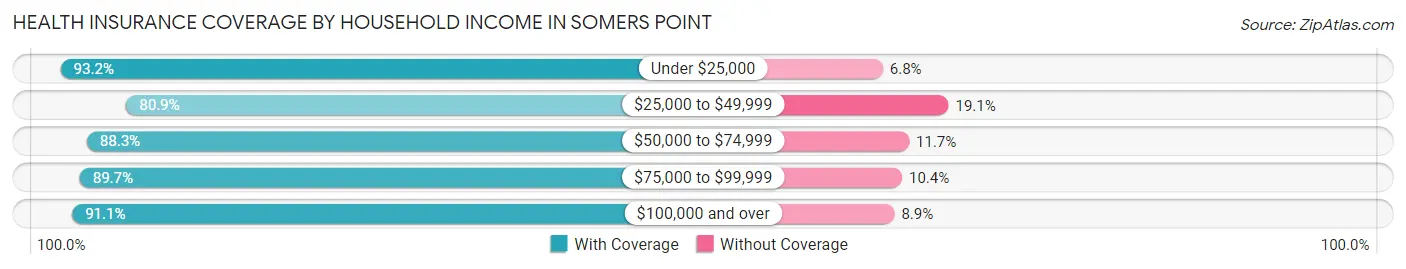
| Household Income | With Coverage | Without Coverage |
| Under $25,000 | 1,062 (93.2%) | 77 (6.8%) |
| $25,000 to $49,999 | 1,655 (80.9%) | 390 (19.1%) |
| $50,000 to $74,999 | 1,679 (88.3%) | 222 (11.7%) |
| $75,000 to $99,999 | 1,759 (89.6%) | 203 (10.3%) |
| $100,000 and over | 3,101 (91.1%) | 304 (8.9%) |
Public vs Private Health Insurance Coverage by Age in Somers Point
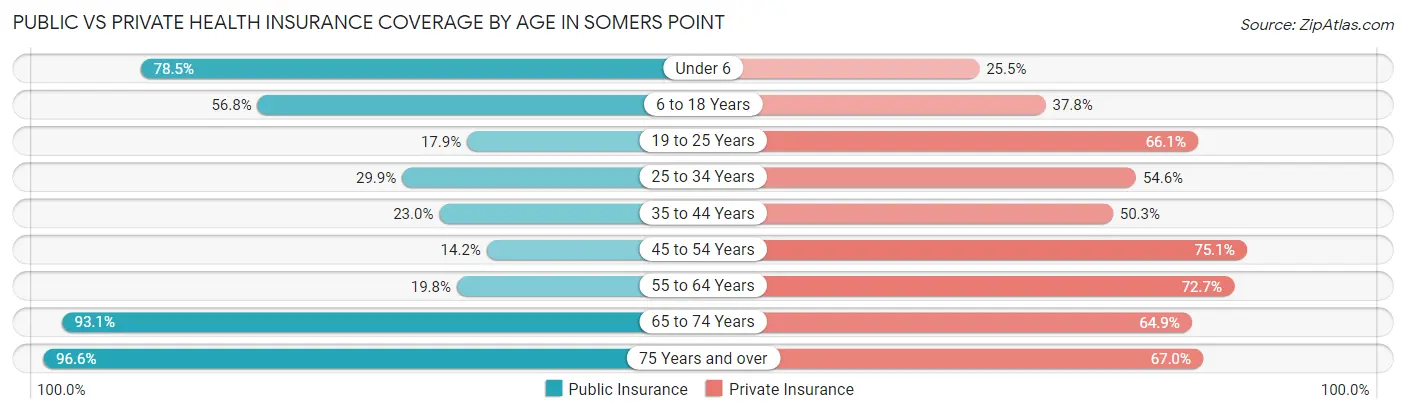
| Age Bracket | Public Insurance | Private Insurance |
| Under 6 | 652 (78.5%) | 212 (25.5%) |
| 6 to 18 Years | 746 (56.8%) | 497 (37.8%) |
| 19 to 25 Years | 176 (17.9%) | 650 (66.1%) |
| 25 to 34 Years | 306 (29.9%) | 558 (54.6%) |
| 35 to 44 Years | 267 (23.0%) | 583 (50.3%) |
| 45 to 54 Years | 214 (14.2%) | 1,129 (75.1%) |
| 55 to 64 Years | 328 (19.8%) | 1,206 (72.7%) |
| 65 to 74 Years | 1,046 (93.1%) | 729 (64.9%) |
| 75 Years and over | 843 (96.6%) | 585 (67.0%) |
| Total | 4,578 (43.7%) | 6,149 (58.8%) |
Disability Status by Sex by Age in Somers Point
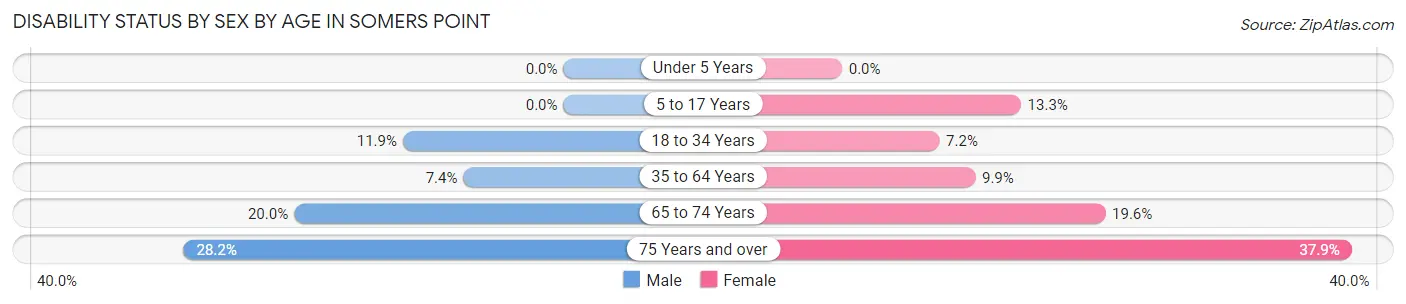
| Age Bracket | Male | Female |
| Under 5 Years | 0 (0.0%) | 0 (0.0%) |
| 5 to 17 Years | 0 (0.0%) | 96 (13.3%) |
| 18 to 34 Years | 128 (11.9%) | 71 (7.2%) |
| 35 to 64 Years | 149 (7.4%) | 229 (9.9%) |
| 65 to 74 Years | 109 (20.0%) | 113 (19.6%) |
| 75 Years and over | 86 (28.2%) | 215 (37.9%) |
Disability Class by Sex by Age in Somers Point
Disability Class: Hearing Difficulty
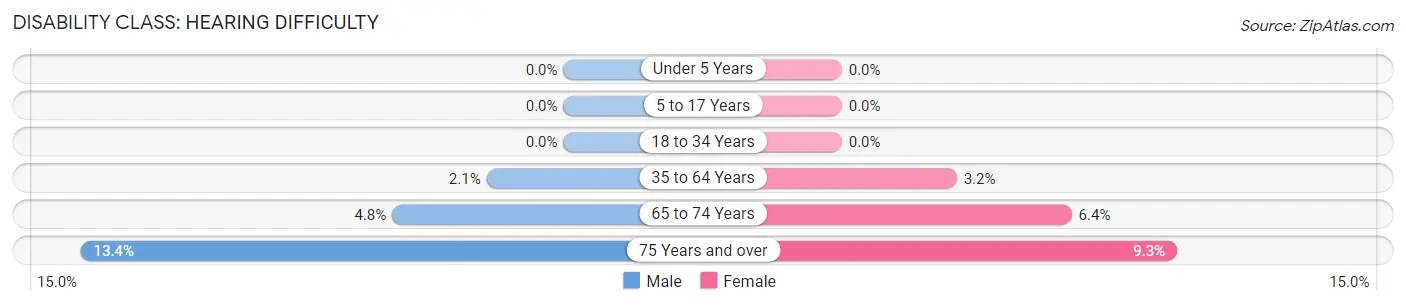
| Age Bracket | Male | Female |
| Under 5 Years | 0 (0.0%) | 0 (0.0%) |
| 5 to 17 Years | 0 (0.0%) | 0 (0.0%) |
| 18 to 34 Years | 0 (0.0%) | 0 (0.0%) |
| 35 to 64 Years | 43 (2.1%) | 74 (3.2%) |
| 65 to 74 Years | 26 (4.8%) | 37 (6.4%) |
| 75 Years and over | 41 (13.4%) | 53 (9.3%) |
Disability Class: Vision Difficulty
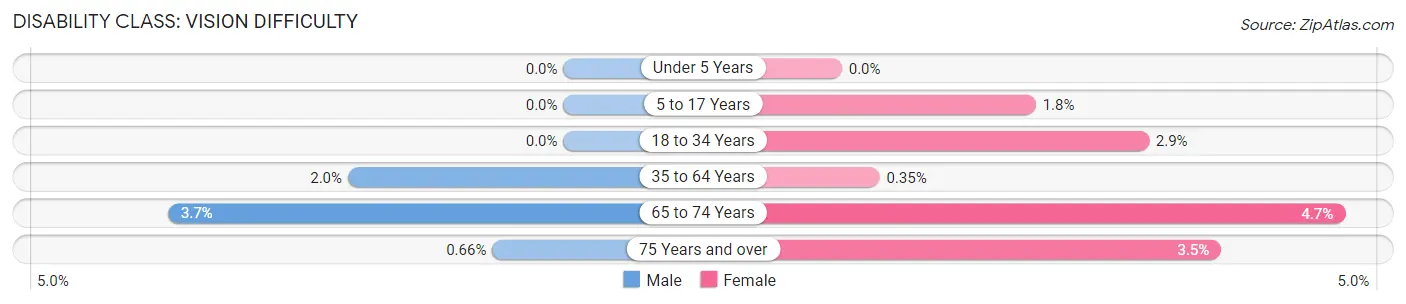
| Age Bracket | Male | Female |
| Under 5 Years | 0 (0.0%) | 0 (0.0%) |
| 5 to 17 Years | 0 (0.0%) | 13 (1.8%) |
| 18 to 34 Years | 0 (0.0%) | 28 (2.9%) |
| 35 to 64 Years | 40 (2.0%) | 8 (0.4%) |
| 65 to 74 Years | 20 (3.7%) | 27 (4.7%) |
| 75 Years and over | 2 (0.7%) | 20 (3.5%) |
Disability Class: Cognitive Difficulty
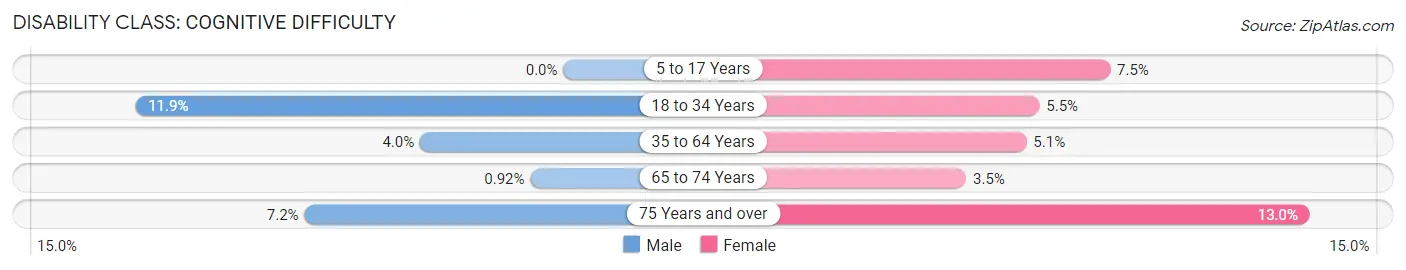
| Age Bracket | Male | Female |
| 5 to 17 Years | 0 (0.0%) | 54 (7.5%) |
| 18 to 34 Years | 128 (11.9%) | 54 (5.5%) |
| 35 to 64 Years | 80 (4.0%) | 119 (5.1%) |
| 65 to 74 Years | 5 (0.9%) | 20 (3.5%) |
| 75 Years and over | 22 (7.2%) | 74 (13.0%) |
Disability Class: Ambulatory Difficulty
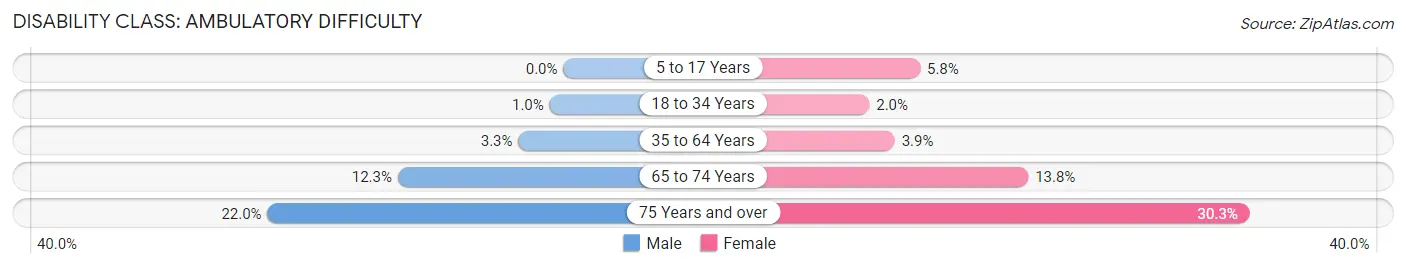
| Age Bracket | Male | Female |
| 5 to 17 Years | 0 (0.0%) | 42 (5.8%) |
| 18 to 34 Years | 11 (1.0%) | 20 (2.0%) |
| 35 to 64 Years | 67 (3.3%) | 91 (3.9%) |
| 65 to 74 Years | 67 (12.3%) | 80 (13.8%) |
| 75 Years and over | 67 (22.0%) | 172 (30.3%) |
Disability Class: Self-Care Difficulty
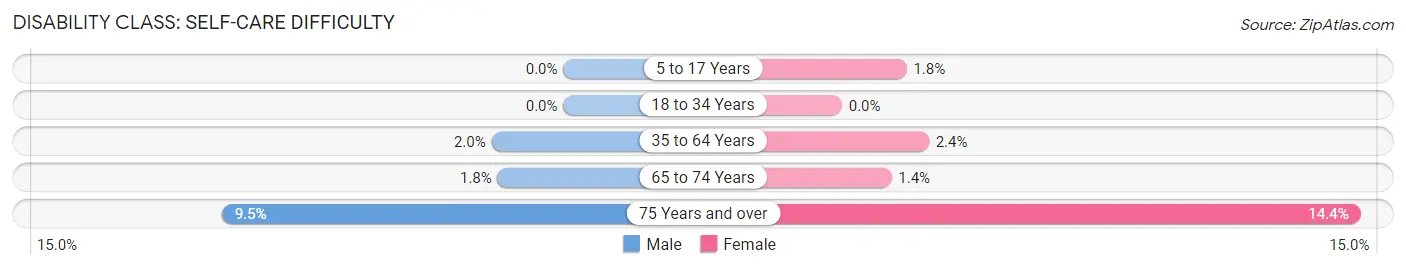
| Age Bracket | Male | Female |
| 5 to 17 Years | 0 (0.0%) | 13 (1.8%) |
| 18 to 34 Years | 0 (0.0%) | 0 (0.0%) |
| 35 to 64 Years | 40 (2.0%) | 56 (2.4%) |
| 65 to 74 Years | 10 (1.8%) | 8 (1.4%) |
| 75 Years and over | 29 (9.5%) | 82 (14.4%) |
Technology Access in Somers Point
Computing Device Access in Somers Point
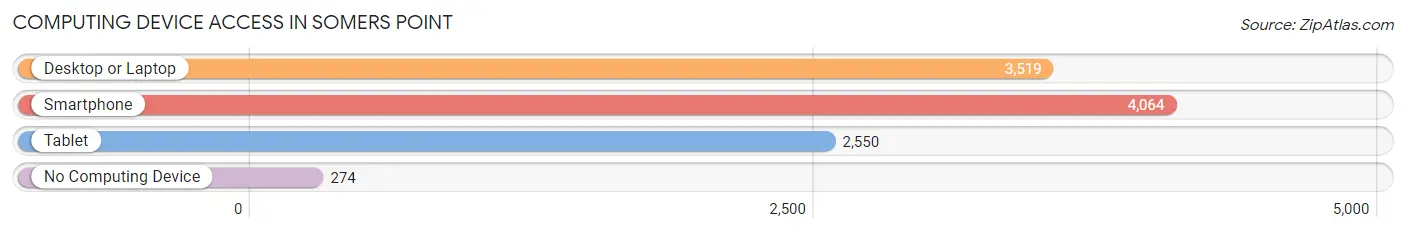
| Device Type | # Households | % Households |
| Desktop or Laptop | 3,519 | 75.7% |
| Smartphone | 4,064 | 87.4% |
| Tablet | 2,550 | 54.8% |
| No Computing Device | 274 | 5.9% |
| Total | 4,650 | 100.0% |
Internet Access in Somers Point
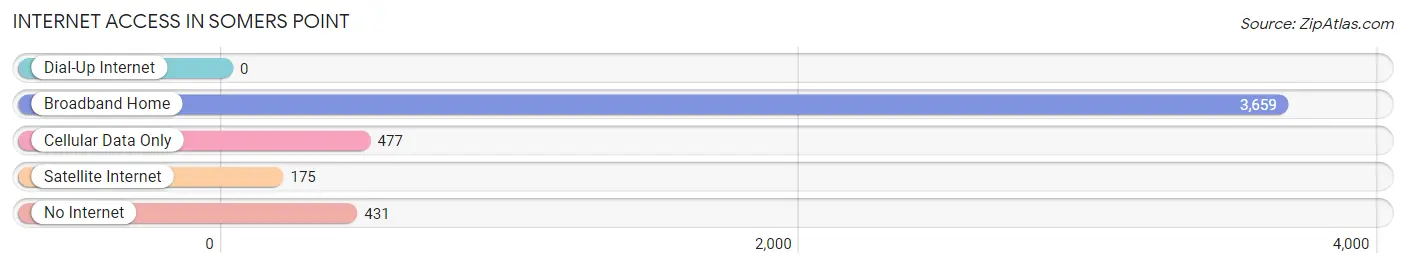
| Internet Type | # Households | % Households |
| Dial-Up Internet | 0 | 0.0% |
| Broadband Home | 3,659 | 78.7% |
| Cellular Data Only | 477 | 10.3% |
| Satellite Internet | 175 | 3.8% |
| No Internet | 431 | 9.3% |
| Total | 4,650 | 100.0% |
Somers Point Summary
Somers Point is a city located in Atlantic County, New Jersey, United States. It is situated on the Great Egg Harbor Bay, and is part of the Ocean City Metropolitan Statistical Area. As of the 2010 United States Census, the city had a total population of 10,795.
History
Somers Point was first settled in 1693 by English settlers, and was incorporated as a borough in 1886. The city was named after John Somers, an early settler. The Somers Mansion, built in 1725, is the oldest house in the city and is listed on the National Register of Historic Places.
The city was a popular resort destination in the late 19th and early 20th centuries, and was home to several large hotels. The city was also home to the Somers Point Naval Air Station, which was in operation from 1917 to 1919.
Geography
Somers Point is located at 39°21'25"N 74°32'45"W (39.356944, -74.545833). According to the United States Census Bureau, the city has a total area of 4.3 square miles (11.2 km2), of which 3.9 square miles (10.1 km2) is land and 0.4 square miles (1.1 km2) is water (9.45%).
The city is located on the Great Egg Harbor Bay, and is bordered to the north by Egg Harbor Township, to the east by Longport, to the south by Ocean City, and to the west by Linwood.
Economy
The economy of Somers Point is largely based on tourism and retail. The city is home to several restaurants, bars, and shops, as well as a marina and a golf course. The city is also home to several manufacturing and industrial businesses.
Demographics
As of the 2010 United States Census, there were 10,795 people, 4,845 households, and 2,845 families residing in the city. The population density was 2,764.3 per square mile (1,068.2/km2). There were 5,541 housing units at an average density of 1,417.3 per square mile (546.7/km2). The racial makeup of the city was 87.2% White, 5.2% African American, 0.3% Native American, 1.7% Asian, 0.1% Pacific Islander, 3.2% from other races, and 2.3% from two or more races. Hispanic or Latino of any race were 8.7% of the population.
There were 4,845 households, out of which 22.2% had children under the age of 18 living with them, 44.2% were married couples living together, 11.7% had a female householder with no husband present, and 39.3% were non-families. 33.2% of all households were made up of individuals, and 15.2% had someone living alone who was 65 years of age or older. The average household size was 2.22 and the average family size was 2.83.
In the city, the population was spread out, with 19.2% under the age of 18, 7.2% from 18 to 24, 24.2% from 25 to 44, 28.7% from 45 to 64, and 20.7% who were 65 years of age or older. The median age was 44.2 years. For every 100 females, there were 90.2 males. For every 100 females ages 18 and older there were 86.7 males.
The median income for a household in the city was $50,945, and the median income for a family was $62,917. Males had a median income of $45,945 versus $35,917 for females. The per capita income for the city was $27,945. About 5.2% of families and 7.7% of the population were below the poverty line, including 11.2% of those under age 18 and 6.2% of those age 65 or over.
Common Questions
What is Per Capita Income in Somers Point?
Per Capita income in Somers Point is $39,729.
What is the Median Family Income in Somers Point?
Median Family Income in Somers Point is $86,642.
What is the Median Household income in Somers Point?
Median Household Income in Somers Point is $68,262.
What is Income or Wage Gap in Somers Point?
Income or Wage Gap in Somers Point is 31.7%.
Women in Somers Point earn 68.3 cents for every dollar earned by a man.
What is Family Income Deficit in Somers Point?
Family Income Deficit in Somers Point is $14,158.
Families that are below poverty line in Somers Point earn $14,158 less on average than the poverty threshold level.
What is Inequality or Gini Index in Somers Point?
Inequality or Gini Index in Somers Point is 0.45.
What is the Total Population of Somers Point?
Total Population of Somers Point is 10,482.
What is the Total Male Population of Somers Point?
Total Male Population of Somers Point is 5,090.
What is the Total Female Population of Somers Point?
Total Female Population of Somers Point is 5,392.
What is the Ratio of Males per 100 Females in Somers Point?
There are 94.40 Males per 100 Females in Somers Point.
What is the Ratio of Females per 100 Males in Somers Point?
There are 105.93 Females per 100 Males in Somers Point.
What is the Median Population Age in Somers Point?
Median Population Age in Somers Point is 44.3 Years.
What is the Average Family Size in Somers Point
Average Family Size in Somers Point is 3.0 People.
What is the Average Household Size in Somers Point
Average Household Size in Somers Point is 2.2 People.
How Large is the Labor Force in Somers Point?
There are 5,846 People in the Labor Forcein in Somers Point.
What is the Percentage of People in the Labor Force in Somers Point?
67.5% of People are in the Labor Force in Somers Point.
What is the Unemployment Rate in Somers Point?
Unemployment Rate in Somers Point is 9.2%.