Pleasantville, NJ Map & Demographics
Pleasantville Map
Pleasantville Overview
$24,198
PER CAPITA INCOME
$51,626
AVG FAMILY INCOME
$48,704
AVG HOUSEHOLD INCOME
14.7%
WAGE / INCOME GAP [ % ]
85.3¢/ $1
WAGE / INCOME GAP [ $ ]
$8,508
FAMILY INCOME DEFICIT
0.49
INEQUALITY / GINI INDEX
20,562
TOTAL POPULATION
9,618
MALE POPULATION
10,944
FEMALE POPULATION
87.88
MALES / 100 FEMALES
113.79
FEMALES / 100 MALES
34.1
MEDIAN AGE
3.5
AVG FAMILY SIZE
3.0
AVG HOUSEHOLD SIZE
10,101
LABOR FORCE [ PEOPLE ]
63.3%
PERCENT IN LABOR FORCE
9.3%
UNEMPLOYMENT RATE
Pleasantville Zip Codes
Pleasantville Area Codes
Income in Pleasantville
Income Overview in Pleasantville
Per Capita Income in Pleasantville is $24,198, while median incomes of families and households are $51,626 and $48,704 respectively.
| Characteristic | Number | Measure |
| Per Capita Income | 20,562 | $24,198 |
| Median Family Income | 4,625 | $51,626 |
| Mean Family Income | 4,625 | $72,131 |
| Median Household Income | 6,724 | $48,704 |
| Mean Household Income | 6,724 | $71,756 |
| Income Deficit | 4,625 | $8,508 |
| Wage / Income Gap (%) | 20,562 | 14.66% |
| Wage / Income Gap ($) | 20,562 | 85.34¢ per $1 |
| Gini / Inequality Index | 20,562 | 0.49 |
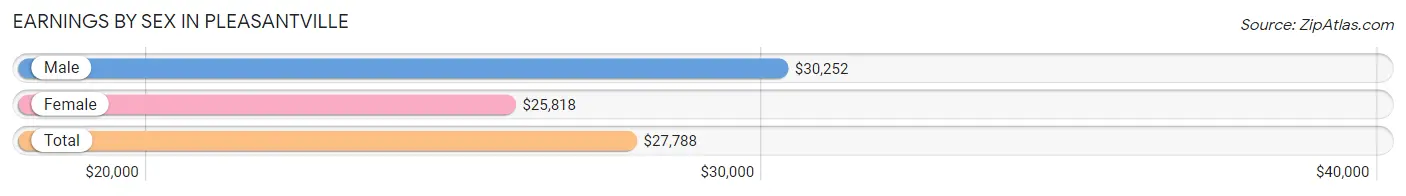
Earnings by Sex in Pleasantville
Average Earnings in Pleasantville are $27,788, $30,252 for men and $25,818 for women, a difference of 14.7%.
| Sex | Number | Average Earnings |
| Male | 4,778 (47.7%) | $30,252 |
| Female | 5,245 (52.3%) | $25,818 |
| Total | 10,023 (100.0%) | $27,788 |
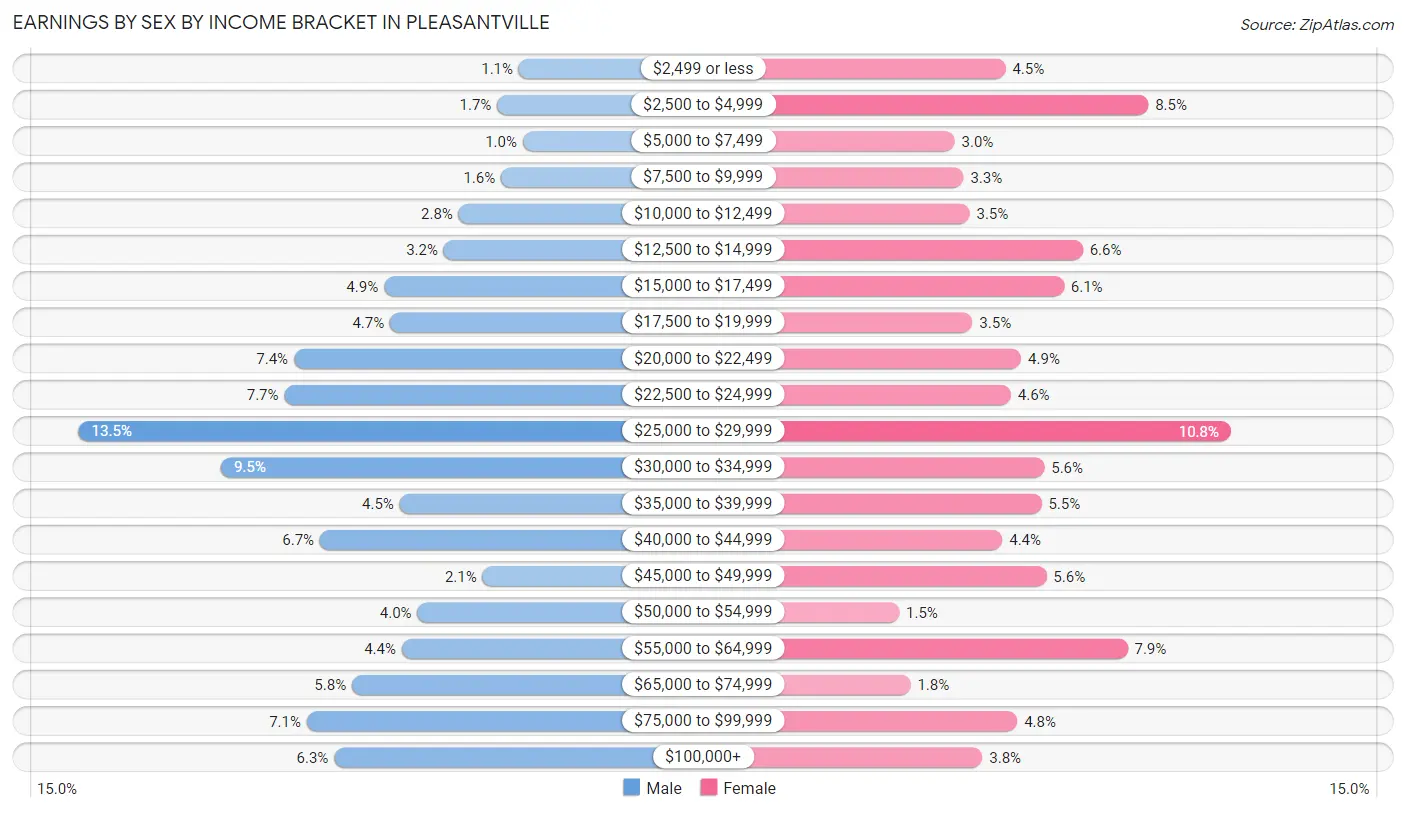
Earnings by Sex by Income Bracket in Pleasantville
The most common earnings brackets in Pleasantville are $25,000 to $29,999 for men (644 | 13.5%) and $25,000 to $29,999 for women (566 | 10.8%).
| Income | Male | Female |
| $2,499 or less | 53 (1.1%) | 234 (4.5%) |
| $2,500 to $4,999 | 82 (1.7%) | 444 (8.5%) |
| $5,000 to $7,499 | 48 (1.0%) | 159 (3.0%) |
| $7,500 to $9,999 | 77 (1.6%) | 172 (3.3%) |
| $10,000 to $12,499 | 134 (2.8%) | 181 (3.5%) |
| $12,500 to $14,999 | 154 (3.2%) | 348 (6.6%) |
| $15,000 to $17,499 | 234 (4.9%) | 320 (6.1%) |
| $17,500 to $19,999 | 226 (4.7%) | 185 (3.5%) |
| $20,000 to $22,499 | 355 (7.4%) | 257 (4.9%) |
| $22,500 to $24,999 | 368 (7.7%) | 242 (4.6%) |
| $25,000 to $29,999 | 644 (13.5%) | 566 (10.8%) |
| $30,000 to $34,999 | 453 (9.5%) | 291 (5.6%) |
| $35,000 to $39,999 | 213 (4.5%) | 287 (5.5%) |
| $40,000 to $44,999 | 320 (6.7%) | 229 (4.4%) |
| $45,000 to $49,999 | 102 (2.1%) | 294 (5.6%) |
| $50,000 to $54,999 | 189 (4.0%) | 77 (1.5%) |
| $55,000 to $64,999 | 210 (4.4%) | 414 (7.9%) |
| $65,000 to $74,999 | 277 (5.8%) | 94 (1.8%) |
| $75,000 to $99,999 | 338 (7.1%) | 251 (4.8%) |
| $100,000+ | 301 (6.3%) | 200 (3.8%) |
| Total | 4,778 (100.0%) | 5,245 (100.0%) |
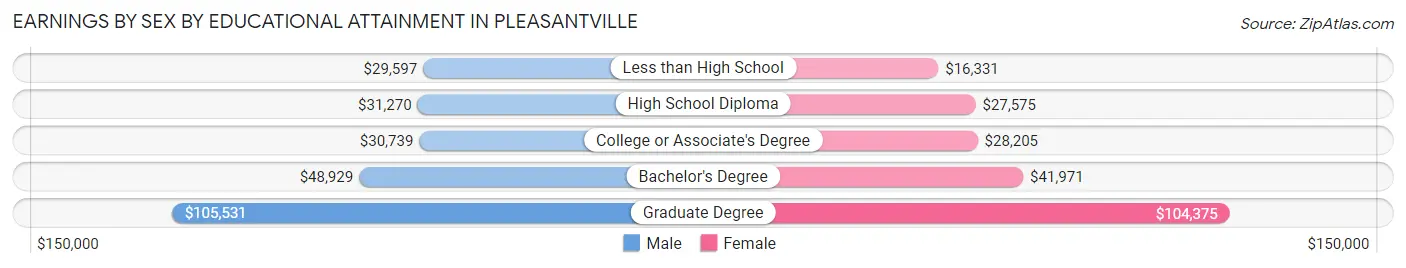
Earnings by Sex by Educational Attainment in Pleasantville
Average earnings in Pleasantville are $33,248 for men and $27,660 for women, a difference of 16.8%. Men with an educational attainment of graduate degree enjoy the highest average annual earnings of $105,531, while those with less than high school education earn the least with $29,597. Women with an educational attainment of graduate degree earn the most with the average annual earnings of $104,375, while those with less than high school education have the smallest earnings of $16,331.
| Educational Attainment | Male Income | Female Income |
| Less than High School | $29,597 | $16,331 |
| High School Diploma | $31,270 | $27,575 |
| College or Associate's Degree | $30,739 | $28,205 |
| Bachelor's Degree | $48,929 | $41,971 |
| Graduate Degree | $105,531 | $104,375 |
| Total | $33,248 | $27,660 |
Family Income in Pleasantville
Family Income Brackets in Pleasantville
According to the Pleasantville family income data, there are 999 families falling into the $35,000 to $49,999 income range, which is the most common income bracket and makes up 21.6% of all families. Conversely, the $10,000 to $14,999 income bracket is the least frequent group with only 97 families (2.1%) belonging to this category.
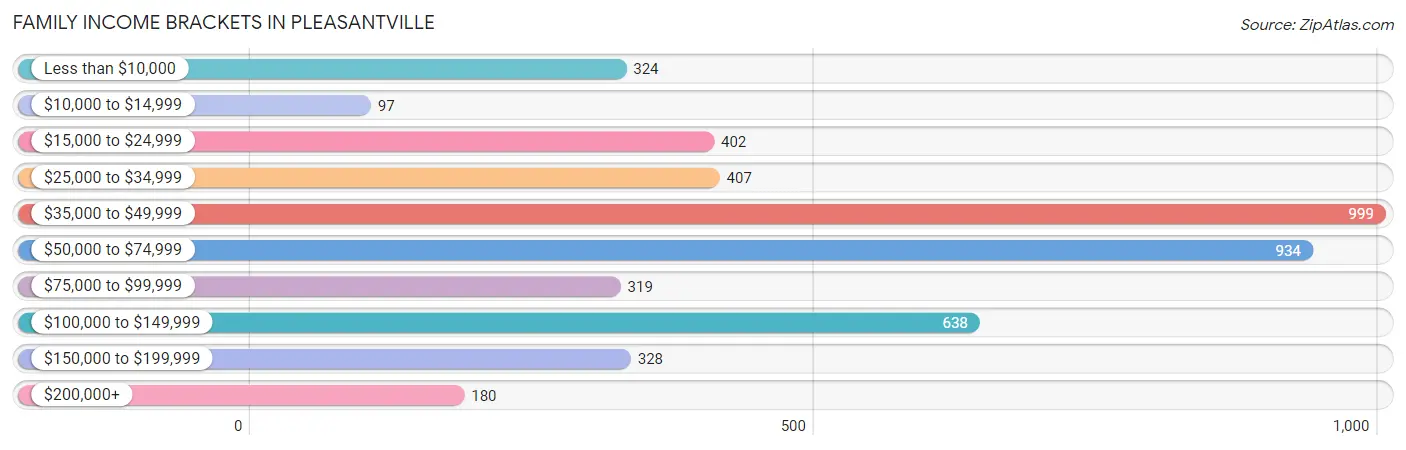
| Income Bracket | # Families | % Families |
| Less than $10,000 | 324 | 7.0% |
| $10,000 to $14,999 | 97 | 2.1% |
| $15,000 to $24,999 | 402 | 8.7% |
| $25,000 to $34,999 | 407 | 8.8% |
| $35,000 to $49,999 | 999 | 21.6% |
| $50,000 to $74,999 | 934 | 20.2% |
| $75,000 to $99,999 | 319 | 6.9% |
| $100,000 to $149,999 | 638 | 13.8% |
| $150,000 to $199,999 | 328 | 7.1% |
| $200,000+ | 180 | 3.9% |
Family Income by Famaliy Size in Pleasantville
6-person families (242 | 5.2%) account for the highest median family income in Pleasantville with $68,137 per family, while 2-person families (1,676 | 36.2%) have the highest median income of $25,252 per family member.
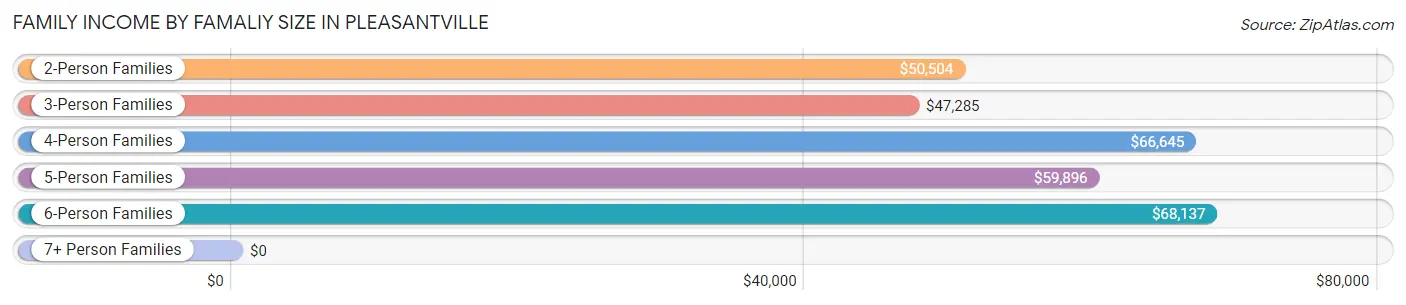
| Income Bracket | # Families | Median Income |
| 2-Person Families | 1,676 (36.2%) | $50,504 |
| 3-Person Families | 897 (19.4%) | $47,285 |
| 4-Person Families | 1,154 (24.9%) | $66,645 |
| 5-Person Families | 468 (10.1%) | $59,896 |
| 6-Person Families | 242 (5.2%) | $68,137 |
| 7+ Person Families | 188 (4.1%) | $0 |
| Total | 4,625 (100.0%) | $51,626 |
Family Income by Number of Earners in Pleasantville
The median family income in Pleasantville is $51,626, with families comprising 3+ earners (561) having the highest median family income of $133,292, while families with no earners (456) have the lowest median family income of $23,462, accounting for 12.1% and 9.9% of families, respectively.
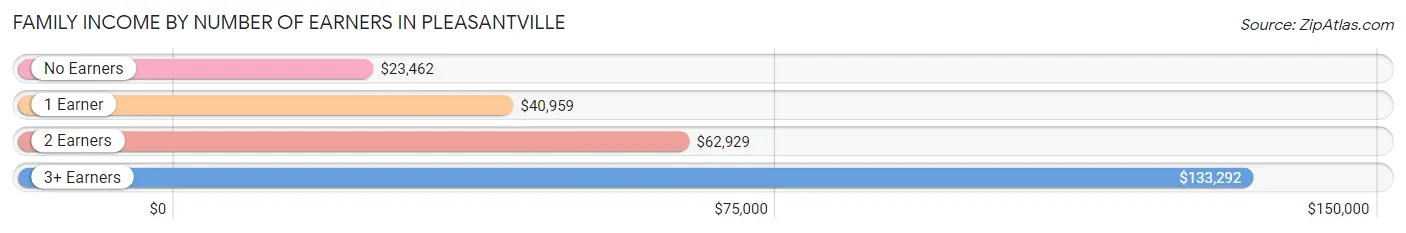
| Number of Earners | # Families | Median Income |
| No Earners | 456 (9.9%) | $23,462 |
| 1 Earner | 1,755 (38.0%) | $40,959 |
| 2 Earners | 1,853 (40.1%) | $62,929 |
| 3+ Earners | 561 (12.1%) | $133,292 |
| Total | 4,625 (100.0%) | $51,626 |
Household Income in Pleasantville
Household Income Brackets in Pleasantville
With 1,284 households falling in the category, the $35,000 to $49,999 income range is the most frequent in Pleasantville, accounting for 19.1% of all households. In contrast, only 208 households (3.1%) fall into the $200,000+ income bracket, making it the least populous group.
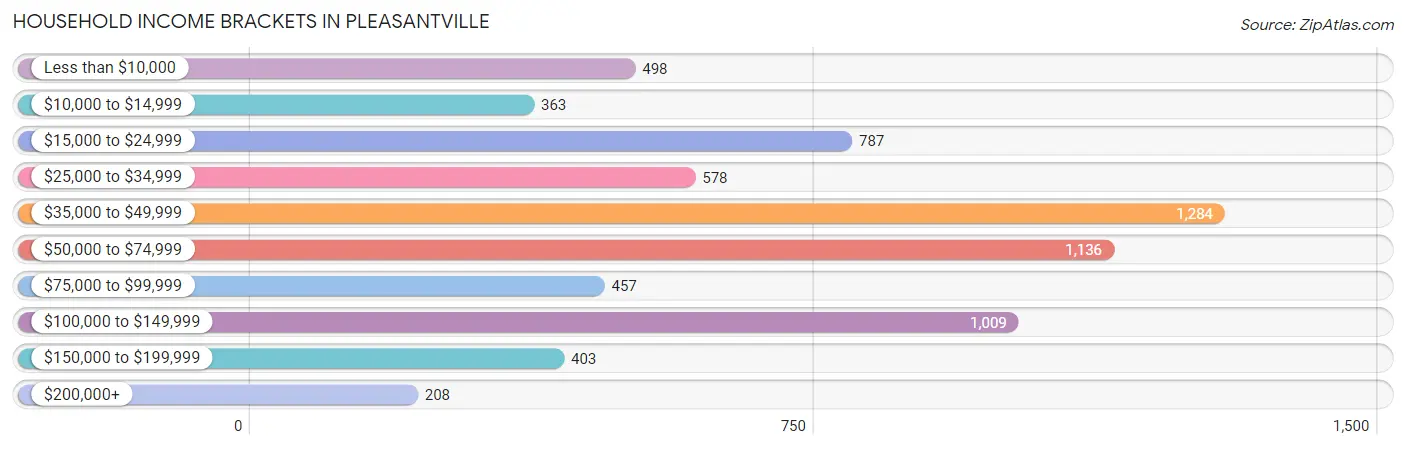
| Income Bracket | # Households | % Households |
| Less than $10,000 | 498 | 7.4% |
| $10,000 to $14,999 | 363 | 5.4% |
| $15,000 to $24,999 | 787 | 11.7% |
| $25,000 to $34,999 | 578 | 8.6% |
| $35,000 to $49,999 | 1,284 | 19.1% |
| $50,000 to $74,999 | 1,136 | 16.9% |
| $75,000 to $99,999 | 457 | 6.8% |
| $100,000 to $149,999 | 1,009 | 15.0% |
| $150,000 to $199,999 | 403 | 6.0% |
| $200,000+ | 208 | 3.1% |
Household Income by Householder Age in Pleasantville
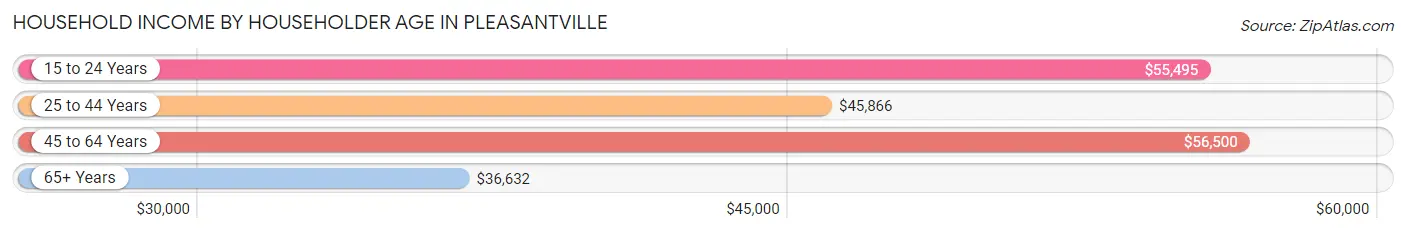
The median household income in Pleasantville is $48,704, with the highest median household income of $56,500 found in the 45 to 64 years age bracket for the primary householder. A total of 2,886 households (42.9%) fall into this category. Meanwhile, the 65+ years age bracket for the primary householder has the lowest median household income of $36,632, with 1,373 households (20.4%) in this group.
| Income Bracket | # Households | Median Income |
| 15 to 24 Years | 87 (1.3%) | $55,495 |
| 25 to 44 Years | 2,378 (35.4%) | $45,866 |
| 45 to 64 Years | 2,886 (42.9%) | $56,500 |
| 65+ Years | 1,373 (20.4%) | $36,632 |
| Total | 6,724 (100.0%) | $48,704 |
Poverty in Pleasantville
Income Below Poverty by Sex and Age in Pleasantville
With 20.0% poverty level for males and 28.8% for females among the residents of Pleasantville, 75 year old and over males and 15 year old females are the most vulnerable to poverty, with 125 males (43.9%) and 111 females (66.9%) in their respective age groups living below the poverty level.
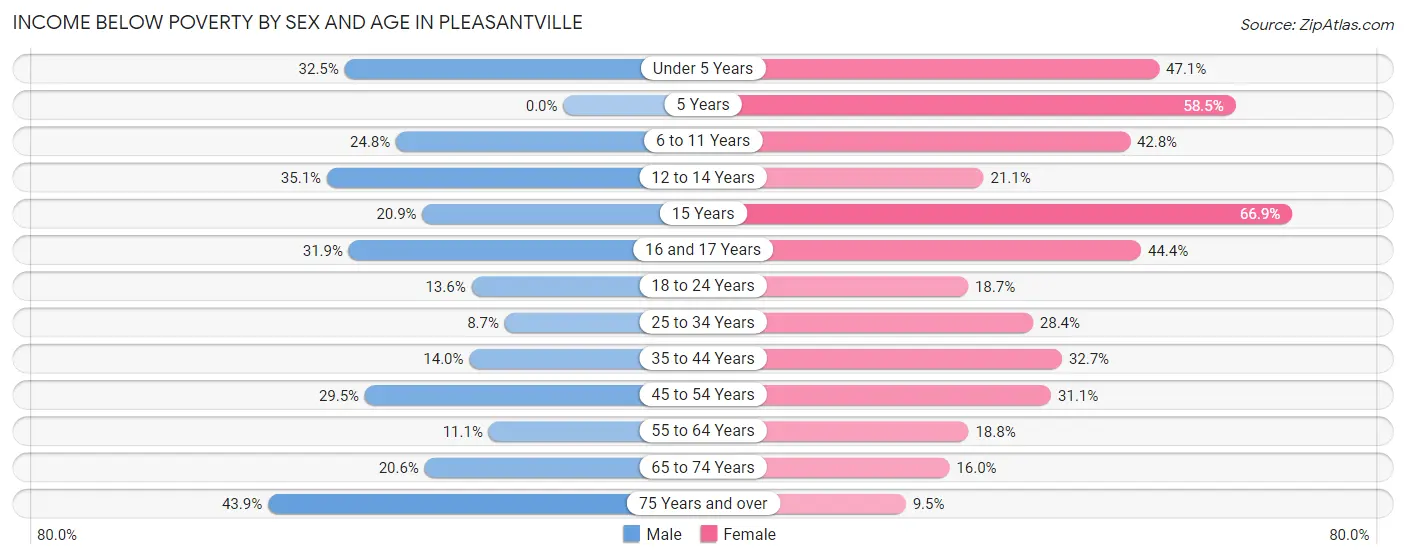
| Age Bracket | Male | Female |
| Under 5 Years | 329 (32.5%) | 336 (47.1%) |
| 5 Years | 0 (0.0%) | 38 (58.5%) |
| 6 to 11 Years | 224 (24.8%) | 341 (42.8%) |
| 12 to 14 Years | 112 (35.1%) | 88 (21.0%) |
| 15 Years | 32 (20.9%) | 111 (66.9%) |
| 16 and 17 Years | 72 (31.9%) | 160 (44.4%) |
| 18 to 24 Years | 115 (13.6%) | 190 (18.7%) |
| 25 to 34 Years | 139 (8.7%) | 528 (28.4%) |
| 35 to 44 Years | 181 (14.0%) | 460 (32.7%) |
| 45 to 54 Years | 319 (29.5%) | 436 (31.1%) |
| 55 to 64 Years | 132 (11.1%) | 241 (18.8%) |
| 65 to 74 Years | 133 (20.6%) | 117 (16.0%) |
| 75 Years and over | 125 (43.9%) | 50 (9.5%) |
| Total | 1,913 (20.0%) | 3,096 (28.8%) |
Income Above Poverty by Sex and Age in Pleasantville
According to the poverty statistics in Pleasantville, males aged 5 years and females aged 75 years and over are the age groups that are most secure financially, with 100.0% of males and 90.5% of females in these age groups living above the poverty line.
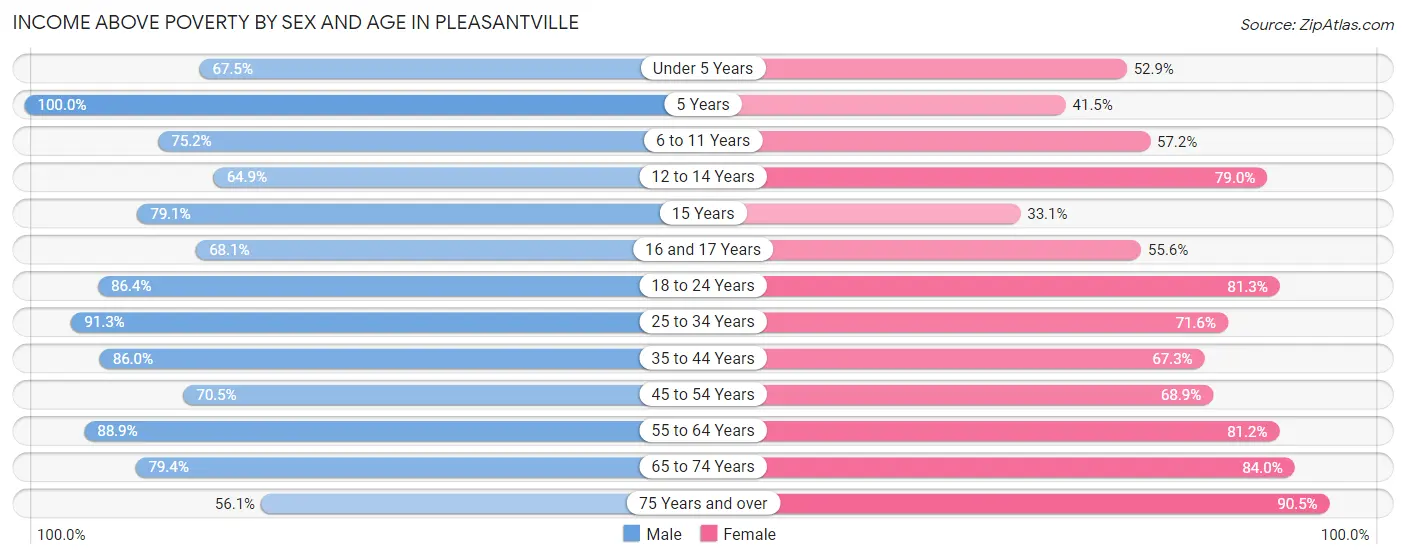
| Age Bracket | Male | Female |
| Under 5 Years | 684 (67.5%) | 377 (52.9%) |
| 5 Years | 15 (100.0%) | 27 (41.5%) |
| 6 to 11 Years | 678 (75.2%) | 456 (57.2%) |
| 12 to 14 Years | 207 (64.9%) | 330 (78.9%) |
| 15 Years | 121 (79.1%) | 55 (33.1%) |
| 16 and 17 Years | 154 (68.1%) | 200 (55.6%) |
| 18 to 24 Years | 728 (86.4%) | 824 (81.3%) |
| 25 to 34 Years | 1,461 (91.3%) | 1,333 (71.6%) |
| 35 to 44 Years | 1,116 (86.0%) | 947 (67.3%) |
| 45 to 54 Years | 764 (70.5%) | 967 (68.9%) |
| 55 to 64 Years | 1,059 (88.9%) | 1,040 (81.2%) |
| 65 to 74 Years | 513 (79.4%) | 615 (84.0%) |
| 75 Years and over | 160 (56.1%) | 477 (90.5%) |
| Total | 7,660 (80.0%) | 7,648 (71.2%) |
Income Below Poverty Among Married-Couple Families in Pleasantville
The poverty statistics for married-couple families in Pleasantville show that 9.5% or 200 of the total 2,099 families live below the poverty line. Families with 1 or 2 children have the highest poverty rate of 17.5%, comprising of 117 families. On the other hand, families with no children have the lowest poverty rate of 2.6%, which includes 28 families.
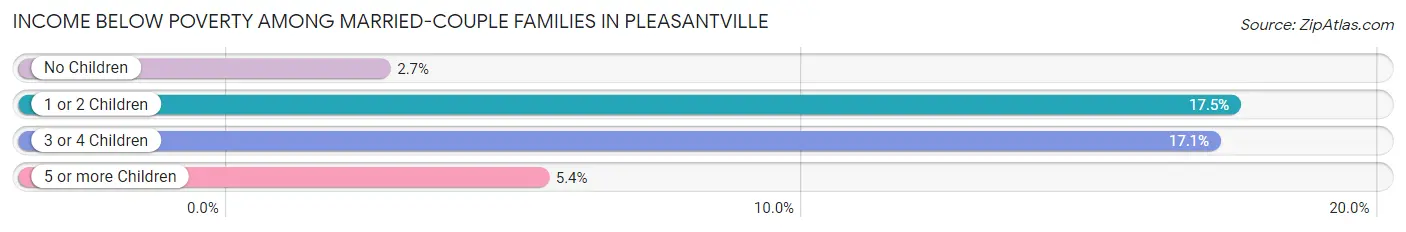
| Children | Above Poverty | Below Poverty |
| No Children | 1,029 (97.4%) | 28 (2.6%) |
| 1 or 2 Children | 553 (82.5%) | 117 (17.5%) |
| 3 or 4 Children | 247 (82.9%) | 51 (17.1%) |
| 5 or more Children | 70 (94.6%) | 4 (5.4%) |
| Total | 1,899 (90.5%) | 200 (9.5%) |
Income Below Poverty Among Single-Parent Households in Pleasantville
According to the poverty data in Pleasantville, 18.5% or 80 single-father households and 36.8% or 770 single-mother households are living below the poverty line. Among single-father households, those with 1 or 2 children have the highest poverty rate, with 62 households (36.0%) experiencing poverty. Likewise, among single-mother households, those with 3 or 4 children have the highest poverty rate, with 139 households (65.9%) falling below the poverty line.
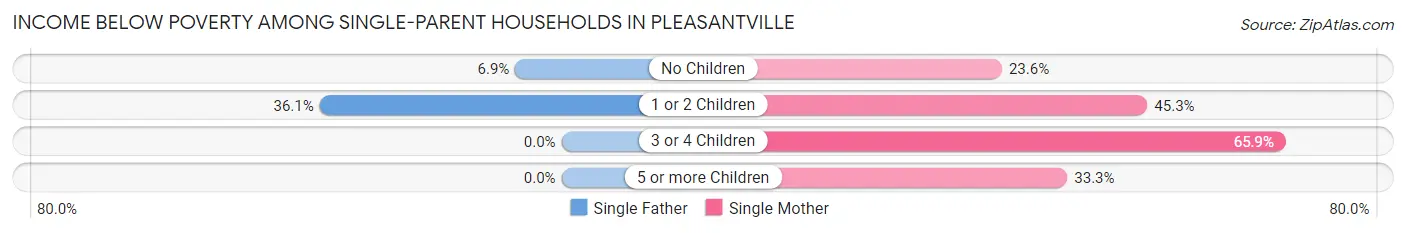
| Children | Single Father | Single Mother |
| No Children | 18 (6.9%) | 238 (23.6%) |
| 1 or 2 Children | 62 (36.0%) | 387 (45.3%) |
| 3 or 4 Children | 0 (0.0%) | 139 (65.9%) |
| 5 or more Children | 0 (0.0%) | 6 (33.3%) |
| Total | 80 (18.5%) | 770 (36.8%) |
Income Below Poverty Among Married-Couple vs Single-Parent Households in Pleasantville
The poverty data for Pleasantville shows that 200 of the married-couple family households (9.5%) and 850 of the single-parent households (33.7%) are living below the poverty level. Within the married-couple family households, those with 1 or 2 children have the highest poverty rate, with 117 households (17.5%) falling below the poverty line. Among the single-parent households, those with 3 or 4 children have the highest poverty rate, with 139 household (65.9%) living below poverty.
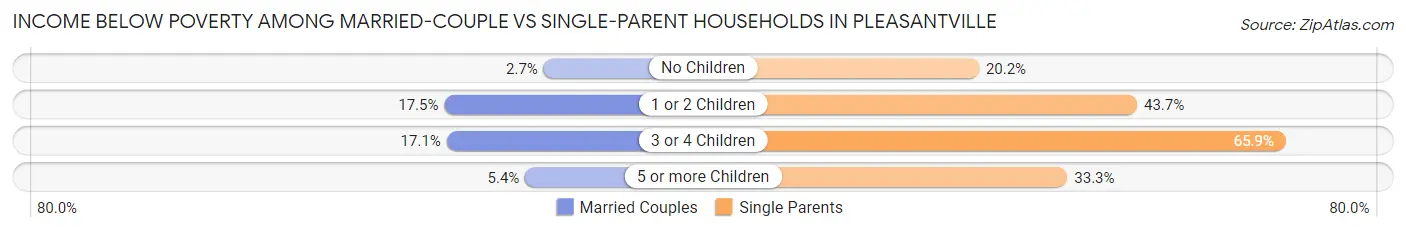
| Children | Married-Couple Families | Single-Parent Households |
| No Children | 28 (2.6%) | 256 (20.2%) |
| 1 or 2 Children | 117 (17.5%) | 449 (43.7%) |
| 3 or 4 Children | 51 (17.1%) | 139 (65.9%) |
| 5 or more Children | 4 (5.4%) | 6 (33.3%) |
| Total | 200 (9.5%) | 850 (33.7%) |
Race in Pleasantville
The most populous races in Pleasantville are Hispanic or Latino (10,004 | 48.6%), Black / African American (7,681 | 37.4%), and White / Caucasian (5,122 | 24.9%).
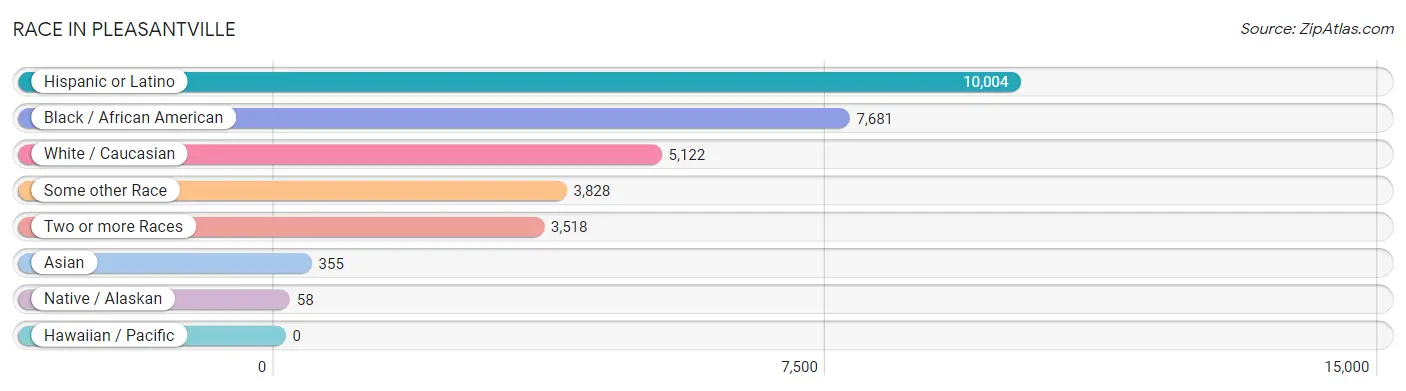
| Race | # Population | % Population |
| Asian | 355 | 1.7% |
| Black / African American | 7,681 | 37.4% |
| Hawaiian / Pacific | 0 | 0.0% |
| Hispanic or Latino | 10,004 | 48.6% |
| Native / Alaskan | 58 | 0.3% |
| White / Caucasian | 5,122 | 24.9% |
| Two or more Races | 3,518 | 17.1% |
| Some other Race | 3,828 | 18.6% |
| Total | 20,562 | 100.0% |
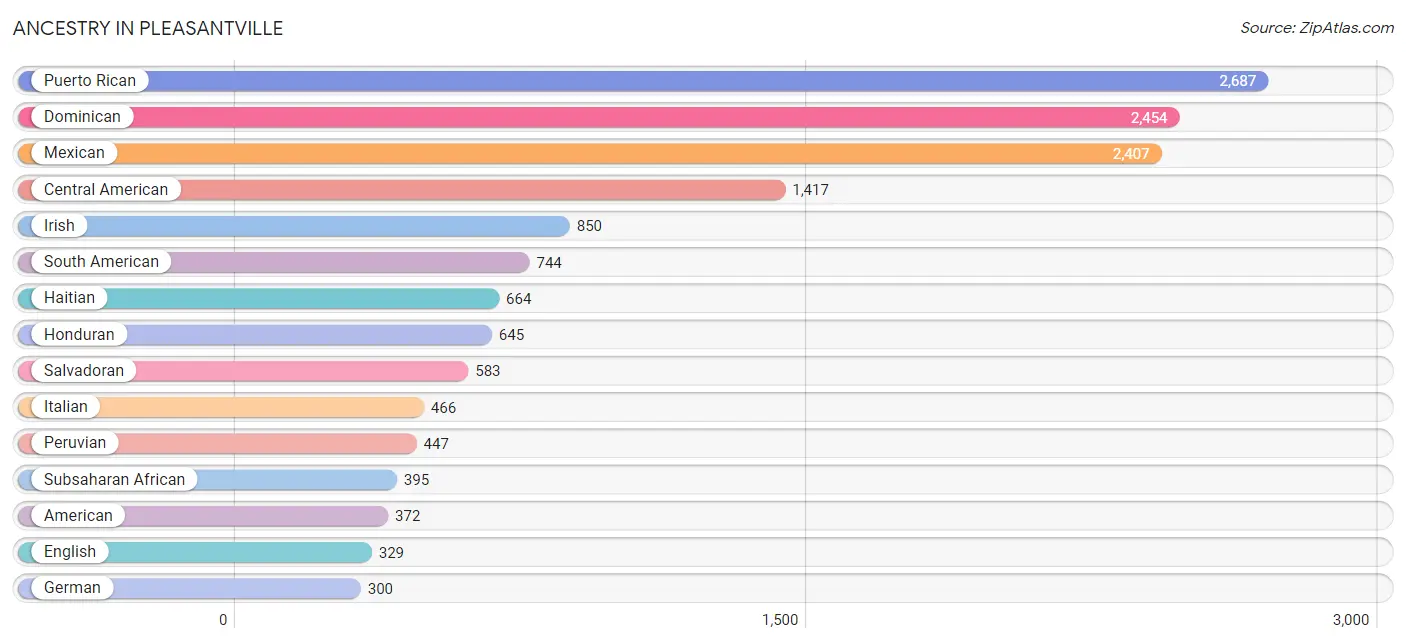
Ancestry in Pleasantville
The most populous ancestries reported in Pleasantville are Puerto Rican (2,687 | 13.1%), Dominican (2,454 | 11.9%), Mexican (2,407 | 11.7%), Central American (1,417 | 6.9%), and Irish (850 | 4.1%), together accounting for 47.7% of all Pleasantville residents.
| Ancestry | # Population | % Population |
| African | 212 | 1.0% |
| American | 372 | 1.8% |
| Austrian | 37 | 0.2% |
| British | 8 | 0.0% |
| Burmese | 44 | 0.2% |
| Central American | 1,417 | 6.9% |
| Cherokee | 177 | 0.9% |
| Colombian | 297 | 1.4% |
| Cuban | 46 | 0.2% |
| Czech | 21 | 0.1% |
| Czechoslovakian | 35 | 0.2% |
| Dominican | 2,454 | 11.9% |
| Dutch | 14 | 0.1% |
| English | 329 | 1.6% |
| European | 11 | 0.1% |
| French | 124 | 0.6% |
| German | 300 | 1.5% |
| Ghanaian | 77 | 0.4% |
| Greek | 33 | 0.2% |
| Guyanese | 54 | 0.3% |
| Haitian | 664 | 3.2% |
| Honduran | 645 | 3.1% |
| Hungarian | 35 | 0.2% |
| Indian (Asian) | 143 | 0.7% |
| Indonesian | 45 | 0.2% |
| Irish | 850 | 4.1% |
| Italian | 466 | 2.3% |
| Jamaican | 105 | 0.5% |
| Kenyan | 102 | 0.5% |
| Korean | 181 | 0.9% |
| Malaysian | 37 | 0.2% |
| Mexican | 2,407 | 11.7% |
| Nicaraguan | 189 | 0.9% |
| Norwegian | 38 | 0.2% |
| Peruvian | 447 | 2.2% |
| Polish | 31 | 0.2% |
| Portuguese | 17 | 0.1% |
| Puerto Rican | 2,687 | 13.1% |
| Romanian | 3 | 0.0% |
| Salvadoran | 583 | 2.8% |
| Scotch-Irish | 3 | 0.0% |
| Scottish | 14 | 0.1% |
| South American | 744 | 3.6% |
| South American Indian | 46 | 0.2% |
| Spaniard | 15 | 0.1% |
| Spanish | 95 | 0.5% |
| Sri Lankan | 85 | 0.4% |
| Subsaharan African | 395 | 1.9% |
| Thai | 169 | 0.8% |
| Trinidadian and Tobagonian | 24 | 0.1% |
| U.S. Virgin Islander | 40 | 0.2% |
| Welsh | 35 | 0.2% |
| Yugoslavian | 28 | 0.1% | View All 53 Rows |
Immigrants in Pleasantville
The most numerous immigrant groups reported in Pleasantville came from Latin America (5,130 | 24.9%), Caribbean (2,635 | 12.8%), Central America (2,082 | 10.1%), Dominican Republic (1,579 | 7.7%), and Mexico (876 | 4.3%), together accounting for 59.8% of all Pleasantville residents.
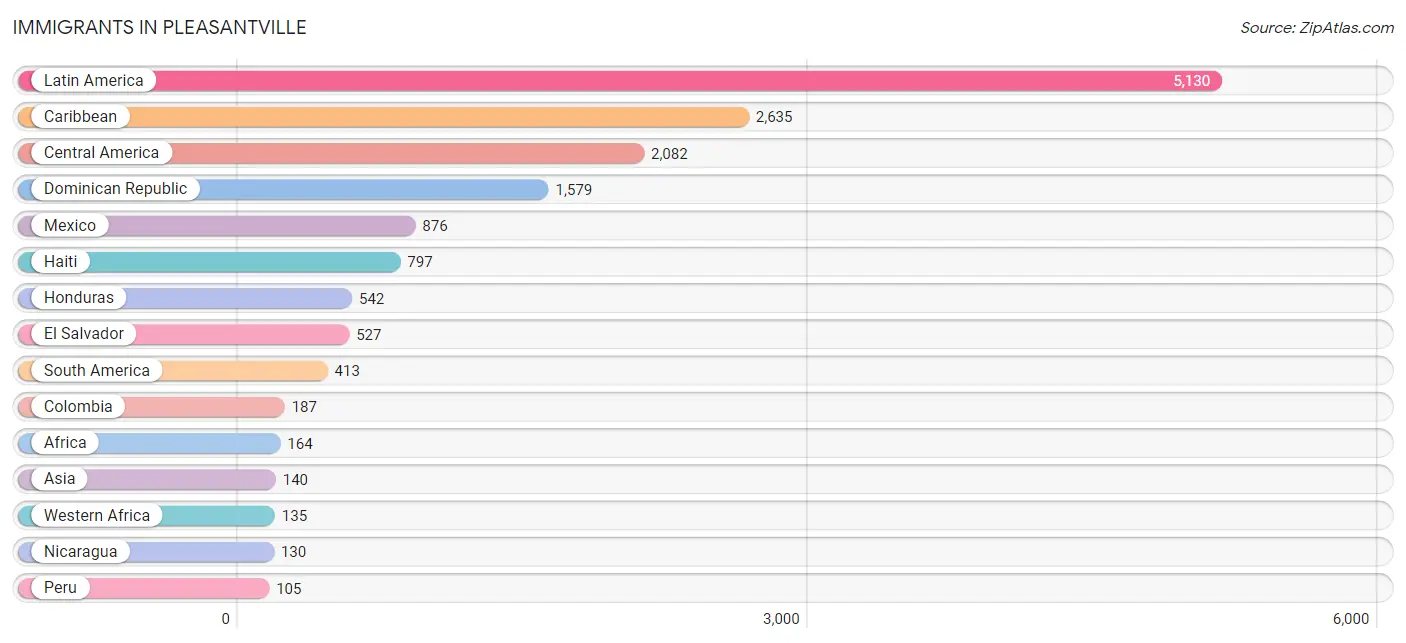
| Immigration Origin | # Population | % Population |
| Africa | 164 | 0.8% |
| Asia | 140 | 0.7% |
| Caribbean | 2,635 | 12.8% |
| Central America | 2,082 | 10.1% |
| Colombia | 187 | 0.9% |
| Cuba | 10 | 0.1% |
| Dominican Republic | 1,579 | 7.7% |
| Eastern Africa | 29 | 0.1% |
| El Salvador | 527 | 2.6% |
| Europe | 20 | 0.1% |
| Germany | 20 | 0.1% |
| Ghana | 84 | 0.4% |
| Grenada | 10 | 0.1% |
| Guyana | 34 | 0.2% |
| Haiti | 797 | 3.9% |
| Honduras | 542 | 2.6% |
| India | 84 | 0.4% |
| Jamaica | 36 | 0.2% |
| Kenya | 29 | 0.1% |
| Laos | 15 | 0.1% |
| Latin America | 5,130 | 24.9% |
| Liberia | 51 | 0.3% |
| Mexico | 876 | 4.3% |
| Nicaragua | 130 | 0.6% |
| Panama | 7 | 0.0% |
| Peru | 105 | 0.5% |
| Philippines | 6 | 0.0% |
| South America | 413 | 2.0% |
| South Central Asia | 84 | 0.4% |
| South Eastern Asia | 56 | 0.3% |
| Trinidad and Tobago | 24 | 0.1% |
| Vietnam | 35 | 0.2% |
| Western Africa | 135 | 0.7% |
| Western Europe | 20 | 0.1% | View All 34 Rows |
Sex and Age in Pleasantville
Sex and Age in Pleasantville
The most populous age groups in Pleasantville are Under 5 Years (1,013 | 10.5%) for men and 30 to 34 Years (983 | 9.0%) for women.
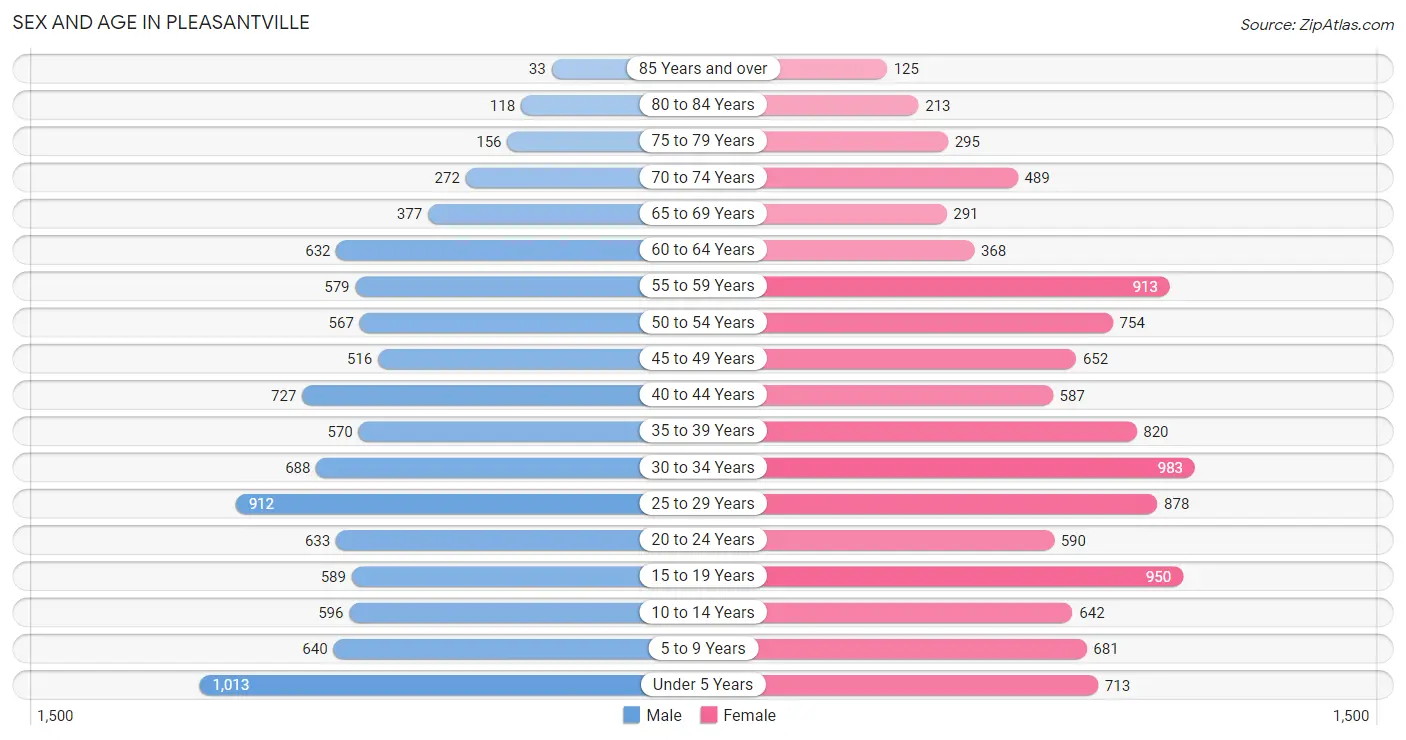
| Age Bracket | Male | Female |
| Under 5 Years | 1,013 (10.5%) | 713 (6.5%) |
| 5 to 9 Years | 640 (6.7%) | 681 (6.2%) |
| 10 to 14 Years | 596 (6.2%) | 642 (5.9%) |
| 15 to 19 Years | 589 (6.1%) | 950 (8.7%) |
| 20 to 24 Years | 633 (6.6%) | 590 (5.4%) |
| 25 to 29 Years | 912 (9.5%) | 878 (8.0%) |
| 30 to 34 Years | 688 (7.1%) | 983 (9.0%) |
| 35 to 39 Years | 570 (5.9%) | 820 (7.5%) |
| 40 to 44 Years | 727 (7.6%) | 587 (5.4%) |
| 45 to 49 Years | 516 (5.4%) | 652 (6.0%) |
| 50 to 54 Years | 567 (5.9%) | 754 (6.9%) |
| 55 to 59 Years | 579 (6.0%) | 913 (8.3%) |
| 60 to 64 Years | 632 (6.6%) | 368 (3.4%) |
| 65 to 69 Years | 377 (3.9%) | 291 (2.7%) |
| 70 to 74 Years | 272 (2.8%) | 489 (4.5%) |
| 75 to 79 Years | 156 (1.6%) | 295 (2.7%) |
| 80 to 84 Years | 118 (1.2%) | 213 (1.9%) |
| 85 Years and over | 33 (0.3%) | 125 (1.1%) |
| Total | 9,618 (100.0%) | 10,944 (100.0%) |
Families and Households in Pleasantville
Median Family Size in Pleasantville
The median family size in Pleasantville is 3.55 persons per family, with married-couple families (2,099 | 45.4%) accounting for the largest median family size of 3.83 persons per family. On the other hand, single female/mother families (2,093 | 45.3%) represent the smallest median family size with 3.26 persons per family.
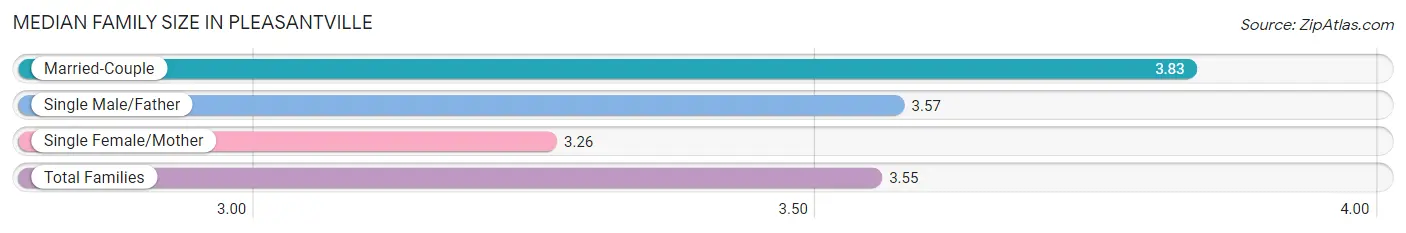
| Family Type | # Families | Family Size |
| Married-Couple | 2,099 (45.4%) | 3.83 |
| Single Male/Father | 433 (9.4%) | 3.57 |
| Single Female/Mother | 2,093 (45.3%) | 3.26 |
| Total Families | 4,625 (100.0%) | 3.55 |
Median Household Size in Pleasantville
The median household size in Pleasantville is 3.02 persons per household, with single male/father households (433 | 6.4%) accounting for the largest median household size of 4.53 persons per household. non-family households (2,099 | 31.2%) represent the smallest median household size with 1.26 persons per household.
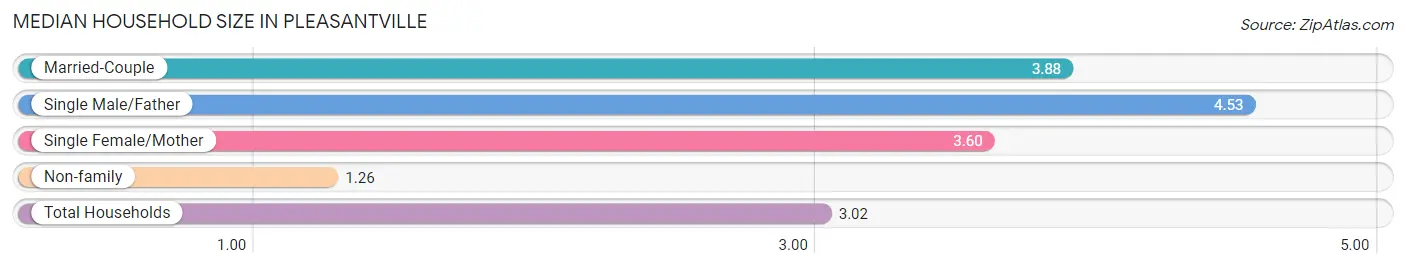
| Household Type | # Households | Household Size |
| Married-Couple | 2,099 (31.2%) | 3.88 |
| Single Male/Father | 433 (6.4%) | 4.53 |
| Single Female/Mother | 2,093 (31.1%) | 3.60 |
| Non-family | 2,099 (31.2%) | 1.26 |
| Total Households | 6,724 (100.0%) | 3.02 |
Household Size by Marriage Status in Pleasantville
Out of a total of 6,724 households in Pleasantville, 4,625 (68.8%) are family households, while 2,099 (31.2%) are nonfamily households. The most numerous type of family households are 2-person households, comprising 1,410, and the most common type of nonfamily households are 1-person households, comprising 1,668.
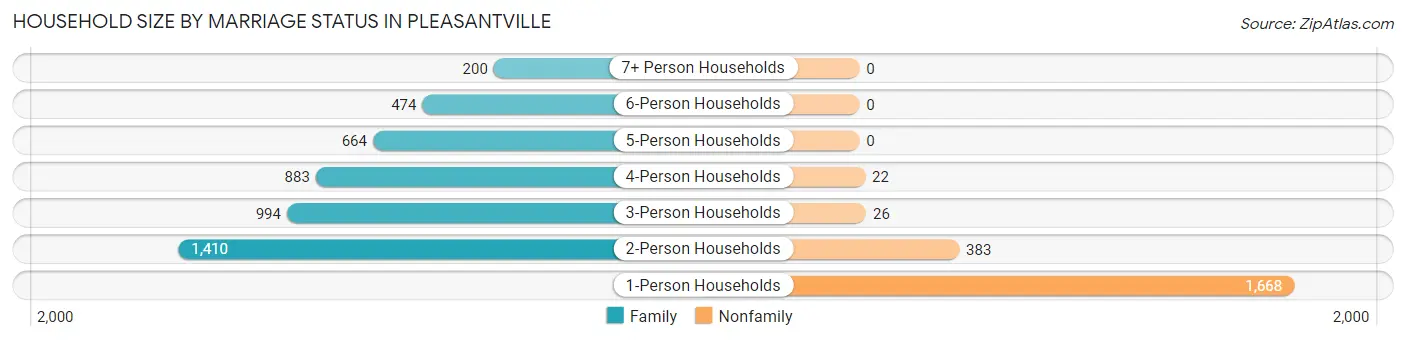
| Household Size | Family Households | Nonfamily Households |
| 1-Person Households | - | 1,668 (24.8%) |
| 2-Person Households | 1,410 (21.0%) | 383 (5.7%) |
| 3-Person Households | 994 (14.8%) | 26 (0.4%) |
| 4-Person Households | 883 (13.1%) | 22 (0.3%) |
| 5-Person Households | 664 (9.9%) | 0 (0.0%) |
| 6-Person Households | 474 (7.0%) | 0 (0.0%) |
| 7+ Person Households | 200 (3.0%) | 0 (0.0%) |
| Total | 4,625 (68.8%) | 2,099 (31.2%) |
Female Fertility in Pleasantville
Fertility by Age in Pleasantville
Average fertility rate in Pleasantville is 68.0 births per 1,000 women. Women in the age bracket of 20 to 34 years have the highest fertility rate with 102.0 births per 1,000 women. Women in the age bracket of 20 to 34 years acount for 65.6% of all women with births.
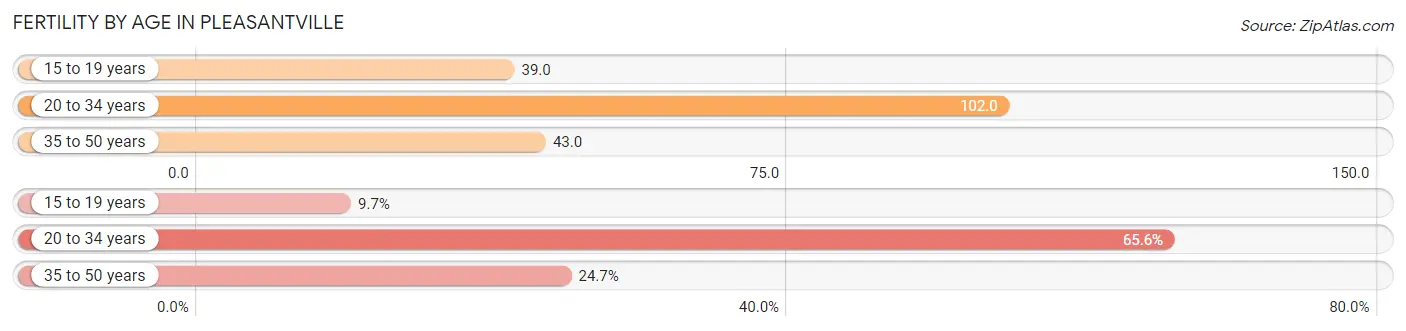
| Age Bracket | Women with Births | Births / 1,000 Women |
| 15 to 19 years | 37 (9.7%) | 39.0 |
| 20 to 34 years | 250 (65.6%) | 102.0 |
| 35 to 50 years | 94 (24.7%) | 43.0 |
| Total | 381 (100.0%) | 68.0 |
Fertility by Age by Marriage Status in Pleasantville
50.4% of women with births (381) in Pleasantville are married. The highest percentage of unmarried women with births falls into 15 to 19 years age bracket with 100.0% of them unmarried at the time of birth, while the lowest percentage of unmarried women with births belong to 35 to 50 years age bracket with 29.8% of them unmarried.
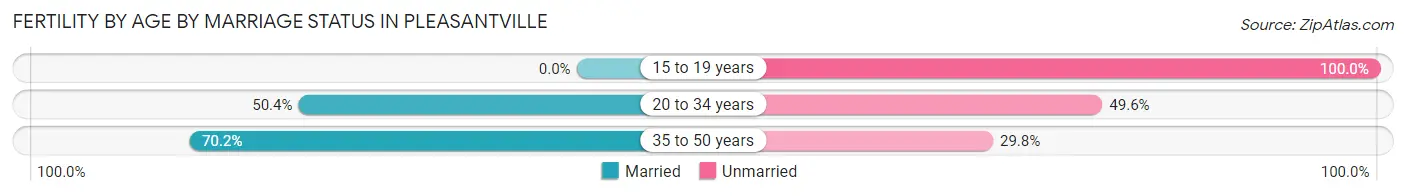
| Age Bracket | Married | Unmarried |
| 15 to 19 years | 0 (0.0%) | 37 (100.0%) |
| 20 to 34 years | 126 (50.4%) | 124 (49.6%) |
| 35 to 50 years | 66 (70.2%) | 28 (29.8%) |
| Total | 192 (50.4%) | 189 (49.6%) |
Fertility by Education in Pleasantville
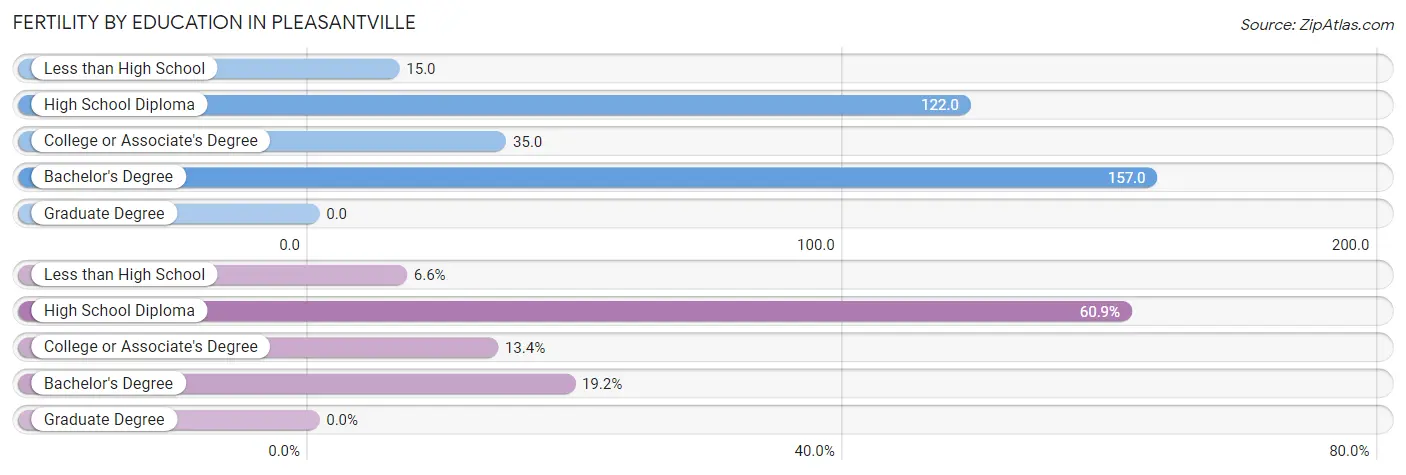
| Educational Attainment | Women with Births | Births / 1,000 Women |
| Less than High School | 25 (6.6%) | 15.0 |
| High School Diploma | 232 (60.9%) | 122.0 |
| College or Associate's Degree | 51 (13.4%) | 35.0 |
| Bachelor's Degree | 73 (19.2%) | 157.0 |
| Graduate Degree | 0 (0.0%) | 0.0 |
| Total | 381 (100.0%) | 68.0 |
Fertility by Education by Marriage Status in Pleasantville
49.6% of women with births in Pleasantville are unmarried. Women with the educational attainment of less than high school are most likely to be married with 96.0% of them married at childbirth, while women with the educational attainment of college or associate's degree are least likely to be married with 100.0% of them unmarried at childbirth.
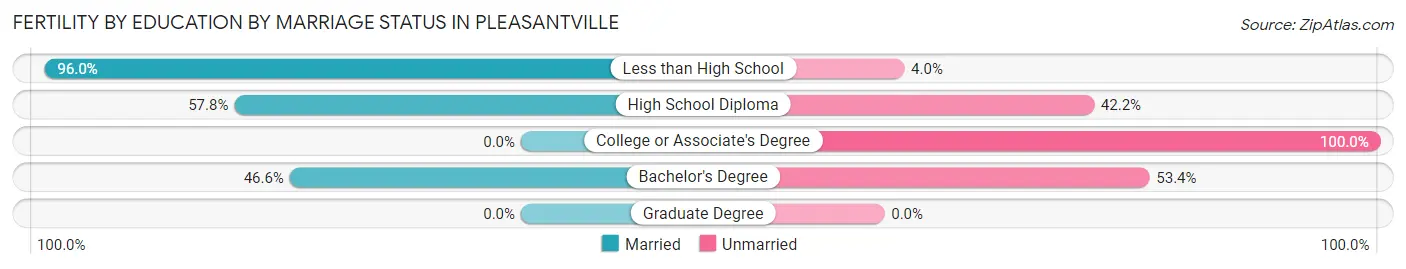
| Educational Attainment | Married | Unmarried |
| Less than High School | 24 (96.0%) | 1 (4.0%) |
| High School Diploma | 134 (57.8%) | 98 (42.2%) |
| College or Associate's Degree | 0 (0.0%) | 51 (100.0%) |
| Bachelor's Degree | 34 (46.6%) | 39 (53.4%) |
| Graduate Degree | 0 (0.0%) | 0 (0.0%) |
| Total | 192 (50.4%) | 189 (49.6%) |
Employment Characteristics in Pleasantville
Employment by Class of Employer in Pleasantville
Among the 8,959 employed individuals in Pleasantville, private company employees (7,210 | 80.5%), local government employees (445 | 5.0%), and not-for-profit organizations (410 | 4.6%) make up the most common classes of employment.
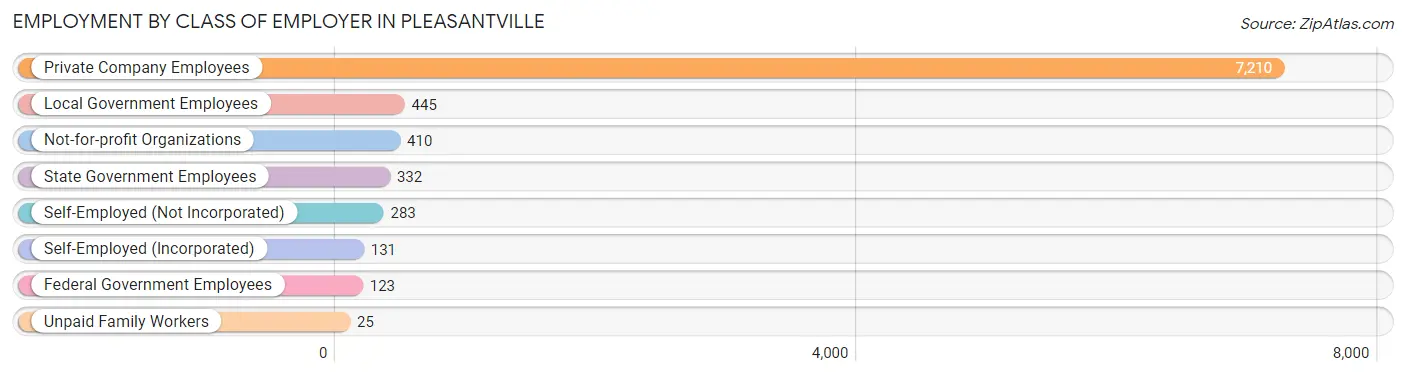
| Employer Class | # Employees | % Employees |
| Private Company Employees | 7,210 | 80.5% |
| Self-Employed (Incorporated) | 131 | 1.5% |
| Self-Employed (Not Incorporated) | 283 | 3.2% |
| Not-for-profit Organizations | 410 | 4.6% |
| Local Government Employees | 445 | 5.0% |
| State Government Employees | 332 | 3.7% |
| Federal Government Employees | 123 | 1.4% |
| Unpaid Family Workers | 25 | 0.3% |
| Total | 8,959 | 100.0% |
Employment Status by Age in Pleasantville
According to the labor force statistics for Pleasantville, out of the total population over 16 years of age (15,958), 63.3% or 10,101 individuals are in the labor force, with 9.3% or 939 of them unemployed. The age group with the highest labor force participation rate is 25 to 29 years, with 84.1% or 1,505 individuals in the labor force. Within the labor force, the 75 years and over age range has the highest percentage of unemployed individuals, with 20.0% or 13 of them being unemployed.
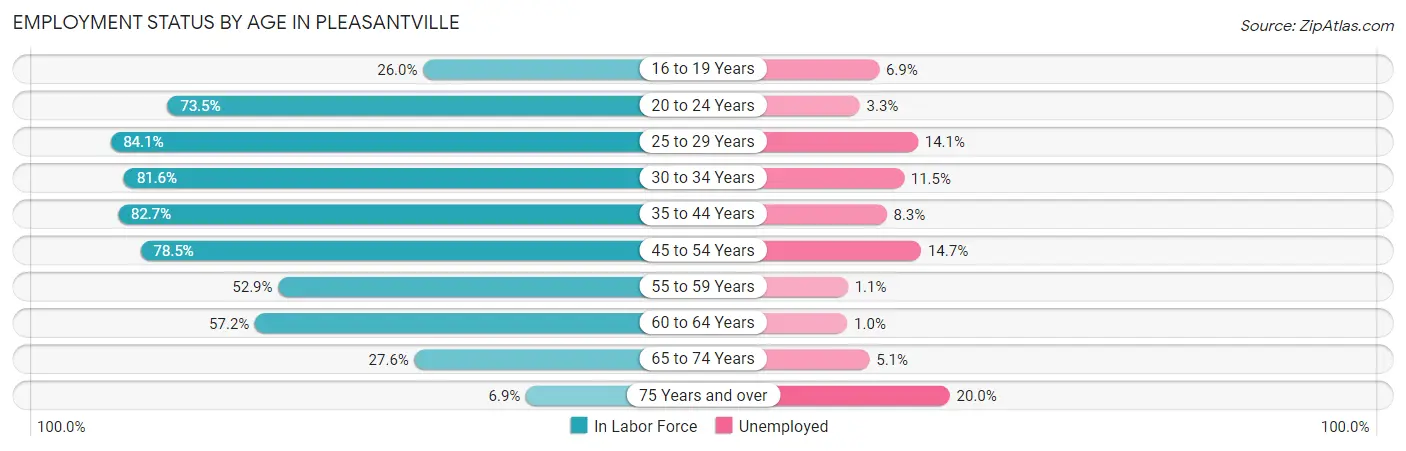
| Age Bracket | In Labor Force | Unemployed |
| 16 to 19 Years | 317 (26.0%) | 22 (6.9%) |
| 20 to 24 Years | 899 (73.5%) | 30 (3.3%) |
| 25 to 29 Years | 1,505 (84.1%) | 212 (14.1%) |
| 30 to 34 Years | 1,364 (81.6%) | 157 (11.5%) |
| 35 to 44 Years | 2,236 (82.7%) | 186 (8.3%) |
| 45 to 54 Years | 1,954 (78.5%) | 287 (14.7%) |
| 55 to 59 Years | 789 (52.9%) | 9 (1.1%) |
| 60 to 64 Years | 572 (57.2%) | 6 (1.0%) |
| 65 to 74 Years | 394 (27.6%) | 20 (5.1%) |
| 75 Years and over | 65 (6.9%) | 13 (20.0%) |
| Total | 10,101 (63.3%) | 939 (9.3%) |
Employment Status by Educational Attainment in Pleasantville
According to labor force statistics for Pleasantville, 75.5% of individuals (8,415) out of the total population between 25 and 64 years of age (11,146) are in the labor force, with 10.2% or 858 of them being unemployed. The group with the highest labor force participation rate are those with the educational attainment of bachelor's degree or higher, with 80.5% or 1,043 individuals in the labor force. Within the labor force, individuals with less than high school education have the highest percentage of unemployment, with 16.9% or 326 of them being unemployed.
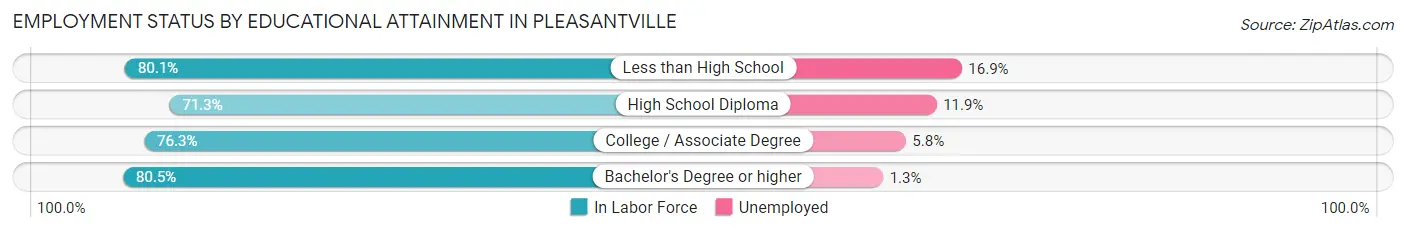
| Educational Attainment | In Labor Force | Unemployed |
| Less than High School | 1,929 (80.1%) | 407 (16.9%) |
| High School Diploma | 3,294 (71.3%) | 550 (11.9%) |
| College / Associate Degree | 2,153 (76.3%) | 164 (5.8%) |
| Bachelor's Degree or higher | 1,043 (80.5%) | 17 (1.3%) |
| Total | 8,415 (75.5%) | 1,137 (10.2%) |
Employment Occupations by Sex in Pleasantville
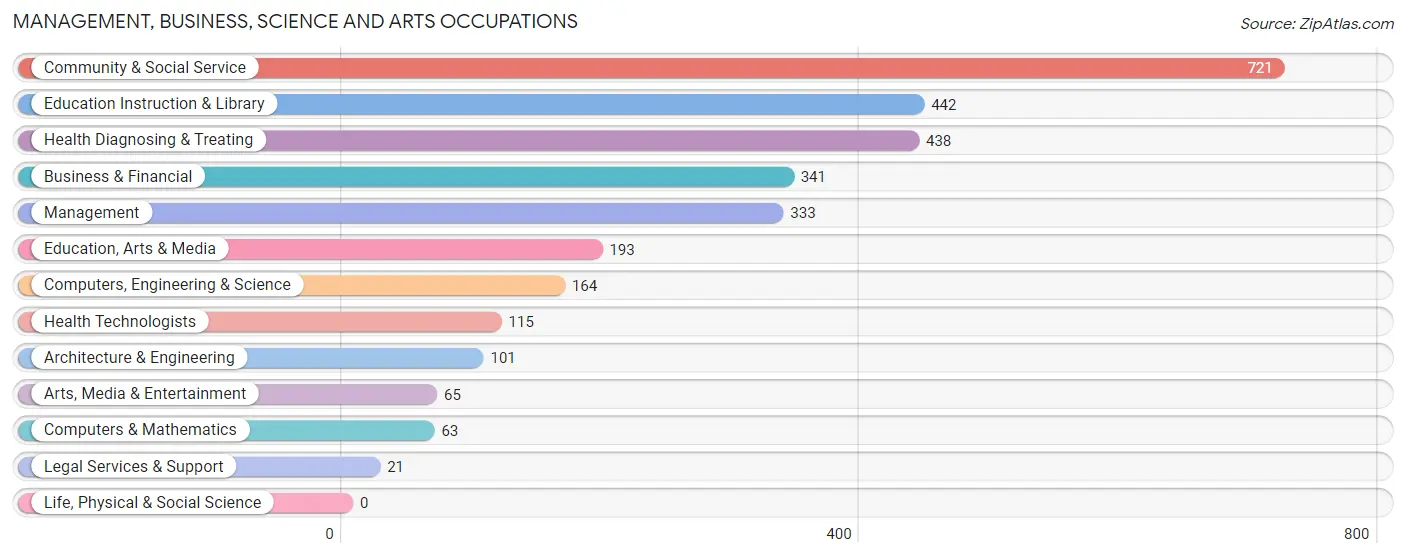
Management, Business, Science and Arts Occupations
The most common Management, Business, Science and Arts occupations in Pleasantville are Community & Social Service (721 | 7.9%), Education Instruction & Library (442 | 4.8%), Health Diagnosing & Treating (438 | 4.8%), Business & Financial (341 | 3.7%), and Management (333 | 3.6%).
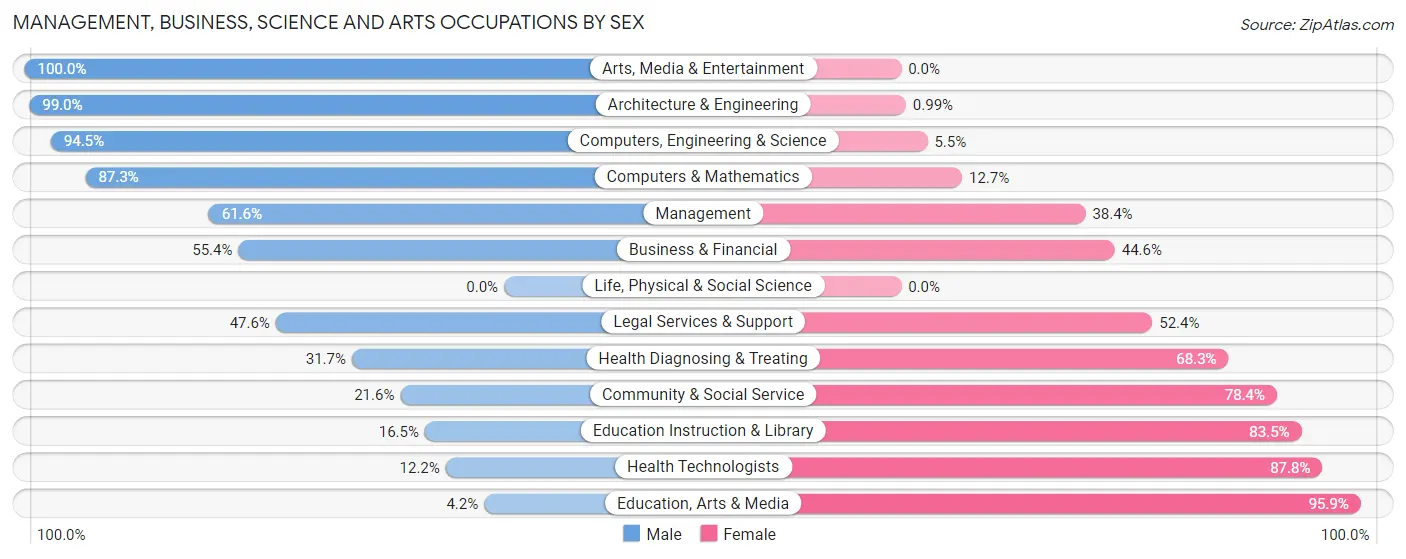
Management, Business, Science and Arts Occupations by Sex
Within the Management, Business, Science and Arts occupations in Pleasantville, the most male-oriented occupations are Arts, Media & Entertainment (100.0%), Architecture & Engineering (99.0%), and Computers, Engineering & Science (94.5%), while the most female-oriented occupations are Education, Arts & Media (95.9%), Health Technologists (87.8%), and Education Instruction & Library (83.5%).
| Occupation | Male | Female |
| Management | 205 (61.6%) | 128 (38.4%) |
| Business & Financial | 189 (55.4%) | 152 (44.6%) |
| Computers, Engineering & Science | 155 (94.5%) | 9 (5.5%) |
| Computers & Mathematics | 55 (87.3%) | 8 (12.7%) |
| Architecture & Engineering | 100 (99.0%) | 1 (1.0%) |
| Life, Physical & Social Science | 0 (0.0%) | 0 (0.0%) |
| Community & Social Service | 156 (21.6%) | 565 (78.4%) |
| Education, Arts & Media | 8 (4.2%) | 185 (95.9%) |
| Legal Services & Support | 10 (47.6%) | 11 (52.4%) |
| Education Instruction & Library | 73 (16.5%) | 369 (83.5%) |
| Arts, Media & Entertainment | 65 (100.0%) | 0 (0.0%) |
| Health Diagnosing & Treating | 139 (31.7%) | 299 (68.3%) |
| Health Technologists | 14 (12.2%) | 101 (87.8%) |
| Total (Category) | 844 (42.3%) | 1,153 (57.7%) |
| Total (Overall) | 4,380 (47.8%) | 4,774 (52.1%) |
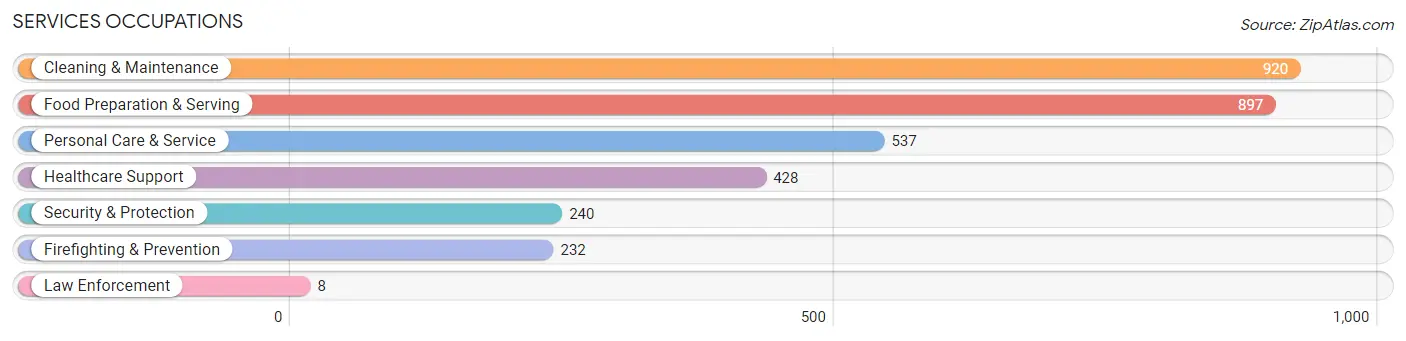
Services Occupations
The most common Services occupations in Pleasantville are Cleaning & Maintenance (920 | 10.1%), Food Preparation & Serving (897 | 9.8%), Personal Care & Service (537 | 5.9%), Healthcare Support (428 | 4.7%), and Security & Protection (240 | 2.6%).
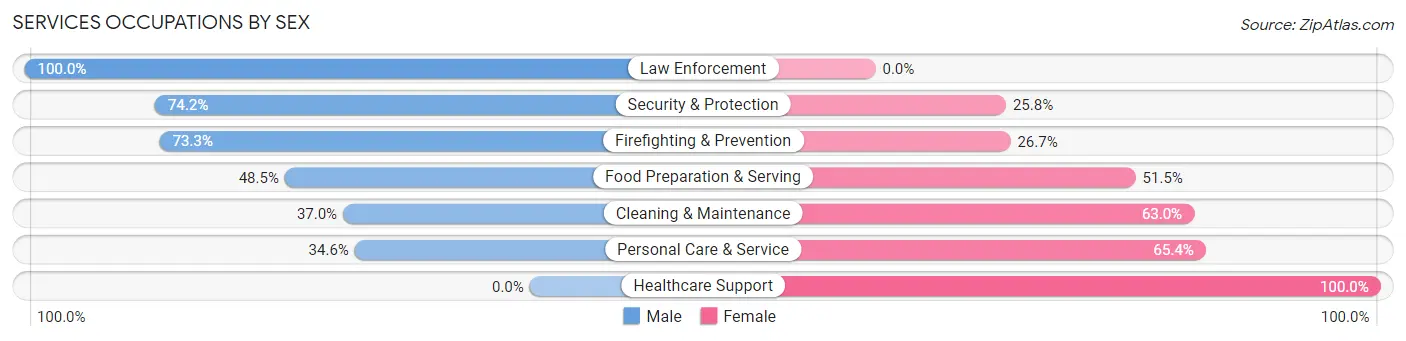
Services Occupations by Sex
Within the Services occupations in Pleasantville, the most male-oriented occupations are Law Enforcement (100.0%), Security & Protection (74.2%), and Firefighting & Prevention (73.3%), while the most female-oriented occupations are Healthcare Support (100.0%), Personal Care & Service (65.4%), and Cleaning & Maintenance (63.0%).
| Occupation | Male | Female |
| Healthcare Support | 0 (0.0%) | 428 (100.0%) |
| Security & Protection | 178 (74.2%) | 62 (25.8%) |
| Firefighting & Prevention | 170 (73.3%) | 62 (26.7%) |
| Law Enforcement | 8 (100.0%) | 0 (0.0%) |
| Food Preparation & Serving | 435 (48.5%) | 462 (51.5%) |
| Cleaning & Maintenance | 340 (37.0%) | 580 (63.0%) |
| Personal Care & Service | 186 (34.6%) | 351 (65.4%) |
| Total (Category) | 1,139 (37.7%) | 1,883 (62.3%) |
| Total (Overall) | 4,380 (47.8%) | 4,774 (52.1%) |
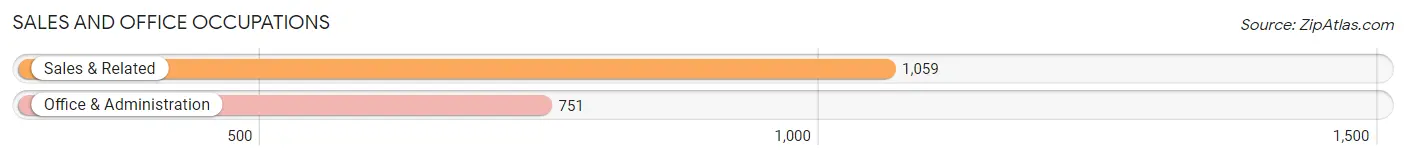
Sales and Office Occupations
The most common Sales and Office occupations in Pleasantville are Sales & Related (1,059 | 11.6%), and Office & Administration (751 | 8.2%).
Sales and Office Occupations by Sex
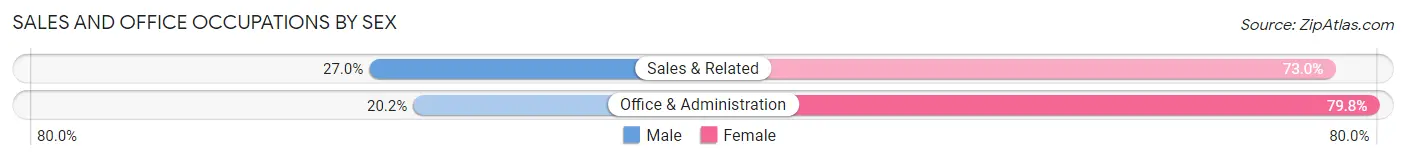
| Occupation | Male | Female |
| Sales & Related | 286 (27.0%) | 773 (73.0%) |
| Office & Administration | 152 (20.2%) | 599 (79.8%) |
| Total (Category) | 438 (24.2%) | 1,372 (75.8%) |
| Total (Overall) | 4,380 (47.8%) | 4,774 (52.1%) |
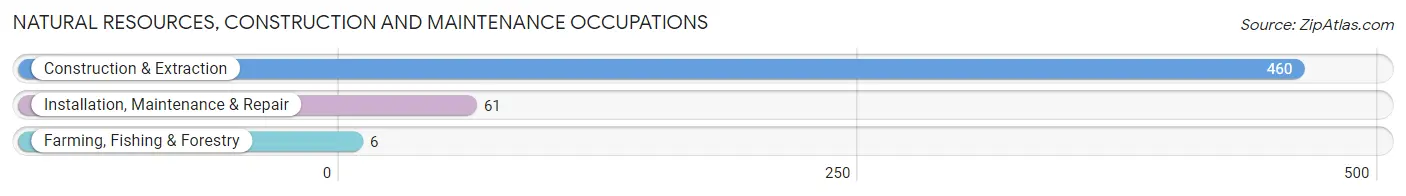
Natural Resources, Construction and Maintenance Occupations
The most common Natural Resources, Construction and Maintenance occupations in Pleasantville are Construction & Extraction (460 | 5.0%), Installation, Maintenance & Repair (61 | 0.7%), and Farming, Fishing & Forestry (6 | 0.1%).
Natural Resources, Construction and Maintenance Occupations by Sex
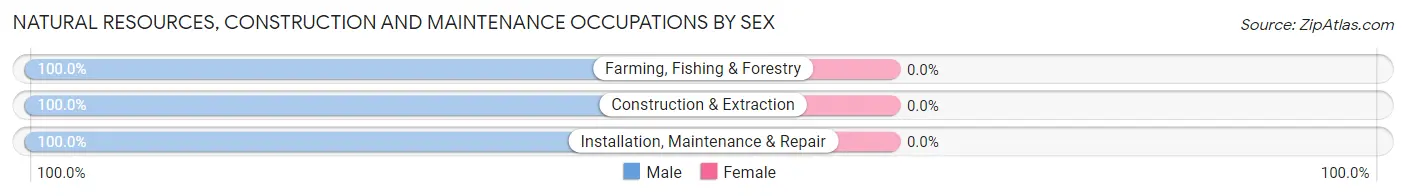
| Occupation | Male | Female |
| Farming, Fishing & Forestry | 6 (100.0%) | 0 (0.0%) |
| Construction & Extraction | 460 (100.0%) | 0 (0.0%) |
| Installation, Maintenance & Repair | 61 (100.0%) | 0 (0.0%) |
| Total (Category) | 527 (100.0%) | 0 (0.0%) |
| Total (Overall) | 4,380 (47.8%) | 4,774 (52.1%) |
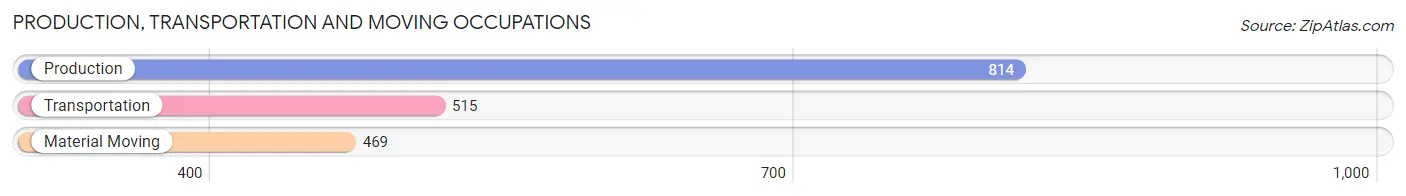
Production, Transportation and Moving Occupations
The most common Production, Transportation and Moving occupations in Pleasantville are Production (814 | 8.9%), Transportation (515 | 5.6%), and Material Moving (469 | 5.1%).
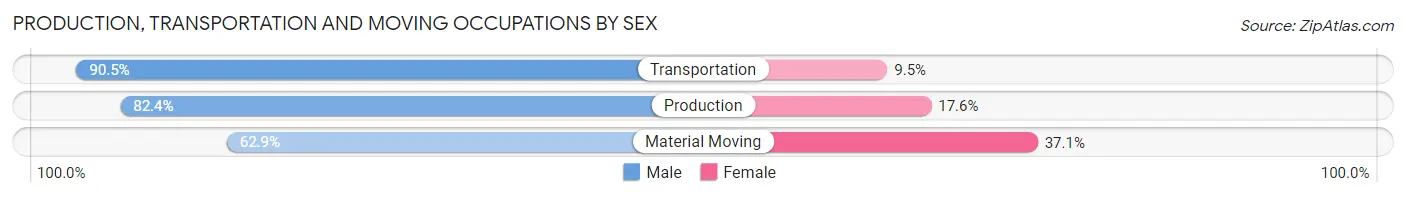
Production, Transportation and Moving Occupations by Sex
| Occupation | Male | Female |
| Production | 671 (82.4%) | 143 (17.6%) |
| Transportation | 466 (90.5%) | 49 (9.5%) |
| Material Moving | 295 (62.9%) | 174 (37.1%) |
| Total (Category) | 1,432 (79.6%) | 366 (20.4%) |
| Total (Overall) | 4,380 (47.8%) | 4,774 (52.1%) |
Employment Industries by Sex in Pleasantville
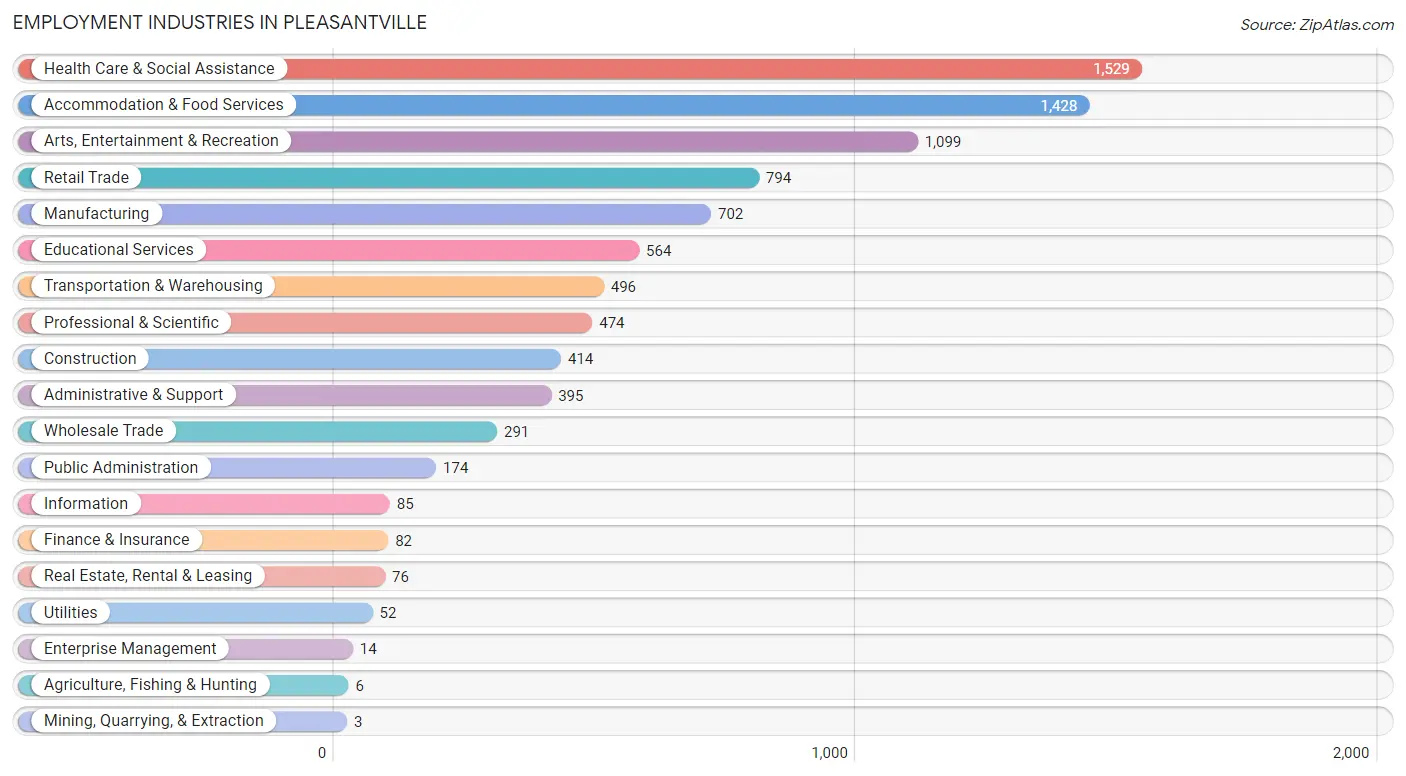
Employment Industries in Pleasantville
The major employment industries in Pleasantville include Health Care & Social Assistance (1,529 | 16.7%), Accommodation & Food Services (1,428 | 15.6%), Arts, Entertainment & Recreation (1,099 | 12.0%), Retail Trade (794 | 8.7%), and Manufacturing (702 | 7.7%).
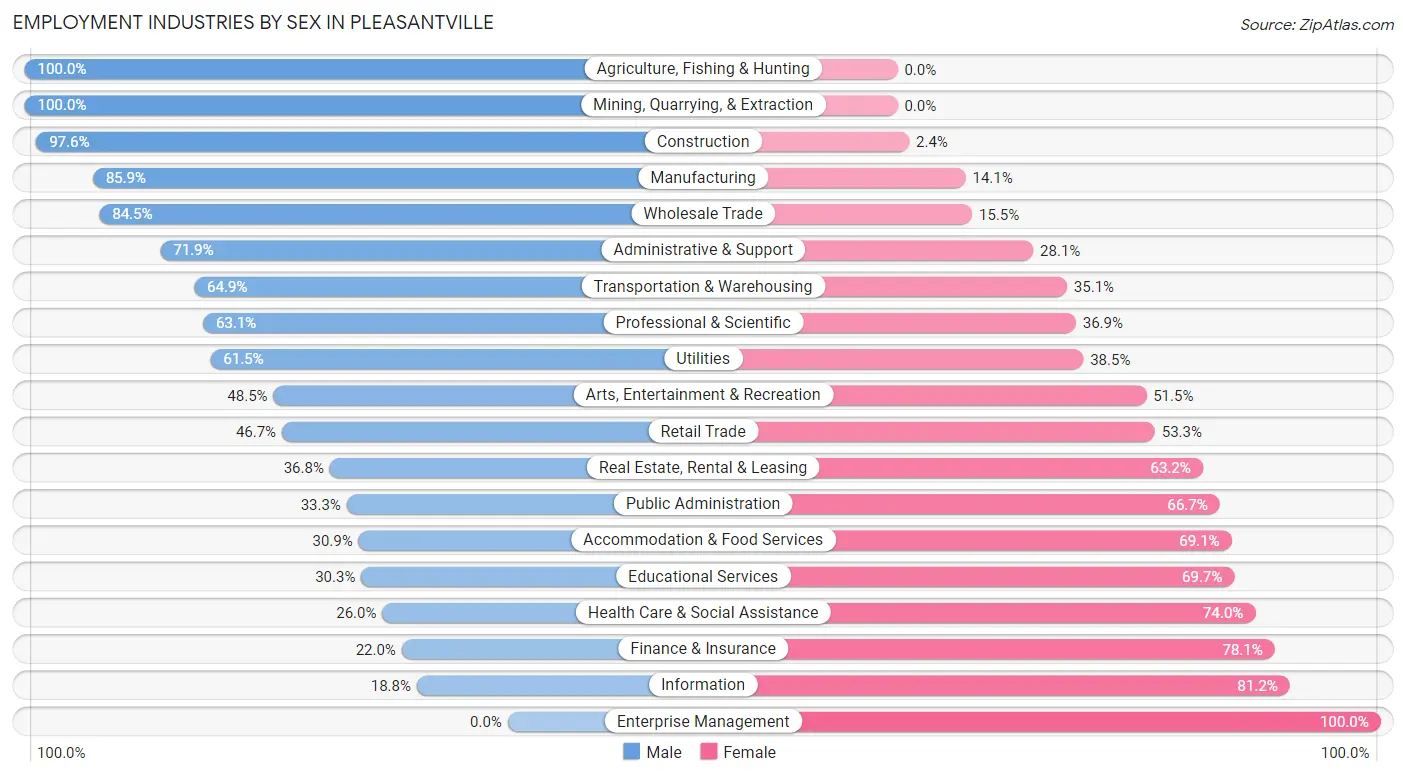
Employment Industries by Sex in Pleasantville
The Pleasantville industries that see more men than women are Agriculture, Fishing & Hunting (100.0%), Mining, Quarrying, & Extraction (100.0%), and Construction (97.6%), whereas the industries that tend to have a higher number of women are Enterprise Management (100.0%), Information (81.2%), and Finance & Insurance (78.0%).
| Industry | Male | Female |
| Agriculture, Fishing & Hunting | 6 (100.0%) | 0 (0.0%) |
| Mining, Quarrying, & Extraction | 3 (100.0%) | 0 (0.0%) |
| Construction | 404 (97.6%) | 10 (2.4%) |
| Manufacturing | 603 (85.9%) | 99 (14.1%) |
| Wholesale Trade | 246 (84.5%) | 45 (15.5%) |
| Retail Trade | 371 (46.7%) | 423 (53.3%) |
| Transportation & Warehousing | 322 (64.9%) | 174 (35.1%) |
| Utilities | 32 (61.5%) | 20 (38.5%) |
| Information | 16 (18.8%) | 69 (81.2%) |
| Finance & Insurance | 18 (22.0%) | 64 (78.0%) |
| Real Estate, Rental & Leasing | 28 (36.8%) | 48 (63.2%) |
| Professional & Scientific | 299 (63.1%) | 175 (36.9%) |
| Enterprise Management | 0 (0.0%) | 14 (100.0%) |
| Administrative & Support | 284 (71.9%) | 111 (28.1%) |
| Educational Services | 171 (30.3%) | 393 (69.7%) |
| Health Care & Social Assistance | 397 (26.0%) | 1,132 (74.0%) |
| Arts, Entertainment & Recreation | 533 (48.5%) | 566 (51.5%) |
| Accommodation & Food Services | 441 (30.9%) | 987 (69.1%) |
| Public Administration | 58 (33.3%) | 116 (66.7%) |
| Total | 4,380 (47.8%) | 4,774 (52.1%) |
Education in Pleasantville
School Enrollment in Pleasantville
The most common levels of schooling among the 5,310 students in Pleasantville are high school (1,325 | 24.9%), college / undergraduate (1,308 | 24.6%), and elementary school (1,123 | 21.1%).
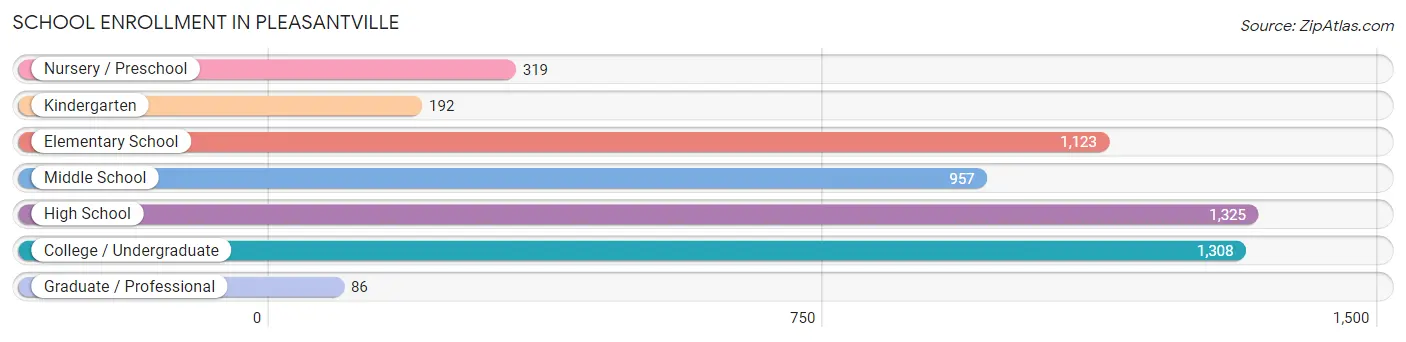
| School Level | # Students | % Students |
| Nursery / Preschool | 319 | 6.0% |
| Kindergarten | 192 | 3.6% |
| Elementary School | 1,123 | 21.1% |
| Middle School | 957 | 18.0% |
| High School | 1,325 | 24.9% |
| College / Undergraduate | 1,308 | 24.6% |
| Graduate / Professional | 86 | 1.6% |
| Total | 5,310 | 100.0% |
School Enrollment by Age by Funding Source in Pleasantville
Out of a total of 5,310 students who are enrolled in schools in Pleasantville, 350 (6.6%) attend a private institution, while the remaining 4,960 (93.4%) are enrolled in public schools. The age group of 35 years and over has the highest likelihood of being enrolled in private schools, with 100 (24.0% in the age bracket) enrolled. Conversely, the age group of 18 to 19 year olds has the lowest likelihood of being enrolled in a private school, with 323 (100.0% in the age bracket) attending a public institution.
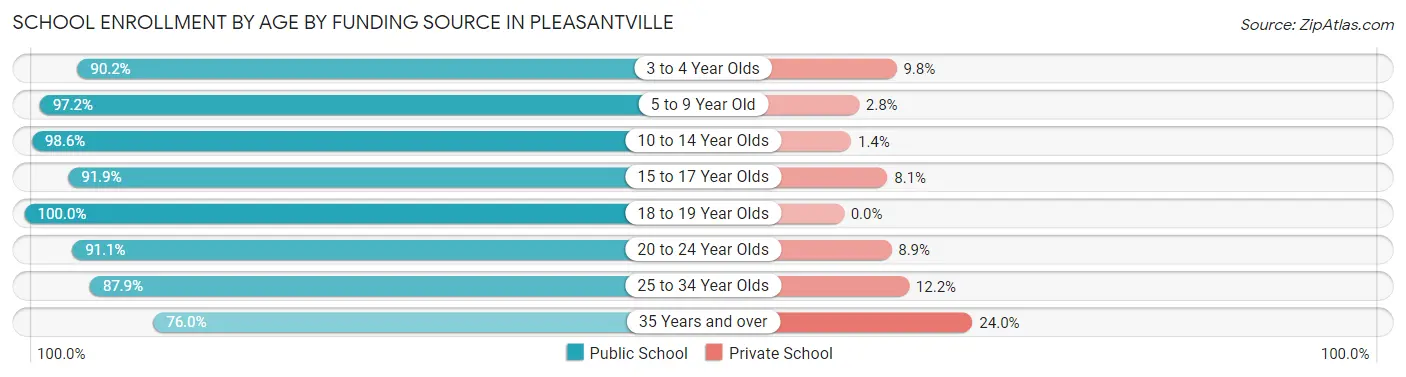
| Age Bracket | Public School | Private School |
| 3 to 4 Year Olds | 330 (90.2%) | 36 (9.8%) |
| 5 to 9 Year Old | 1,137 (97.2%) | 33 (2.8%) |
| 10 to 14 Year Olds | 1,221 (98.6%) | 17 (1.4%) |
| 15 to 17 Year Olds | 790 (91.9%) | 70 (8.1%) |
| 18 to 19 Year Olds | 323 (100.0%) | 0 (0.0%) |
| 20 to 24 Year Olds | 493 (91.1%) | 48 (8.9%) |
| 25 to 34 Year Olds | 347 (87.8%) | 48 (12.1%) |
| 35 Years and over | 317 (76.0%) | 100 (24.0%) |
| Total | 4,960 (93.4%) | 350 (6.6%) |
Educational Attainment by Field of Study in Pleasantville
Arts & humanities (280 | 17.9%), business (249 | 15.9%), education (228 | 14.6%), science & technology (127 | 8.1%), and bio, nature & agricultural (114 | 7.3%) are the most common fields of study among 1,564 individuals in Pleasantville who have obtained a bachelor's degree or higher.
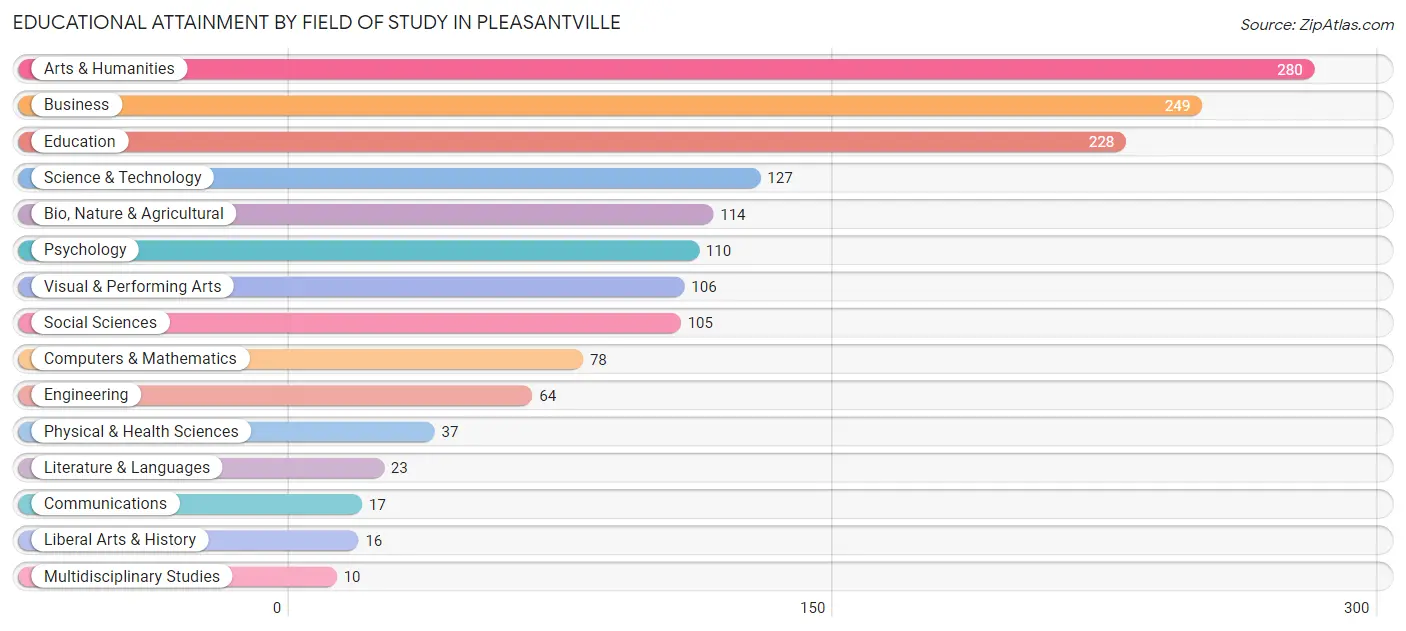
| Field of Study | # Graduates | % Graduates |
| Computers & Mathematics | 78 | 5.0% |
| Bio, Nature & Agricultural | 114 | 7.3% |
| Physical & Health Sciences | 37 | 2.4% |
| Psychology | 110 | 7.0% |
| Social Sciences | 105 | 6.7% |
| Engineering | 64 | 4.1% |
| Multidisciplinary Studies | 10 | 0.6% |
| Science & Technology | 127 | 8.1% |
| Business | 249 | 15.9% |
| Education | 228 | 14.6% |
| Literature & Languages | 23 | 1.5% |
| Liberal Arts & History | 16 | 1.0% |
| Visual & Performing Arts | 106 | 6.8% |
| Communications | 17 | 1.1% |
| Arts & Humanities | 280 | 17.9% |
| Total | 1,564 | 100.0% |
Transportation & Commute in Pleasantville
Vehicle Availability by Sex in Pleasantville
The most prevalent vehicle ownership categories in Pleasantville are males with 2 vehicles (1,347, accounting for 31.4%) and females with 2 vehicles (1,583, making up 28.9%).
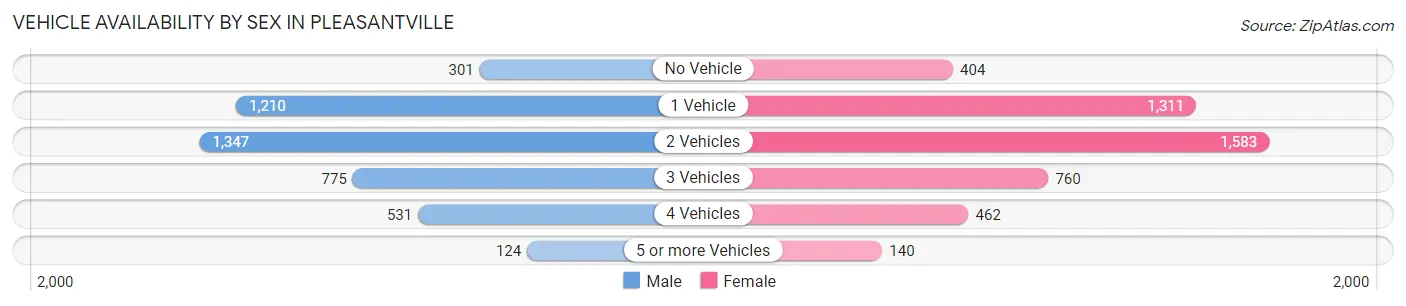
| Vehicles Available | Male | Female |
| No Vehicle | 301 (7.0%) | 404 (8.7%) |
| 1 Vehicle | 1,210 (28.2%) | 1,311 (28.1%) |
| 2 Vehicles | 1,347 (31.4%) | 1,583 (34.0%) |
| 3 Vehicles | 775 (18.1%) | 760 (16.3%) |
| 4 Vehicles | 531 (12.4%) | 462 (9.9%) |
| 5 or more Vehicles | 124 (2.9%) | 140 (3.0%) |
| Total | 4,288 (100.0%) | 4,660 (100.0%) |
Commute Time in Pleasantville
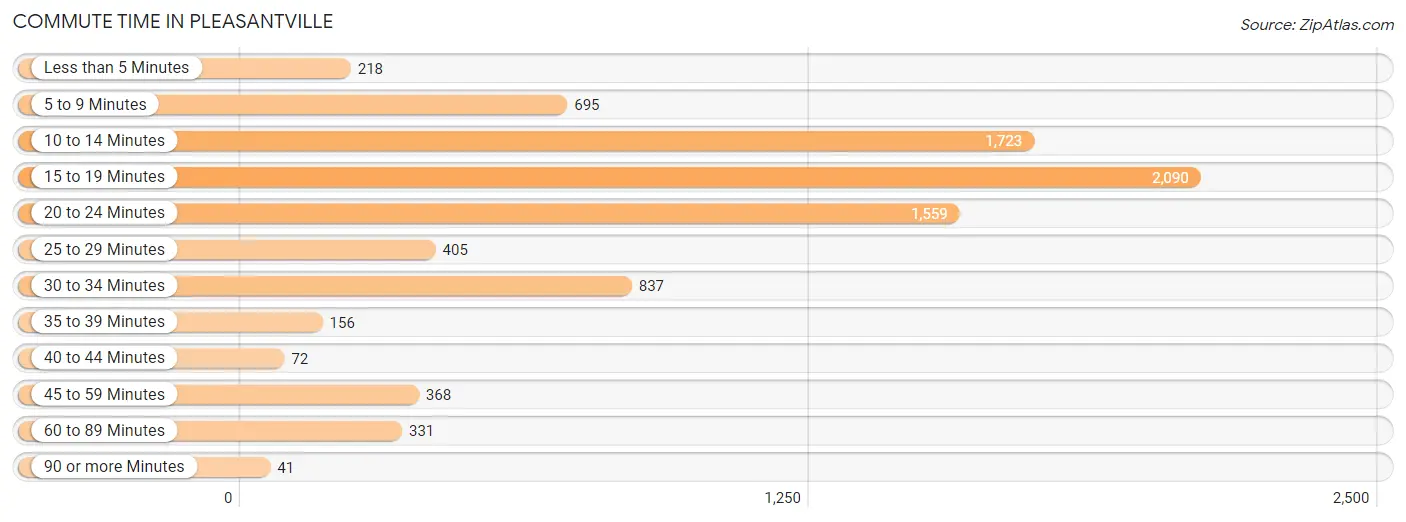
The most frequently occuring commute durations in Pleasantville are 15 to 19 minutes (2,090 commuters, 24.6%), 10 to 14 minutes (1,723 commuters, 20.3%), and 20 to 24 minutes (1,559 commuters, 18.3%).
| Commute Time | # Commuters | % Commuters |
| Less than 5 Minutes | 218 | 2.6% |
| 5 to 9 Minutes | 695 | 8.2% |
| 10 to 14 Minutes | 1,723 | 20.3% |
| 15 to 19 Minutes | 2,090 | 24.6% |
| 20 to 24 Minutes | 1,559 | 18.3% |
| 25 to 29 Minutes | 405 | 4.8% |
| 30 to 34 Minutes | 837 | 9.9% |
| 35 to 39 Minutes | 156 | 1.8% |
| 40 to 44 Minutes | 72 | 0.9% |
| 45 to 59 Minutes | 368 | 4.3% |
| 60 to 89 Minutes | 331 | 3.9% |
| 90 or more Minutes | 41 | 0.5% |
Commute Time by Sex in Pleasantville
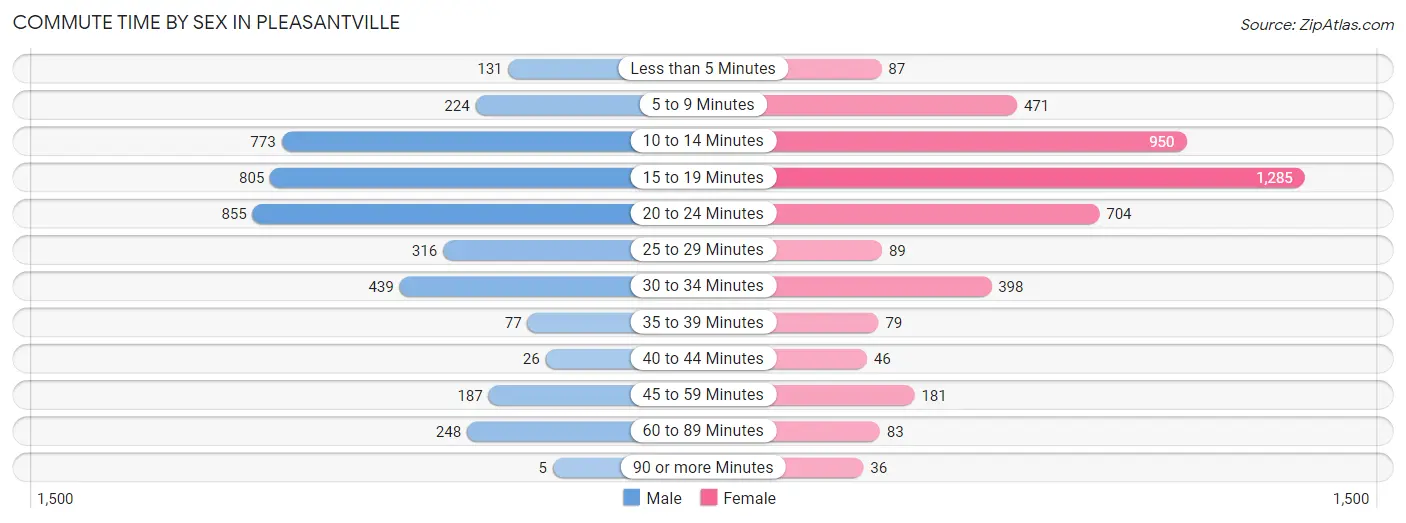
The most common commute times in Pleasantville are 20 to 24 minutes (855 commuters, 20.9%) for males and 15 to 19 minutes (1,285 commuters, 29.1%) for females.
| Commute Time | Male | Female |
| Less than 5 Minutes | 131 (3.2%) | 87 (2.0%) |
| 5 to 9 Minutes | 224 (5.5%) | 471 (10.7%) |
| 10 to 14 Minutes | 773 (18.9%) | 950 (21.5%) |
| 15 to 19 Minutes | 805 (19.7%) | 1,285 (29.1%) |
| 20 to 24 Minutes | 855 (20.9%) | 704 (16.0%) |
| 25 to 29 Minutes | 316 (7.7%) | 89 (2.0%) |
| 30 to 34 Minutes | 439 (10.7%) | 398 (9.0%) |
| 35 to 39 Minutes | 77 (1.9%) | 79 (1.8%) |
| 40 to 44 Minutes | 26 (0.6%) | 46 (1.0%) |
| 45 to 59 Minutes | 187 (4.6%) | 181 (4.1%) |
| 60 to 89 Minutes | 248 (6.1%) | 83 (1.9%) |
| 90 or more Minutes | 5 (0.1%) | 36 (0.8%) |
Time of Departure to Work by Sex in Pleasantville
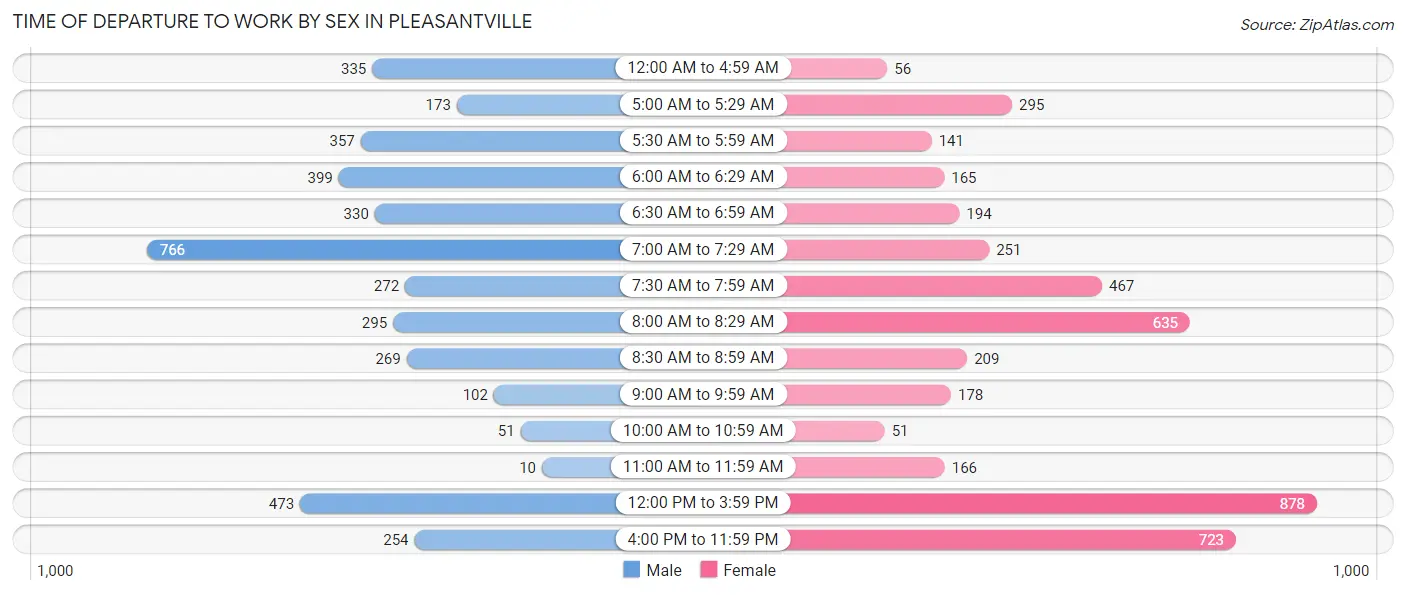
The most frequent times of departure to work in Pleasantville are 7:00 AM to 7:29 AM (766, 18.8%) for males and 12:00 PM to 3:59 PM (878, 19.9%) for females.
| Time of Departure | Male | Female |
| 12:00 AM to 4:59 AM | 335 (8.2%) | 56 (1.3%) |
| 5:00 AM to 5:29 AM | 173 (4.2%) | 295 (6.7%) |
| 5:30 AM to 5:59 AM | 357 (8.7%) | 141 (3.2%) |
| 6:00 AM to 6:29 AM | 399 (9.8%) | 165 (3.7%) |
| 6:30 AM to 6:59 AM | 330 (8.1%) | 194 (4.4%) |
| 7:00 AM to 7:29 AM | 766 (18.8%) | 251 (5.7%) |
| 7:30 AM to 7:59 AM | 272 (6.7%) | 467 (10.6%) |
| 8:00 AM to 8:29 AM | 295 (7.2%) | 635 (14.4%) |
| 8:30 AM to 8:59 AM | 269 (6.6%) | 209 (4.7%) |
| 9:00 AM to 9:59 AM | 102 (2.5%) | 178 (4.0%) |
| 10:00 AM to 10:59 AM | 51 (1.3%) | 51 (1.2%) |
| 11:00 AM to 11:59 AM | 10 (0.2%) | 166 (3.8%) |
| 12:00 PM to 3:59 PM | 473 (11.6%) | 878 (19.9%) |
| 4:00 PM to 11:59 PM | 254 (6.2%) | 723 (16.4%) |
| Total | 4,086 (100.0%) | 4,409 (100.0%) |
Housing Occupancy in Pleasantville
Occupancy by Ownership in Pleasantville
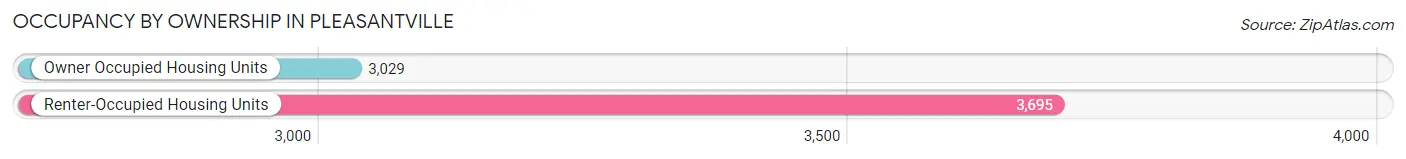
Of the total 6,724 dwellings in Pleasantville, owner-occupied units account for 3,029 (45.1%), while renter-occupied units make up 3,695 (54.9%).
| Occupancy | # Housing Units | % Housing Units |
| Owner Occupied Housing Units | 3,029 | 45.1% |
| Renter-Occupied Housing Units | 3,695 | 54.9% |
| Total Occupied Housing Units | 6,724 | 100.0% |
Occupancy by Household Size in Pleasantville
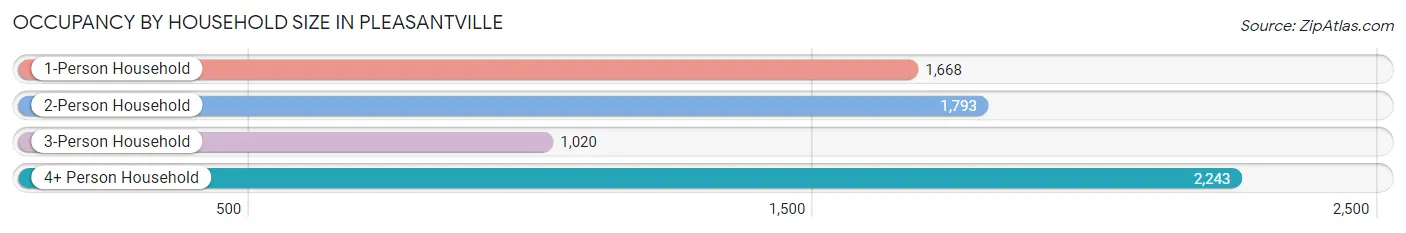
| Household Size | # Housing Units | % Housing Units |
| 1-Person Household | 1,668 | 24.8% |
| 2-Person Household | 1,793 | 26.7% |
| 3-Person Household | 1,020 | 15.2% |
| 4+ Person Household | 2,243 | 33.4% |
| Total Housing Units | 6,724 | 100.0% |
Occupancy by Ownership by Household Size in Pleasantville
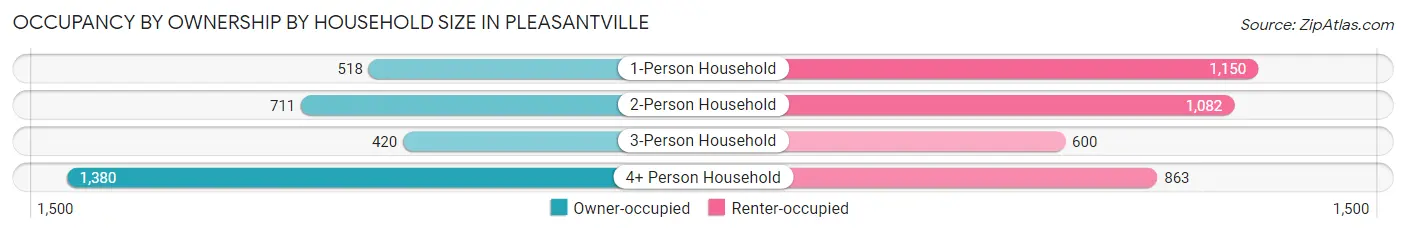
| Household Size | Owner-occupied | Renter-occupied |
| 1-Person Household | 518 (31.1%) | 1,150 (68.9%) |
| 2-Person Household | 711 (39.7%) | 1,082 (60.4%) |
| 3-Person Household | 420 (41.2%) | 600 (58.8%) |
| 4+ Person Household | 1,380 (61.5%) | 863 (38.5%) |
| Total Housing Units | 3,029 (45.1%) | 3,695 (54.9%) |
Occupancy by Educational Attainment in Pleasantville
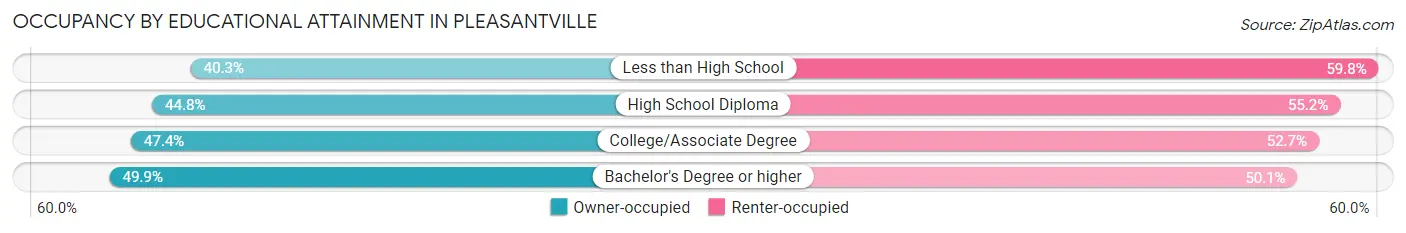
| Household Size | Owner-occupied | Renter-occupied |
| Less than High School | 683 (40.3%) | 1,014 (59.8%) |
| High School Diploma | 1,004 (44.8%) | 1,236 (55.2%) |
| College/Associate Degree | 902 (47.3%) | 1,003 (52.6%) |
| Bachelor's Degree or higher | 440 (49.9%) | 442 (50.1%) |
Occupancy by Age of Householder in Pleasantville
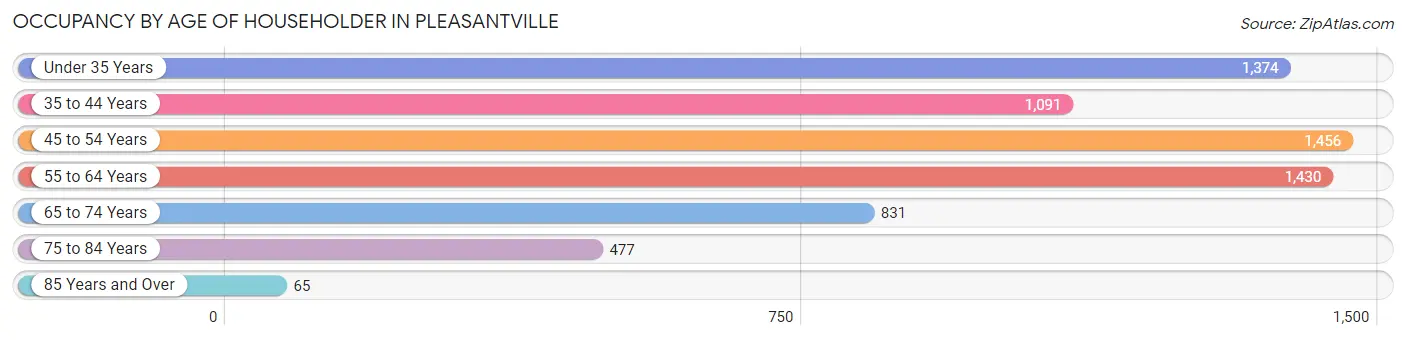
| Age Bracket | # Households | % Households |
| Under 35 Years | 1,374 | 20.4% |
| 35 to 44 Years | 1,091 | 16.2% |
| 45 to 54 Years | 1,456 | 21.6% |
| 55 to 64 Years | 1,430 | 21.3% |
| 65 to 74 Years | 831 | 12.4% |
| 75 to 84 Years | 477 | 7.1% |
| 85 Years and Over | 65 | 1.0% |
| Total | 6,724 | 100.0% |
Housing Finances in Pleasantville
Median Income by Occupancy in Pleasantville
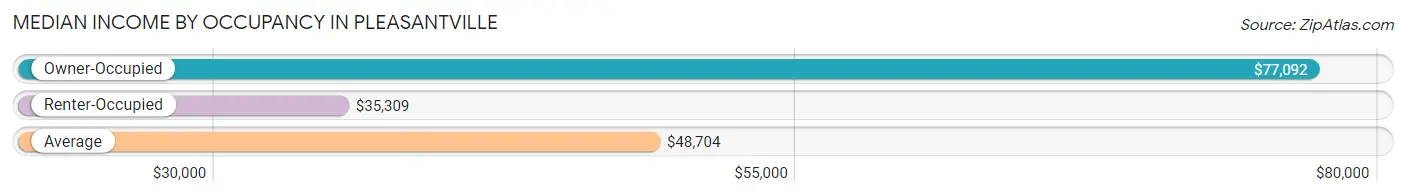
| Occupancy Type | # Households | Median Income |
| Owner-Occupied | 3,029 (45.1%) | $77,092 |
| Renter-Occupied | 3,695 (54.9%) | $35,309 |
| Average | 6,724 (100.0%) | $48,704 |
Occupancy by Householder Income Bracket in Pleasantville
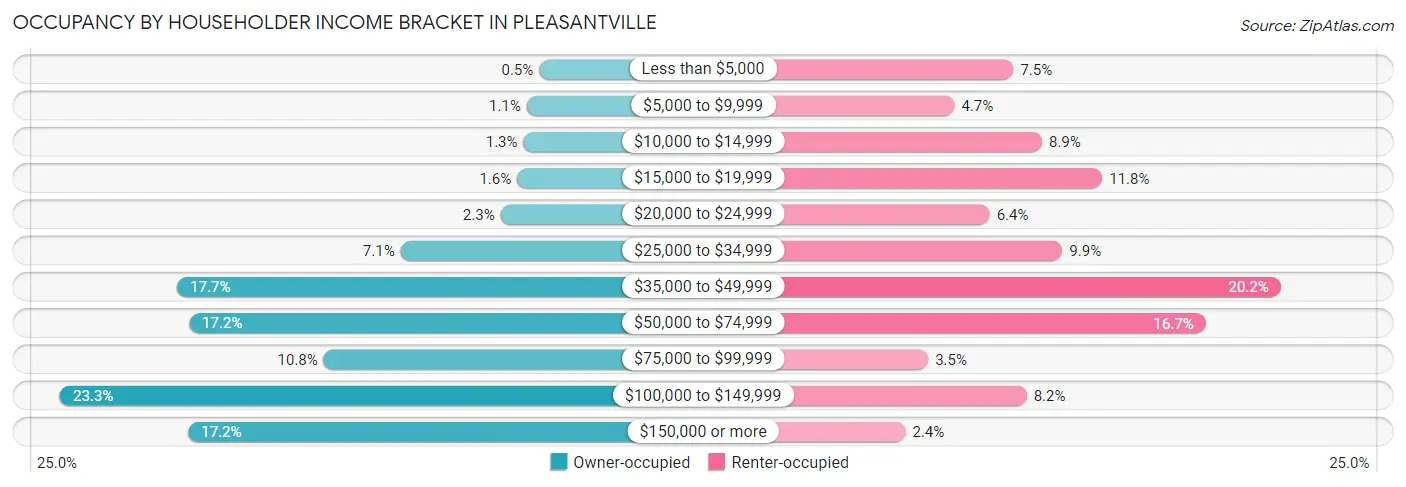
| Income Bracket | Owner-occupied | Renter-occupied |
| Less than $5,000 | 15 (0.5%) | 278 (7.5%) |
| $5,000 to $9,999 | 33 (1.1%) | 174 (4.7%) |
| $10,000 to $14,999 | 38 (1.3%) | 328 (8.9%) |
| $15,000 to $19,999 | 47 (1.5%) | 434 (11.7%) |
| $20,000 to $24,999 | 71 (2.3%) | 236 (6.4%) |
| $25,000 to $34,999 | 215 (7.1%) | 364 (9.9%) |
| $35,000 to $49,999 | 537 (17.7%) | 748 (20.2%) |
| $50,000 to $74,999 | 520 (17.2%) | 616 (16.7%) |
| $75,000 to $99,999 | 326 (10.8%) | 128 (3.5%) |
| $100,000 to $149,999 | 706 (23.3%) | 301 (8.2%) |
| $150,000 or more | 521 (17.2%) | 88 (2.4%) |
| Total | 3,029 (100.0%) | 3,695 (100.0%) |
Monthly Housing Cost Tiers in Pleasantville
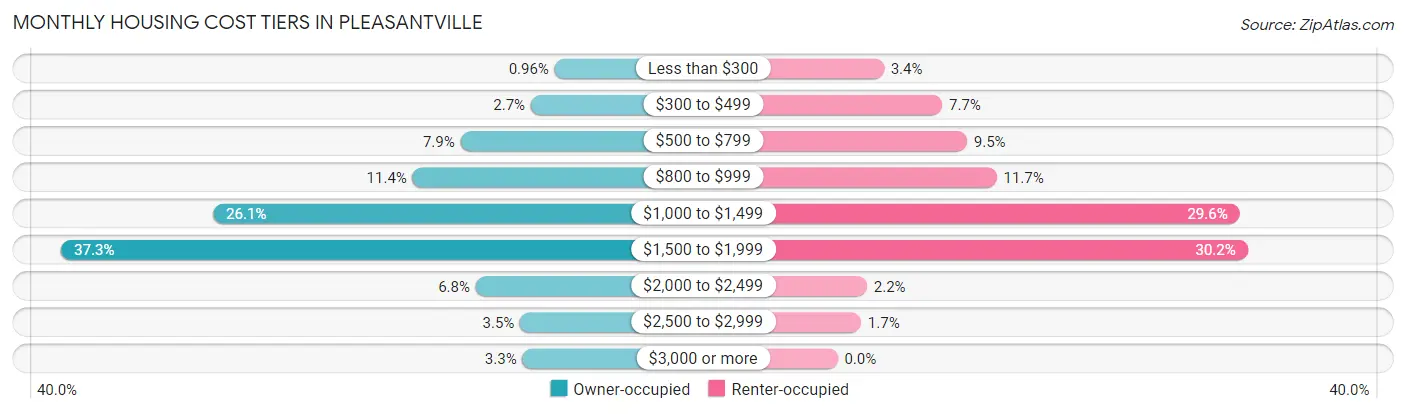
| Monthly Cost | Owner-occupied | Renter-occupied |
| Less than $300 | 29 (1.0%) | 126 (3.4%) |
| $300 to $499 | 82 (2.7%) | 285 (7.7%) |
| $500 to $799 | 239 (7.9%) | 352 (9.5%) |
| $800 to $999 | 346 (11.4%) | 433 (11.7%) |
| $1,000 to $1,499 | 791 (26.1%) | 1,094 (29.6%) |
| $1,500 to $1,999 | 1,130 (37.3%) | 1,116 (30.2%) |
| $2,000 to $2,499 | 205 (6.8%) | 80 (2.2%) |
| $2,500 to $2,999 | 106 (3.5%) | 64 (1.7%) |
| $3,000 or more | 101 (3.3%) | 0 (0.0%) |
| Total | 3,029 (100.0%) | 3,695 (100.0%) |
Physical Housing Characteristics in Pleasantville
Housing Structures in Pleasantville
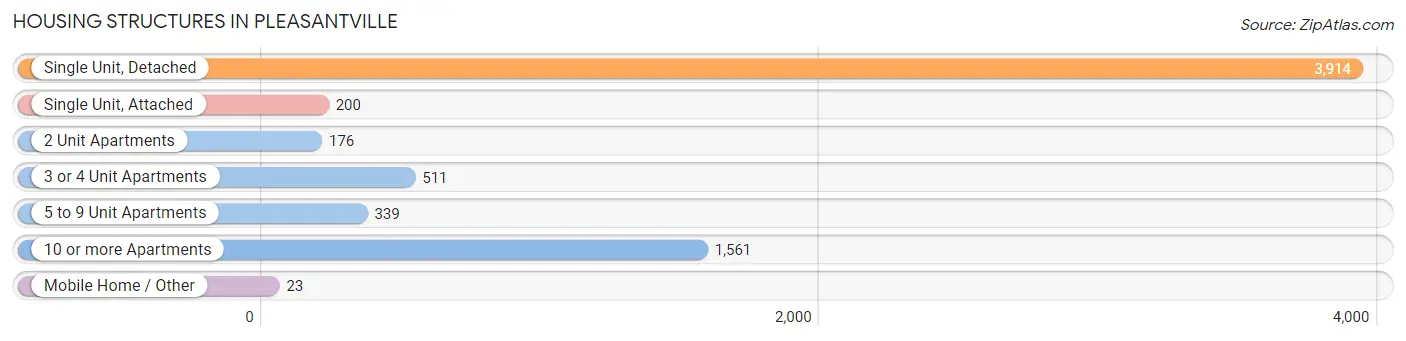
| Structure Type | # Housing Units | % Housing Units |
| Single Unit, Detached | 3,914 | 58.2% |
| Single Unit, Attached | 200 | 3.0% |
| 2 Unit Apartments | 176 | 2.6% |
| 3 or 4 Unit Apartments | 511 | 7.6% |
| 5 to 9 Unit Apartments | 339 | 5.0% |
| 10 or more Apartments | 1,561 | 23.2% |
| Mobile Home / Other | 23 | 0.3% |
| Total | 6,724 | 100.0% |
Housing Structures by Occupancy in Pleasantville
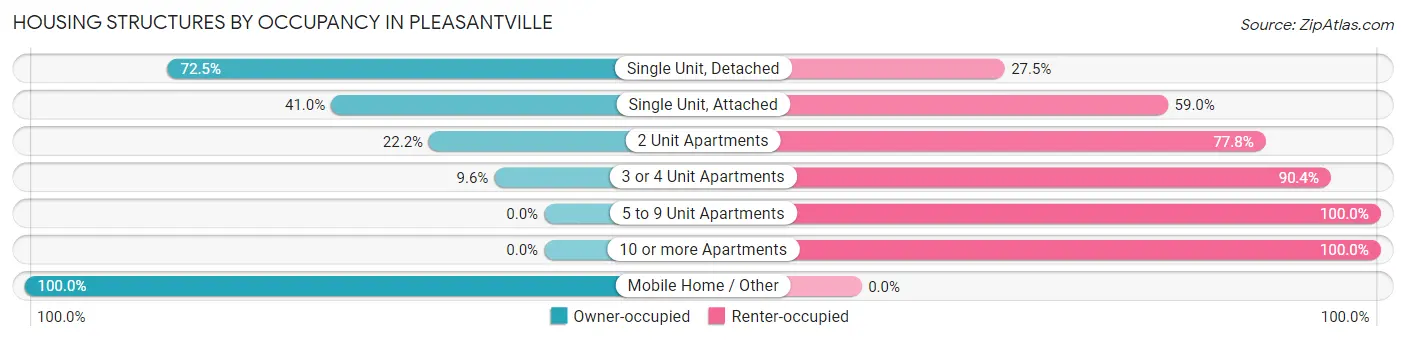
| Structure Type | Owner-occupied | Renter-occupied |
| Single Unit, Detached | 2,836 (72.5%) | 1,078 (27.5%) |
| Single Unit, Attached | 82 (41.0%) | 118 (59.0%) |
| 2 Unit Apartments | 39 (22.2%) | 137 (77.8%) |
| 3 or 4 Unit Apartments | 49 (9.6%) | 462 (90.4%) |
| 5 to 9 Unit Apartments | 0 (0.0%) | 339 (100.0%) |
| 10 or more Apartments | 0 (0.0%) | 1,561 (100.0%) |
| Mobile Home / Other | 23 (100.0%) | 0 (0.0%) |
| Total | 3,029 (45.1%) | 3,695 (54.9%) |
Housing Structures by Number of Rooms in Pleasantville
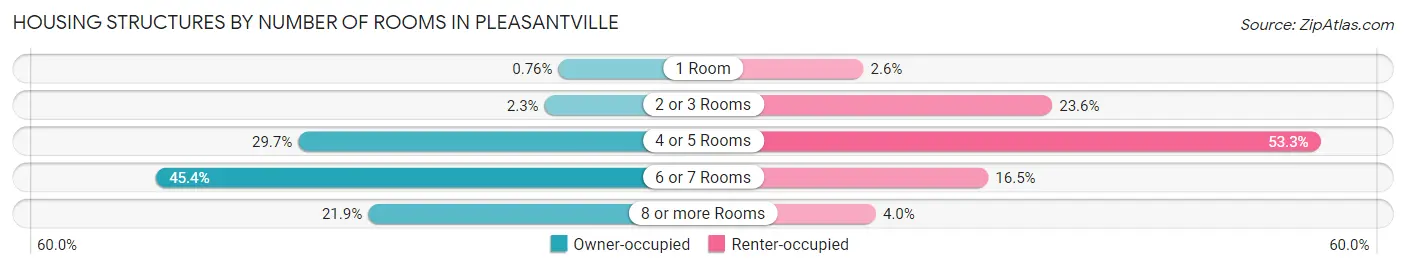
| Number of Rooms | Owner-occupied | Renter-occupied |
| 1 Room | 23 (0.8%) | 97 (2.6%) |
| 2 or 3 Rooms | 70 (2.3%) | 871 (23.6%) |
| 4 or 5 Rooms | 898 (29.6%) | 1,970 (53.3%) |
| 6 or 7 Rooms | 1,375 (45.4%) | 609 (16.5%) |
| 8 or more Rooms | 663 (21.9%) | 148 (4.0%) |
| Total | 3,029 (100.0%) | 3,695 (100.0%) |
Housing Structure by Heating Type in Pleasantville
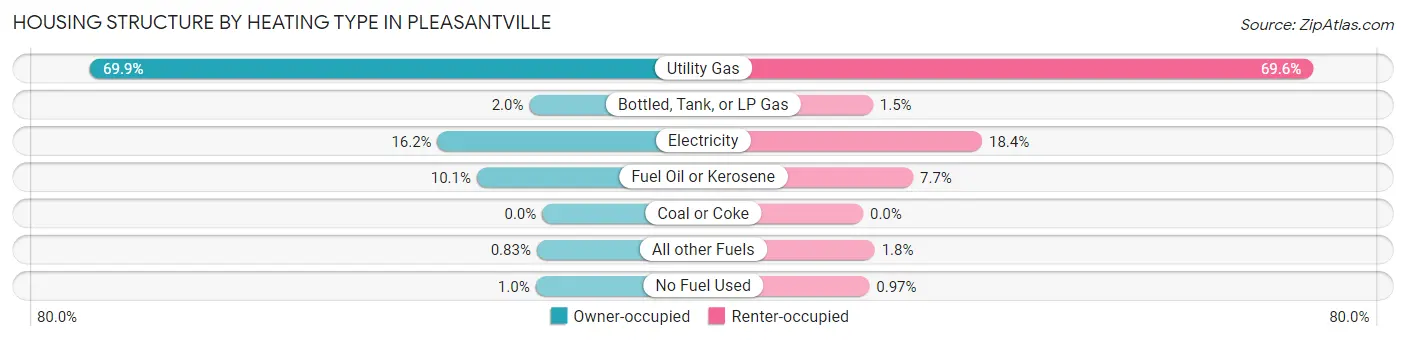
| Heating Type | Owner-occupied | Renter-occupied |
| Utility Gas | 2,117 (69.9%) | 2,570 (69.6%) |
| Bottled, Tank, or LP Gas | 60 (2.0%) | 56 (1.5%) |
| Electricity | 490 (16.2%) | 680 (18.4%) |
| Fuel Oil or Kerosene | 306 (10.1%) | 286 (7.7%) |
| Coal or Coke | 0 (0.0%) | 0 (0.0%) |
| All other Fuels | 25 (0.8%) | 67 (1.8%) |
| No Fuel Used | 31 (1.0%) | 36 (1.0%) |
| Total | 3,029 (100.0%) | 3,695 (100.0%) |
Household Vehicle Usage in Pleasantville
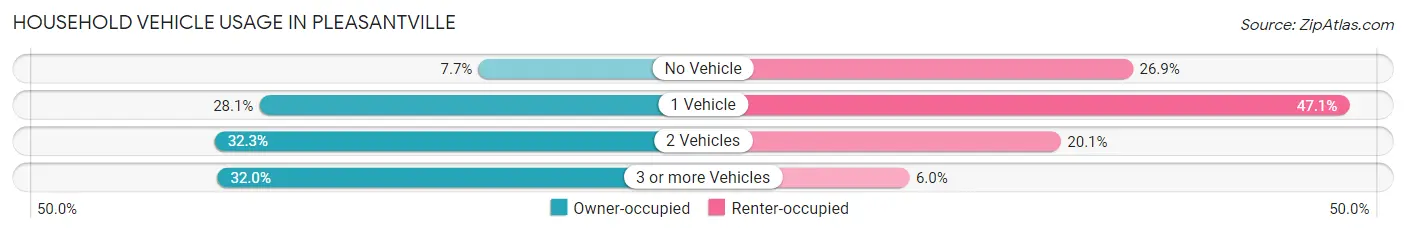
| Vehicles per Household | Owner-occupied | Renter-occupied |
| No Vehicle | 232 (7.7%) | 992 (26.9%) |
| 1 Vehicle | 851 (28.1%) | 1,739 (47.1%) |
| 2 Vehicles | 977 (32.3%) | 743 (20.1%) |
| 3 or more Vehicles | 969 (32.0%) | 221 (6.0%) |
| Total | 3,029 (100.0%) | 3,695 (100.0%) |
Real Estate & Mortgages in Pleasantville
Real Estate and Mortgage Overview in Pleasantville
| Characteristic | Without Mortgage | With Mortgage |
| Housing Units | 1,261 | 1,768 |
| Median Property Value | $144,400 | $159,600 |
| Median Household Income | $79,637 | $304 |
| Monthly Housing Costs | $966 | $101 |
| Real Estate Taxes | $5,240 | $17 |
Property Value by Mortgage Status in Pleasantville
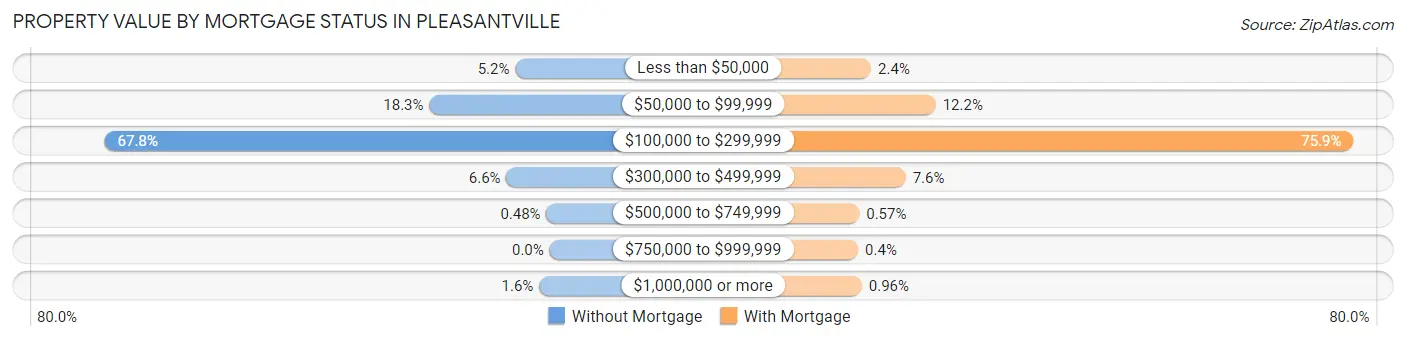
| Property Value | Without Mortgage | With Mortgage |
| Less than $50,000 | 66 (5.2%) | 42 (2.4%) |
| $50,000 to $99,999 | 231 (18.3%) | 216 (12.2%) |
| $100,000 to $299,999 | 855 (67.8%) | 1,341 (75.8%) |
| $300,000 to $499,999 | 83 (6.6%) | 135 (7.6%) |
| $500,000 to $749,999 | 6 (0.5%) | 10 (0.6%) |
| $750,000 to $999,999 | 0 (0.0%) | 7 (0.4%) |
| $1,000,000 or more | 20 (1.6%) | 17 (1.0%) |
| Total | 1,261 (100.0%) | 1,768 (100.0%) |
Household Income by Mortgage Status in Pleasantville
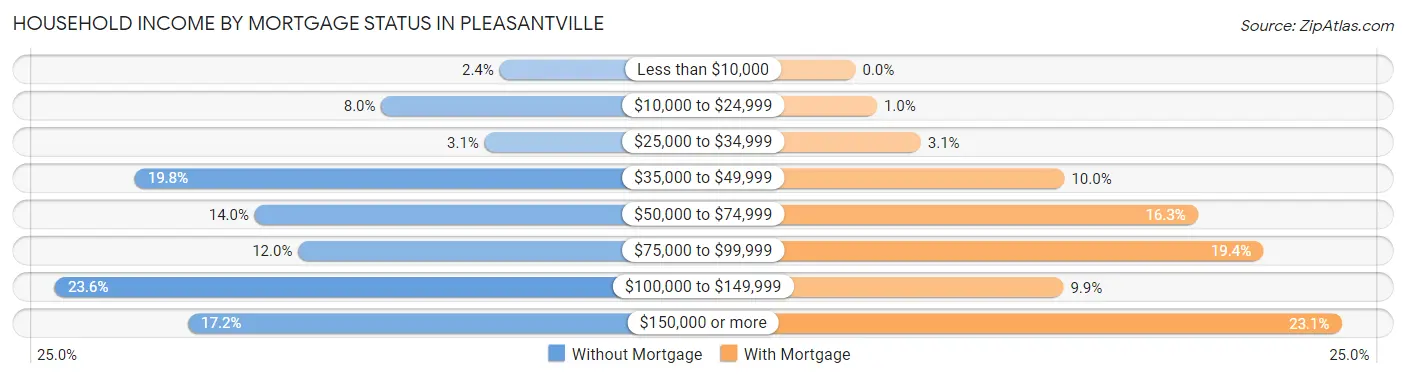
| Household Income | Without Mortgage | With Mortgage |
| Less than $10,000 | 30 (2.4%) | 0 (0.0%) |
| $10,000 to $24,999 | 101 (8.0%) | 18 (1.0%) |
| $25,000 to $34,999 | 39 (3.1%) | 55 (3.1%) |
| $35,000 to $49,999 | 249 (19.8%) | 176 (10.0%) |
| $50,000 to $74,999 | 177 (14.0%) | 288 (16.3%) |
| $75,000 to $99,999 | 151 (12.0%) | 343 (19.4%) |
| $100,000 to $149,999 | 297 (23.5%) | 175 (9.9%) |
| $150,000 or more | 217 (17.2%) | 409 (23.1%) |
| Total | 1,261 (100.0%) | 1,768 (100.0%) |
Property Value to Household Income Ratio in Pleasantville
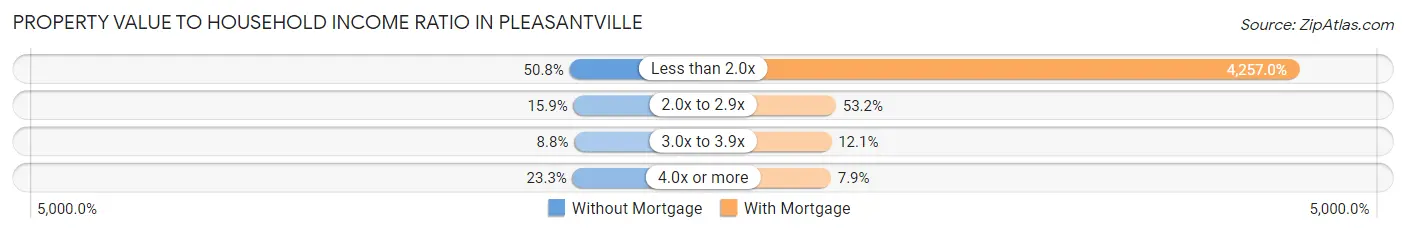
| Value-to-Income Ratio | Without Mortgage | With Mortgage |
| Less than 2.0x | 640 (50.7%) | 75,263 (4,257.0%) |
| 2.0x to 2.9x | 201 (15.9%) | 941 (53.2%) |
| 3.0x to 3.9x | 111 (8.8%) | 213 (12.0%) |
| 4.0x or more | 294 (23.3%) | 140 (7.9%) |
| Total | 1,261 (100.0%) | 1,768 (100.0%) |
Real Estate Taxes by Mortgage Status in Pleasantville
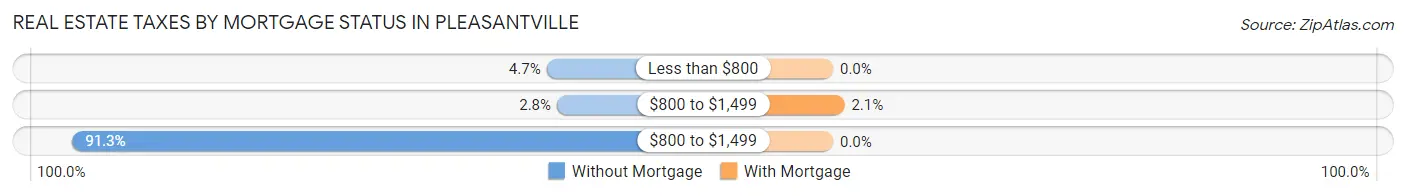
| Property Taxes | Without Mortgage | With Mortgage |
| Less than $800 | 59 (4.7%) | 0 (0.0%) |
| $800 to $1,499 | 35 (2.8%) | 37 (2.1%) |
| $800 to $1,499 | 1,151 (91.3%) | 0 (0.0%) |
| Total | 1,261 (100.0%) | 1,768 (100.0%) |
Health & Disability in Pleasantville
Health Insurance Coverage by Age in Pleasantville
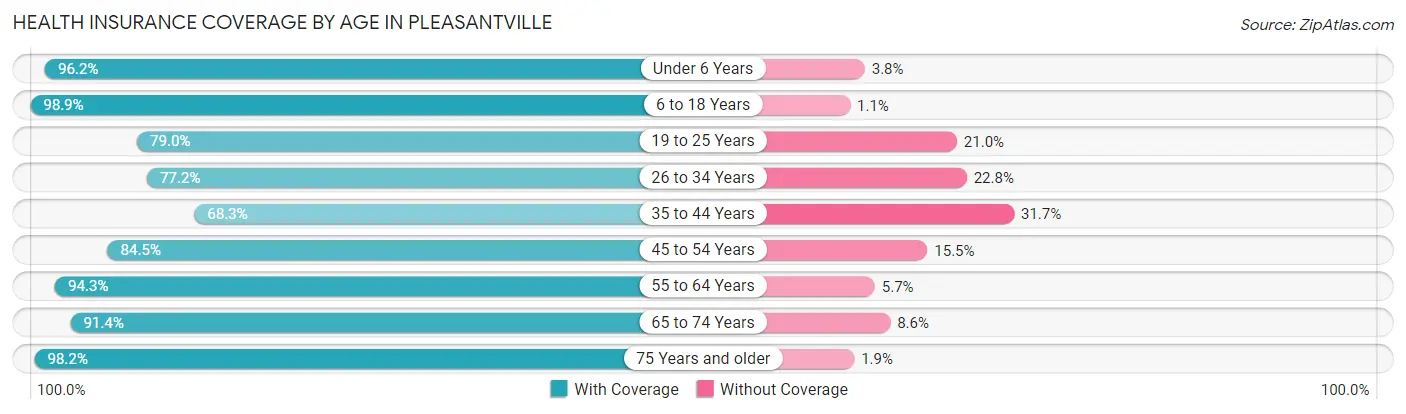
| Age Bracket | With Coverage | Without Coverage |
| Under 6 Years | 1,737 (96.2%) | 69 (3.8%) |
| 6 to 18 Years | 3,649 (98.9%) | 40 (1.1%) |
| 19 to 25 Years | 1,486 (79.0%) | 395 (21.0%) |
| 26 to 34 Years | 2,417 (77.2%) | 715 (22.8%) |
| 35 to 44 Years | 1,848 (68.3%) | 856 (31.7%) |
| 45 to 54 Years | 2,101 (84.5%) | 385 (15.5%) |
| 55 to 64 Years | 2,331 (94.3%) | 141 (5.7%) |
| 65 to 74 Years | 1,260 (91.4%) | 118 (8.6%) |
| 75 Years and older | 797 (98.2%) | 15 (1.8%) |
| Total | 17,626 (86.6%) | 2,734 (13.4%) |
Health Insurance Coverage by Citizenship Status in Pleasantville
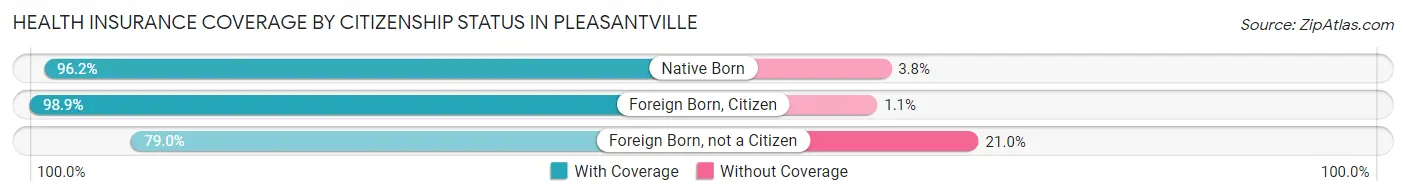
| Citizenship Status | With Coverage | Without Coverage |
| Native Born | 1,737 (96.2%) | 69 (3.8%) |
| Foreign Born, Citizen | 3,649 (98.9%) | 40 (1.1%) |
| Foreign Born, not a Citizen | 1,486 (79.0%) | 395 (21.0%) |
Health Insurance Coverage by Household Income in Pleasantville
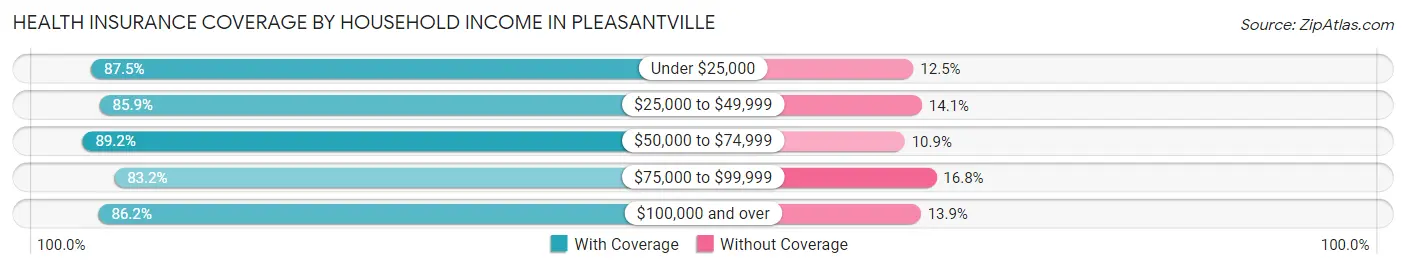
| Household Income | With Coverage | Without Coverage |
| Under $25,000 | 2,812 (87.5%) | 401 (12.5%) |
| $25,000 to $49,999 | 5,019 (85.9%) | 822 (14.1%) |
| $50,000 to $74,999 | 3,007 (89.1%) | 366 (10.8%) |
| $75,000 to $99,999 | 1,452 (83.2%) | 293 (16.8%) |
| $100,000 and over | 5,258 (86.2%) | 845 (13.9%) |
Public vs Private Health Insurance Coverage by Age in Pleasantville
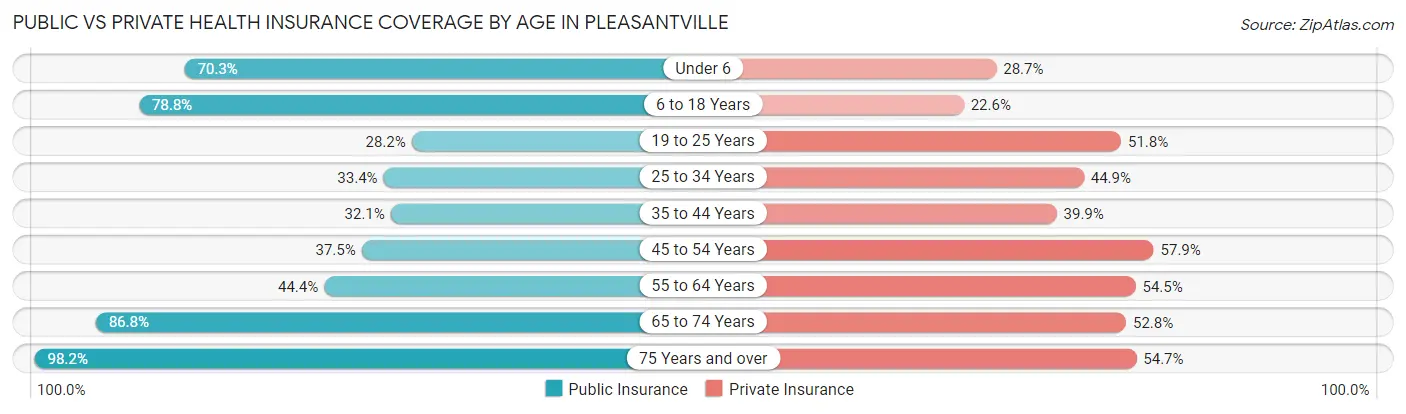
| Age Bracket | Public Insurance | Private Insurance |
| Under 6 | 1,270 (70.3%) | 518 (28.7%) |
| 6 to 18 Years | 2,906 (78.8%) | 835 (22.6%) |
| 19 to 25 Years | 530 (28.2%) | 975 (51.8%) |
| 25 to 34 Years | 1,046 (33.4%) | 1,407 (44.9%) |
| 35 to 44 Years | 867 (32.1%) | 1,078 (39.9%) |
| 45 to 54 Years | 931 (37.4%) | 1,439 (57.9%) |
| 55 to 64 Years | 1,098 (44.4%) | 1,348 (54.5%) |
| 65 to 74 Years | 1,196 (86.8%) | 727 (52.8%) |
| 75 Years and over | 797 (98.2%) | 444 (54.7%) |
| Total | 10,641 (52.3%) | 8,771 (43.1%) |
Disability Status by Sex by Age in Pleasantville
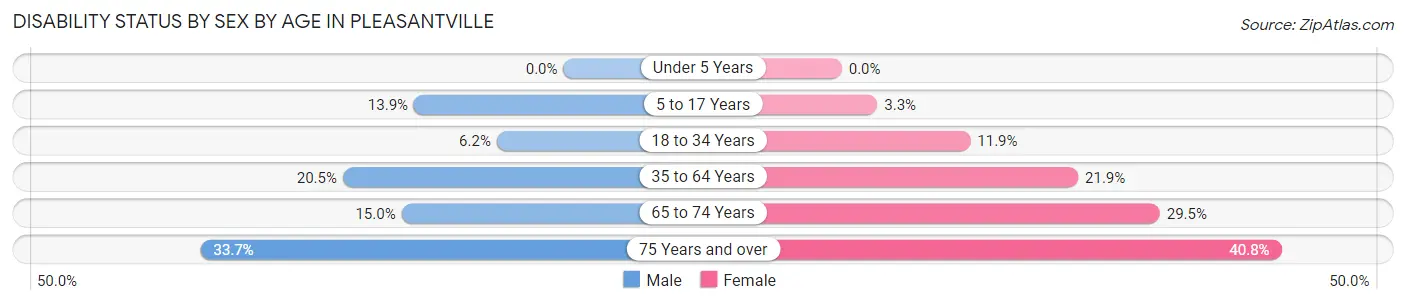
| Age Bracket | Male | Female |
| Under 5 Years | 0 (0.0%) | 0 (0.0%) |
| 5 to 17 Years | 224 (13.9%) | 61 (3.3%) |
| 18 to 34 Years | 151 (6.2%) | 343 (11.9%) |
| 35 to 64 Years | 731 (20.5%) | 897 (21.9%) |
| 65 to 74 Years | 97 (15.0%) | 216 (29.5%) |
| 75 Years and over | 96 (33.7%) | 215 (40.8%) |
Disability Class by Sex by Age in Pleasantville
Disability Class: Hearing Difficulty
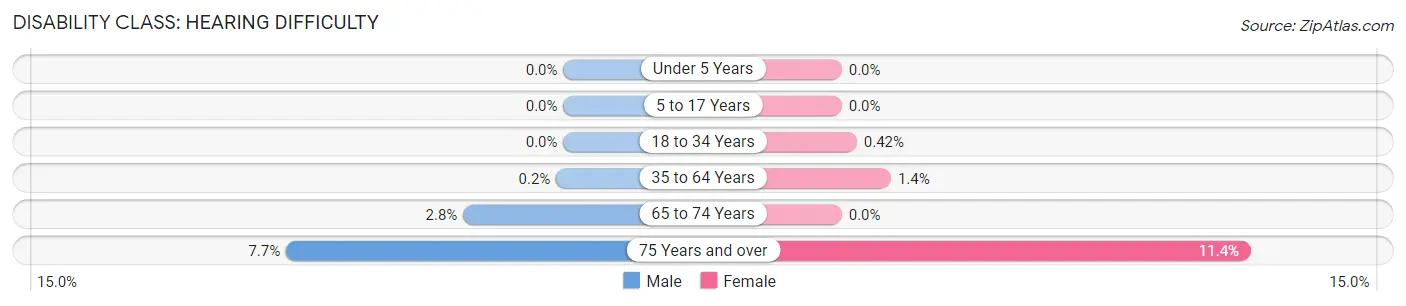
| Age Bracket | Male | Female |
| Under 5 Years | 0 (0.0%) | 0 (0.0%) |
| 5 to 17 Years | 0 (0.0%) | 0 (0.0%) |
| 18 to 34 Years | 0 (0.0%) | 12 (0.4%) |
| 35 to 64 Years | 7 (0.2%) | 56 (1.4%) |
| 65 to 74 Years | 18 (2.8%) | 0 (0.0%) |
| 75 Years and over | 22 (7.7%) | 60 (11.4%) |
Disability Class: Vision Difficulty
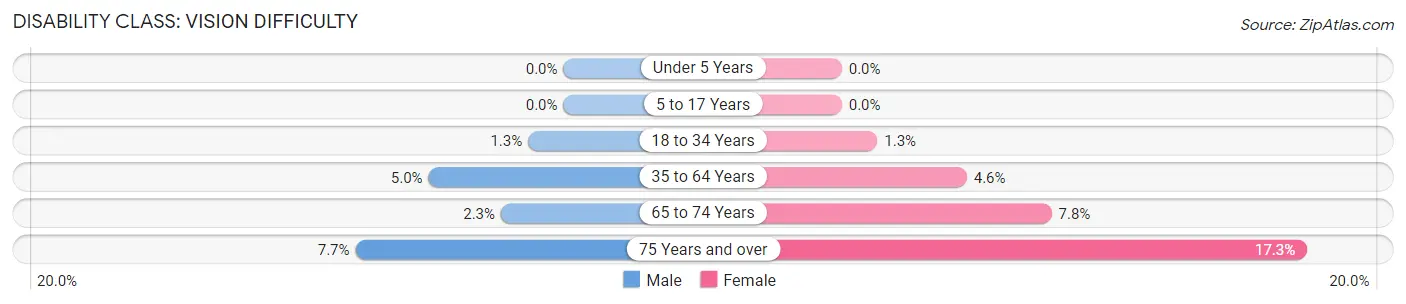
| Age Bracket | Male | Female |
| Under 5 Years | 0 (0.0%) | 0 (0.0%) |
| 5 to 17 Years | 0 (0.0%) | 0 (0.0%) |
| 18 to 34 Years | 32 (1.3%) | 38 (1.3%) |
| 35 to 64 Years | 179 (5.0%) | 190 (4.6%) |
| 65 to 74 Years | 15 (2.3%) | 57 (7.8%) |
| 75 Years and over | 22 (7.7%) | 91 (17.3%) |
Disability Class: Cognitive Difficulty
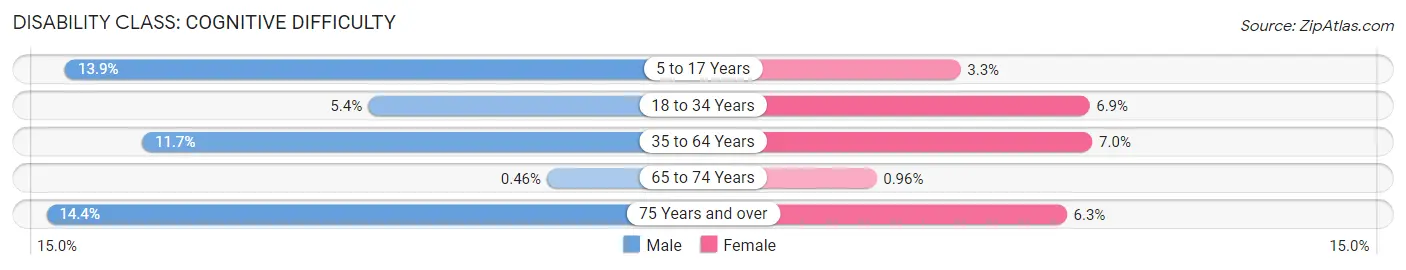
| Age Bracket | Male | Female |
| 5 to 17 Years | 224 (13.9%) | 61 (3.3%) |
| 18 to 34 Years | 133 (5.4%) | 198 (6.9%) |
| 35 to 64 Years | 419 (11.7%) | 285 (7.0%) |
| 65 to 74 Years | 3 (0.5%) | 7 (1.0%) |
| 75 Years and over | 41 (14.4%) | 33 (6.3%) |
Disability Class: Ambulatory Difficulty
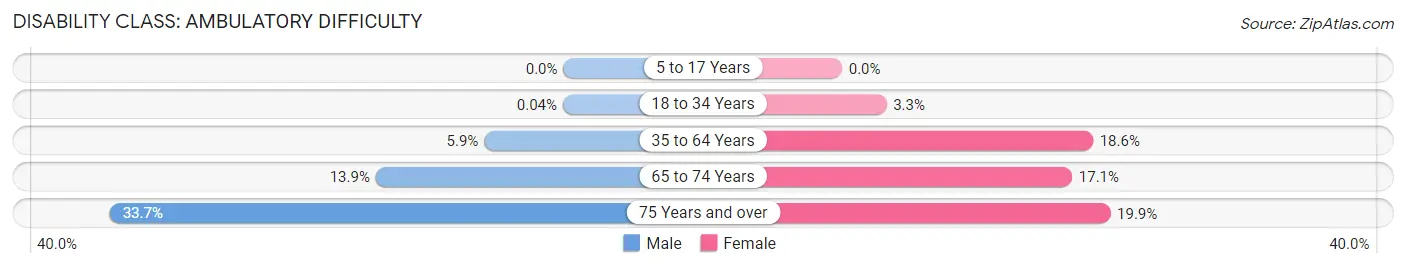
| Age Bracket | Male | Female |
| 5 to 17 Years | 0 (0.0%) | 0 (0.0%) |
| 18 to 34 Years | 1 (0.0%) | 95 (3.3%) |
| 35 to 64 Years | 210 (5.9%) | 762 (18.6%) |
| 65 to 74 Years | 90 (13.9%) | 125 (17.1%) |
| 75 Years and over | 96 (33.7%) | 105 (19.9%) |
Disability Class: Self-Care Difficulty
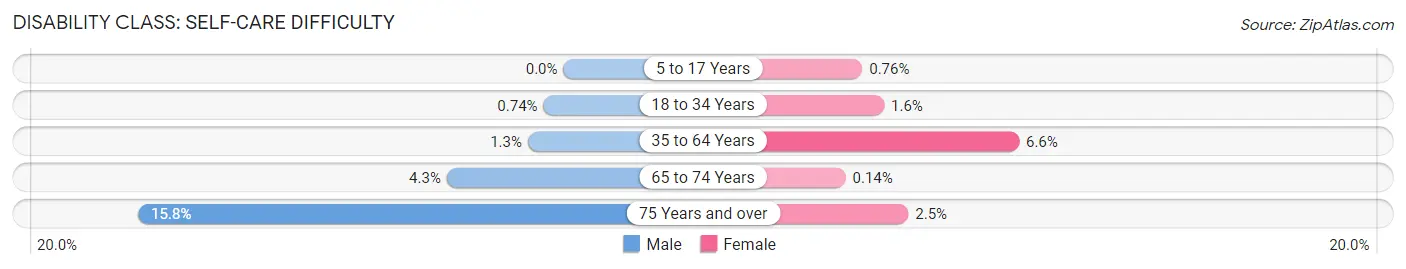
| Age Bracket | Male | Female |
| 5 to 17 Years | 0 (0.0%) | 14 (0.8%) |
| 18 to 34 Years | 18 (0.7%) | 45 (1.6%) |
| 35 to 64 Years | 47 (1.3%) | 269 (6.6%) |
| 65 to 74 Years | 28 (4.3%) | 1 (0.1%) |
| 75 Years and over | 45 (15.8%) | 13 (2.5%) |
Technology Access in Pleasantville
Computing Device Access in Pleasantville
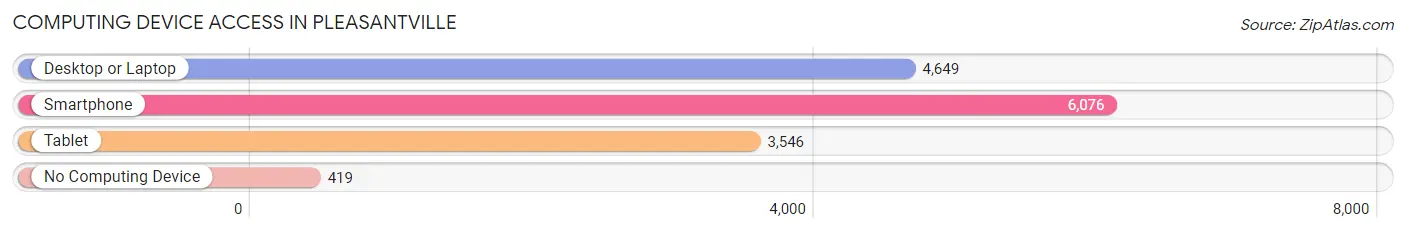
| Device Type | # Households | % Households |
| Desktop or Laptop | 4,649 | 69.1% |
| Smartphone | 6,076 | 90.4% |
| Tablet | 3,546 | 52.7% |
| No Computing Device | 419 | 6.2% |
| Total | 6,724 | 100.0% |
Internet Access in Pleasantville
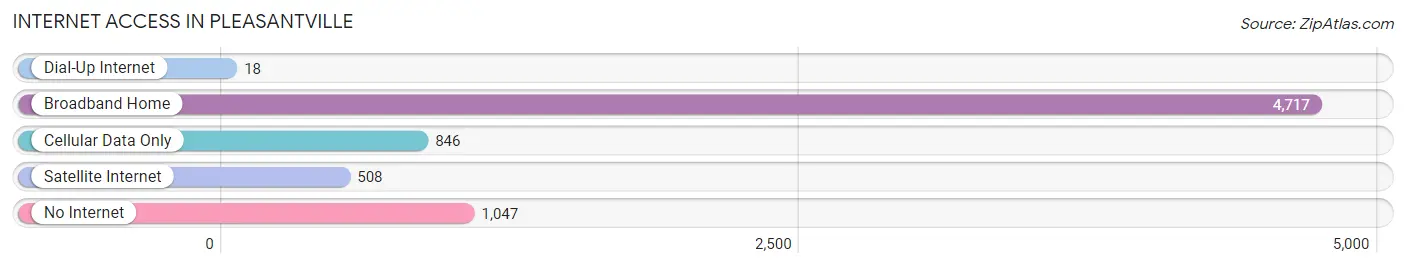
| Internet Type | # Households | % Households |
| Dial-Up Internet | 18 | 0.3% |
| Broadband Home | 4,717 | 70.2% |
| Cellular Data Only | 846 | 12.6% |
| Satellite Internet | 508 | 7.6% |
| No Internet | 1,047 | 15.6% |
| Total | 6,724 | 100.0% |
Pleasantville Summary
Pleasantville is a small city located in Atlantic County, New Jersey. It is situated on the Atlantic City Expressway, just south of Atlantic City. The city has a population of 20,249 as of the 2010 United States Census.
History
Pleasantville was originally part of Egg Harbor Township, which was established in 1854. In 1875, the area was incorporated as a borough and renamed Pleasantville. The name was chosen to reflect the pleasant atmosphere of the area.
The city was a popular destination for vacationers in the late 19th and early 20th centuries. The city was home to several large hotels, including the Hotel Pleasantville, which was built in 1876. The hotel was destroyed by fire in 1891, but was rebuilt and reopened in 1895.
In the early 20th century, the city was a popular destination for African Americans from the South who were seeking better economic opportunities. The city was also home to a large Jewish population.
Geography
Pleasantville is located at 39°21'25" North, 74°31'45" West (39.356944, -74.529167). The city has a total area of 2.3 square miles, all of which is land.
The city is located on the Atlantic City Expressway, which connects it to Atlantic City and other nearby cities. The city is also served by the Atlantic City International Airport, which is located just outside of the city limits.
Economy
Pleasantville has a diverse economy, with a mix of manufacturing, retail, and service industries. The city is home to several large employers, including the Atlantic City International Airport, the Atlantic City Convention Center, and the Atlantic City Race Course.
The city is also home to several smaller businesses, including restaurants, bars, and shops. The city is also home to several casinos, including the Tropicana Casino and Resort and the Golden Nugget Casino.
Demographics
As of the 2010 United States Census, there were 20,249 people, 7,845 households, and 4,945 families residing in the city. The population density was 8,845.3 people per square mile. The racial makeup of the city was 57.2% White, 33.3% African American, 0.4% Native American, 1.2% Asian, 0.1% Pacific Islander, 5.3% from other races, and 2.5% from two or more races. Hispanic or Latino of any race were 11.7% of the population.
The median income for a household in the city was $37,945, and the median income for a family was $45,945. Males had a median income of $35,945 versus $30,945 for females. The per capita income for the city was $19,945. About 14.2% of families and 17.3% of the population were below the poverty line, including 25.3% of those under age 18 and 11.2% of those age 65 or over.
Common Questions
What is Per Capita Income in Pleasantville?
Per Capita income in Pleasantville is $24,198.
What is the Median Family Income in Pleasantville?
Median Family Income in Pleasantville is $51,626.
What is the Median Household income in Pleasantville?
Median Household Income in Pleasantville is $48,704.
What is Income or Wage Gap in Pleasantville?
Income or Wage Gap in Pleasantville is 14.7%.
Women in Pleasantville earn 85.3 cents for every dollar earned by a man.
What is Family Income Deficit in Pleasantville?
Family Income Deficit in Pleasantville is $8,508.
Families that are below poverty line in Pleasantville earn $8,508 less on average than the poverty threshold level.
What is Inequality or Gini Index in Pleasantville?
Inequality or Gini Index in Pleasantville is 0.49.
What is the Total Population of Pleasantville?
Total Population of Pleasantville is 20,562.
What is the Total Male Population of Pleasantville?
Total Male Population of Pleasantville is 9,618.
What is the Total Female Population of Pleasantville?
Total Female Population of Pleasantville is 10,944.
What is the Ratio of Males per 100 Females in Pleasantville?
There are 87.88 Males per 100 Females in Pleasantville.
What is the Ratio of Females per 100 Males in Pleasantville?
There are 113.79 Females per 100 Males in Pleasantville.
What is the Median Population Age in Pleasantville?
Median Population Age in Pleasantville is 34.1 Years.
What is the Average Family Size in Pleasantville
Average Family Size in Pleasantville is 3.5 People.
What is the Average Household Size in Pleasantville
Average Household Size in Pleasantville is 3.0 People.
How Large is the Labor Force in Pleasantville?
There are 10,101 People in the Labor Forcein in Pleasantville.
What is the Percentage of People in the Labor Force in Pleasantville?
63.3% of People are in the Labor Force in Pleasantville.
What is the Unemployment Rate in Pleasantville?
Unemployment Rate in Pleasantville is 9.3%.