Zip Codes with the Highest Percentage of Population with a Degree in Engineering in Michigan
RELATED REPORTS & OPTIONS
Engineering
Michigan
Compare Zip Codes
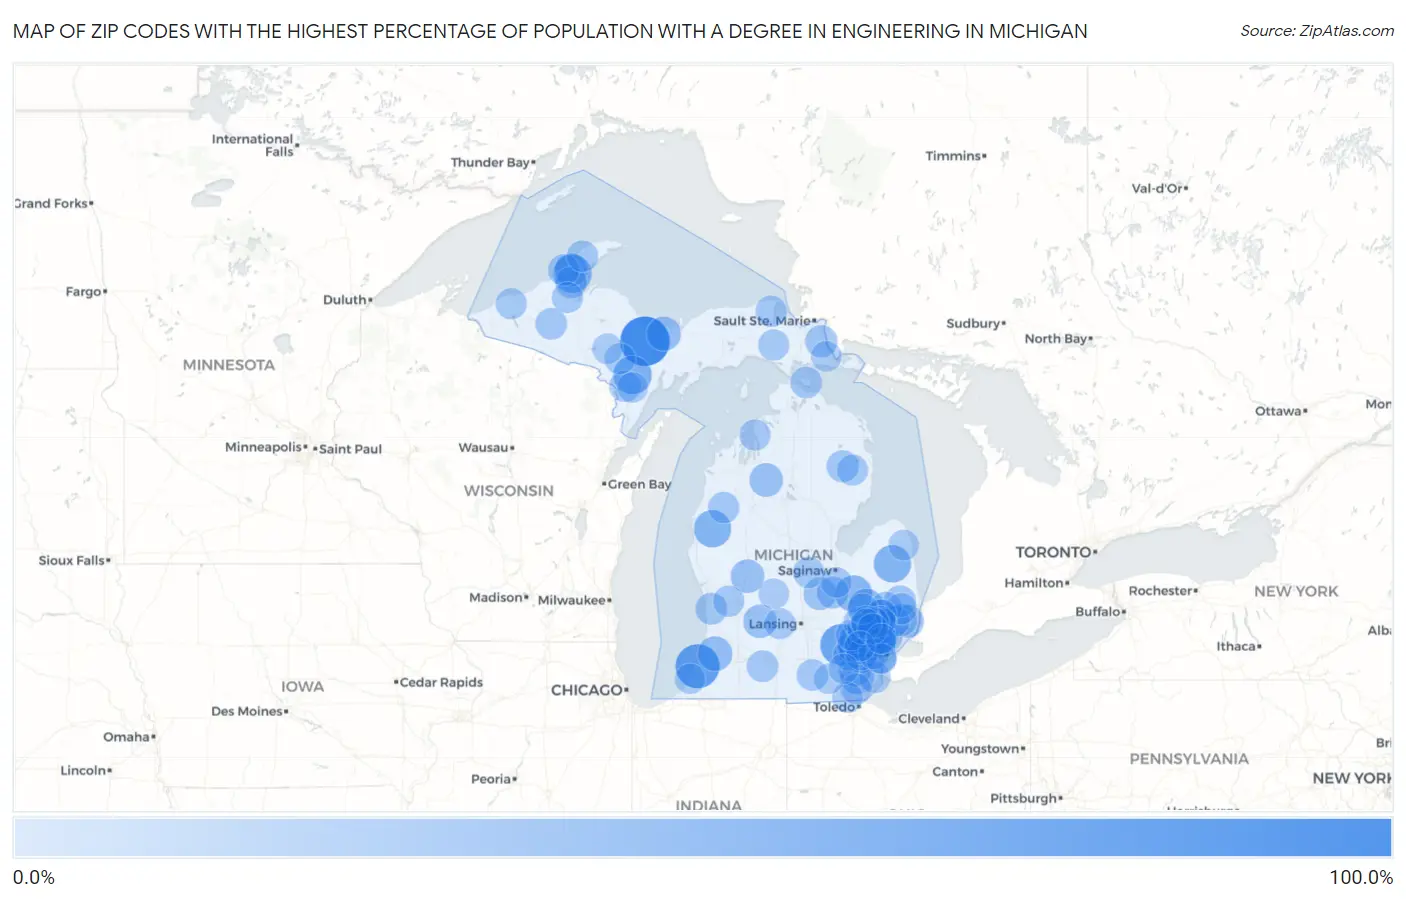
Map of Zip Codes with the Highest Percentage of Population with a Degree in Engineering in Michigan
0.0%
100.0%
Zip Codes with the Highest Percentage of Population with a Degree in Engineering in Michigan
| Zip Code | % Graduates | vs State | vs National | |
| 1. | 49833 | 100.0% | 10.0%(+90.0)#1 | 7.6%(+92.4)#30 |
| 2. | 49084 | 75.0% | 10.0%(+65.0)#2 | 7.6%(+67.4)#60 |
| 3. | 48143 | 65.5% | 10.0%(+55.5)#3 | 7.6%(+57.8)#82 |
| 4. | 49921 | 50.0% | 10.0%(+40.0)#4 | 7.6%(+42.4)#133 |
| 5. | 49873 | 50.0% | 10.0%(+40.0)#5 | 7.6%(+42.4)#139 |
| 6. | 48472 | 45.1% | 10.0%(+35.1)#6 | 7.6%(+37.5)#175 |
| 7. | 49458 | 45.0% | 10.0%(+35.0)#7 | 7.6%(+37.4)#177 |
| 8. | 48437 | 42.9% | 10.0%(+32.8)#8 | 7.6%(+35.2)#189 |
| 9. | 48440 | 35.8% | 10.0%(+25.8)#9 | 7.6%(+28.2)#263 |
| 10. | 49027 | 33.3% | 10.0%(+23.3)#10 | 7.6%(+25.7)#296 |
| 11. | 49825 | 31.2% | 10.0%(+21.2)#11 | 7.6%(+23.6)#347 |
| 12. | 49633 | 29.1% | 10.0%(+19.1)#12 | 7.6%(+21.4)#386 |
| 13. | 48335 | 29.1% | 10.0%(+19.1)#13 | 7.6%(+21.4)#387 |
| 14. | 48326 | 28.9% | 10.0%(+18.9)#14 | 7.6%(+21.3)#391 |
| 15. | 48159 | 28.8% | 10.0%(+18.8)#15 | 7.6%(+21.2)#398 |
| 16. | 49339 | 28.7% | 10.0%(+18.7)#16 | 7.6%(+21.1)#402 |
| 17. | 49325 | 28.1% | 10.0%(+18.0)#17 | 7.6%(+20.4)#429 |
| 18. | 48120 | 27.8% | 10.0%(+17.8)#18 | 7.6%(+20.2)#436 |
| 19. | 48374 | 27.0% | 10.0%(+16.9)#19 | 7.6%(+19.3)#464 |
| 20. | 49931 | 25.7% | 10.0%(+15.6)#20 | 7.6%(+18.0)#516 |
| 21. | 48841 | 25.5% | 10.0%(+15.4)#21 | 7.6%(+17.8)#526 |
| 22. | 48359 | 25.2% | 10.0%(+15.2)#22 | 7.6%(+17.6)#535 |
| 23. | 48064 | 25.0% | 10.0%(+15.0)#23 | 7.6%(+17.4)#539 |
| 24. | 48190 | 24.7% | 10.0%(+14.7)#24 | 7.6%(+17.1)#568 |
| 25. | 48165 | 24.6% | 10.0%(+14.6)#25 | 7.6%(+17.0)#573 |
| 26. | 48310 | 24.0% | 10.0%(+14.0)#26 | 7.6%(+16.3)#597 |
| 27. | 48085 | 23.7% | 10.0%(+13.7)#27 | 7.6%(+16.1)#613 |
| 28. | 48307 | 23.5% | 10.0%(+13.5)#28 | 7.6%(+15.9)#628 |
| 29. | 49710 | 23.1% | 10.0%(+13.1)#29 | 7.6%(+15.4)#647 |
| 30. | 48084 | 22.7% | 10.0%(+12.6)#30 | 7.6%(+15.0)#670 |
| 31. | 48050 | 21.9% | 10.0%(+11.9)#31 | 7.6%(+14.3)#721 |
| 32. | 48460 | 21.5% | 10.0%(+11.5)#32 | 7.6%(+13.9)#758 |
| 33. | 48098 | 21.4% | 10.0%(+11.4)#33 | 7.6%(+13.8)#779 |
| 34. | 48377 | 21.3% | 10.0%(+11.3)#34 | 7.6%(+13.7)#784 |
| 35. | 48083 | 21.3% | 10.0%(+11.2)#35 | 7.6%(+13.6)#785 |
| 36. | 48728 | 21.2% | 10.0%(+11.1)#36 | 7.6%(+13.5)#801 |
| 37. | 49460 | 21.1% | 10.0%(+11.1)#37 | 7.6%(+13.5)#802 |
| 38. | 48375 | 21.0% | 10.0%(+11.0)#38 | 7.6%(+13.3)#814 |
| 39. | 48370 | 20.8% | 10.0%(+10.8)#39 | 7.6%(+13.2)#822 |
| 40. | 48096 | 20.4% | 10.0%(+10.4)#40 | 7.6%(+12.7)#873 |
| 41. | 49051 | 20.3% | 10.0%(+10.2)#41 | 7.6%(+12.6)#885 |
| 42. | 49967 | 20.2% | 10.0%(+10.2)#42 | 7.6%(+12.6)#886 |
| 43. | 48022 | 20.2% | 10.0%(+10.1)#43 | 7.6%(+12.5)#891 |
| 44. | 49775 | 20.0% | 10.0%(+9.98)#44 | 7.6%(+12.4)#923 |
| 45. | 48309 | 19.6% | 10.0%(+9.58)#45 | 7.6%(+12.0)#953 |
| 46. | 49233 | 19.4% | 10.0%(+9.43)#46 | 7.6%(+11.8)#970 |
| 47. | 49916 | 19.4% | 10.0%(+9.40)#47 | 7.6%(+11.8)#975 |
| 48. | 49905 | 19.4% | 10.0%(+9.40)#48 | 7.6%(+11.8)#976 |
| 49. | 48003 | 19.3% | 10.0%(+9.26)#49 | 7.6%(+11.6)#990 |
| 50. | 49689 | 19.2% | 10.0%(+9.17)#50 | 7.6%(+11.5)#1,002 |
| 51. | 49901 | 19.2% | 10.0%(+9.16)#51 | 7.6%(+11.5)#1,004 |
| 52. | 49768 | 19.1% | 10.0%(+9.07)#52 | 7.6%(+11.4)#1,011 |
| 53. | 49847 | 18.9% | 10.0%(+8.90)#53 | 7.6%(+11.3)#1,041 |
| 54. | 48041 | 18.9% | 10.0%(+8.83)#54 | 7.6%(+11.2)#1,054 |
| 55. | 48188 | 18.8% | 10.0%(+8.75)#55 | 7.6%(+11.1)#1,062 |
| 56. | 48179 | 18.5% | 10.0%(+8.44)#56 | 7.6%(+10.8)#1,104 |
| 57. | 48662 | 18.3% | 10.0%(+8.32)#57 | 7.6%(+10.7)#1,117 |
| 58. | 48105 | 18.3% | 10.0%(+8.30)#58 | 7.6%(+10.7)#1,119 |
| 59. | 49627 | 18.1% | 10.0%(+8.04)#59 | 7.6%(+10.4)#1,158 |
| 60. | 49435 | 18.0% | 10.0%(+7.93)#60 | 7.6%(+10.3)#1,166 |
| 61. | 49958 | 17.9% | 10.0%(+7.84)#61 | 7.6%(+10.2)#1,175 |
| 62. | 48331 | 17.7% | 10.0%(+7.65)#62 | 7.6%(+10.0)#1,201 |
| 63. | 49831 | 17.6% | 10.0%(+7.63)#63 | 7.6%(+10.00)#1,202 |
| 64. | 48705 | 17.6% | 10.0%(+7.63)#64 | 7.6%(+10.00)#1,203 |
| 65. | 48367 | 17.6% | 10.0%(+7.61)#65 | 7.6%(+9.98)#1,206 |
| 66. | 49971 | 17.5% | 10.0%(+7.48)#66 | 7.6%(+9.85)#1,220 |
| 67. | 48306 | 17.4% | 10.0%(+7.40)#67 | 7.6%(+9.77)#1,231 |
| 68. | 49793 | 17.4% | 10.0%(+7.37)#68 | 7.6%(+9.74)#1,242 |
| 69. | 48034 | 17.1% | 10.0%(+7.06)#69 | 7.6%(+9.43)#1,302 |
| 70. | 48168 | 17.0% | 10.0%(+6.97)#70 | 7.6%(+9.35)#1,321 |
| 71. | 48381 | 17.0% | 10.0%(+6.93)#71 | 7.6%(+9.31)#1,326 |
| 72. | 48861 | 16.9% | 10.0%(+6.93)#72 | 7.6%(+9.30)#1,327 |
| 73. | 48178 | 16.9% | 10.0%(+6.87)#73 | 7.6%(+9.24)#1,335 |
| 74. | 48390 | 16.8% | 10.0%(+6.80)#74 | 7.6%(+9.17)#1,344 |
| 75. | 48187 | 16.8% | 10.0%(+6.74)#75 | 7.6%(+9.12)#1,351 |
| 76. | 48363 | 16.6% | 10.0%(+6.62)#76 | 7.6%(+8.99)#1,382 |
| 77. | 48127 | 16.5% | 10.0%(+6.47)#77 | 7.6%(+8.85)#1,401 |
| 78. | 48380 | 16.5% | 10.0%(+6.45)#78 | 7.6%(+8.82)#1,407 |
| 79. | 48140 | 16.4% | 10.0%(+6.38)#79 | 7.6%(+8.75)#1,419 |
| 80. | 48417 | 16.2% | 10.0%(+6.13)#80 | 7.6%(+8.51)#1,471 |
| 81. | 48350 | 16.1% | 10.0%(+6.10)#81 | 7.6%(+8.47)#1,475 |
| 82. | 48386 | 16.0% | 10.0%(+5.95)#82 | 7.6%(+8.32)#1,502 |
| 83. | 48360 | 16.0% | 10.0%(+5.95)#83 | 7.6%(+8.32)#1,505 |
| 84. | 48348 | 15.9% | 10.0%(+5.92)#84 | 7.6%(+8.29)#1,515 |
| 85. | 48067 | 15.7% | 10.0%(+5.69)#85 | 7.6%(+8.06)#1,555 |
| 86. | 49874 | 15.7% | 10.0%(+5.67)#86 | 7.6%(+8.04)#1,563 |
| 87. | 49267 | 15.5% | 10.0%(+5.49)#87 | 7.6%(+7.87)#1,607 |
| 88. | 48438 | 15.5% | 10.0%(+5.49)#88 | 7.6%(+7.87)#1,609 |
| 89. | 49736 | 15.5% | 10.0%(+5.47)#89 | 7.6%(+7.85)#1,616 |
| 90. | 49815 | 15.4% | 10.0%(+5.36)#90 | 7.6%(+7.74)#1,656 |
| 91. | 48346 | 15.3% | 10.0%(+5.26)#91 | 7.6%(+7.63)#1,679 |
| 92. | 48834 | 15.2% | 10.0%(+5.16)#92 | 7.6%(+7.53)#1,705 |
| 93. | 48340 | 15.2% | 10.0%(+5.14)#93 | 7.6%(+7.51)#1,712 |
| 94. | 49287 | 15.2% | 10.0%(+5.13)#94 | 7.6%(+7.50)#1,715 |
| 95. | 48217 | 14.9% | 10.0%(+4.89)#95 | 7.6%(+7.27)#1,766 |
| 96. | 48167 | 14.8% | 10.0%(+4.81)#96 | 7.6%(+7.18)#1,788 |
| 97. | 48470 | 14.8% | 10.0%(+4.79)#97 | 7.6%(+7.17)#1,794 |
| 98. | 48017 | 14.8% | 10.0%(+4.76)#98 | 7.6%(+7.13)#1,805 |
| 99. | 49127 | 14.7% | 10.0%(+4.64)#99 | 7.6%(+7.01)#1,828 |
| 100. | 48176 | 14.6% | 10.0%(+4.62)#100 | 7.6%(+6.99)#1,831 |
Common Questions
What are the Top 10 Zip Codes with the Highest Percentage of Population with a Degree in Engineering in Michigan?
Top 10 Zip Codes with the Highest Percentage of Population with a Degree in Engineering in Michigan are:
What zip code has the Highest Percentage of Population with a Degree in Engineering in Michigan?
49833 has the Highest Percentage of Population with a Degree in Engineering in Michigan with 100.0%.
What is the Percentage of Population with a Degree in Engineering in the State of Michigan?
Percentage of Population with a Degree in Engineering in Michigan is 10.0%.
What is the Percentage of Population with a Degree in Engineering in the United States?
Percentage of Population with a Degree in Engineering in the United States is 7.6%.