Zip Codes with the Highest Percentage of Self-Employed / Not Incorporated in Papillion, NE
RELATED REPORTS & OPTIONS
Self-Employed / Not Incorporated
Papillion
Compare Zip Codes
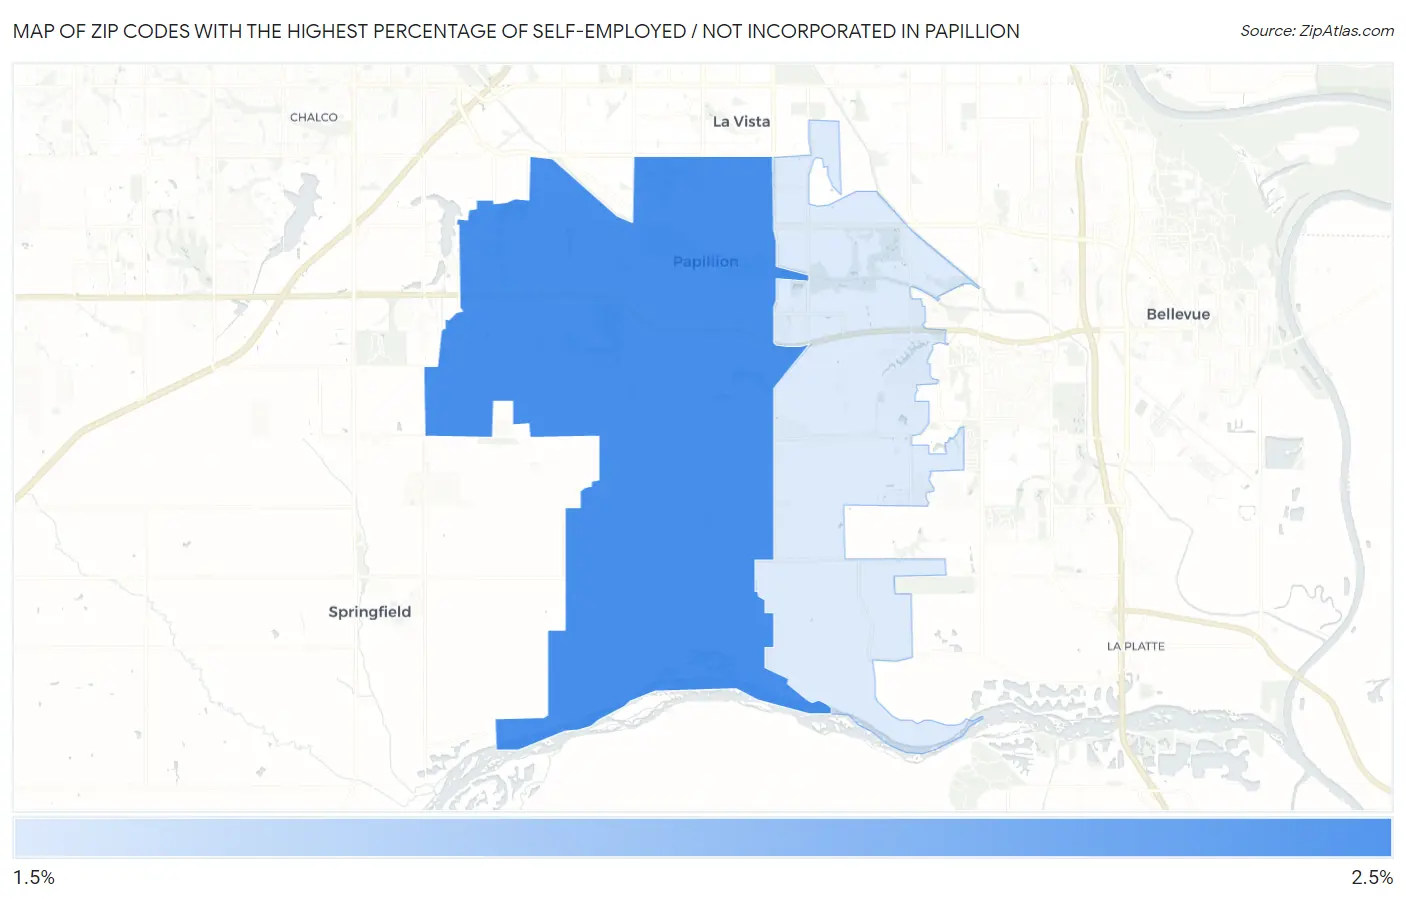
Map of Zip Codes with the Highest Percentage of Self-Employed / Not Incorporated in Papillion
0.0%
2.5%
Zip Codes with the Highest Percentage of Self-Employed / Not Incorporated in Papillion, NE
| Zip Code | % Self-Employed / Not Incorporated | vs State | vs National | |
| 1. | 68046 | 2.4% | 6.3%(-3.94)#542 | 5.8%(-3.44)#27,613 |
| 2. | 68133 | 2.3% | 6.3%(-4.02)#546 | 5.8%(-3.52)#27,779 |
1
Common Questions
What are the Top Zip Codes with the Highest Percentage of Self-Employed / Not Incorporated in Papillion, NE?
Top Zip Codes with the Highest Percentage of Self-Employed / Not Incorporated in Papillion, NE are:
What zip code has the Highest Percentage of Self-Employed / Not Incorporated in Papillion, NE?
68046 has the Highest Percentage of Self-Employed / Not Incorporated in Papillion, NE with 2.4%.
What is the Percentage of Self-Employed / Not Incorporated in Papillion, NE?
Percentage of Self-Employed / Not Incorporated in Papillion is 2.4%.
What is the Percentage of Self-Employed / Not Incorporated in Nebraska?
Percentage of Self-Employed / Not Incorporated in Nebraska is 6.3%.
What is the Percentage of Self-Employed / Not Incorporated in the United States?
Percentage of Self-Employed / Not Incorporated in the United States is 5.8%.