Zip Codes with the Highest Percentage of Population Taking Taxi / Cab to Work in Papillion, NE
RELATED REPORTS & OPTIONS
Taxi / Cab
Papillion
Compare Zip Codes
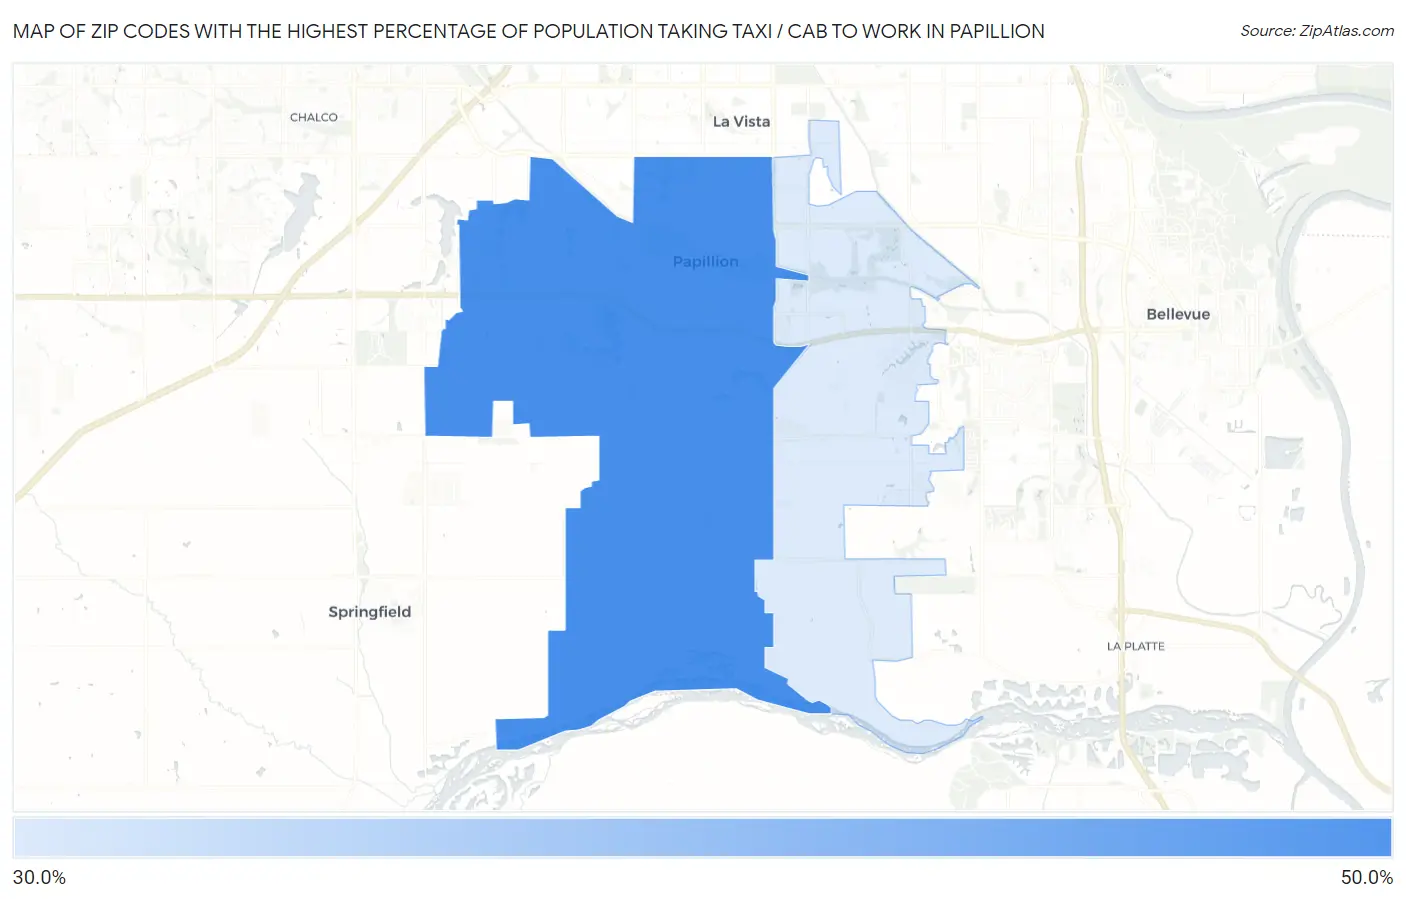
Map of Zip Codes with the Highest Percentage of Population Taking Taxi / Cab to Work in Papillion
39.2%
47.1%
Zip Codes with the Highest Percentage of Population Taking Taxi / Cab to Work in Papillion, NE
| Zip Code | % Take Taxi / Cab | vs State | vs National | |
| 1. | 68046 | 47.1% | 39.9%(+7.20)#45 | 38.2%(+8.90)#3,934 |
| 2. | 68133 | 39.2% | 39.9%(-0.700)#68 | 38.2%(+1.00)#6,994 |
1
Common Questions
What are the Top Zip Codes with the Highest Percentage of Population Taking Taxi / Cab to Work in Papillion, NE?
Top Zip Codes with the Highest Percentage of Population Taking Taxi / Cab to Work in Papillion, NE are:
What zip code has the Highest Percentage of Population Taking Taxi / Cab to Work in Papillion, NE?
68046 has the Highest Percentage of Population Taking Taxi / Cab to Work in Papillion, NE with 47.1%.
What is the Percentage of Population Taking Taxi / Cab to Work in Papillion, NE?
Percentage of Population Taking Taxi / Cab to Work in Papillion is 30.1%.
What is the Percentage of Population Taking Taxi / Cab to Work in Nebraska?
Percentage of Population Taking Taxi / Cab to Work in Nebraska is 39.9%.
What is the Percentage of Population Taking Taxi / Cab to Work in the United States?
Percentage of Population Taking Taxi / Cab to Work in the United States is 38.2%.