Zip Codes with the Highest Percentage of Population Employed in Firefighting & Prevention in Iowa
RELATED REPORTS & OPTIONS
Firefighting & Prevention
Iowa
Compare Zip Codes
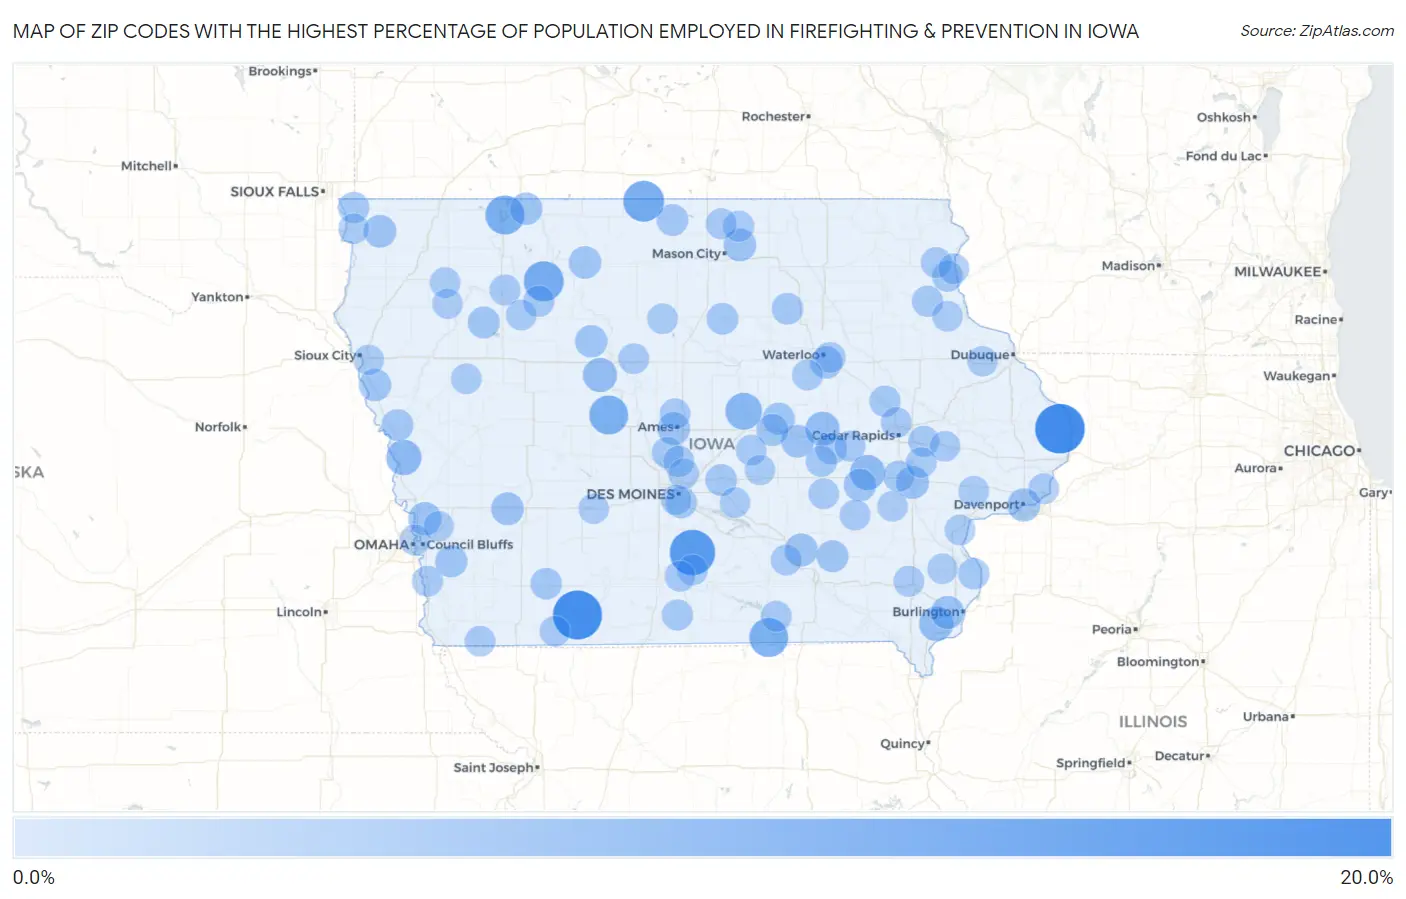
Map of Zip Codes with the Highest Percentage of Population Employed in Firefighting & Prevention in Iowa
0.0%
20.0%
Zip Codes with the Highest Percentage of Population Employed in Firefighting & Prevention in Iowa
| Zip Code | % Employed | vs State | vs National | |
| 1. | 52771 | 20.0% | 0.74%(+19.3)#1 | 1.2%(+18.8)#95 |
| 2. | 50840 | 19.5% | 0.74%(+18.7)#2 | 1.2%(+18.3)#100 |
| 3. | 50145 | 15.9% | 0.74%(+15.2)#3 | 1.2%(+14.7)#143 |
| 4. | 50465 | 11.4% | 0.74%(+10.7)#4 | 1.2%(+10.2)#252 |
| 5. | 50527 | 10.6% | 0.74%(+9.90)#5 | 1.2%(+9.45)#273 |
| 6. | 51355 | 9.8% | 0.74%(+9.07)#6 | 1.2%(+8.62)#311 |
| 7. | 52555 | 9.6% | 0.74%(+8.84)#7 | 1.2%(+8.39)#323 |
| 8. | 50064 | 9.5% | 0.74%(+8.79)#8 | 1.2%(+8.34)#326 |
| 9. | 50005 | 7.5% | 0.74%(+6.80)#9 | 1.2%(+6.35)#461 |
| 10. | 51545 | 6.3% | 0.74%(+5.59)#10 | 1.2%(+5.14)#621 |
| 11. | 52334 | 6.0% | 0.74%(+5.23)#11 | 1.2%(+4.78)#683 |
| 12. | 52624 | 5.3% | 0.74%(+4.61)#12 | 1.2%(+4.16)#797 |
| 13. | 52225 | 5.2% | 0.74%(+4.43)#13 | 1.2%(+3.98)#852 |
| 14. | 50523 | 5.1% | 0.74%(+4.32)#14 | 1.2%(+3.87)#887 |
| 15. | 51542 | 4.2% | 0.74%(+3.47)#15 | 1.2%(+3.02)#1,255 |
| 16. | 52801 | 4.1% | 0.74%(+3.32)#16 | 1.2%(+2.87)#1,328 |
| 17. | 52638 | 4.0% | 0.74%(+3.26)#17 | 1.2%(+2.81)#1,359 |
| 18. | 52242 | 4.0% | 0.74%(+3.22)#18 | 1.2%(+2.77)#1,381 |
| 19. | 52543 | 3.9% | 0.74%(+3.19)#19 | 1.2%(+2.74)#1,395 |
| 20. | 51552 | 3.7% | 0.74%(+3.00)#20 | 1.2%(+2.55)#1,525 |
| 21. | 52339 | 3.7% | 0.74%(+2.99)#21 | 1.2%(+2.54)#1,531 |
| 22. | 50013 | 3.7% | 0.74%(+2.94)#22 | 1.2%(+2.49)#1,574 |
| 23. | 50467 | 3.6% | 0.74%(+2.90)#23 | 1.2%(+2.45)#1,612 |
| 24. | 51235 | 3.6% | 0.74%(+2.89)#24 | 1.2%(+2.44)#1,615 |
| 25. | 50598 | 3.6% | 0.74%(+2.82)#25 | 1.2%(+2.37)#1,675 |
| 26. | 52361 | 3.5% | 0.74%(+2.78)#26 | 1.2%(+2.33)#1,707 |
| 27. | 51363 | 3.5% | 0.74%(+2.77)#27 | 1.2%(+2.32)#1,716 |
| 28. | 50702 | 3.4% | 0.74%(+2.68)#28 | 1.2%(+2.23)#1,801 |
| 29. | 51052 | 3.4% | 0.74%(+2.65)#29 | 1.2%(+2.20)#1,826 |
| 30. | 50524 | 3.4% | 0.74%(+2.63)#30 | 1.2%(+2.18)#1,840 |
| 31. | 51571 | 3.2% | 0.74%(+2.49)#31 | 1.2%(+2.04)#1,990 |
| 32. | 50632 | 3.1% | 0.74%(+2.38)#32 | 1.2%(+1.93)#2,124 |
| 33. | 50142 | 3.0% | 0.74%(+2.23)#33 | 1.2%(+1.78)#2,289 |
| 34. | 52568 | 2.9% | 0.74%(+2.20)#34 | 1.2%(+1.76)#2,326 |
| 35. | 51002 | 2.9% | 0.74%(+2.13)#35 | 1.2%(+1.68)#2,444 |
| 36. | 51040 | 2.8% | 0.74%(+2.10)#36 | 1.2%(+1.65)#2,499 |
| 37. | 50453 | 2.8% | 0.74%(+2.07)#37 | 1.2%(+1.63)#2,551 |
| 38. | 50054 | 2.8% | 0.74%(+2.03)#38 | 1.2%(+1.58)#2,627 |
| 39. | 50441 | 2.7% | 0.74%(+1.94)#39 | 1.2%(+1.49)#2,761 |
| 40. | 50619 | 2.6% | 0.74%(+1.87)#40 | 1.2%(+1.42)#2,874 |
| 41. | 50320 | 2.6% | 0.74%(+1.82)#41 | 1.2%(+1.37)#2,977 |
| 42. | 50841 | 2.5% | 0.74%(+1.75)#42 | 1.2%(+1.31)#3,115 |
| 43. | 52213 | 2.4% | 0.74%(+1.66)#43 | 1.2%(+1.21)#3,344 |
| 44. | 52208 | 2.4% | 0.74%(+1.64)#44 | 1.2%(+1.19)#3,399 |
| 45. | 50243 | 2.4% | 0.74%(+1.63)#45 | 1.2%(+1.18)#3,420 |
| 46. | 51241 | 2.3% | 0.74%(+1.58)#46 | 1.2%(+1.13)#3,530 |
| 47. | 52340 | 2.3% | 0.74%(+1.58)#47 | 1.2%(+1.13)#3,531 |
| 48. | 52043 | 2.3% | 0.74%(+1.54)#48 | 1.2%(+1.09)#3,641 |
| 49. | 52232 | 2.3% | 0.74%(+1.54)#49 | 1.2%(+1.09)#3,648 |
| 50. | 50554 | 2.2% | 0.74%(+1.49)#50 | 1.2%(+1.04)#3,782 |
| 51. | 50103 | 2.2% | 0.74%(+1.46)#51 | 1.2%(+1.01)#3,872 |
| 52. | 52646 | 2.2% | 0.74%(+1.44)#52 | 1.2%(+0.988)#3,947 |
| 53. | 52157 | 2.1% | 0.74%(+1.40)#53 | 1.2%(+0.948)#4,055 |
| 54. | 50007 | 2.1% | 0.74%(+1.39)#54 | 1.2%(+0.942)#4,075 |
| 55. | 52314 | 2.1% | 0.74%(+1.36)#55 | 1.2%(+0.911)#4,157 |
| 56. | 50440 | 2.1% | 0.74%(+1.35)#56 | 1.2%(+0.898)#4,210 |
| 57. | 52553 | 2.1% | 0.74%(+1.33)#57 | 1.2%(+0.883)#4,253 |
| 58. | 50707 | 2.1% | 0.74%(+1.33)#58 | 1.2%(+0.882)#4,264 |
| 59. | 51561 | 2.1% | 0.74%(+1.33)#59 | 1.2%(+0.878)#4,280 |
| 60. | 51510 | 2.0% | 0.74%(+1.31)#60 | 1.2%(+0.857)#4,359 |
| 61. | 50151 | 2.0% | 0.74%(+1.30)#61 | 1.2%(+0.855)#4,368 |
| 62. | 52593 | 2.0% | 0.74%(+1.30)#62 | 1.2%(+0.855)#4,369 |
| 63. | 50585 | 2.0% | 0.74%(+1.28)#63 | 1.2%(+0.834)#4,440 |
| 64. | 52641 | 2.0% | 0.74%(+1.27)#64 | 1.2%(+0.822)#4,482 |
| 65. | 50448 | 2.0% | 0.74%(+1.22)#65 | 1.2%(+0.769)#4,682 |
| 66. | 50643 | 2.0% | 0.74%(+1.22)#66 | 1.2%(+0.766)#4,695 |
| 67. | 52159 | 1.9% | 0.74%(+1.20)#67 | 1.2%(+0.752)#4,754 |
| 68. | 52209 | 1.9% | 0.74%(+1.19)#68 | 1.2%(+0.741)#4,803 |
| 69. | 50275 | 1.9% | 0.74%(+1.18)#69 | 1.2%(+0.728)#4,863 |
| 70. | 52233 | 1.9% | 0.74%(+1.18)#70 | 1.2%(+0.728)#4,868 |
| 71. | 50105 | 1.9% | 0.74%(+1.14)#71 | 1.2%(+0.693)#5,008 |
| 72. | 52158 | 1.9% | 0.74%(+1.13)#72 | 1.2%(+0.678)#5,077 |
| 73. | 50510 | 1.9% | 0.74%(+1.12)#73 | 1.2%(+0.669)#5,115 |
| 74. | 52335 | 1.8% | 0.74%(+1.11)#74 | 1.2%(+0.658)#5,164 |
| 75. | 50833 | 1.8% | 0.74%(+1.10)#75 | 1.2%(+0.652)#5,187 |
| 76. | 52753 | 1.8% | 0.74%(+1.10)#76 | 1.2%(+0.650)#5,195 |
| 77. | 50532 | 1.8% | 0.74%(+1.07)#77 | 1.2%(+0.624)#5,303 |
| 78. | 52222 | 1.8% | 0.74%(+1.07)#78 | 1.2%(+0.616)#5,349 |
| 79. | 50141 | 1.8% | 0.74%(+1.07)#79 | 1.2%(+0.616)#5,351 |
| 80. | 52048 | 1.8% | 0.74%(+1.05)#80 | 1.2%(+0.600)#5,418 |
| 81. | 50525 | 1.8% | 0.74%(+1.03)#81 | 1.2%(+0.578)#5,522 |
| 82. | 52306 | 1.8% | 0.74%(+1.02)#82 | 1.2%(+0.571)#5,556 |
| 83. | 51647 | 1.8% | 0.74%(+1.02)#83 | 1.2%(+0.569)#5,568 |
| 84. | 52778 | 1.8% | 0.74%(+1.02)#84 | 1.2%(+0.567)#5,573 |
| 85. | 51445 | 1.7% | 0.74%(+1.00)#85 | 1.2%(+0.555)#5,626 |
| 86. | 52247 | 1.7% | 0.74%(+0.988)#86 | 1.2%(+0.539)#5,713 |
| 87. | 51240 | 1.7% | 0.74%(+0.961)#87 | 1.2%(+0.511)#5,861 |
| 88. | 51046 | 1.7% | 0.74%(+0.952)#88 | 1.2%(+0.503)#5,902 |
| 89. | 52749 | 1.7% | 0.74%(+0.944)#89 | 1.2%(+0.495)#5,939 |
| 90. | 50021 | 1.7% | 0.74%(+0.931)#90 | 1.2%(+0.482)#6,008 |
| 91. | 52333 | 1.7% | 0.74%(+0.918)#91 | 1.2%(+0.468)#6,072 |
| 92. | 51106 | 1.6% | 0.74%(+0.912)#92 | 1.2%(+0.463)#6,105 |
| 93. | 50315 | 1.6% | 0.74%(+0.888)#93 | 1.2%(+0.438)#6,251 |
| 94. | 50135 | 1.6% | 0.74%(+0.858)#94 | 1.2%(+0.408)#6,415 |
| 95. | 50170 | 1.6% | 0.74%(+0.858)#95 | 1.2%(+0.408)#6,417 |
| 96. | 52045 | 1.6% | 0.74%(+0.846)#96 | 1.2%(+0.396)#6,478 |
| 97. | 52640 | 1.6% | 0.74%(+0.840)#97 | 1.2%(+0.390)#6,515 |
| 98. | 51037 | 1.6% | 0.74%(+0.826)#98 | 1.2%(+0.377)#6,588 |
| 99. | 50250 | 1.5% | 0.74%(+0.811)#99 | 1.2%(+0.362)#6,672 |
| 100. | 51576 | 1.5% | 0.74%(+0.808)#100 | 1.2%(+0.358)#6,692 |
Common Questions
What are the Top 10 Zip Codes with the Highest Percentage of Population Employed in Firefighting & Prevention in Iowa?
Top 10 Zip Codes with the Highest Percentage of Population Employed in Firefighting & Prevention in Iowa are:
What zip code has the Highest Percentage of Population Employed in Firefighting & Prevention in Iowa?
52771 has the Highest Percentage of Population Employed in Firefighting & Prevention in Iowa with 20.0%.
What is the Percentage of Population Employed in Firefighting & Prevention in the State of Iowa?
Percentage of Population Employed in Firefighting & Prevention in Iowa is 0.74%.
What is the Percentage of Population Employed in Firefighting & Prevention in the United States?
Percentage of Population Employed in Firefighting & Prevention in the United States is 1.2%.