Zip Codes with the Highest Percentage of Population Employed in Education Instruction & Library in Illinois
RELATED REPORTS & OPTIONS
Education Instruction & Library
Illinois
Compare Zip Codes
Map of Zip Codes with the Highest Percentage of Population Employed in Education Instruction & Library in Illinois
0.0%
60.0%
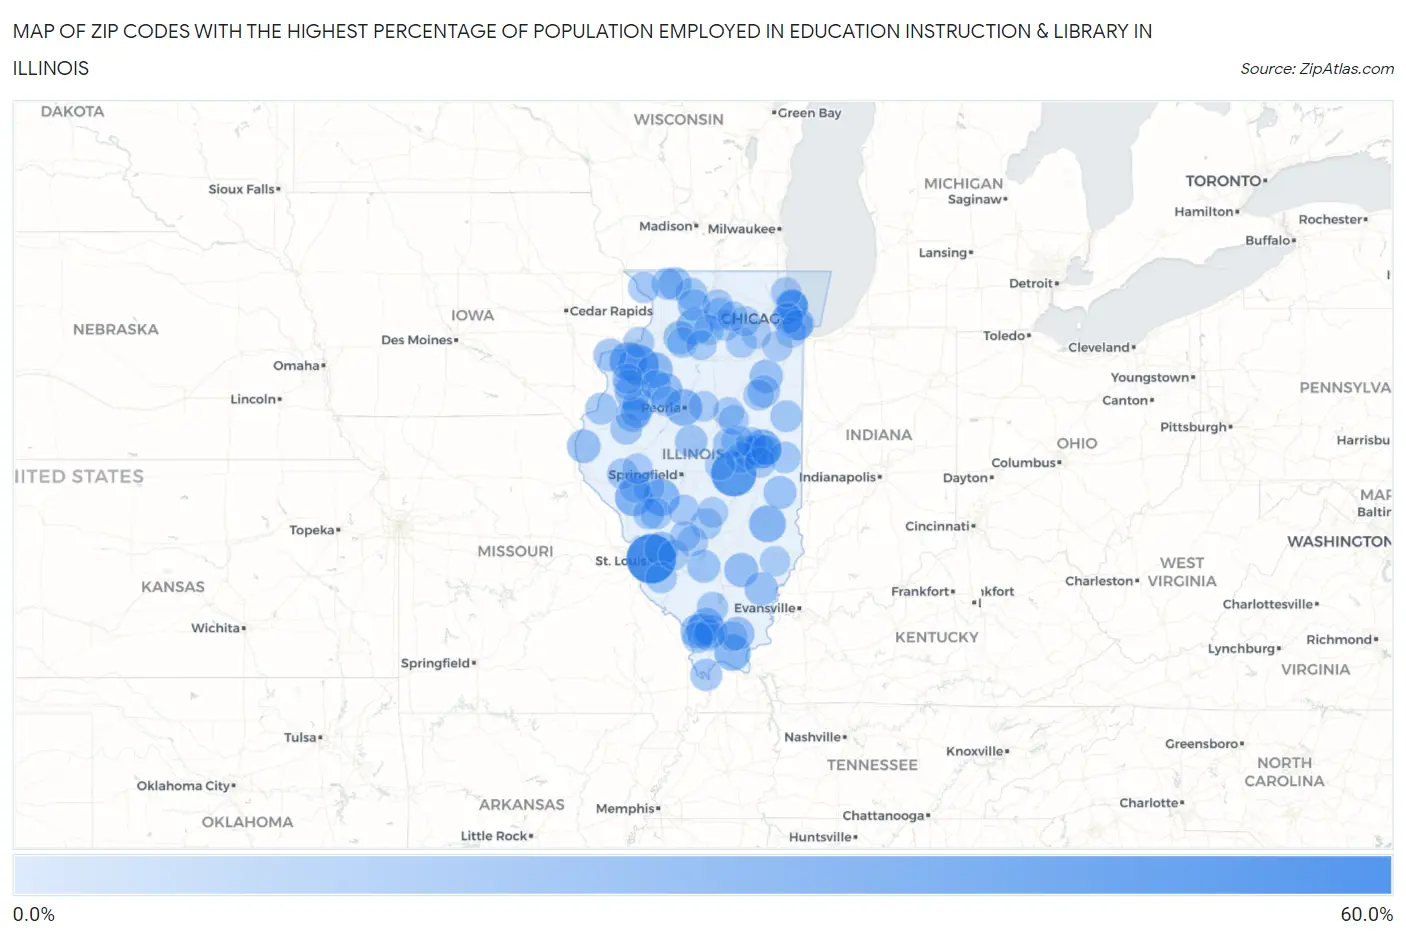
Zip Codes with the Highest Percentage of Population Employed in Education Instruction & Library in Illinois
| Zip Code | % Employed | vs State | vs National | |
| 1. | 62059 | 51.5% | 6.3% (+45.2)#1 | 6.2% (+45.3)#62 |
| 2. | 61936 | 42.3% | 6.3% (+36.0)#2 | 6.2% (+36.1)#119 |
| 3. | 61468 | 31.5% | 6.3% (+25.2)#3 | 6.2% (+25.3)#243 |
| 4. | 61801 | 27.6% | 6.3% (+21.3)#4 | 6.2% (+21.4)#306 |
| 5. | 61276 | 26.9% | 6.3% (+20.6)#5 | 6.2% (+20.7)#315 |
| 6. | 62078 | 26.0% | 6.3% (+19.7)#6 | 6.2% (+19.8)#341 |
| 7. | 62667 | 24.7% | 6.3% (+18.4)#7 | 6.2% (+18.5)#380 |
| 8. | 62432 | 24.6% | 6.3% (+18.3)#8 | 6.2% (+18.4)#384 |
| 9. | 61625 | 24.5% | 6.3% (+18.2)#9 | 6.2% (+18.3)#386 |
| 10. | 61324 | 24.1% | 6.3% (+17.8)#10 | 6.2% (+18.0)#404 |
| 11. | 62943 | 23.7% | 6.3% (+17.4)#11 | 6.2% (+17.5)#423 |
| 12. | 61419 | 21.8% | 6.3% (+15.5)#12 | 6.2% (+15.6)#523 |
| 13. | 61423 | 20.5% | 6.3% (+14.2)#13 | 6.2% (+14.3)#609 |
| 14. | 61451 | 20.0% | 6.3% (+13.7)#14 | 6.2% (+13.8)#650 |
| 15. | 61820 | 18.7% | 6.3% (+12.4)#15 | 6.2% (+12.5)#766 |
| 16. | 62901 | 18.7% | 6.3% (+12.4)#16 | 6.2% (+12.5)#768 |
| 17. | 62026 | 18.6% | 6.3% (+12.3)#17 | 6.2% (+12.5)#771 |
| 18. | 62850 | 18.6% | 6.3% (+12.3)#18 | 6.2% (+12.4)#774 |
| 19. | 62975 | 18.6% | 6.3% (+12.3)#19 | 6.2% (+12.4)#775 |
| 20. | 62987 | 18.3% | 6.3% (+12.0)#20 | 6.2% (+12.1)#809 |
| 21. | 61470 | 17.9% | 6.3% (+11.6)#21 | 6.2% (+11.7)#846 |
| 22. | 62903 | 17.8% | 6.3% (+11.5)#22 | 6.2% (+11.6)#863 |
| 23. | 60615 | 17.7% | 6.3% (+11.4)#23 | 6.2% (+11.5)#874 |
| 24. | 62348 | 17.7% | 6.3% (+11.4)#24 | 6.2% (+11.5)#875 |
| 25. | 62820 | 17.5% | 6.3% (+11.2)#25 | 6.2% (+11.3)#898 |
| 26. | 61243 | 17.2% | 6.3% (+10.9)#26 | 6.2% (+11.0)#927 |
| 27. | 60969 | 17.1% | 6.3% (+10.8)#27 | 6.2% (+11.0)#935 |
| 28. | 61875 | 17.1% | 6.3% (+10.8)#28 | 6.2% (+10.9)#937 |
| 29. | 61474 | 16.7% | 6.3% (+10.4)#29 | 6.2% (+10.5)#999 |
| 30. | 61027 | 16.7% | 6.3% (+10.4)#30 | 6.2% (+10.5)#1,006 |
| 31. | 61933 | 16.6% | 6.3% (+10.3)#31 | 6.2% (+10.4)#1,019 |
| 32. | 61259 | 16.5% | 6.3% (+10.2)#32 | 6.2% (+10.3)#1,024 |
| 33. | 62250 | 16.5% | 6.3% (+10.2)#33 | 6.2% (+10.3)#1,029 |
| 34. | 62902 | 15.7% | 6.3% (+9.38)#34 | 6.2% (+9.49)#1,156 |
| 35. | 62643 | 15.6% | 6.3% (+9.31)#35 | 6.2% (+9.42)#1,169 |
| 36. | 60946 | 15.1% | 6.3% (+8.81)#36 | 6.2% (+8.92)#1,264 |
| 37. | 62914 | 14.7% | 6.3% (+8.41)#37 | 6.2% (+8.52)#1,343 |
| 38. | 61039 | 14.3% | 6.3% (+7.96)#38 | 6.2% (+8.07)#1,468 |
| 39. | 61454 | 14.2% | 6.3% (+7.91)#39 | 6.2% (+8.02)#1,481 |
| 40. | 61822 | 14.2% | 6.3% (+7.90)#40 | 6.2% (+8.01)#1,486 |
| 41. | 61842 | 14.1% | 6.3% (+7.80)#41 | 6.2% (+7.91)#1,519 |
| 42. | 61054 | 14.1% | 6.3% (+7.79)#42 | 6.2% (+7.90)#1,526 |
| 43. | 60113 | 14.0% | 6.3% (+7.72)#43 | 6.2% (+7.83)#1,534 |
| 44. | 60926 | 14.0% | 6.3% (+7.70)#44 | 6.2% (+7.82)#1,540 |
| 45. | 62958 | 13.9% | 6.3% (+7.58)#45 | 6.2% (+7.70)#1,578 |
| 46. | 62695 | 13.8% | 6.3% (+7.50)#46 | 6.2% (+7.61)#1,616 |
| 47. | 61455 | 13.8% | 6.3% (+7.48)#47 | 6.2% (+7.59)#1,625 |
| 48. | 60203 | 13.8% | 6.3% (+7.46)#48 | 6.2% (+7.58)#1,628 |
| 49. | 61044 | 13.7% | 6.3% (+7.44)#49 | 6.2% (+7.56)#1,635 |
| 50. | 61735 | 13.7% | 6.3% (+7.38)#50 | 6.2% (+7.50)#1,650 |
| 51. | 60201 | 13.4% | 6.3% (+7.14)#51 | 6.2% (+7.25)#1,731 |
| 52. | 60550 | 13.4% | 6.3% (+7.13)#52 | 6.2% (+7.24)#1,737 |
| 53. | 60202 | 13.3% | 6.3% (+7.03)#53 | 6.2% (+7.14)#1,781 |
| 54. | 61041 | 13.3% | 6.3% (+6.99)#54 | 6.2% (+7.11)#1,789 |
| 55. | 61841 | 13.2% | 6.3% (+6.90)#55 | 6.2% (+7.01)#1,829 |
| 56. | 61856 | 13.2% | 6.3% (+6.89)#56 | 6.2% (+7.00)#1,833 |
| 57. | 62630 | 13.1% | 6.3% (+6.77)#57 | 6.2% (+6.89)#1,875 |
| 58. | 61415 | 13.1% | 6.3% (+6.76)#58 | 6.2% (+6.87)#1,880 |
| 59. | 62285 | 13.0% | 6.3% (+6.71)#59 | 6.2% (+6.82)#1,898 |
| 60. | 62081 | 12.9% | 6.3% (+6.57)#60 | 6.2% (+6.68)#1,957 |
| 61. | 62865 | 12.7% | 6.3% (+6.44)#61 | 6.2% (+6.56)#1,999 |
| 62. | 61049 | 12.6% | 6.3% (+6.30)#62 | 6.2% (+6.41)#2,075 |
| 63. | 61256 | 12.4% | 6.3% (+6.09)#63 | 6.2% (+6.20)#2,181 |
| 64. | 62905 | 12.3% | 6.3% (+6.05)#64 | 6.2% (+6.16)#2,209 |
| 65. | 62011 | 12.3% | 6.3% (+6.05)#65 | 6.2% (+6.16)#2,212 |
| 66. | 62560 | 12.2% | 6.3% (+5.92)#66 | 6.2% (+6.03)#2,278 |
| 67. | 62323 | 12.1% | 6.3% (+5.78)#67 | 6.2% (+5.90)#2,344 |
| 68. | 60302 | 11.9% | 6.3% (+5.62)#68 | 6.2% (+5.73)#2,430 |
| 69. | 60929 | 11.9% | 6.3% (+5.62)#69 | 6.2% (+5.73)#2,435 |
| 70. | 62553 | 11.9% | 6.3% (+5.56)#70 | 6.2% (+5.67)#2,473 |
| 71. | 60304 | 11.8% | 6.3% (+5.54)#71 | 6.2% (+5.65)#2,483 |
| 72. | 61853 | 11.8% | 6.3% (+5.53)#72 | 6.2% (+5.64)#2,490 |
| 73. | 62246 | 11.8% | 6.3% (+5.50)#73 | 6.2% (+5.61)#2,504 |
| 74. | 62281 | 11.8% | 6.3% (+5.46)#74 | 6.2% (+5.57)#2,531 |
| 75. | 61753 | 11.7% | 6.3% (+5.45)#75 | 6.2% (+5.56)#2,539 |
| 76. | 61376 | 11.7% | 6.3% (+5.45)#76 | 6.2% (+5.56)#2,541 |
| 77. | 61880 | 11.6% | 6.3% (+5.35)#77 | 6.2% (+5.46)#2,605 |
| 78. | 60537 | 11.6% | 6.3% (+5.33)#78 | 6.2% (+5.44)#2,614 |
| 79. | 61435 | 11.6% | 6.3% (+5.28)#79 | 6.2% (+5.40)#2,647 |
| 80. | 62694 | 11.6% | 6.3% (+5.28)#80 | 6.2% (+5.39)#2,649 |
| 81. | 62611 | 11.5% | 6.3% (+5.25)#81 | 6.2% (+5.36)#2,660 |
| 82. | 60655 | 11.5% | 6.3% (+5.20)#82 | 6.2% (+5.32)#2,698 |
| 83. | 60040 | 11.5% | 6.3% (+5.18)#83 | 6.2% (+5.29)#2,721 |
| 84. | 61802 | 11.4% | 6.3% (+5.09)#84 | 6.2% (+5.21)#2,792 |
| 85. | 60637 | 11.4% | 6.3% (+5.06)#85 | 6.2% (+5.17)#2,815 |
| 86. | 61412 | 11.3% | 6.3% (+5.00)#86 | 6.2% (+5.11)#2,849 |
| 87. | 61530 | 11.3% | 6.3% (+4.99)#87 | 6.2% (+5.10)#2,860 |
| 88. | 61378 | 11.2% | 6.3% (+4.87)#88 | 6.2% (+4.99)#2,934 |
| 89. | 62086 | 11.1% | 6.3% (+4.84)#89 | 6.2% (+4.95)#2,958 |
| 90. | 60451 | 11.1% | 6.3% (+4.83)#90 | 6.2% (+4.94)#2,965 |
| 91. | 61330 | 11.1% | 6.3% (+4.82)#91 | 6.2% (+4.93)#2,971 |
| 92. | 61730 | 11.1% | 6.3% (+4.82)#92 | 6.2% (+4.93)#2,978 |
| 93. | 62967 | 11.1% | 6.3% (+4.82)#93 | 6.2% (+4.93)#2,981 |
| 94. | 60543 | 11.1% | 6.3% (+4.78)#94 | 6.2% (+4.89)#3,012 |
| 95. | 62419 | 11.0% | 6.3% (+4.73)#95 | 6.2% (+4.85)#3,042 |
| 96. | 62535 | 11.0% | 6.3% (+4.72)#96 | 6.2% (+4.84)#3,046 |
| 97. | 60144 | 10.9% | 6.3% (+4.57)#97 | 6.2% (+4.69)#3,153 |
| 98. | 61485 | 10.8% | 6.3% (+4.55)#98 | 6.2% (+4.67)#3,170 |
| 99. | 61529 | 10.8% | 6.3% (+4.55)#99 | 6.2% (+4.66)#3,174 |
| 100. | 60115 | 10.8% | 6.3% (+4.50)#100 | 6.2% (+4.62)#3,208 |
Common Questions
What are the Top 10 Zip Codes with the Highest Percentage of Population Employed in Education Instruction & Library in Illinois?
Top 10 Zip Codes with the Highest Percentage of Population Employed in Education Instruction & Library in Illinois are:
What zip code has the Highest Percentage of Population Employed in Education Instruction & Library in Illinois?
62059 has the Highest Percentage of Population Employed in Education Instruction & Library in Illinois with 51.5%.
What is the Percentage of Population Employed in Education Instruction & Library in the State of Illinois?
Percentage of Population Employed in Education Instruction & Library in Illinois is 6.3%.
What is the Percentage of Population Employed in Education Instruction & Library in the United States?
Percentage of Population Employed in Education Instruction & Library in the United States is 6.2%.