Zip Codes with the Highest Percentage of Population Employed in Arts, Media & Entertainment in Georgia
RELATED REPORTS & OPTIONS
Arts, Media & Entertainment
Georgia
Compare Zip Codes
Map of Zip Codes with the Highest Percentage of Population Employed in Arts, Media & Entertainment in Georgia
0.0%
25.0%
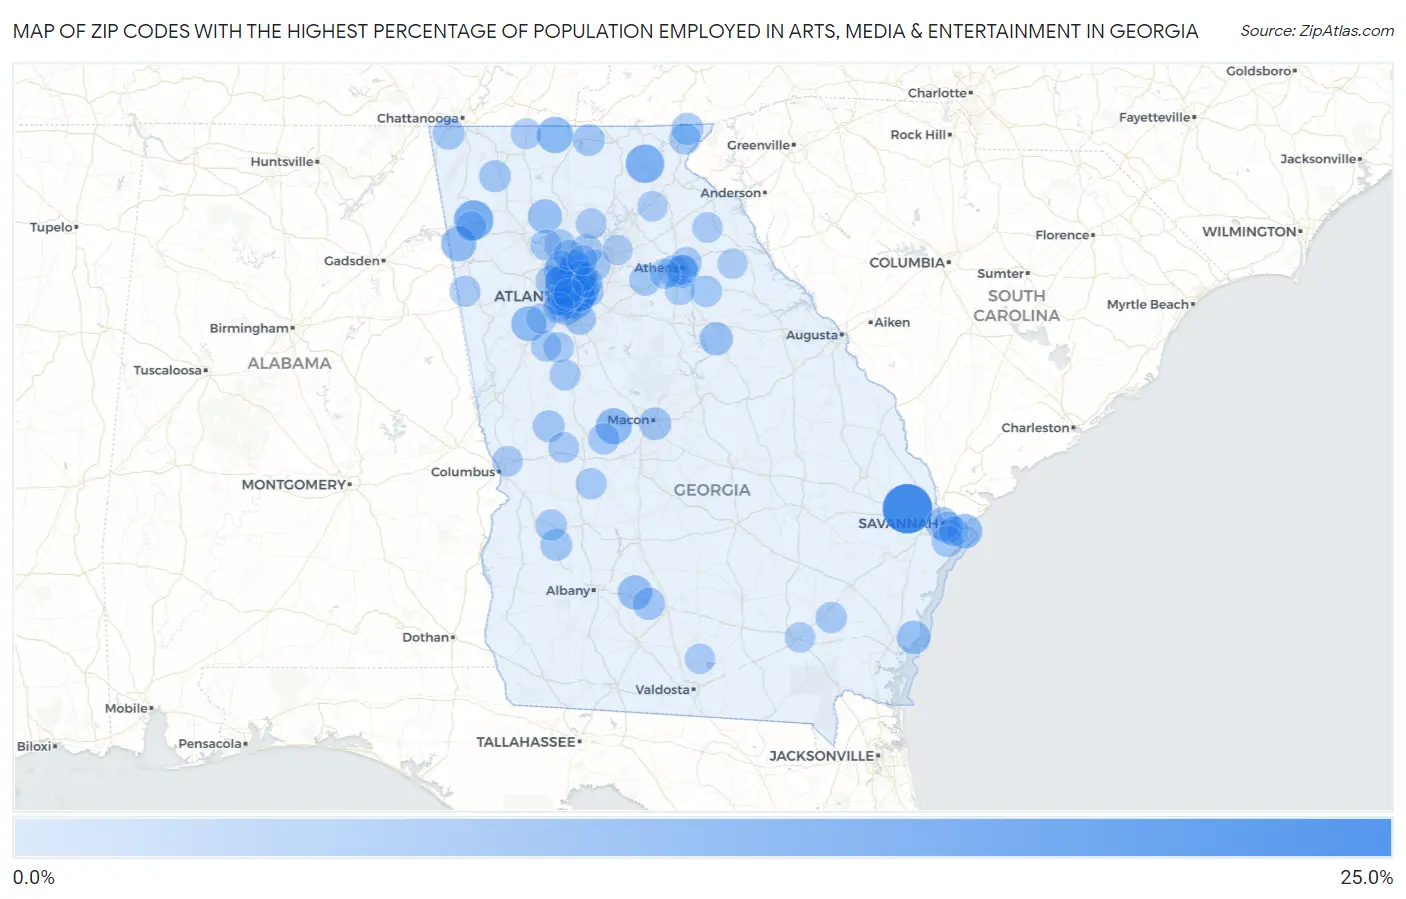
Zip Codes with the Highest Percentage of Population Employed in Arts, Media & Entertainment in Georgia
| Zip Code | % Employed | vs State | vs National | |
| 1. | 31307 | 20.5% | 2.0%(+18.6)#1 | 2.1%(+18.5)#90 |
| 2. | 30149 | 11.0% | 2.0%(+9.09)#2 | 2.1%(+8.98)#304 |
| 3. | 30571 | 10.2% | 2.0%(+8.20)#3 | 2.1%(+8.10)#365 |
| 4. | 30327 | 8.3% | 2.0%(+6.37)#4 | 2.1%(+6.27)#512 |
| 5. | 30541 | 8.1% | 2.0%(+6.19)#5 | 2.1%(+6.09)#534 |
| 6. | 31066 | 8.0% | 2.0%(+6.01)#6 | 2.1%(+5.91)#557 |
| 7. | 30316 | 7.9% | 2.0%(+5.97)#7 | 2.1%(+5.87)#562 |
| 8. | 30307 | 7.6% | 2.0%(+5.65)#8 | 2.1%(+5.55)#622 |
| 9. | 30124 | 7.2% | 2.0%(+5.23)#9 | 2.1%(+5.13)#713 |
| 10. | 30268 | 7.1% | 2.0%(+5.14)#10 | 2.1%(+5.04)#733 |
| 11. | 30030 | 6.9% | 2.0%(+4.89)#11 | 2.1%(+4.79)#793 |
| 12. | 31328 | 6.6% | 2.0%(+4.66)#12 | 2.1%(+4.56)#848 |
| 13. | 31781 | 6.5% | 2.0%(+4.57)#13 | 2.1%(+4.47)#868 |
| 14. | 30183 | 6.2% | 2.0%(+4.25)#14 | 2.1%(+4.15)#968 |
| 15. | 30312 | 5.9% | 2.0%(+3.98)#15 | 2.1%(+3.87)#1,059 |
| 16. | 30002 | 5.7% | 2.0%(+3.77)#16 | 2.1%(+3.67)#1,145 |
| 17. | 31522 | 5.7% | 2.0%(+3.76)#17 | 2.1%(+3.65)#1,155 |
| 18. | 30678 | 5.6% | 2.0%(+3.62)#18 | 2.1%(+3.52)#1,207 |
| 19. | 30309 | 5.6% | 2.0%(+3.62)#19 | 2.1%(+3.52)#1,208 |
| 20. | 30305 | 5.5% | 2.0%(+3.57)#20 | 2.1%(+3.47)#1,231 |
| 21. | 30079 | 5.4% | 2.0%(+3.49)#21 | 2.1%(+3.38)#1,286 |
| 22. | 31401 | 5.3% | 2.0%(+3.37)#22 | 2.1%(+3.27)#1,335 |
| 23. | 30317 | 5.2% | 2.0%(+3.23)#23 | 2.1%(+3.13)#1,405 |
| 24. | 30315 | 5.1% | 2.0%(+3.16)#24 | 2.1%(+3.05)#1,436 |
| 25. | 30345 | 5.0% | 2.0%(+3.08)#25 | 2.1%(+2.97)#1,482 |
| 26. | 30319 | 5.0% | 2.0%(+3.07)#26 | 2.1%(+2.97)#1,484 |
| 27. | 30609 | 5.0% | 2.0%(+3.06)#27 | 2.1%(+2.96)#1,492 |
| 28. | 30318 | 5.0% | 2.0%(+3.03)#28 | 2.1%(+2.93)#1,508 |
| 29. | 30354 | 5.0% | 2.0%(+3.01)#29 | 2.1%(+2.91)#1,517 |
| 30. | 30326 | 4.9% | 2.0%(+2.98)#30 | 2.1%(+2.87)#1,540 |
| 31. | 30033 | 4.9% | 2.0%(+2.98)#31 | 2.1%(+2.87)#1,543 |
| 32. | 31201 | 4.9% | 2.0%(+2.97)#32 | 2.1%(+2.87)#1,544 |
| 33. | 30306 | 4.9% | 2.0%(+2.97)#33 | 2.1%(+2.87)#1,547 |
| 34. | 31795 | 4.8% | 2.0%(+2.79)#34 | 2.1%(+2.69)#1,658 |
| 35. | 30310 | 4.7% | 2.0%(+2.72)#35 | 2.1%(+2.61)#1,710 |
| 36. | 30313 | 4.6% | 2.0%(+2.61)#36 | 2.1%(+2.50)#1,806 |
| 37. | 30324 | 4.5% | 2.0%(+2.52)#37 | 2.1%(+2.41)#1,876 |
| 38. | 30072 | 4.4% | 2.0%(+2.48)#38 | 2.1%(+2.38)#1,905 |
| 39. | 30273 | 4.4% | 2.0%(+2.45)#39 | 2.1%(+2.35)#1,935 |
| 40. | 31404 | 4.4% | 2.0%(+2.41)#40 | 2.1%(+2.31)#1,960 |
| 41. | 30537 | 4.3% | 2.0%(+2.34)#41 | 2.1%(+2.23)#2,046 |
| 42. | 30757 | 4.3% | 2.0%(+2.33)#42 | 2.1%(+2.22)#2,057 |
| 43. | 30746 | 4.3% | 2.0%(+2.29)#43 | 2.1%(+2.19)#2,090 |
| 44. | 31836 | 4.2% | 2.0%(+2.27)#44 | 2.1%(+2.16)#2,124 |
| 45. | 30560 | 4.2% | 2.0%(+2.24)#45 | 2.1%(+2.14)#2,153 |
| 46. | 39877 | 4.1% | 2.0%(+2.19)#46 | 2.1%(+2.09)#2,190 |
| 47. | 30342 | 4.0% | 2.0%(+2.07)#47 | 2.1%(+1.97)#2,335 |
| 48. | 30346 | 4.0% | 2.0%(+2.03)#48 | 2.1%(+1.93)#2,375 |
| 49. | 30656 | 4.0% | 2.0%(+2.02)#49 | 2.1%(+1.92)#2,389 |
| 50. | 30606 | 4.0% | 2.0%(+2.00)#50 | 2.1%(+1.90)#2,417 |
| 51. | 31411 | 4.0% | 2.0%(+2.00)#51 | 2.1%(+1.89)#2,431 |
| 52. | 30005 | 3.9% | 2.0%(+1.94)#52 | 2.1%(+1.84)#2,498 |
| 53. | 30082 | 3.9% | 2.0%(+1.93)#53 | 2.1%(+1.83)#2,510 |
| 54. | 30338 | 3.9% | 2.0%(+1.93)#54 | 2.1%(+1.82)#2,516 |
| 55. | 30525 | 3.8% | 2.0%(+1.88)#55 | 2.1%(+1.78)#2,577 |
| 56. | 31824 | 3.8% | 2.0%(+1.86)#56 | 2.1%(+1.76)#2,597 |
| 57. | 31078 | 3.8% | 2.0%(+1.83)#57 | 2.1%(+1.73)#2,646 |
| 58. | 30667 | 3.7% | 2.0%(+1.75)#58 | 2.1%(+1.65)#2,749 |
| 59. | 31557 | 3.7% | 2.0%(+1.74)#59 | 2.1%(+1.64)#2,773 |
| 60. | 30341 | 3.7% | 2.0%(+1.73)#60 | 2.1%(+1.62)#2,788 |
| 61. | 30188 | 3.7% | 2.0%(+1.71)#61 | 2.1%(+1.61)#2,814 |
| 62. | 30096 | 3.7% | 2.0%(+1.69)#62 | 2.1%(+1.59)#2,834 |
| 63. | 30032 | 3.6% | 2.0%(+1.65)#63 | 2.1%(+1.55)#2,896 |
| 64. | 30329 | 3.6% | 2.0%(+1.64)#64 | 2.1%(+1.54)#2,907 |
| 65. | 31041 | 3.6% | 2.0%(+1.61)#65 | 2.1%(+1.51)#2,958 |
| 66. | 30189 | 3.5% | 2.0%(+1.58)#66 | 2.1%(+1.47)#3,024 |
| 67. | 30303 | 3.5% | 2.0%(+1.52)#67 | 2.1%(+1.42)#3,094 |
| 68. | 30350 | 3.5% | 2.0%(+1.51)#68 | 2.1%(+1.41)#3,109 |
| 69. | 30601 | 3.5% | 2.0%(+1.51)#69 | 2.1%(+1.41)#3,113 |
| 70. | 30292 | 3.4% | 2.0%(+1.47)#70 | 2.1%(+1.37)#3,177 |
| 71. | 30340 | 3.4% | 2.0%(+1.46)#71 | 2.1%(+1.36)#3,190 |
| 72. | 30311 | 3.4% | 2.0%(+1.45)#72 | 2.1%(+1.35)#3,218 |
| 73. | 31812 | 3.4% | 2.0%(+1.41)#73 | 2.1%(+1.30)#3,315 |
| 74. | 30176 | 3.4% | 2.0%(+1.40)#74 | 2.1%(+1.29)#3,339 |
| 75. | 30068 | 3.4% | 2.0%(+1.40)#75 | 2.1%(+1.29)#3,341 |
| 76. | 30711 | 3.3% | 2.0%(+1.39)#76 | 2.1%(+1.28)#3,352 |
| 77. | 30363 | 3.3% | 2.0%(+1.30)#77 | 2.1%(+1.20)#3,490 |
| 78. | 30067 | 3.2% | 2.0%(+1.29)#78 | 2.1%(+1.18)#3,517 |
| 79. | 30339 | 3.2% | 2.0%(+1.25)#79 | 2.1%(+1.15)#3,583 |
| 80. | 31909 | 3.2% | 2.0%(+1.21)#80 | 2.1%(+1.11)#3,689 |
| 81. | 30344 | 3.2% | 2.0%(+1.20)#81 | 2.1%(+1.09)#3,725 |
| 82. | 30215 | 3.1% | 2.0%(+1.15)#82 | 2.1%(+1.05)#3,826 |
| 83. | 30028 | 3.1% | 2.0%(+1.15)#83 | 2.1%(+1.05)#3,827 |
| 84. | 30662 | 3.1% | 2.0%(+1.15)#84 | 2.1%(+1.05)#3,830 |
| 85. | 30269 | 3.1% | 2.0%(+1.15)#85 | 2.1%(+1.05)#3,838 |
| 86. | 30308 | 3.1% | 2.0%(+1.15)#86 | 2.1%(+1.04)#3,844 |
| 87. | 30213 | 3.1% | 2.0%(+1.11)#87 | 2.1%(+1.01)#3,913 |
| 88. | 30075 | 3.0% | 2.0%(+1.09)#88 | 2.1%(+0.986)#3,979 |
| 89. | 30554 | 3.0% | 2.0%(+0.998)#89 | 2.1%(+0.895)#4,192 |
| 90. | 30677 | 2.9% | 2.0%(+0.987)#90 | 2.1%(+0.884)#4,217 |
| 91. | 31501 | 2.9% | 2.0%(+0.983)#91 | 2.1%(+0.880)#4,226 |
| 92. | 30161 | 2.9% | 2.0%(+0.975)#92 | 2.1%(+0.872)#4,250 |
| 93. | 30627 | 2.9% | 2.0%(+0.969)#93 | 2.1%(+0.866)#4,270 |
| 94. | 30602 | 2.9% | 2.0%(+0.954)#94 | 2.1%(+0.852)#4,313 |
| 95. | 30084 | 2.9% | 2.0%(+0.950)#95 | 2.1%(+0.848)#4,329 |
| 96. | 31645 | 2.9% | 2.0%(+0.949)#96 | 2.1%(+0.847)#4,331 |
| 97. | 30622 | 2.9% | 2.0%(+0.937)#97 | 2.1%(+0.835)#4,358 |
| 98. | 30519 | 2.9% | 2.0%(+0.914)#98 | 2.1%(+0.812)#4,419 |
| 99. | 31410 | 2.9% | 2.0%(+0.913)#99 | 2.1%(+0.811)#4,421 |
| 100. | 30022 | 2.9% | 2.0%(+0.909)#100 | 2.1%(+0.807)#4,434 |
Common Questions
What are the Top 10 Zip Codes with the Highest Percentage of Population Employed in Arts, Media & Entertainment in Georgia?
Top 10 Zip Codes with the Highest Percentage of Population Employed in Arts, Media & Entertainment in Georgia are:
What zip code has the Highest Percentage of Population Employed in Arts, Media & Entertainment in Georgia?
31307 has the Highest Percentage of Population Employed in Arts, Media & Entertainment in Georgia with 20.5%.
What is the Percentage of Population Employed in Arts, Media & Entertainment in the State of Georgia?
Percentage of Population Employed in Arts, Media & Entertainment in Georgia is 2.0%.
What is the Percentage of Population Employed in Arts, Media & Entertainment in the United States?
Percentage of Population Employed in Arts, Media & Entertainment in the United States is 2.1%.