Cities with the Highest Percentage of Population Driving Alone to Work in Mississippi
RELATED REPORTS & OPTIONS
Drive | Alone
Mississippi
Compare Cities
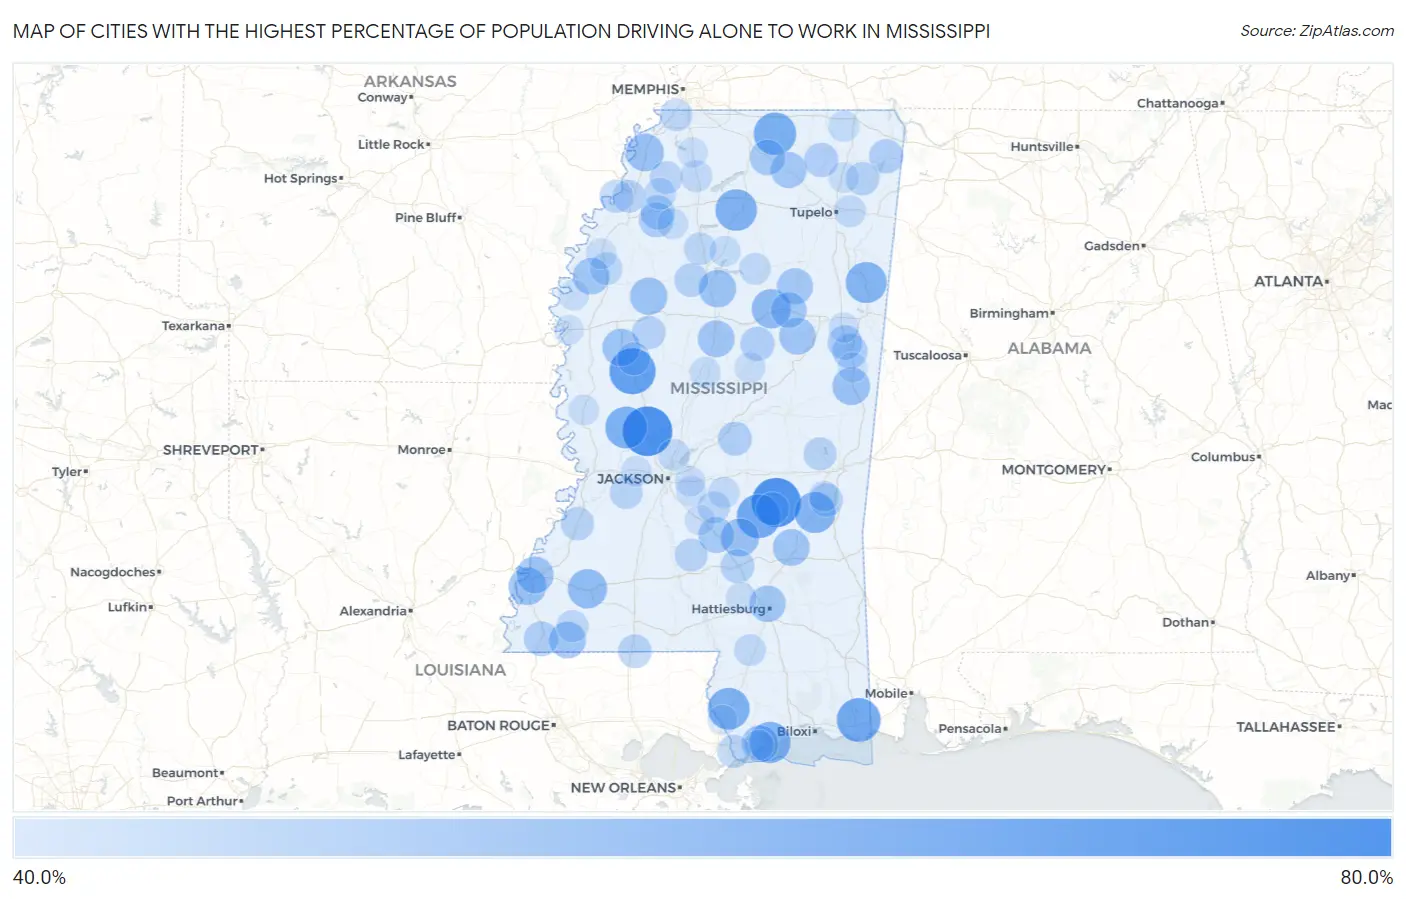
Map of Cities with the Highest Percentage of Population Driving Alone to Work in Mississippi
0.0%
80.0%
Cities with the Highest Percentage of Population Driving Alone to Work in Mississippi
| City | % Drive Alone | vs State | vs National | |
| 1. | Bentonia | 65.2% | 42.2%(+23.0)#1 | 42.1%(+23.1)#145 |
| 2. | Montrose | 64.8% | 42.2%(+22.6)#2 | 42.1%(+22.7)#165 |
| 3. | Silver City | 61.7% | 42.2%(+19.5)#3 | 42.1%(+19.6)#395 |
| 4. | Independence | 61.2% | 42.2%(+19.0)#4 | 42.1%(+19.1)#466 |
| 5. | Elizabeth | 59.4% | 42.2%(+17.2)#5 | 42.1%(+17.3)#728 |
| 6. | Sylvarena | 59.3% | 42.2%(+17.1)#6 | 42.1%(+17.2)#765 |
| 7. | Helena | 59.2% | 42.2%(+17.0)#7 | 42.1%(+17.1)#779 |
| 8. | Snow Lake Shores | 57.9% | 42.2%(+15.7)#8 | 42.1%(+15.8)#1,056 |
| 9. | Satartia | 57.3% | 42.2%(+15.1)#9 | 42.1%(+15.2)#1,230 |
| 10. | Hide A Way Lake | 57.2% | 42.2%(+15.0)#10 | 42.1%(+15.1)#1,233 |
| 11. | Taylor | 56.9% | 42.2%(+14.7)#11 | 42.1%(+14.8)#1,317 |
| 12. | Henderson Point | 56.5% | 42.2%(+14.3)#12 | 42.1%(+14.4)#1,421 |
| 13. | New Hamilton | 56.4% | 42.2%(+14.2)#13 | 42.1%(+14.3)#1,462 |
| 14. | Pachuta | 56.3% | 42.2%(+14.1)#14 | 42.1%(+14.2)#1,512 |
| 15. | Eupora | 54.5% | 42.2%(+12.3)#15 | 42.1%(+12.4)#2,078 |
| 16. | Meadville | 54.5% | 42.2%(+12.3)#16 | 42.1%(+12.4)#2,091 |
| 17. | Mize | 53.3% | 42.2%(+11.1)#17 | 42.1%(+11.2)#2,683 |
| 18. | Tunica | 53.1% | 42.2%(+10.9)#18 | 42.1%(+11.0)#2,761 |
| 19. | Cloverdale | 53.0% | 42.2%(+10.8)#19 | 42.1%(+10.9)#2,823 |
| 20. | Shuqualak | 53.0% | 42.2%(+10.8)#20 | 42.1%(+10.9)#2,827 |
| 21. | Isola | 52.8% | 42.2%(+10.6)#21 | 42.1%(+10.7)#2,902 |
| 22. | Elliott | 52.7% | 42.2%(+10.5)#22 | 42.1%(+10.6)#2,949 |
| 23. | Schlater | 52.7% | 42.2%(+10.5)#23 | 42.1%(+10.6)#2,960 |
| 24. | Morgantown | 52.3% | 42.2%(+10.1)#24 | 42.1%(+10.2)#3,183 |
| 25. | Bay St Louis | 52.2% | 42.2%(+10.00)#25 | 42.1%(+10.1)#3,230 |
| 26. | Vaiden | 52.1% | 42.2%(+9.90)#26 | 42.1%(+10.00)#3,319 |
| 27. | Bogue Chitto Cdp Kemper And Neshoba Counties | 52.1% | 42.2%(+9.90)#27 | 42.1%(+10.00)#3,337 |
| 28. | Sturgis | 52.1% | 42.2%(+9.90)#28 | 42.1%(+10.00)#3,347 |
| 29. | Centreville | 52.0% | 42.2%(+9.80)#29 | 42.1%(+9.90)#3,366 |
| 30. | Sharon | 52.0% | 42.2%(+9.80)#30 | 42.1%(+9.90)#3,368 |
| 31. | Pace | 51.8% | 42.2%(+9.60)#31 | 42.1%(+9.70)#3,503 |
| 32. | Glendale | 51.7% | 42.2%(+9.50)#32 | 42.1%(+9.60)#3,539 |
| 33. | Myrtle | 51.4% | 42.2%(+9.20)#33 | 42.1%(+9.30)#3,747 |
| 34. | Mantee | 51.4% | 42.2%(+9.20)#34 | 42.1%(+9.30)#3,756 |
| 35. | Magee | 51.1% | 42.2%(+8.90)#35 | 42.1%(+9.00)#3,947 |
| 36. | Mathiston | 51.0% | 42.2%(+8.80)#36 | 42.1%(+8.90)#4,052 |
| 37. | Potts Camp | 50.9% | 42.2%(+8.70)#37 | 42.1%(+8.80)#4,131 |
| 38. | Brooksville | 50.2% | 42.2%(+8.00)#38 | 42.1%(+8.10)#4,672 |
| 39. | Woodville | 50.1% | 42.2%(+7.90)#39 | 42.1%(+8.00)#4,763 |
| 40. | Lambert | 50.0% | 42.2%(+7.80)#40 | 42.1%(+7.90)#4,855 |
| 41. | Crawford | 50.0% | 42.2%(+7.80)#41 | 42.1%(+7.90)#4,877 |
| 42. | Marks | 49.8% | 42.2%(+7.60)#42 | 42.1%(+7.70)#5,026 |
| 43. | Dumas | 49.6% | 42.2%(+7.40)#43 | 42.1%(+7.50)#5,249 |
| 44. | French Camp | 49.5% | 42.2%(+7.30)#44 | 42.1%(+7.40)#5,356 |
| 45. | Paden | 49.5% | 42.2%(+7.30)#45 | 42.1%(+7.40)#5,386 |
| 46. | Lena | 49.3% | 42.2%(+7.10)#46 | 42.1%(+7.20)#5,598 |
| 47. | Collins | 49.1% | 42.2%(+6.90)#47 | 42.1%(+7.00)#5,708 |
| 48. | Holcomb | 49.1% | 42.2%(+6.90)#48 | 42.1%(+7.00)#5,780 |
| 49. | Osyka | 48.8% | 42.2%(+6.60)#49 | 42.1%(+6.70)#6,053 |
| 50. | Morgan City | 48.8% | 42.2%(+6.60)#50 | 42.1%(+6.70)#6,069 |
| 51. | Marietta | 48.8% | 42.2%(+6.60)#51 | 42.1%(+6.70)#6,071 |
| 52. | Stonewall | 48.7% | 42.2%(+6.50)#52 | 42.1%(+6.60)#6,143 |
| 53. | Port Gibson | 48.6% | 42.2%(+6.40)#53 | 42.1%(+6.50)#6,235 |
| 54. | Friars Point | 48.6% | 42.2%(+6.40)#54 | 42.1%(+6.50)#6,237 |
| 55. | Arkabutla | 48.6% | 42.2%(+6.40)#55 | 42.1%(+6.50)#6,260 |
| 56. | Pearlington | 48.5% | 42.2%(+6.30)#56 | 42.1%(+6.40)#6,336 |
| 57. | Benton | 48.5% | 42.2%(+6.30)#57 | 42.1%(+6.40)#6,376 |
| 58. | Belzoni | 48.4% | 42.2%(+6.20)#58 | 42.1%(+6.30)#6,457 |
| 59. | Louin | 48.4% | 42.2%(+6.20)#59 | 42.1%(+6.30)#6,496 |
| 60. | Collinsville | 48.3% | 42.2%(+6.10)#60 | 42.1%(+6.20)#6,574 |
| 61. | New Hebron | 48.3% | 42.2%(+6.10)#61 | 42.1%(+6.20)#6,617 |
| 62. | Learned | 48.3% | 42.2%(+6.10)#62 | 42.1%(+6.20)#6,674 |
| 63. | Coahoma | 48.1% | 42.2%(+5.90)#63 | 42.1%(+6.00)#6,907 |
| 64. | Crenshaw | 48.0% | 42.2%(+5.80)#64 | 42.1%(+5.90)#6,992 |
| 65. | Merigold | 47.9% | 42.2%(+5.70)#65 | 42.1%(+5.80)#7,105 |
| 66. | Lynchburg | 47.8% | 42.2%(+5.60)#66 | 42.1%(+5.70)#7,168 |
| 67. | Tillatoba | 47.8% | 42.2%(+5.60)#67 | 42.1%(+5.70)#7,255 |
| 68. | Gloster | 47.5% | 42.2%(+5.30)#68 | 42.1%(+5.40)#7,536 |
| 69. | Puckett | 47.4% | 42.2%(+5.20)#69 | 42.1%(+5.30)#7,737 |
| 70. | Madison | 47.3% | 42.2%(+5.10)#70 | 42.1%(+5.20)#7,773 |
| 71. | Mooreville | 47.2% | 42.2%(+5.00)#71 | 42.1%(+5.10)#7,971 |
| 72. | Lumberton | 47.2% | 42.2%(+5.00)#72 | 42.1%(+5.10)#7,973 |
| 73. | Como | 47.2% | 42.2%(+5.00)#73 | 42.1%(+5.10)#7,974 |
| 74. | Falcon | 47.2% | 42.2%(+5.00)#74 | 42.1%(+5.10)#8,044 |
| 75. | Big Creek | 47.1% | 42.2%(+4.90)#75 | 42.1%(+5.00)#8,189 |
| 76. | Eudora | 47.0% | 42.2%(+4.80)#76 | 42.1%(+4.90)#8,279 |
| 77. | Polkville | 46.8% | 42.2%(+4.60)#77 | 42.1%(+4.70)#8,510 |
| 78. | Biggersville | 46.8% | 42.2%(+4.60)#78 | 42.1%(+4.70)#8,557 |
| 79. | Durant | 46.6% | 42.2%(+4.40)#79 | 42.1%(+4.50)#8,729 |
| 80. | Kossuth | 46.5% | 42.2%(+4.30)#80 | 42.1%(+4.40)#8,935 |
| 81. | Coffeeville | 46.4% | 42.2%(+4.20)#81 | 42.1%(+4.30)#9,035 |
| 82. | Crowder | 46.4% | 42.2%(+4.20)#82 | 42.1%(+4.30)#9,050 |
| 83. | De Soto | 46.3% | 42.2%(+4.10)#83 | 42.1%(+4.20)#9,228 |
| 84. | Shelby | 46.2% | 42.2%(+4.00)#84 | 42.1%(+4.10)#9,320 |
| 85. | Bolton | 46.2% | 42.2%(+4.00)#85 | 42.1%(+4.10)#9,339 |
| 86. | Robinhood | 46.1% | 42.2%(+3.90)#86 | 42.1%(+4.00)#9,460 |
| 87. | Enterprise | 46.1% | 42.2%(+3.90)#87 | 42.1%(+4.00)#9,494 |
| 88. | Ethel | 46.1% | 42.2%(+3.90)#88 | 42.1%(+4.00)#9,502 |
| 89. | Baldwyn | 46.0% | 42.2%(+3.80)#89 | 42.1%(+3.90)#9,579 |
| 90. | Sumrall | 46.0% | 42.2%(+3.80)#90 | 42.1%(+3.90)#9,588 |
| 91. | Benoit | 46.0% | 42.2%(+3.80)#91 | 42.1%(+3.90)#9,620 |
| 92. | Cary | 46.0% | 42.2%(+3.80)#92 | 42.1%(+3.90)#9,626 |
| 93. | Brandon | 45.9% | 42.2%(+3.70)#93 | 42.1%(+3.80)#9,675 |
| 94. | D Lo | 45.8% | 42.2%(+3.60)#94 | 42.1%(+3.70)#9,919 |
| 95. | Coldwater | 45.7% | 42.2%(+3.50)#95 | 42.1%(+3.60)#10,041 |
| 96. | Artesia | 45.7% | 42.2%(+3.50)#96 | 42.1%(+3.60)#10,079 |
| 97. | Greenville | 45.6% | 42.2%(+3.40)#97 | 42.1%(+3.50)#10,105 |
| 98. | Macon | 45.6% | 42.2%(+3.40)#98 | 42.1%(+3.50)#10,151 |
| 99. | Waveland | 45.5% | 42.2%(+3.30)#99 | 42.1%(+3.40)#10,268 |
| 100. | Nicholson | 45.5% | 42.2%(+3.30)#100 | 42.1%(+3.40)#10,301 |
Common Questions
What are the Top 10 Cities with the Highest Percentage of Population Driving Alone to Work in Mississippi?
Top 10 Cities with the Highest Percentage of Population Driving Alone to Work in Mississippi are:
#1
65.2%
#2
64.8%
#3
61.7%
#4
59.3%
#5
59.2%
#6
57.9%
#7
57.3%
#8
57.2%
#9
56.9%
#10
56.5%
What city has the Highest Percentage of Population Driving Alone to Work in Mississippi?
Bentonia has the Highest Percentage of Population Driving Alone to Work in Mississippi with 65.2%.
What is the Percentage of Population Driving Alone to Work in the State of Mississippi?
Percentage of Population Driving Alone to Work in Mississippi is 42.2%.
What is the Percentage of Population Driving Alone to Work in the United States?
Percentage of Population Driving Alone to Work in the United States is 42.1%.