D LO, MS Map & Demographics
D LO Map
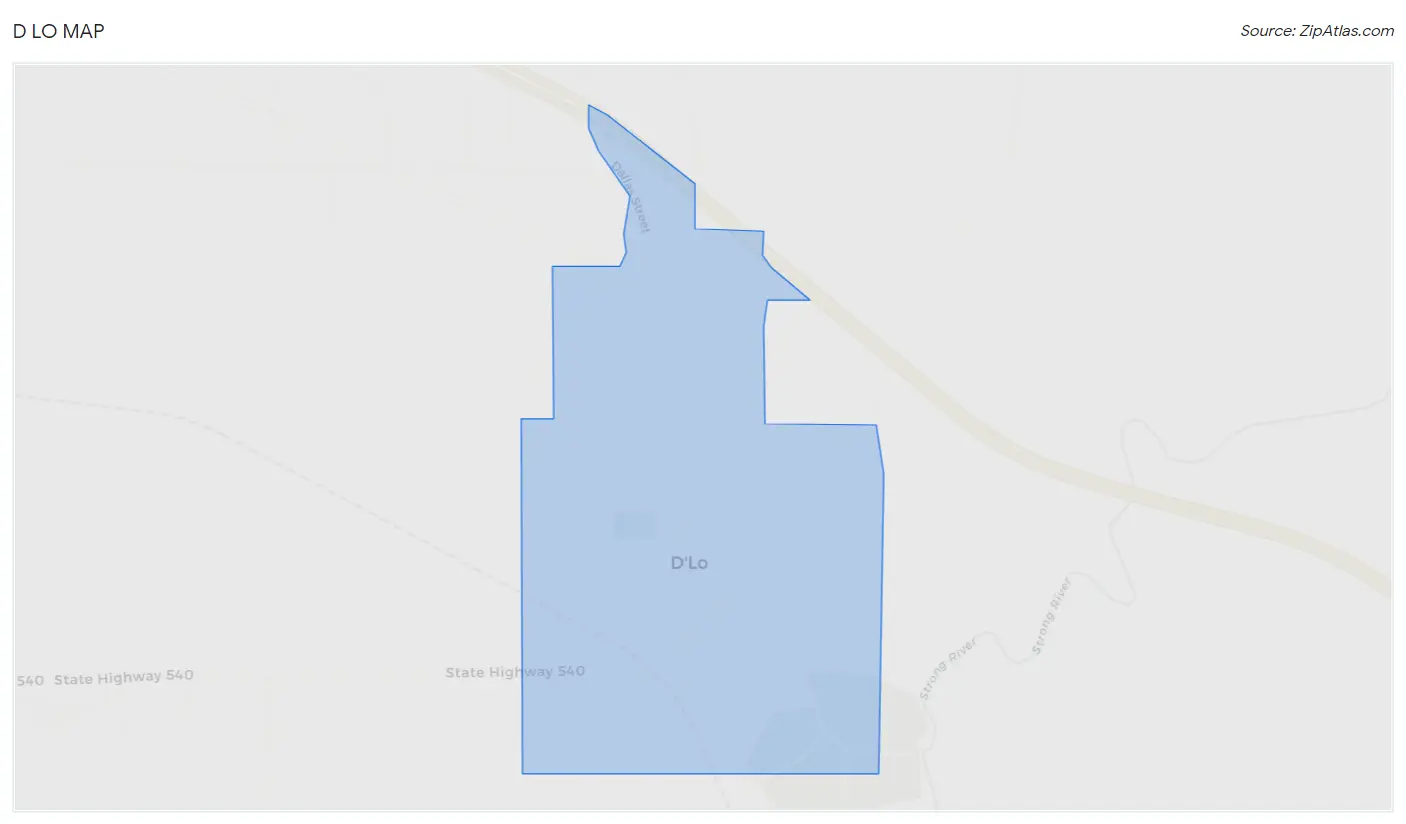
D LO Overview
$18,776
PER CAPITA INCOME
$59,063
AVG FAMILY INCOME
$31,339
AVG HOUSEHOLD INCOME
30.2%
WAGE / INCOME GAP [ % ]
69.8¢/ $1
WAGE / INCOME GAP [ $ ]
0.46
INEQUALITY / GINI INDEX
540
TOTAL POPULATION
293
MALE POPULATION
247
FEMALE POPULATION
118.62
MALES / 100 FEMALES
84.30
FEMALES / 100 MALES
38.5
MEDIAN AGE
3.9
AVG FAMILY SIZE
3.0
AVG HOUSEHOLD SIZE
203
LABOR FORCE [ PEOPLE ]
48.3%
PERCENT IN LABOR FORCE
17.2%
UNEMPLOYMENT RATE
D LO Zip Codes
D LO Area Codes
Income in D LO
Income Overview in D LO
Per Capita Income in D LO is $18,776, while median incomes of families and households are $59,063 and $31,339 respectively.
| Characteristic | Number | Measure |
| Per Capita Income | 540 | $18,776 |
| Median Family Income | 120 | $59,063 |
| Mean Family Income | 120 | $68,531 |
| Median Household Income | 179 | $31,339 |
| Mean Household Income | 179 | $52,534 |
| Income Deficit | 120 | $0 |
| Wage / Income Gap (%) | 540 | 30.22% |
| Wage / Income Gap ($) | 540 | 69.78¢ per $1 |
| Gini / Inequality Index | 540 | 0.46 |
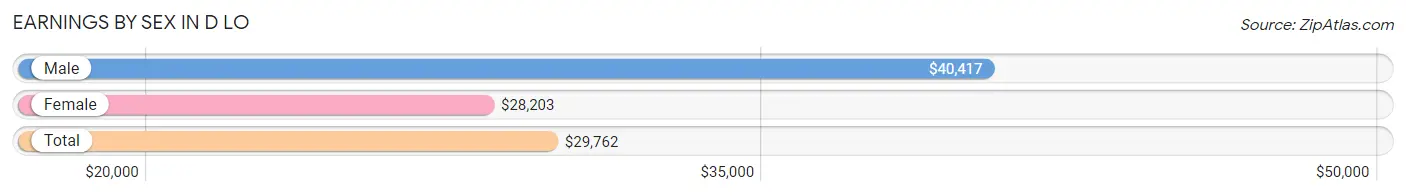
Earnings by Sex in D LO
Average Earnings in D LO are $29,762, $40,417 for men and $28,203 for women, a difference of 30.2%.
| Sex | Number | Average Earnings |
| Male | 93 (47.9%) | $40,417 |
| Female | 101 (52.1%) | $28,203 |
| Total | 194 (100.0%) | $29,762 |
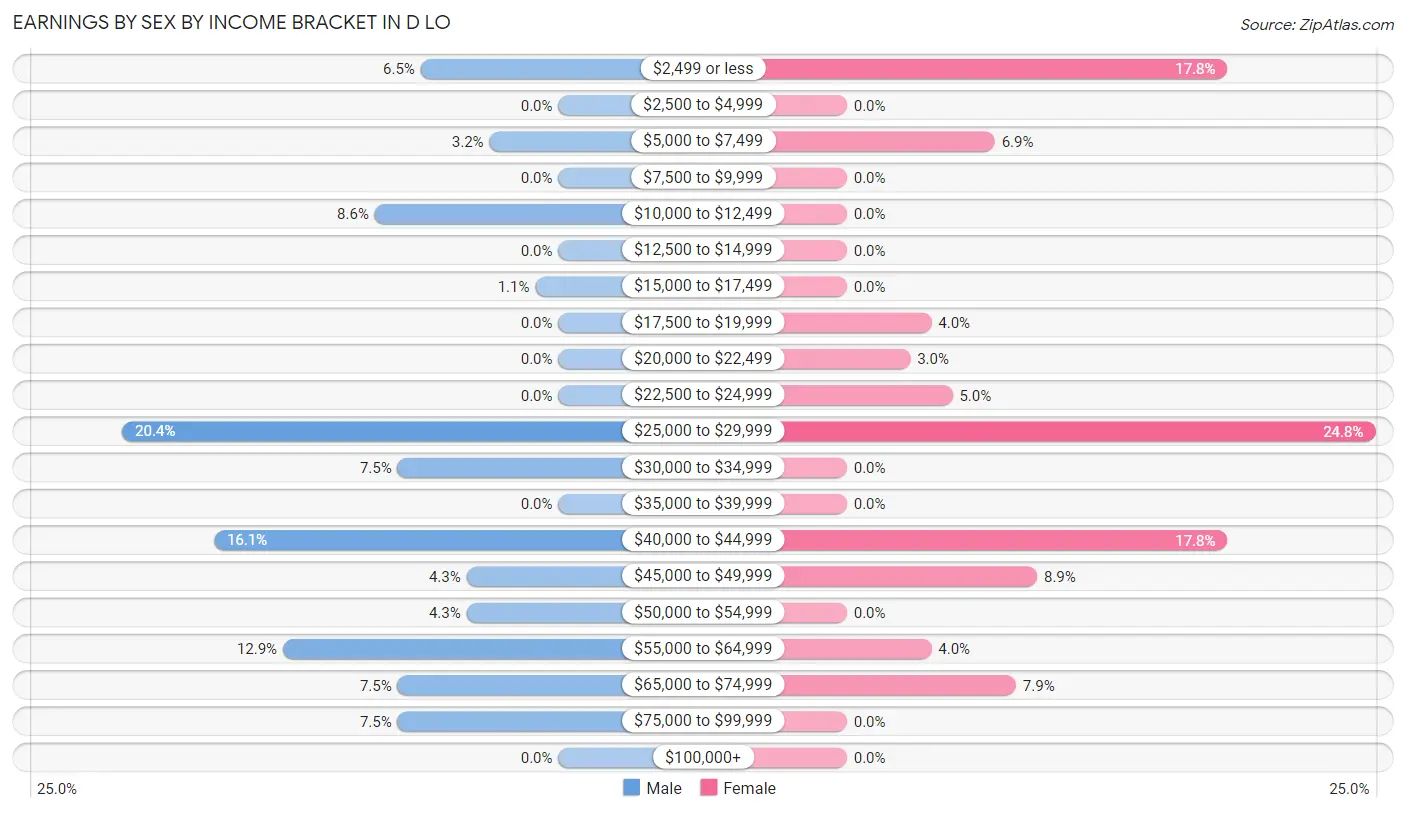
Earnings by Sex by Income Bracket in D LO
The most common earnings brackets in D LO are $25,000 to $29,999 for men (19 | 20.4%) and $25,000 to $29,999 for women (25 | 24.7%).
| Income | Male | Female |
| $2,499 or less | 6 (6.5%) | 18 (17.8%) |
| $2,500 to $4,999 | 0 (0.0%) | 0 (0.0%) |
| $5,000 to $7,499 | 3 (3.2%) | 7 (6.9%) |
| $7,500 to $9,999 | 0 (0.0%) | 0 (0.0%) |
| $10,000 to $12,499 | 8 (8.6%) | 0 (0.0%) |
| $12,500 to $14,999 | 0 (0.0%) | 0 (0.0%) |
| $15,000 to $17,499 | 1 (1.1%) | 0 (0.0%) |
| $17,500 to $19,999 | 0 (0.0%) | 4 (4.0%) |
| $20,000 to $22,499 | 0 (0.0%) | 3 (3.0%) |
| $22,500 to $24,999 | 0 (0.0%) | 5 (5.0%) |
| $25,000 to $29,999 | 19 (20.4%) | 25 (24.7%) |
| $30,000 to $34,999 | 7 (7.5%) | 0 (0.0%) |
| $35,000 to $39,999 | 0 (0.0%) | 0 (0.0%) |
| $40,000 to $44,999 | 15 (16.1%) | 18 (17.8%) |
| $45,000 to $49,999 | 4 (4.3%) | 9 (8.9%) |
| $50,000 to $54,999 | 4 (4.3%) | 0 (0.0%) |
| $55,000 to $64,999 | 12 (12.9%) | 4 (4.0%) |
| $65,000 to $74,999 | 7 (7.5%) | 8 (7.9%) |
| $75,000 to $99,999 | 7 (7.5%) | 0 (0.0%) |
| $100,000+ | 0 (0.0%) | 0 (0.0%) |
| Total | 93 (100.0%) | 101 (100.0%) |
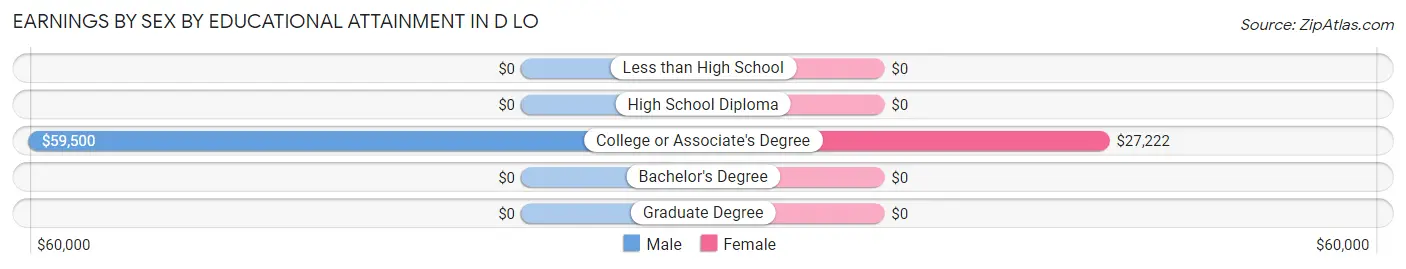
Earnings by Sex by Educational Attainment in D LO
Average earnings in D LO are $48,750 for men and $27,891 for women, a difference of 42.8%. Men with an educational attainment of college or associate's degree enjoy the highest average annual earnings of $59,500, while those with college or associate's degree education earn the least with $59,500. Women with an educational attainment of college or associate's degree earn the most with the average annual earnings of $27,222, while those with college or associate's degree education have the smallest earnings of $27,222.
| Educational Attainment | Male Income | Female Income |
| Less than High School | - | - |
| High School Diploma | - | - |
| College or Associate's Degree | $59,500 | $27,222 |
| Bachelor's Degree | - | - |
| Graduate Degree | - | - |
| Total | $48,750 | $27,891 |
Family Income in D LO
Family Income Brackets in D LO
According to the D LO family income data, there are 35 families falling into the $25,000 to $34,999 income range, which is the most common income bracket and makes up 29.2% of all families.
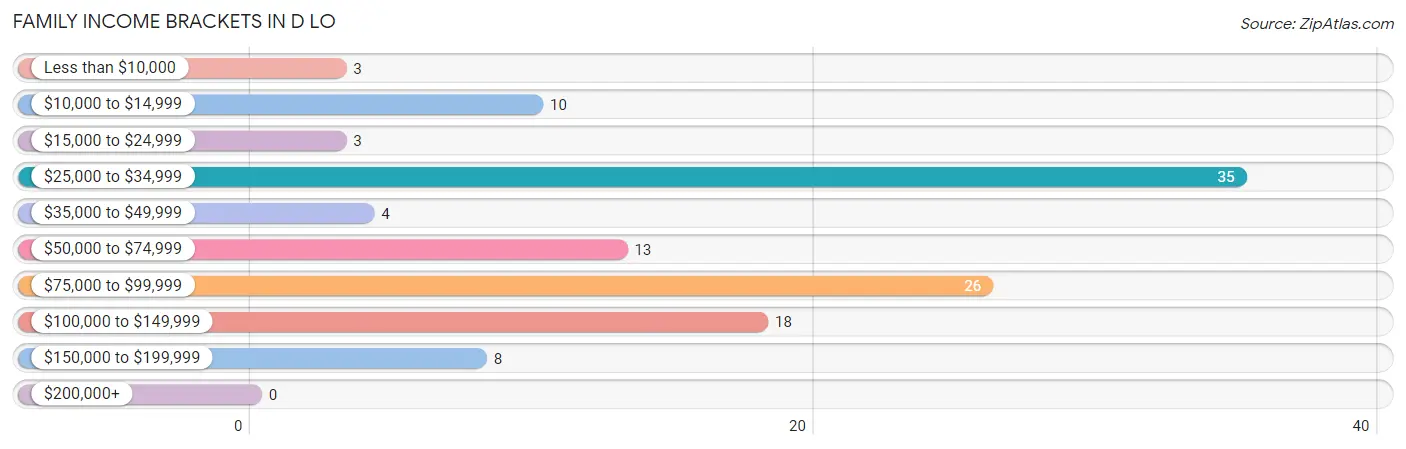
| Income Bracket | # Families | % Families |
| Less than $10,000 | 3 | 2.5% |
| $10,000 to $14,999 | 10 | 8.3% |
| $15,000 to $24,999 | 3 | 2.5% |
| $25,000 to $34,999 | 35 | 29.2% |
| $35,000 to $49,999 | 4 | 3.3% |
| $50,000 to $74,999 | 13 | 10.8% |
| $75,000 to $99,999 | 26 | 21.7% |
| $100,000 to $149,999 | 18 | 15.0% |
| $150,000 to $199,999 | 8 | 6.7% |
| $200,000+ | 0 | 0.0% |
Family Income by Famaliy Size in D LO
4-person families (19 | 15.8%) account for the highest median family income in D LO with $126,806 per family, while 4-person families (19 | 15.8%) have the highest median income of $31,702 per family member.
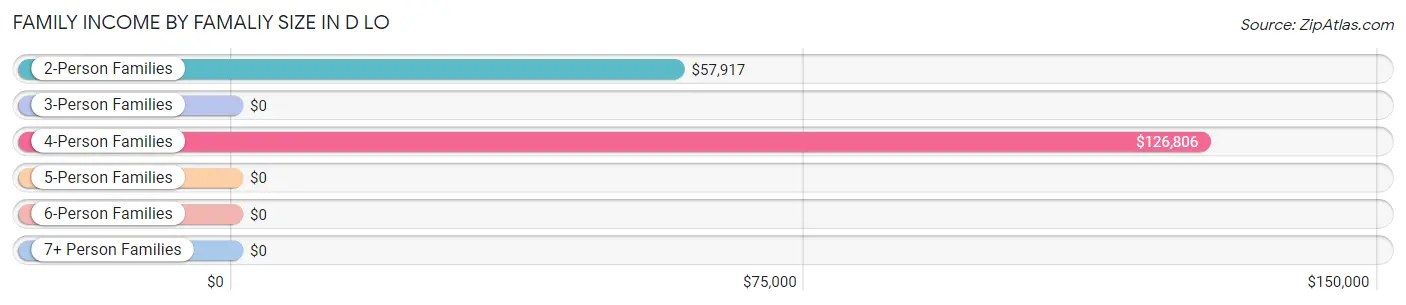
| Income Bracket | # Families | Median Income |
| 2-Person Families | 51 (42.5%) | $57,917 |
| 3-Person Families | 33 (27.5%) | $0 |
| 4-Person Families | 19 (15.8%) | $126,806 |
| 5-Person Families | 1 (0.8%) | $0 |
| 6-Person Families | 7 (5.8%) | $0 |
| 7+ Person Families | 9 (7.5%) | $0 |
| Total | 120 (100.0%) | $59,063 |
Family Income by Number of Earners in D LO
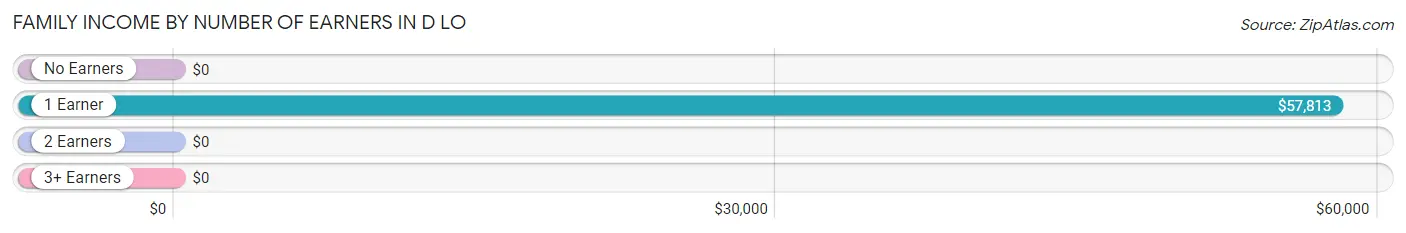
| Number of Earners | # Families | Median Income |
| No Earners | 9 (7.5%) | $0 |
| 1 Earner | 74 (61.7%) | $57,813 |
| 2 Earners | 22 (18.3%) | $0 |
| 3+ Earners | 15 (12.5%) | $0 |
| Total | 120 (100.0%) | $59,063 |
Household Income in D LO
Household Income Brackets in D LO
With 39 households falling in the category, the $25,000 to $34,999 income range is the most frequent in D LO, accounting for 21.8% of all households.
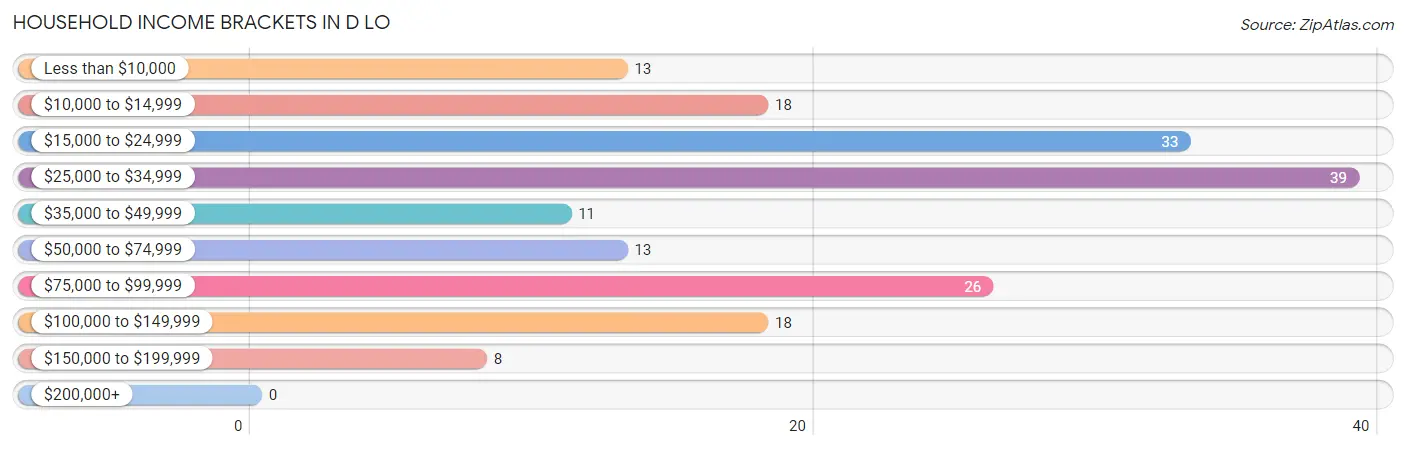
| Income Bracket | # Households | % Households |
| Less than $10,000 | 13 | 7.3% |
| $10,000 to $14,999 | 18 | 10.1% |
| $15,000 to $24,999 | 33 | 18.4% |
| $25,000 to $34,999 | 39 | 21.8% |
| $35,000 to $49,999 | 11 | 6.1% |
| $50,000 to $74,999 | 13 | 7.3% |
| $75,000 to $99,999 | 26 | 14.5% |
| $100,000 to $149,999 | 18 | 10.1% |
| $150,000 to $199,999 | 8 | 4.5% |
| $200,000+ | 0 | 0.0% |
Household Income by Householder Age in D LO
The median household income in D LO is $31,339, with the highest median household income of $34,107 found in the 25 to 44 years age bracket for the primary householder. A total of 33 households (18.4%) fall into this category. Meanwhile, the 15 to 24 years age bracket for the primary householder has the lowest median household income of $0, with 4 households (2.2%) in this group.
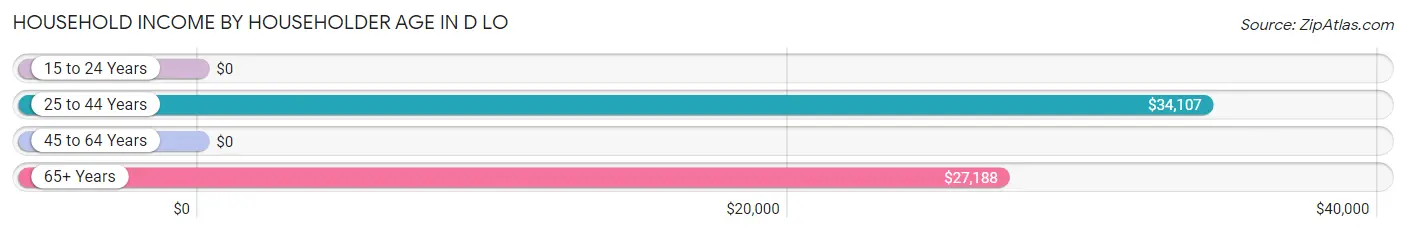
| Income Bracket | # Households | Median Income |
| 15 to 24 Years | 4 (2.2%) | $0 |
| 25 to 44 Years | 33 (18.4%) | $34,107 |
| 45 to 64 Years | 81 (45.3%) | $0 |
| 65+ Years | 61 (34.1%) | $27,188 |
| Total | 179 (100.0%) | $31,339 |
Poverty in D LO
Income Below Poverty by Sex and Age in D LO
With 37.5% poverty level for males and 17.4% for females among the residents of D LO, 35 to 44 year old males and 35 to 44 year old females are the most vulnerable to poverty, with 21 males (63.6%) and 10 females (38.5%) in their respective age groups living below the poverty level.
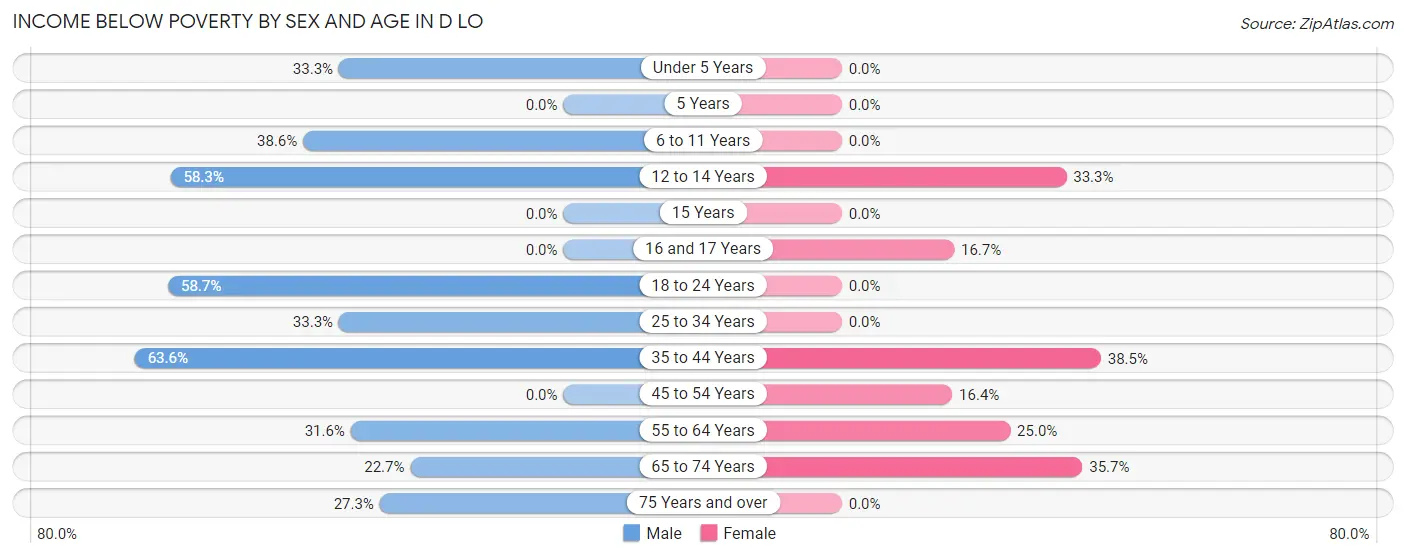
| Age Bracket | Male | Female |
| Under 5 Years | 2 (33.3%) | 0 (0.0%) |
| 5 Years | 0 (0.0%) | 0 (0.0%) |
| 6 to 11 Years | 17 (38.6%) | 0 (0.0%) |
| 12 to 14 Years | 14 (58.3%) | 4 (33.3%) |
| 15 Years | 0 (0.0%) | 0 (0.0%) |
| 16 and 17 Years | 0 (0.0%) | 2 (16.7%) |
| 18 to 24 Years | 27 (58.7%) | 0 (0.0%) |
| 25 to 34 Years | 6 (33.3%) | 0 (0.0%) |
| 35 to 44 Years | 21 (63.6%) | 10 (38.5%) |
| 45 to 54 Years | 0 (0.0%) | 10 (16.4%) |
| 55 to 64 Years | 12 (31.6%) | 7 (25.0%) |
| 65 to 74 Years | 5 (22.7%) | 10 (35.7%) |
| 75 Years and over | 6 (27.3%) | 0 (0.0%) |
| Total | 110 (37.5%) | 43 (17.4%) |
Income Above Poverty by Sex and Age in D LO
According to the poverty statistics in D LO, males aged 15 years and females aged under 5 years are the age groups that are most secure financially, with 100.0% of males and 100.0% of females in these age groups living above the poverty line.
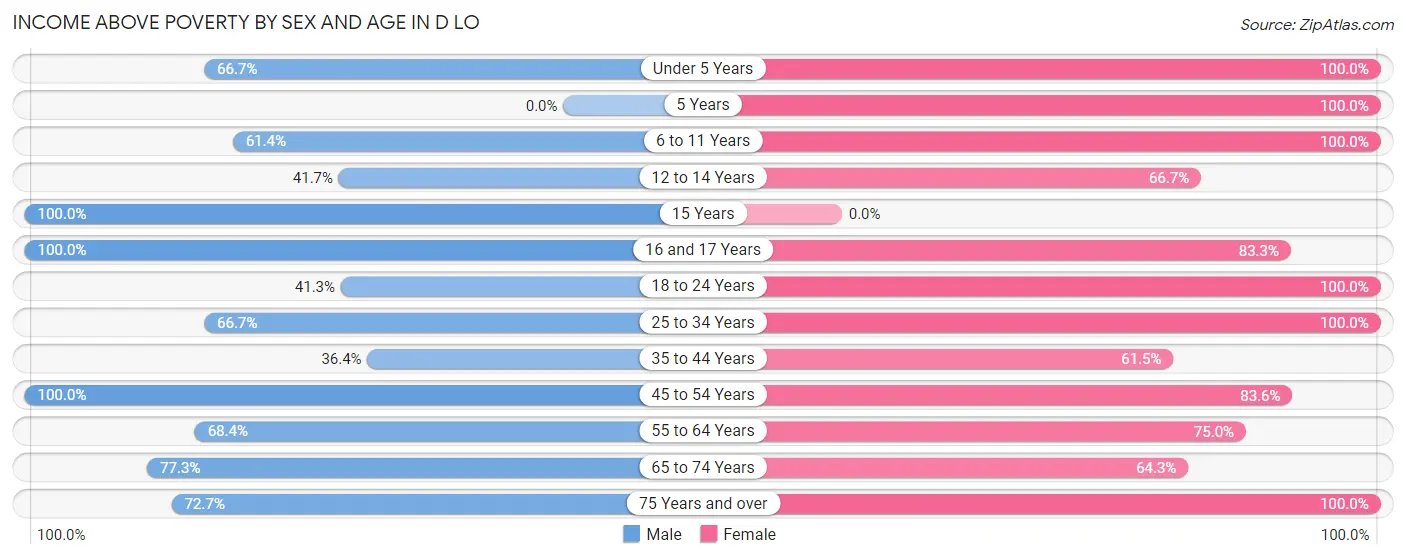
| Age Bracket | Male | Female |
| Under 5 Years | 4 (66.7%) | 11 (100.0%) |
| 5 Years | 0 (0.0%) | 2 (100.0%) |
| 6 to 11 Years | 27 (61.4%) | 9 (100.0%) |
| 12 to 14 Years | 10 (41.7%) | 8 (66.7%) |
| 15 Years | 12 (100.0%) | 0 (0.0%) |
| 16 and 17 Years | 9 (100.0%) | 10 (83.3%) |
| 18 to 24 Years | 19 (41.3%) | 11 (100.0%) |
| 25 to 34 Years | 12 (66.7%) | 26 (100.0%) |
| 35 to 44 Years | 12 (36.4%) | 16 (61.5%) |
| 45 to 54 Years | 19 (100.0%) | 51 (83.6%) |
| 55 to 64 Years | 26 (68.4%) | 21 (75.0%) |
| 65 to 74 Years | 17 (77.3%) | 18 (64.3%) |
| 75 Years and over | 16 (72.7%) | 21 (100.0%) |
| Total | 183 (62.5%) | 204 (82.6%) |
Income Below Poverty Among Married-Couple Families in D LO
The poverty statistics for married-couple families in D LO show that 10.4% or 10 of the total 96 families live below the poverty line. Families with 1 or 2 children have the highest poverty rate of 21.9%, comprising of 7 families. On the other hand, families with 3 or 4 children have the lowest poverty rate of 0.0%, which includes 0 families.
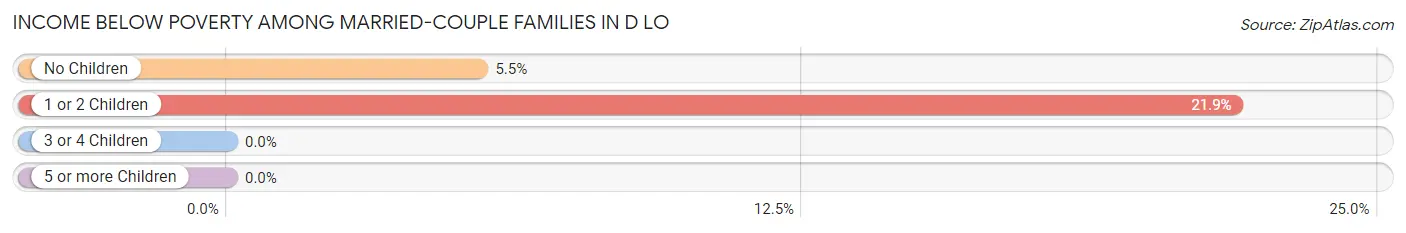
| Children | Above Poverty | Below Poverty |
| No Children | 52 (94.6%) | 3 (5.4%) |
| 1 or 2 Children | 25 (78.1%) | 7 (21.9%) |
| 3 or 4 Children | 4 (100.0%) | 0 (0.0%) |
| 5 or more Children | 5 (100.0%) | 0 (0.0%) |
| Total | 86 (89.6%) | 10 (10.4%) |
Income Below Poverty Among Single-Parent Households in D LO
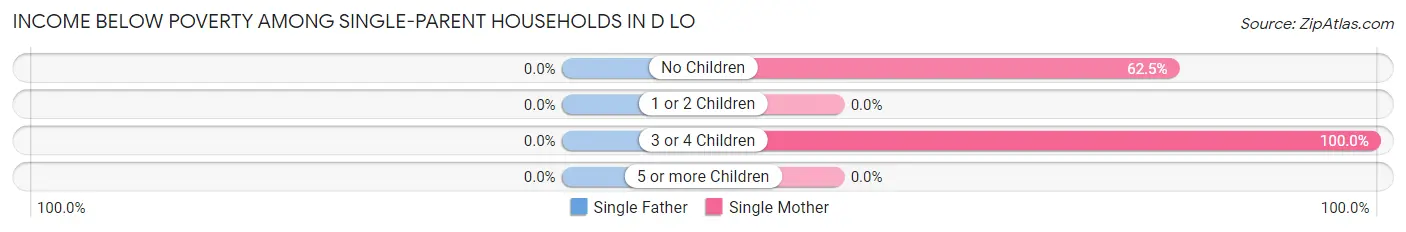
| Children | Single Father | Single Mother |
| No Children | 0 (0.0%) | 10 (62.5%) |
| 1 or 2 Children | 0 (0.0%) | 0 (0.0%) |
| 3 or 4 Children | 0 (0.0%) | 3 (100.0%) |
| 5 or more Children | 0 (0.0%) | 0 (0.0%) |
| Total | 0 (0.0%) | 13 (54.2%) |
Income Below Poverty Among Married-Couple vs Single-Parent Households in D LO
The poverty data for D LO shows that 10 of the married-couple family households (10.4%) and 13 of the single-parent households (54.2%) are living below the poverty level. Within the married-couple family households, those with 1 or 2 children have the highest poverty rate, with 7 households (21.9%) falling below the poverty line. Among the single-parent households, those with 3 or 4 children have the highest poverty rate, with 3 household (100.0%) living below poverty.
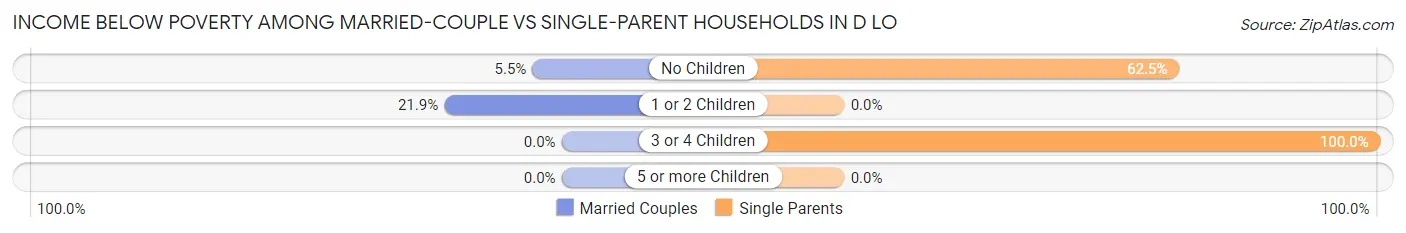
| Children | Married-Couple Families | Single-Parent Households |
| No Children | 3 (5.4%) | 10 (62.5%) |
| 1 or 2 Children | 7 (21.9%) | 0 (0.0%) |
| 3 or 4 Children | 0 (0.0%) | 3 (100.0%) |
| 5 or more Children | 0 (0.0%) | 0 (0.0%) |
| Total | 10 (10.4%) | 13 (54.2%) |
Race in D LO
The most populous races in D LO are White / Caucasian (356 | 65.9%), Black / African American (169 | 31.3%), and Two or more Races (15 | 2.8%).
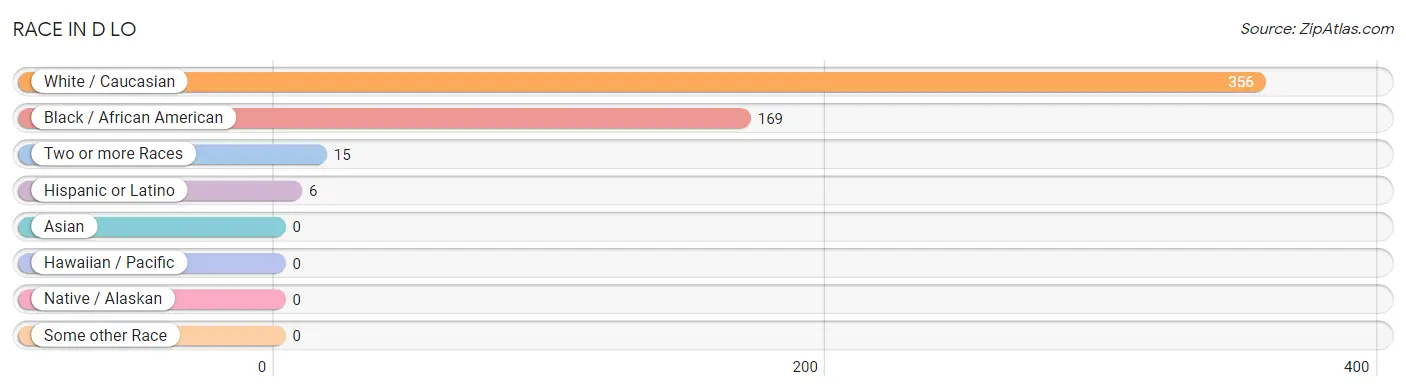
| Race | # Population | % Population |
| Asian | 0 | 0.0% |
| Black / African American | 169 | 31.3% |
| Hawaiian / Pacific | 0 | 0.0% |
| Hispanic or Latino | 6 | 1.1% |
| Native / Alaskan | 0 | 0.0% |
| White / Caucasian | 356 | 65.9% |
| Two or more Races | 15 | 2.8% |
| Some other Race | 0 | 0.0% |
| Total | 540 | 100.0% |
Ancestry in D LO
The most populous ancestries reported in D LO are Irish (66 | 12.2%), English (42 | 7.8%), Scotch-Irish (17 | 3.2%), German (14 | 2.6%), and Scottish (10 | 1.8%), together accounting for 27.6% of all D LO residents.
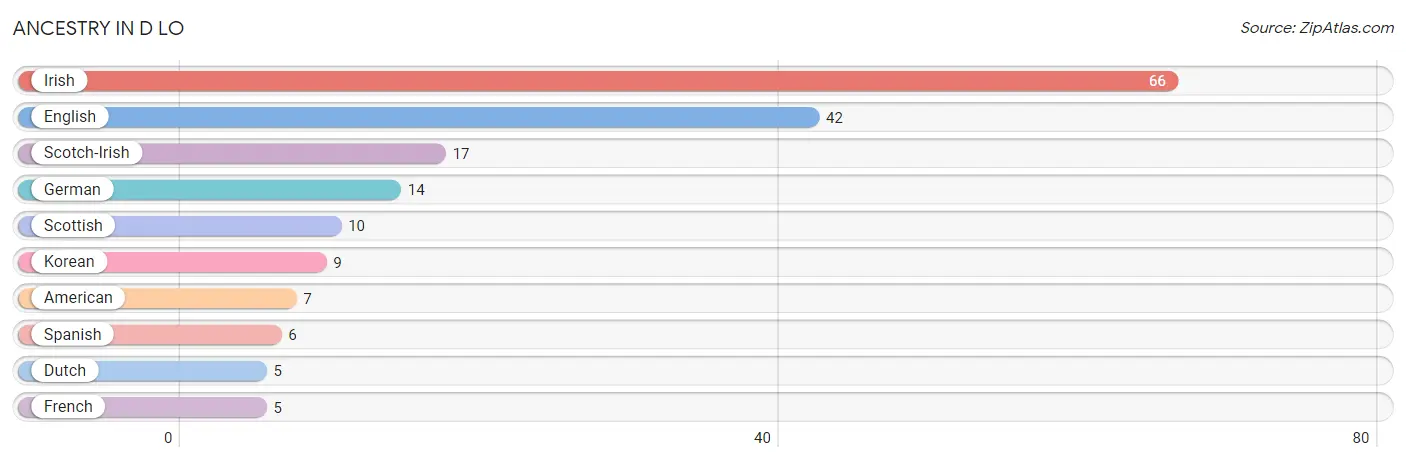
| Ancestry | # Population | % Population |
| American | 7 | 1.3% |
| Dutch | 5 | 0.9% |
| English | 42 | 7.8% |
| French | 5 | 0.9% |
| German | 14 | 2.6% |
| Irish | 66 | 12.2% |
| Korean | 9 | 1.7% |
| Scotch-Irish | 17 | 3.2% |
| Scottish | 10 | 1.8% |
| Spanish | 6 | 1.1% | View All 10 Rows |
Immigrants in D LO

| Immigration Origin | # Population | % Population | View All 0 Rows |
Sex and Age in D LO
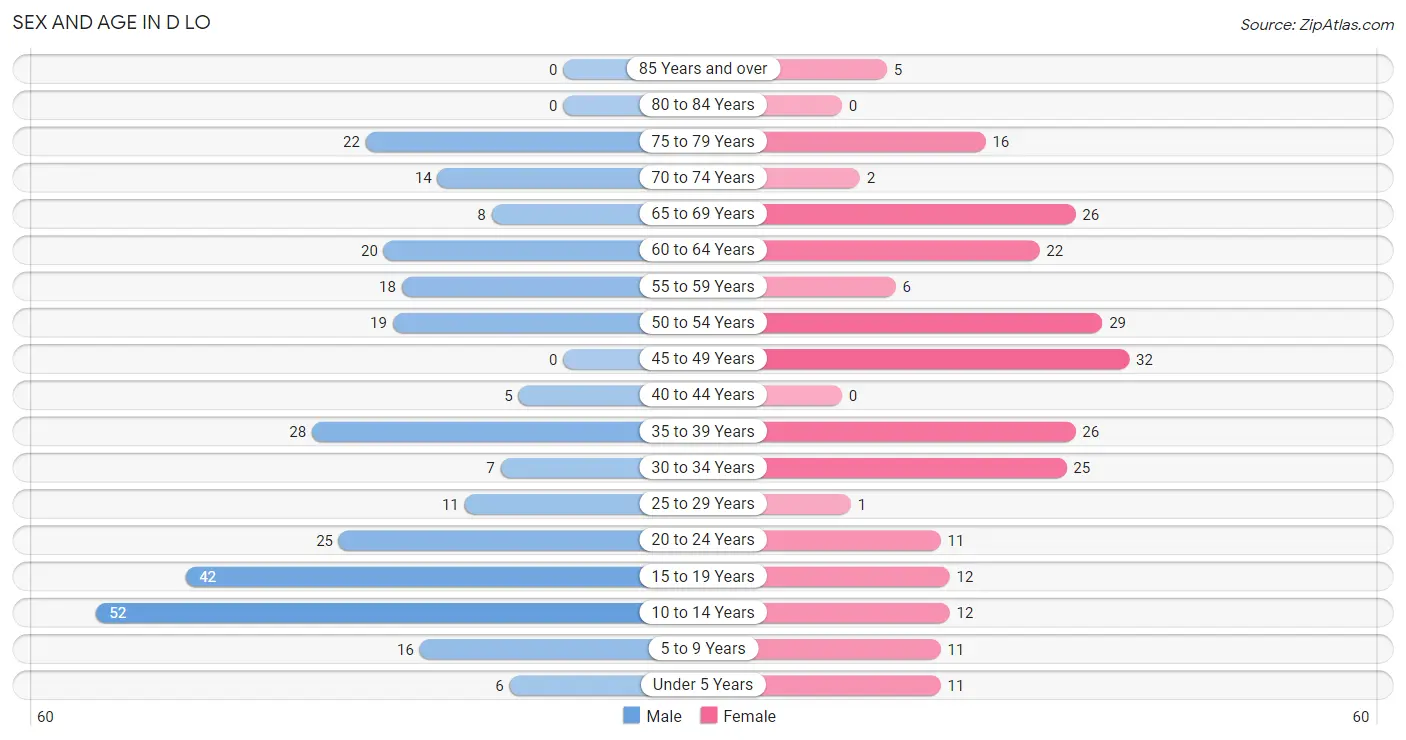
Sex and Age in D LO
The most populous age groups in D LO are 10 to 14 Years (52 | 17.7%) for men and 45 to 49 Years (32 | 13.0%) for women.
| Age Bracket | Male | Female |
| Under 5 Years | 6 (2.1%) | 11 (4.4%) |
| 5 to 9 Years | 16 (5.5%) | 11 (4.4%) |
| 10 to 14 Years | 52 (17.7%) | 12 (4.9%) |
| 15 to 19 Years | 42 (14.3%) | 12 (4.9%) |
| 20 to 24 Years | 25 (8.5%) | 11 (4.4%) |
| 25 to 29 Years | 11 (3.7%) | 1 (0.4%) |
| 30 to 34 Years | 7 (2.4%) | 25 (10.1%) |
| 35 to 39 Years | 28 (9.6%) | 26 (10.5%) |
| 40 to 44 Years | 5 (1.7%) | 0 (0.0%) |
| 45 to 49 Years | 0 (0.0%) | 32 (13.0%) |
| 50 to 54 Years | 19 (6.5%) | 29 (11.7%) |
| 55 to 59 Years | 18 (6.1%) | 6 (2.4%) |
| 60 to 64 Years | 20 (6.8%) | 22 (8.9%) |
| 65 to 69 Years | 8 (2.7%) | 26 (10.5%) |
| 70 to 74 Years | 14 (4.8%) | 2 (0.8%) |
| 75 to 79 Years | 22 (7.5%) | 16 (6.5%) |
| 80 to 84 Years | 0 (0.0%) | 0 (0.0%) |
| 85 Years and over | 0 (0.0%) | 5 (2.0%) |
| Total | 293 (100.0%) | 247 (100.0%) |
Families and Households in D LO
Median Family Size in D LO
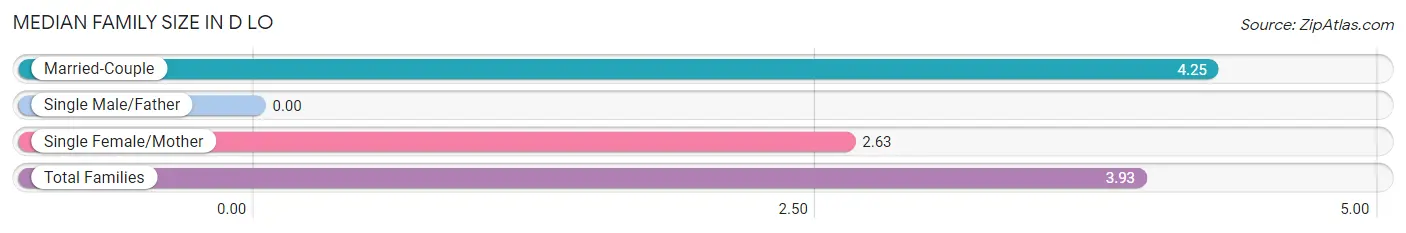
| Family Type | # Families | Family Size |
| Married-Couple | 96 (80.0%) | 4.25 |
| Single Male/Father | 0 (0.0%) | - |
| Single Female/Mother | 24 (20.0%) | 2.63 |
| Total Families | 120 (100.0%) | 3.93 |
Median Household Size in D LO
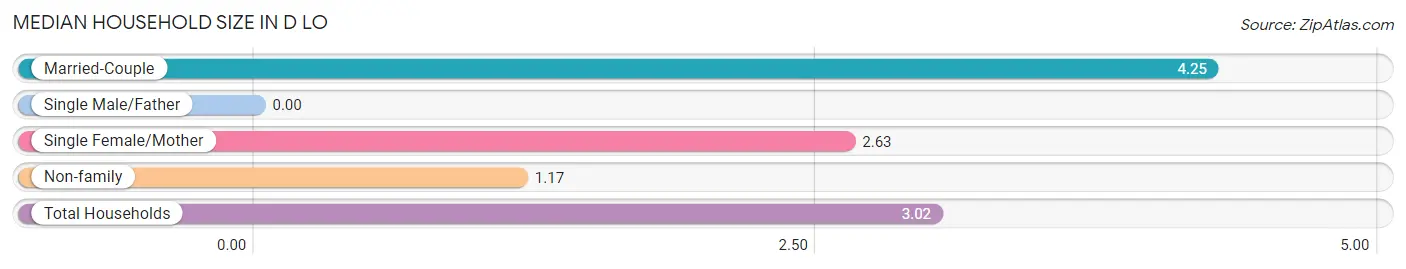
| Household Type | # Households | Household Size |
| Married-Couple | 96 (53.6%) | 4.25 |
| Single Male/Father | 0 (0.0%) | - |
| Single Female/Mother | 24 (13.4%) | 2.63 |
| Non-family | 59 (33.0%) | 1.17 |
| Total Households | 179 (100.0%) | 3.02 |
Household Size by Marriage Status in D LO
Out of a total of 179 households in D LO, 120 (67.0%) are family households, while 59 (33.0%) are nonfamily households. The most numerous type of family households are 2-person households, comprising 51, and the most common type of nonfamily households are 1-person households, comprising 54.
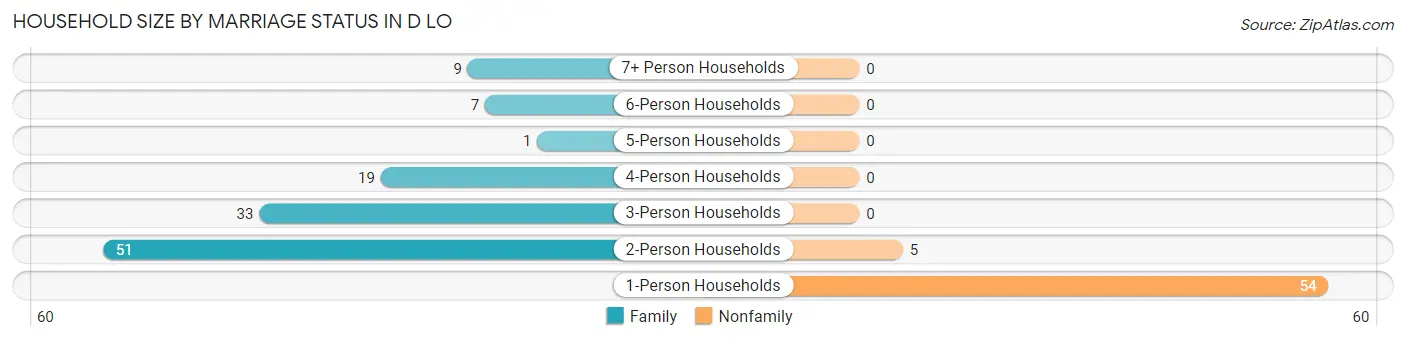
| Household Size | Family Households | Nonfamily Households |
| 1-Person Households | - | 54 (30.2%) |
| 2-Person Households | 51 (28.5%) | 5 (2.8%) |
| 3-Person Households | 33 (18.4%) | 0 (0.0%) |
| 4-Person Households | 19 (10.6%) | 0 (0.0%) |
| 5-Person Households | 1 (0.6%) | 0 (0.0%) |
| 6-Person Households | 7 (3.9%) | 0 (0.0%) |
| 7+ Person Households | 9 (5.0%) | 0 (0.0%) |
| Total | 120 (67.0%) | 59 (33.0%) |
Female Fertility in D LO
Fertility by Age in D LO
| Age Bracket | Women with Births | Births / 1,000 Women |
| 15 to 19 years | 0 (0.0%) | 0.0 |
| 20 to 34 years | 0 (0.0%) | 0.0 |
| 35 to 50 years | 0 (0.0%) | 0.0 |
| Total | 0 (0.0%) | 0.0 |
Fertility by Age by Marriage Status in D LO
| Age Bracket | Married | Unmarried |
| 15 to 19 years | 0 (0.0%) | 0 (0.0%) |
| 20 to 34 years | 0 (0.0%) | 0 (0.0%) |
| 35 to 50 years | 0 (0.0%) | 0 (0.0%) |
| Total | 0 (0.0%) | 0 (0.0%) |
Fertility by Education in D LO
| Educational Attainment | Women with Births | Births / 1,000 Women |
| Less than High School | 0 (0.0%) | 0.0 |
| High School Diploma | 0 (0.0%) | 0.0 |
| College or Associate's Degree | 0 (0.0%) | 0.0 |
| Bachelor's Degree | 0 (0.0%) | 0.0 |
| Graduate Degree | 0 (0.0%) | 0.0 |
| Total | 0 (0.0%) | 0.0 |
Fertility by Education by Marriage Status in D LO
| Educational Attainment | Married | Unmarried |
| Less than High School | 0 (0.0%) | 0 (0.0%) |
| High School Diploma | 0 (0.0%) | 0 (0.0%) |
| College or Associate's Degree | 0 (0.0%) | 0 (0.0%) |
| Bachelor's Degree | 0 (0.0%) | 0 (0.0%) |
| Graduate Degree | 0 (0.0%) | 0 (0.0%) |
| Total | 0 (0.0%) | 0 (0.0%) |
Employment Characteristics in D LO
Employment by Class of Employer in D LO
Among the 162 employed individuals in D LO, private company employees (126 | 77.8%), not-for-profit organizations (20 | 12.3%), and self-employed (not incorporated) (9 | 5.6%) make up the most common classes of employment.
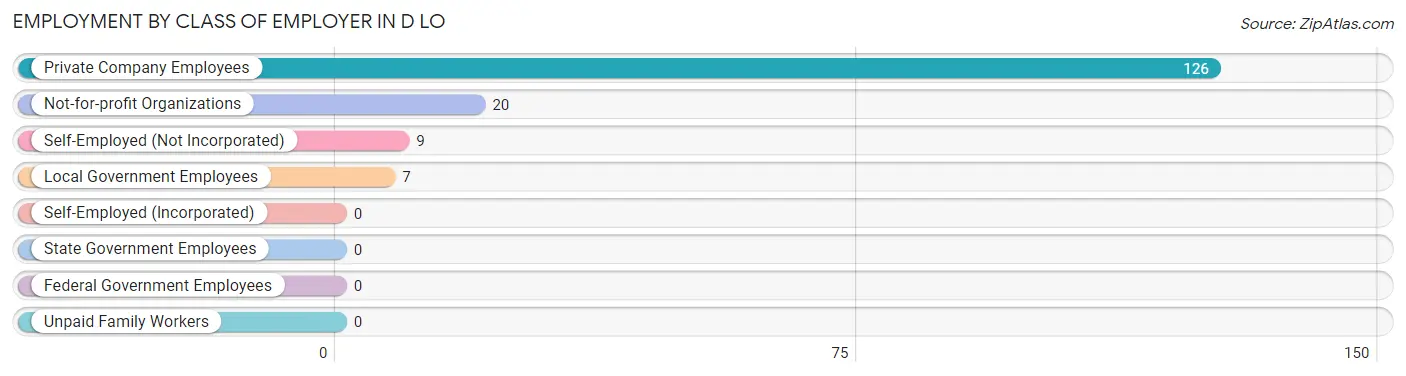
| Employer Class | # Employees | % Employees |
| Private Company Employees | 126 | 77.8% |
| Self-Employed (Incorporated) | 0 | 0.0% |
| Self-Employed (Not Incorporated) | 9 | 5.6% |
| Not-for-profit Organizations | 20 | 12.3% |
| Local Government Employees | 7 | 4.3% |
| State Government Employees | 0 | 0.0% |
| Federal Government Employees | 0 | 0.0% |
| Unpaid Family Workers | 0 | 0.0% |
| Total | 162 | 100.0% |
Employment Status by Age in D LO
According to the labor force statistics for D LO, out of the total population over 16 years of age (420), 48.3% or 203 individuals are in the labor force, with 17.2% or 35 of them unemployed. The age group with the highest labor force participation rate is 25 to 29 years, with 91.7% or 11 individuals in the labor force. Within the labor force, the 20 to 24 years age range has the highest percentage of unemployed individuals, with 56.0% or 14 of them being unemployed.
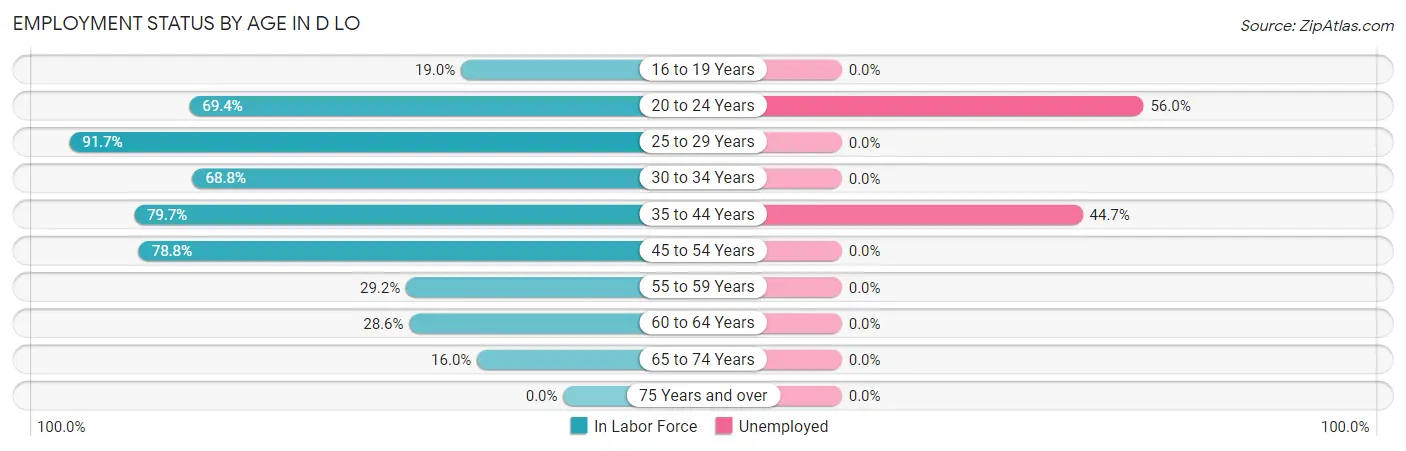
| Age Bracket | In Labor Force | Unemployed |
| 16 to 19 Years | 8 (19.0%) | 0 (0.0%) |
| 20 to 24 Years | 25 (69.4%) | 14 (56.0%) |
| 25 to 29 Years | 11 (91.7%) | 0 (0.0%) |
| 30 to 34 Years | 22 (68.8%) | 0 (0.0%) |
| 35 to 44 Years | 47 (79.7%) | 21 (44.7%) |
| 45 to 54 Years | 63 (78.8%) | 0 (0.0%) |
| 55 to 59 Years | 7 (29.2%) | 0 (0.0%) |
| 60 to 64 Years | 12 (28.6%) | 0 (0.0%) |
| 65 to 74 Years | 8 (16.0%) | 0 (0.0%) |
| 75 Years and over | 0 (0.0%) | 0 (0.0%) |
| Total | 203 (48.3%) | 35 (17.2%) |
Employment Status by Educational Attainment in D LO
According to labor force statistics for D LO, 65.1% of individuals (162) out of the total population between 25 and 64 years of age (249) are in the labor force, with 13.0% or 21 of them being unemployed. The group with the highest labor force participation rate are those with the educational attainment of college / associate degree, with 82.3% or 93 individuals in the labor force. Within the labor force, individuals with college / associate degree education have the highest percentage of unemployment, with 22.6% or 21 of them being unemployed.
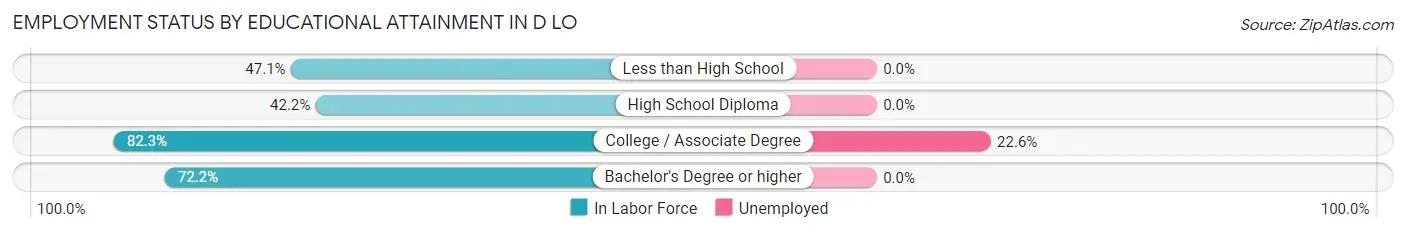
| Educational Attainment | In Labor Force | Unemployed |
| Less than High School | 8 (47.1%) | 0 (0.0%) |
| High School Diploma | 35 (42.2%) | 0 (0.0%) |
| College / Associate Degree | 93 (82.3%) | 26 (22.6%) |
| Bachelor's Degree or higher | 26 (72.2%) | 0 (0.0%) |
| Total | 162 (65.1%) | 32 (13.0%) |
Employment Occupations by Sex in D LO
Management, Business, Science and Arts Occupations
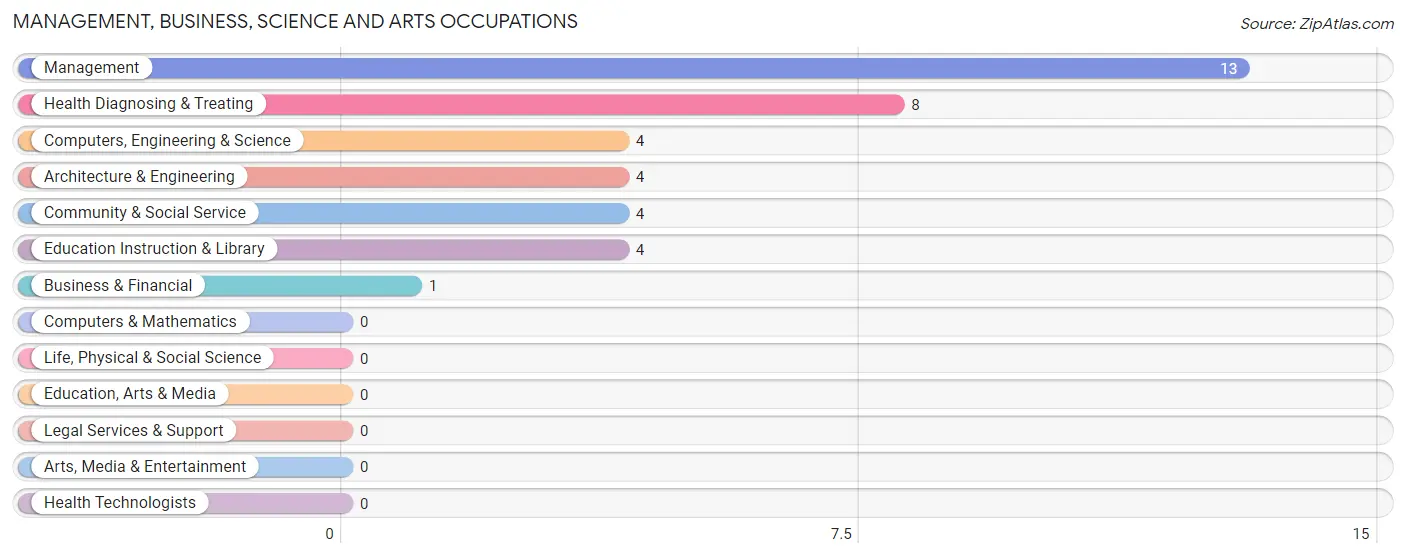
The most common Management, Business, Science and Arts occupations in D LO are Management (13 | 7.7%), Health Diagnosing & Treating (8 | 4.8%), Computers, Engineering & Science (4 | 2.4%), Architecture & Engineering (4 | 2.4%), and Community & Social Service (4 | 2.4%).
Management, Business, Science and Arts Occupations by Sex
Within the Management, Business, Science and Arts occupations in D LO, the most male-oriented occupations are Business & Financial (100.0%), and Management (84.6%), while the most female-oriented occupations are Computers, Engineering & Science (100.0%), Architecture & Engineering (100.0%), and Community & Social Service (100.0%).
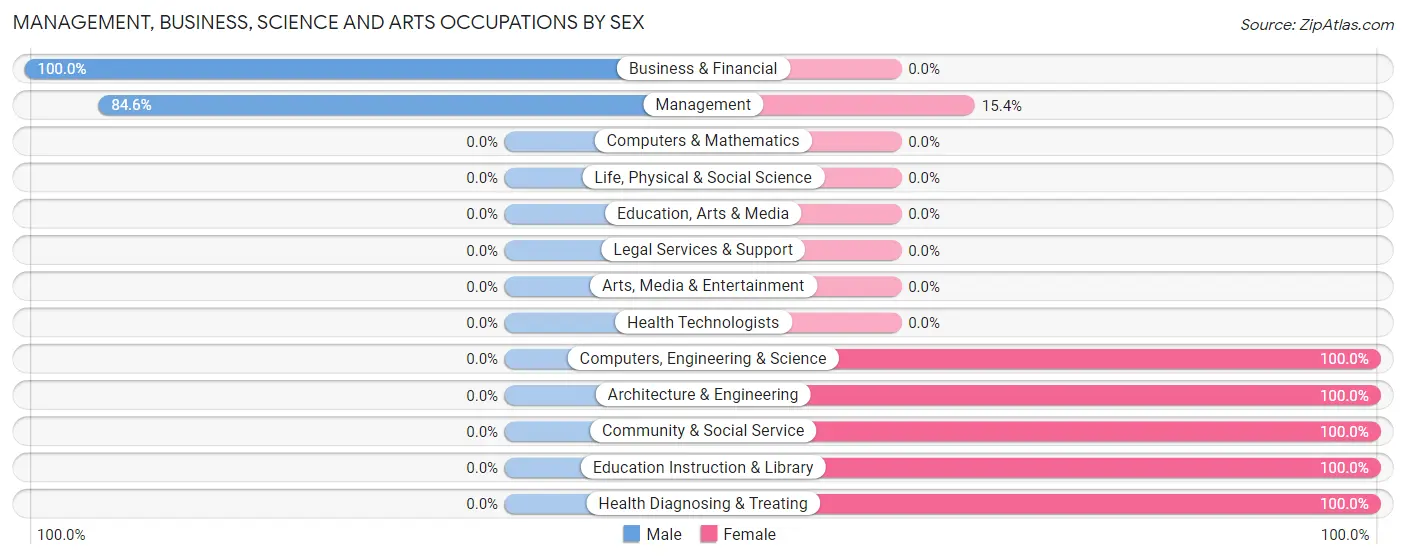
| Occupation | Male | Female |
| Management | 11 (84.6%) | 2 (15.4%) |
| Business & Financial | 1 (100.0%) | 0 (0.0%) |
| Computers, Engineering & Science | 0 (0.0%) | 4 (100.0%) |
| Computers & Mathematics | 0 (0.0%) | 0 (0.0%) |
| Architecture & Engineering | 0 (0.0%) | 4 (100.0%) |
| Life, Physical & Social Science | 0 (0.0%) | 0 (0.0%) |
| Community & Social Service | 0 (0.0%) | 4 (100.0%) |
| Education, Arts & Media | 0 (0.0%) | 0 (0.0%) |
| Legal Services & Support | 0 (0.0%) | 0 (0.0%) |
| Education Instruction & Library | 0 (0.0%) | 4 (100.0%) |
| Arts, Media & Entertainment | 0 (0.0%) | 0 (0.0%) |
| Health Diagnosing & Treating | 0 (0.0%) | 8 (100.0%) |
| Health Technologists | 0 (0.0%) | 0 (0.0%) |
| Total (Category) | 12 (40.0%) | 18 (60.0%) |
| Total (Overall) | 79 (47.0%) | 89 (53.0%) |
Services Occupations
The most common Services occupations in D LO are Healthcare Support (25 | 14.9%), and Personal Care & Service (17 | 10.1%).
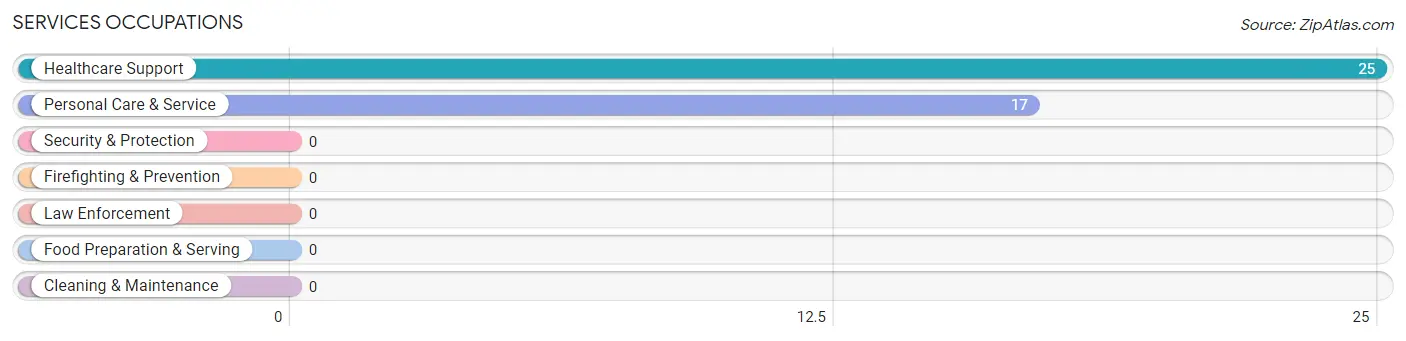
Services Occupations by Sex
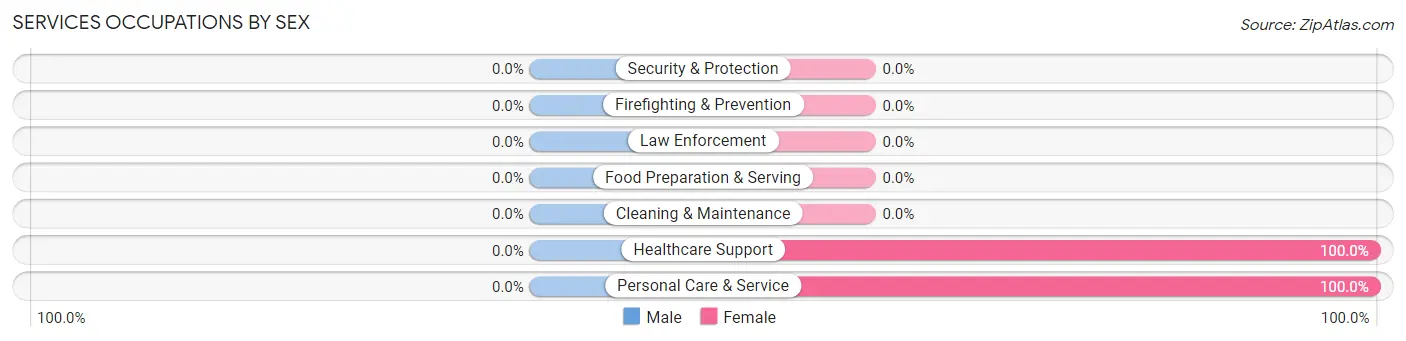
| Occupation | Male | Female |
| Healthcare Support | 0 (0.0%) | 25 (100.0%) |
| Security & Protection | 0 (0.0%) | 0 (0.0%) |
| Firefighting & Prevention | 0 (0.0%) | 0 (0.0%) |
| Law Enforcement | 0 (0.0%) | 0 (0.0%) |
| Food Preparation & Serving | 0 (0.0%) | 0 (0.0%) |
| Cleaning & Maintenance | 0 (0.0%) | 0 (0.0%) |
| Personal Care & Service | 0 (0.0%) | 17 (100.0%) |
| Total (Category) | 0 (0.0%) | 42 (100.0%) |
| Total (Overall) | 79 (47.0%) | 89 (53.0%) |
Sales and Office Occupations
The most common Sales and Office occupations in D LO are Office & Administration (25 | 14.9%), and Sales & Related (7 | 4.2%).
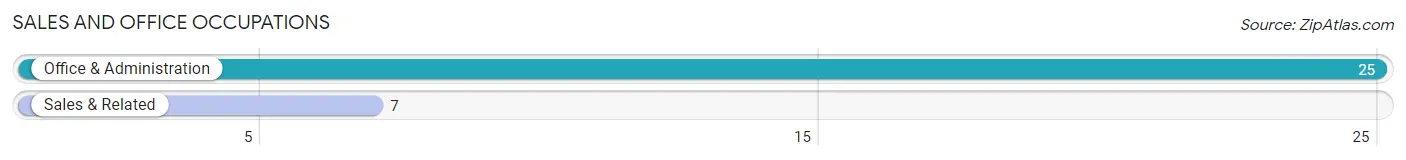
Sales and Office Occupations by Sex
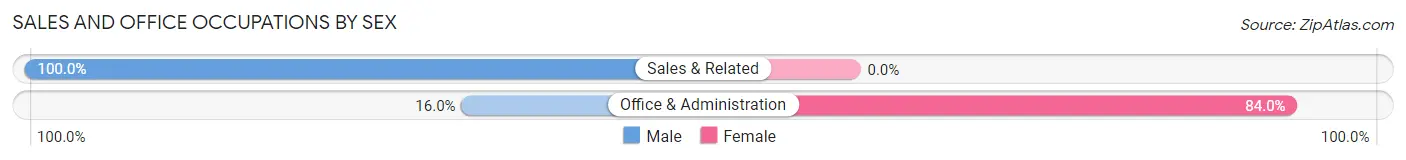
| Occupation | Male | Female |
| Sales & Related | 7 (100.0%) | 0 (0.0%) |
| Office & Administration | 4 (16.0%) | 21 (84.0%) |
| Total (Category) | 11 (34.4%) | 21 (65.6%) |
| Total (Overall) | 79 (47.0%) | 89 (53.0%) |
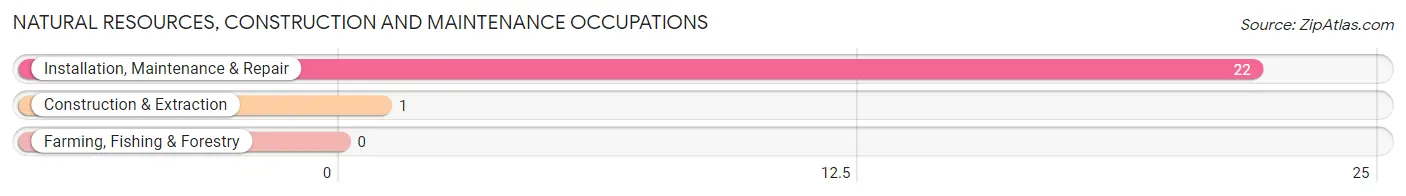
Natural Resources, Construction and Maintenance Occupations
The most common Natural Resources, Construction and Maintenance occupations in D LO are Installation, Maintenance & Repair (22 | 13.1%), and Construction & Extraction (1 | 0.6%).
Natural Resources, Construction and Maintenance Occupations by Sex
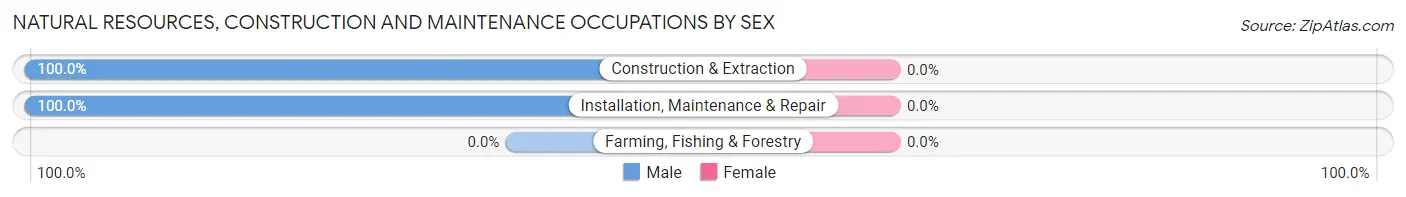
| Occupation | Male | Female |
| Farming, Fishing & Forestry | 0 (0.0%) | 0 (0.0%) |
| Construction & Extraction | 1 (100.0%) | 0 (0.0%) |
| Installation, Maintenance & Repair | 22 (100.0%) | 0 (0.0%) |
| Total (Category) | 23 (100.0%) | 0 (0.0%) |
| Total (Overall) | 79 (47.0%) | 89 (53.0%) |
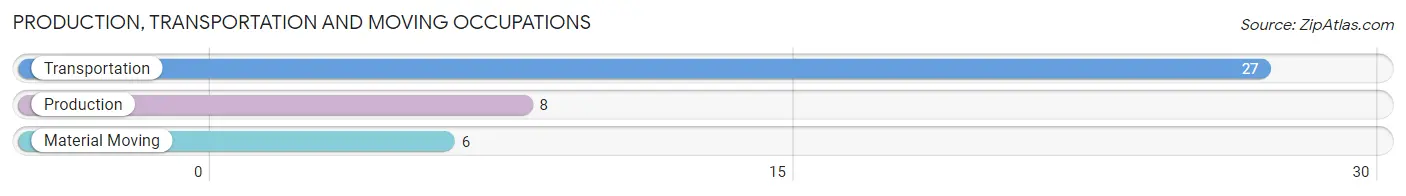
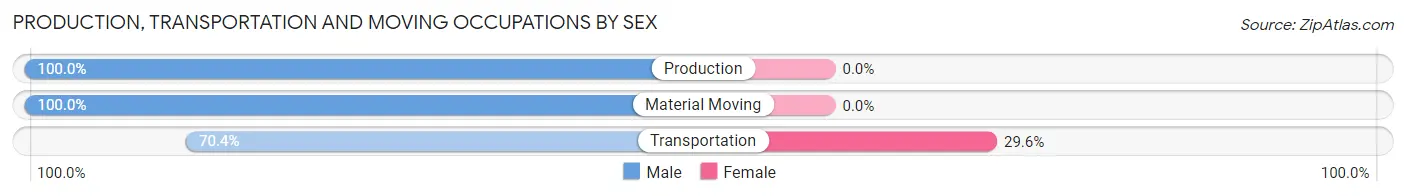
Production, Transportation and Moving Occupations
The most common Production, Transportation and Moving occupations in D LO are Transportation (27 | 16.1%), Production (8 | 4.8%), and Material Moving (6 | 3.6%).
Production, Transportation and Moving Occupations by Sex
| Occupation | Male | Female |
| Production | 8 (100.0%) | 0 (0.0%) |
| Transportation | 19 (70.4%) | 8 (29.6%) |
| Material Moving | 6 (100.0%) | 0 (0.0%) |
| Total (Category) | 33 (80.5%) | 8 (19.5%) |
| Total (Overall) | 79 (47.0%) | 89 (53.0%) |
Employment Industries by Sex in D LO
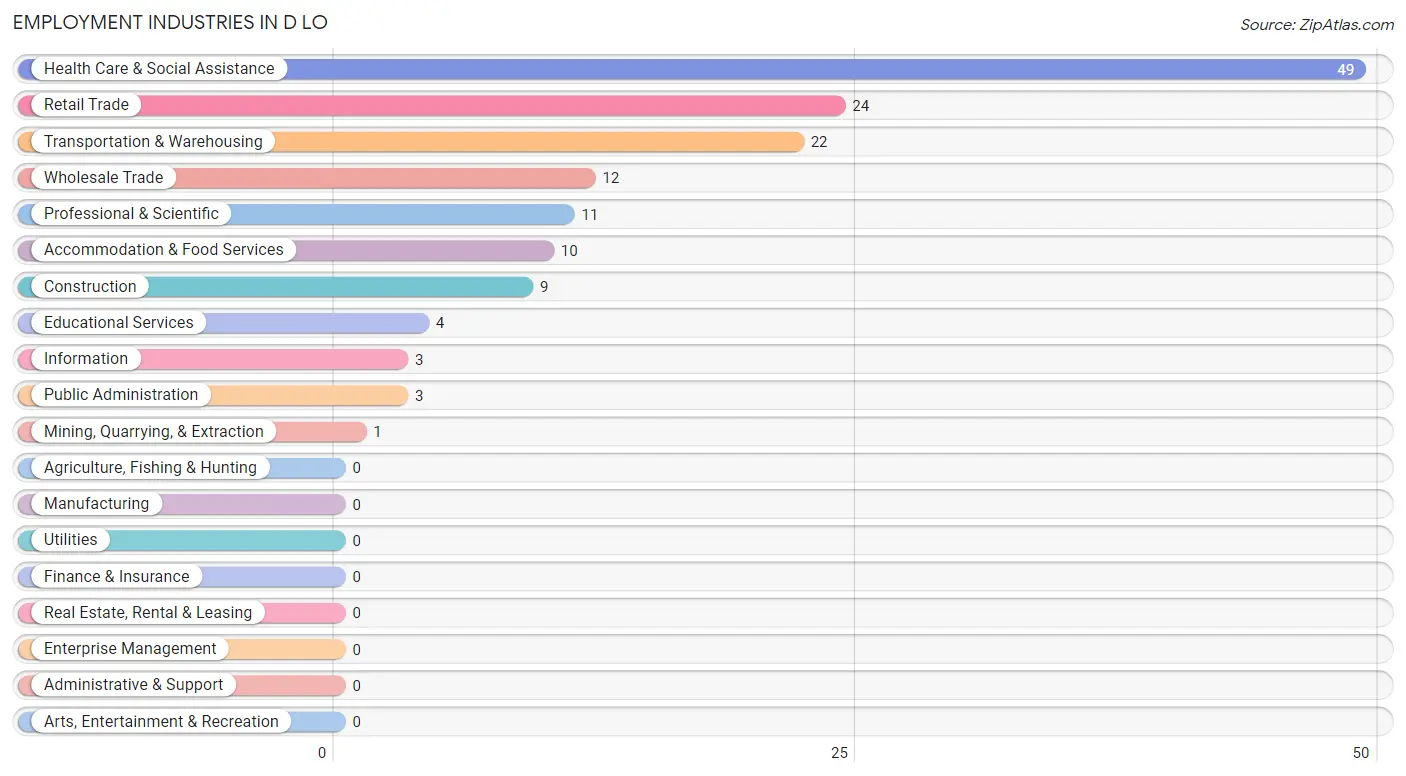
Employment Industries in D LO
The major employment industries in D LO include Health Care & Social Assistance (49 | 29.2%), Retail Trade (24 | 14.3%), Transportation & Warehousing (22 | 13.1%), Wholesale Trade (12 | 7.1%), and Professional & Scientific (11 | 6.6%).
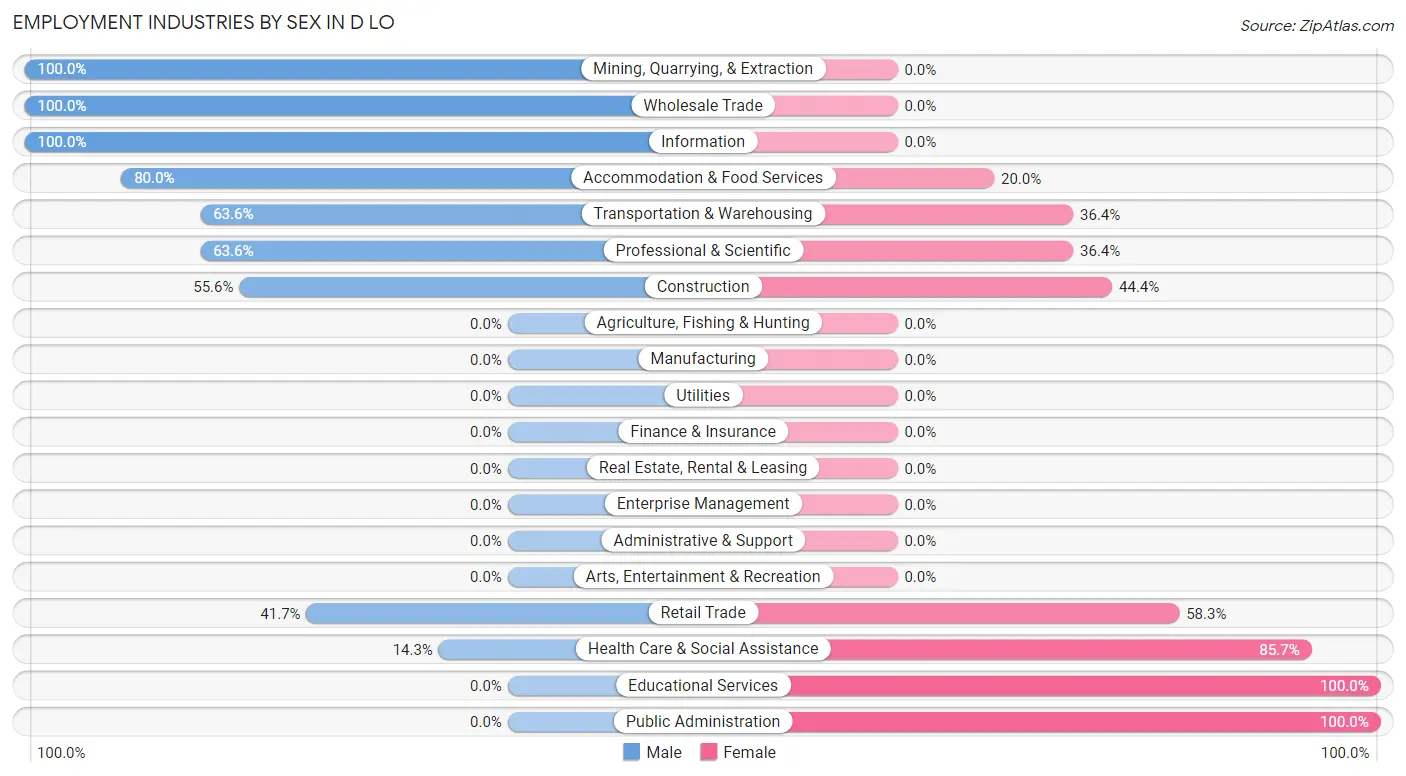
Employment Industries by Sex in D LO
The D LO industries that see more men than women are Mining, Quarrying, & Extraction (100.0%), Wholesale Trade (100.0%), and Information (100.0%), whereas the industries that tend to have a higher number of women are Educational Services (100.0%), Public Administration (100.0%), and Health Care & Social Assistance (85.7%).
| Industry | Male | Female |
| Agriculture, Fishing & Hunting | 0 (0.0%) | 0 (0.0%) |
| Mining, Quarrying, & Extraction | 1 (100.0%) | 0 (0.0%) |
| Construction | 5 (55.6%) | 4 (44.4%) |
| Manufacturing | 0 (0.0%) | 0 (0.0%) |
| Wholesale Trade | 12 (100.0%) | 0 (0.0%) |
| Retail Trade | 10 (41.7%) | 14 (58.3%) |
| Transportation & Warehousing | 14 (63.6%) | 8 (36.4%) |
| Utilities | 0 (0.0%) | 0 (0.0%) |
| Information | 3 (100.0%) | 0 (0.0%) |
| Finance & Insurance | 0 (0.0%) | 0 (0.0%) |
| Real Estate, Rental & Leasing | 0 (0.0%) | 0 (0.0%) |
| Professional & Scientific | 7 (63.6%) | 4 (36.4%) |
| Enterprise Management | 0 (0.0%) | 0 (0.0%) |
| Administrative & Support | 0 (0.0%) | 0 (0.0%) |
| Educational Services | 0 (0.0%) | 4 (100.0%) |
| Health Care & Social Assistance | 7 (14.3%) | 42 (85.7%) |
| Arts, Entertainment & Recreation | 0 (0.0%) | 0 (0.0%) |
| Accommodation & Food Services | 8 (80.0%) | 2 (20.0%) |
| Public Administration | 0 (0.0%) | 3 (100.0%) |
| Total | 79 (47.0%) | 89 (53.0%) |
Education in D LO
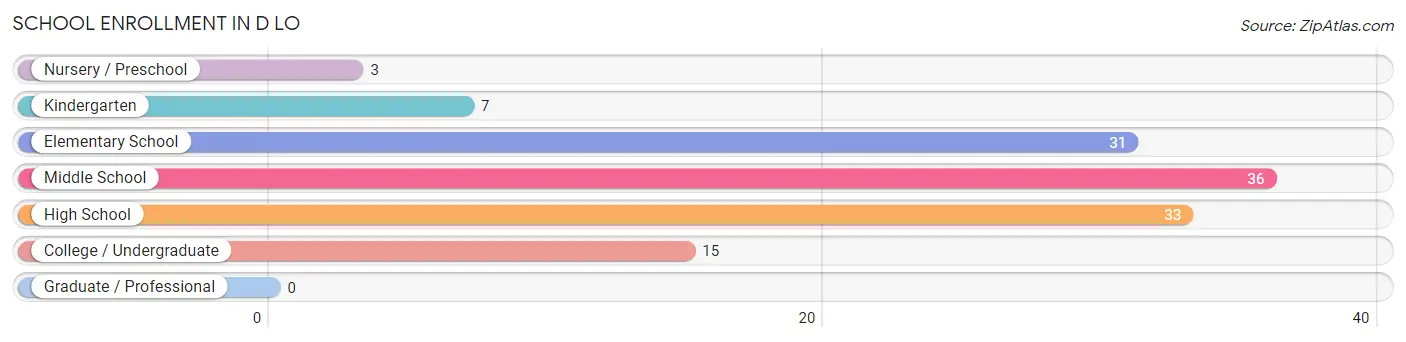
School Enrollment in D LO
The most common levels of schooling among the 125 students in D LO are middle school (36 | 28.8%), high school (33 | 26.4%), and elementary school (31 | 24.8%).
| School Level | # Students | % Students |
| Nursery / Preschool | 3 | 2.4% |
| Kindergarten | 7 | 5.6% |
| Elementary School | 31 | 24.8% |
| Middle School | 36 | 28.8% |
| High School | 33 | 26.4% |
| College / Undergraduate | 15 | 12.0% |
| Graduate / Professional | 0 | 0.0% |
| Total | 125 | 100.0% |
School Enrollment by Age by Funding Source in D LO
Out of a total of 125 students who are enrolled in schools in D LO, 5 (4.0%) attend a private institution, while the remaining 120 (96.0%) are enrolled in public schools. The age group of 15 to 17 year olds has the highest likelihood of being enrolled in private schools, with 5 (15.1% in the age bracket) enrolled. Conversely, the age group of 3 to 4 year olds has the lowest likelihood of being enrolled in a private school, with 3 (100.0% in the age bracket) attending a public institution.
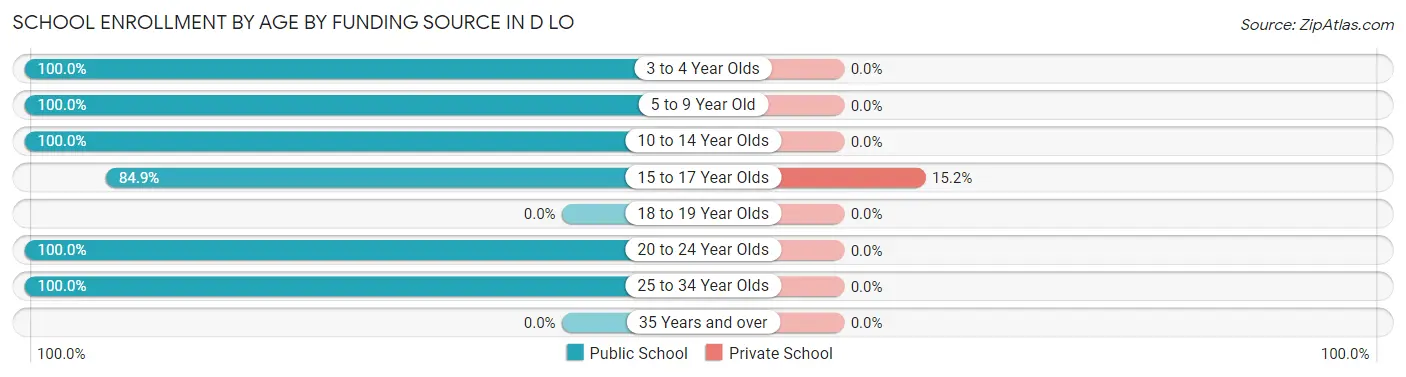
| Age Bracket | Public School | Private School |
| 3 to 4 Year Olds | 3 (100.0%) | 0 (0.0%) |
| 5 to 9 Year Old | 15 (100.0%) | 0 (0.0%) |
| 10 to 14 Year Olds | 59 (100.0%) | 0 (0.0%) |
| 15 to 17 Year Olds | 28 (84.9%) | 5 (15.1%) |
| 18 to 19 Year Olds | 0 (0.0%) | 0 (0.0%) |
| 20 to 24 Year Olds | 7 (100.0%) | 0 (0.0%) |
| 25 to 34 Year Olds | 8 (100.0%) | 0 (0.0%) |
| 35 Years and over | 0 (0.0%) | 0 (0.0%) |
| Total | 120 (96.0%) | 5 (4.0%) |
Educational Attainment by Field of Study in D LO
Liberal arts & history (10 | 22.7%), science & technology (8 | 18.2%), physical & health sciences (7 | 15.9%), engineering (7 | 15.9%), and computers & mathematics (4 | 9.1%) are the most common fields of study among 44 individuals in D LO who have obtained a bachelor's degree or higher.
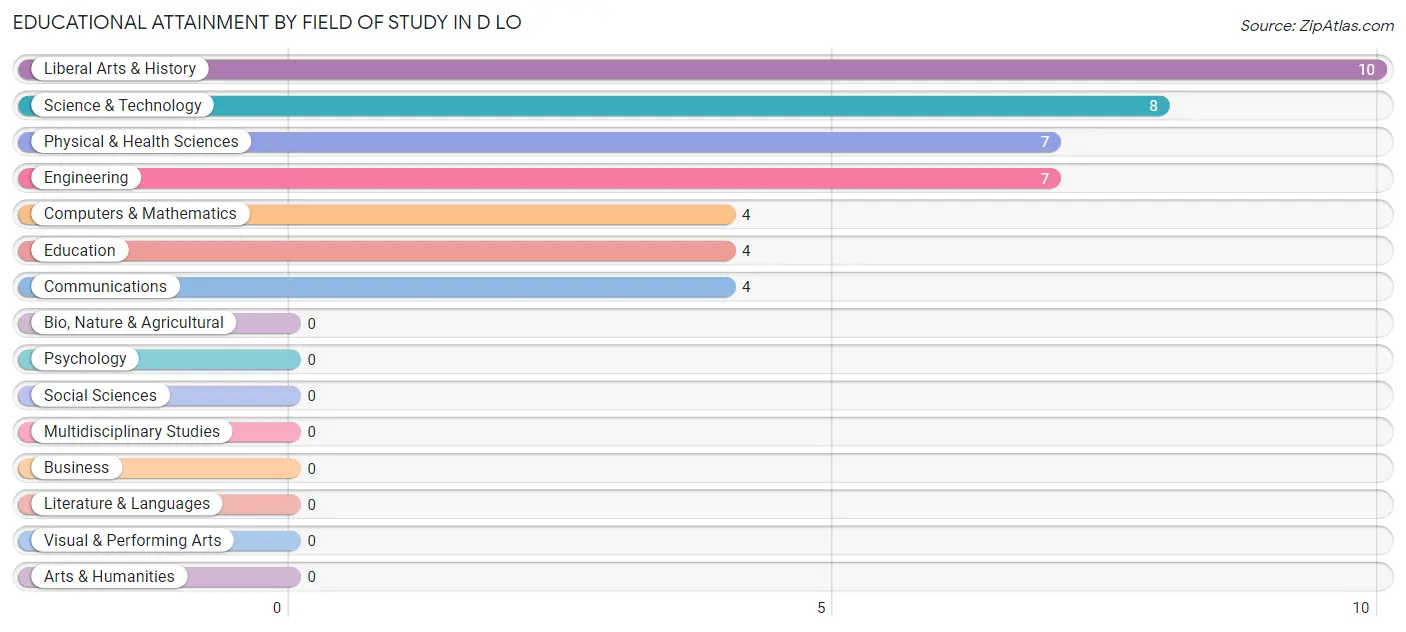
| Field of Study | # Graduates | % Graduates |
| Computers & Mathematics | 4 | 9.1% |
| Bio, Nature & Agricultural | 0 | 0.0% |
| Physical & Health Sciences | 7 | 15.9% |
| Psychology | 0 | 0.0% |
| Social Sciences | 0 | 0.0% |
| Engineering | 7 | 15.9% |
| Multidisciplinary Studies | 0 | 0.0% |
| Science & Technology | 8 | 18.2% |
| Business | 0 | 0.0% |
| Education | 4 | 9.1% |
| Literature & Languages | 0 | 0.0% |
| Liberal Arts & History | 10 | 22.7% |
| Visual & Performing Arts | 0 | 0.0% |
| Communications | 4 | 9.1% |
| Arts & Humanities | 0 | 0.0% |
| Total | 44 | 100.0% |
Transportation & Commute in D LO
Vehicle Availability by Sex in D LO
The most prevalent vehicle ownership categories in D LO are males with 3 vehicles (26, accounting for 35.6%) and females with 3 vehicles (32, making up 29.2%).
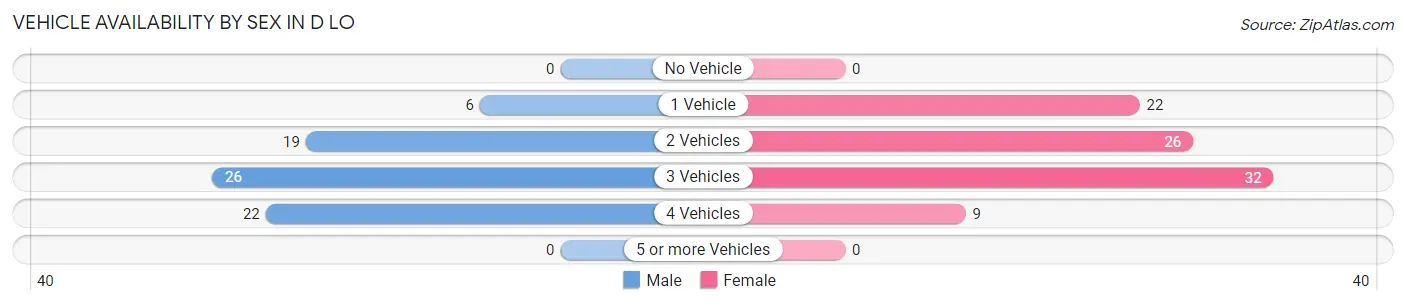
| Vehicles Available | Male | Female |
| No Vehicle | 0 (0.0%) | 0 (0.0%) |
| 1 Vehicle | 6 (8.2%) | 22 (24.7%) |
| 2 Vehicles | 19 (26.0%) | 26 (29.2%) |
| 3 Vehicles | 26 (35.6%) | 32 (36.0%) |
| 4 Vehicles | 22 (30.1%) | 9 (10.1%) |
| 5 or more Vehicles | 0 (0.0%) | 0 (0.0%) |
| Total | 73 (100.0%) | 89 (100.0%) |
Commute Time in D LO
The most frequently occuring commute durations in D LO are 30 to 34 minutes (47 commuters, 29.0%), 60 to 89 minutes (23 commuters, 14.2%), and 45 to 59 minutes (22 commuters, 13.6%).
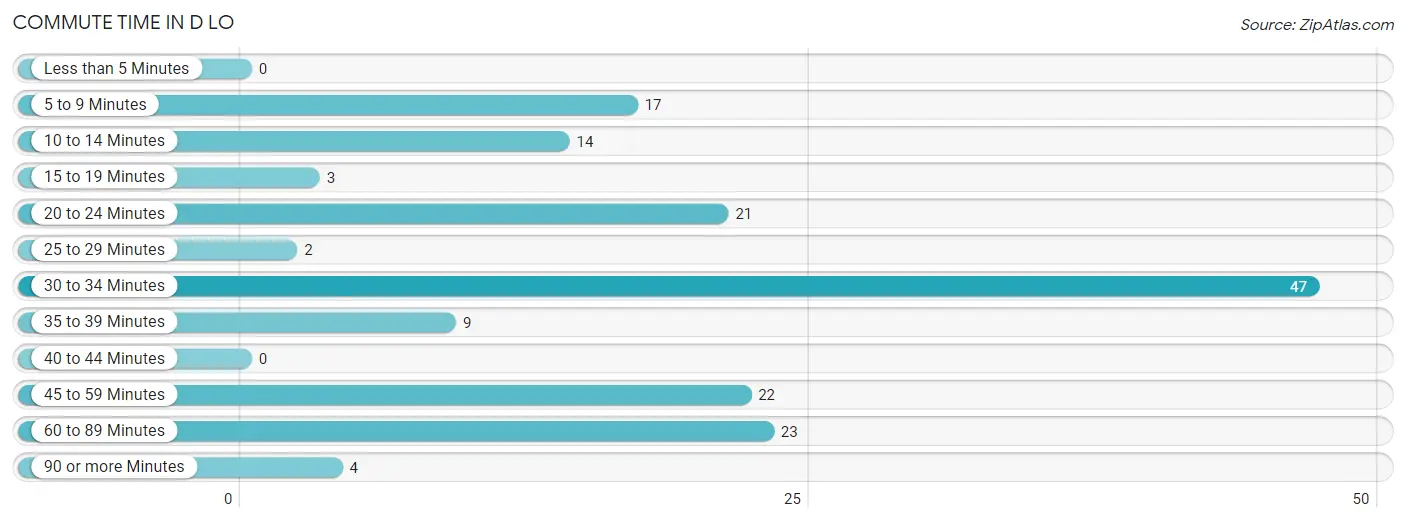
| Commute Time | # Commuters | % Commuters |
| Less than 5 Minutes | 0 | 0.0% |
| 5 to 9 Minutes | 17 | 10.5% |
| 10 to 14 Minutes | 14 | 8.6% |
| 15 to 19 Minutes | 3 | 1.8% |
| 20 to 24 Minutes | 21 | 13.0% |
| 25 to 29 Minutes | 2 | 1.2% |
| 30 to 34 Minutes | 47 | 29.0% |
| 35 to 39 Minutes | 9 | 5.6% |
| 40 to 44 Minutes | 0 | 0.0% |
| 45 to 59 Minutes | 22 | 13.6% |
| 60 to 89 Minutes | 23 | 14.2% |
| 90 or more Minutes | 4 | 2.5% |
Commute Time by Sex in D LO
The most common commute times in D LO are 30 to 34 minutes (38 commuters, 52.0%) for males and 20 to 24 minutes (21 commuters, 23.6%) for females.
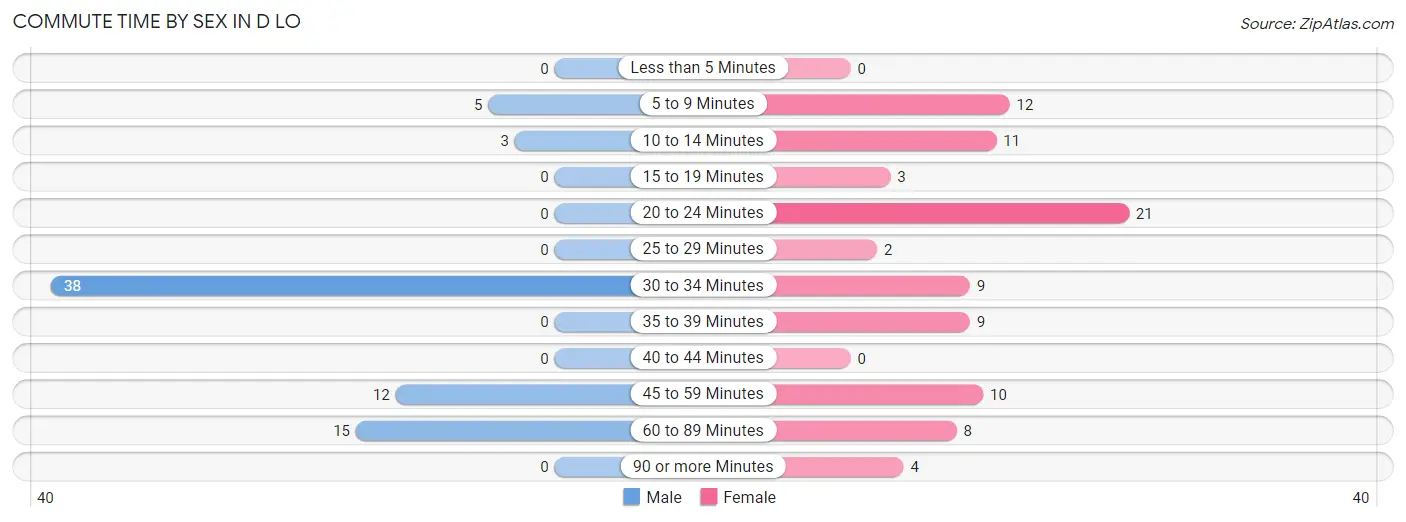
| Commute Time | Male | Female |
| Less than 5 Minutes | 0 (0.0%) | 0 (0.0%) |
| 5 to 9 Minutes | 5 (6.9%) | 12 (13.5%) |
| 10 to 14 Minutes | 3 (4.1%) | 11 (12.4%) |
| 15 to 19 Minutes | 0 (0.0%) | 3 (3.4%) |
| 20 to 24 Minutes | 0 (0.0%) | 21 (23.6%) |
| 25 to 29 Minutes | 0 (0.0%) | 2 (2.2%) |
| 30 to 34 Minutes | 38 (52.0%) | 9 (10.1%) |
| 35 to 39 Minutes | 0 (0.0%) | 9 (10.1%) |
| 40 to 44 Minutes | 0 (0.0%) | 0 (0.0%) |
| 45 to 59 Minutes | 12 (16.4%) | 10 (11.2%) |
| 60 to 89 Minutes | 15 (20.5%) | 8 (9.0%) |
| 90 or more Minutes | 0 (0.0%) | 4 (4.5%) |
Time of Departure to Work by Sex in D LO
The most frequent times of departure to work in D LO are 7:30 AM to 7:59 AM (16, 21.9%) for males and 6:30 AM to 6:59 AM (26, 29.2%) for females.
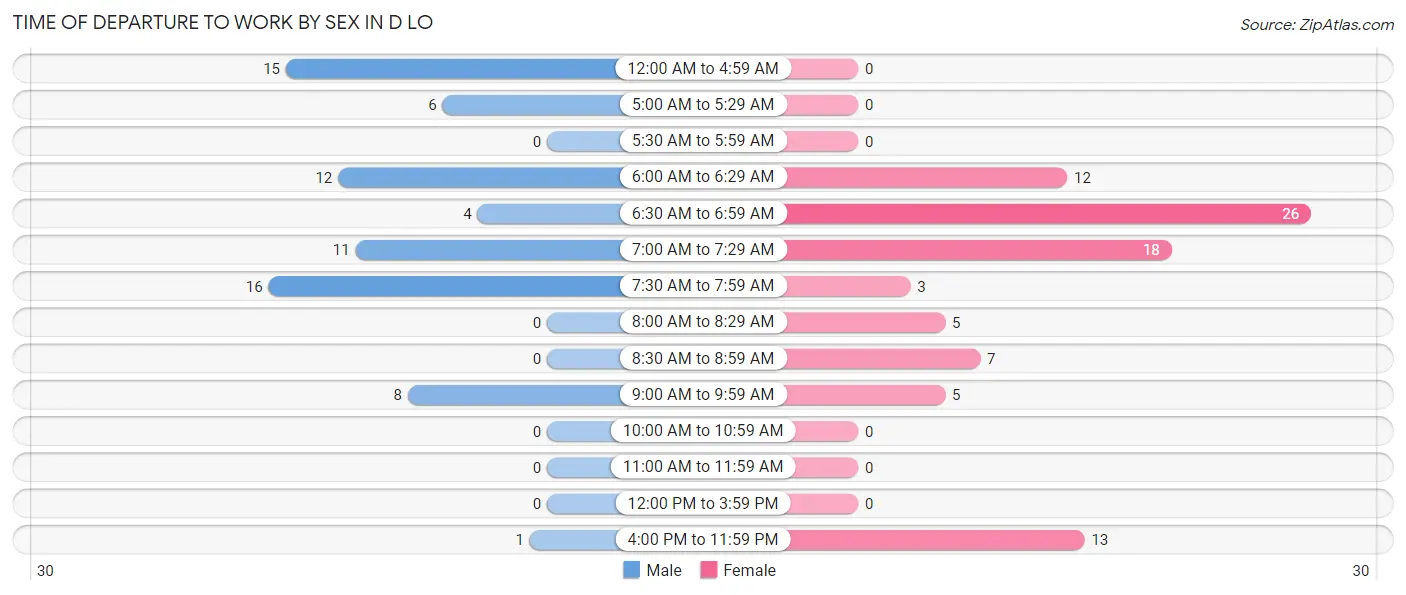
| Time of Departure | Male | Female |
| 12:00 AM to 4:59 AM | 15 (20.5%) | 0 (0.0%) |
| 5:00 AM to 5:29 AM | 6 (8.2%) | 0 (0.0%) |
| 5:30 AM to 5:59 AM | 0 (0.0%) | 0 (0.0%) |
| 6:00 AM to 6:29 AM | 12 (16.4%) | 12 (13.5%) |
| 6:30 AM to 6:59 AM | 4 (5.5%) | 26 (29.2%) |
| 7:00 AM to 7:29 AM | 11 (15.1%) | 18 (20.2%) |
| 7:30 AM to 7:59 AM | 16 (21.9%) | 3 (3.4%) |
| 8:00 AM to 8:29 AM | 0 (0.0%) | 5 (5.6%) |
| 8:30 AM to 8:59 AM | 0 (0.0%) | 7 (7.9%) |
| 9:00 AM to 9:59 AM | 8 (11.0%) | 5 (5.6%) |
| 10:00 AM to 10:59 AM | 0 (0.0%) | 0 (0.0%) |
| 11:00 AM to 11:59 AM | 0 (0.0%) | 0 (0.0%) |
| 12:00 PM to 3:59 PM | 0 (0.0%) | 0 (0.0%) |
| 4:00 PM to 11:59 PM | 1 (1.4%) | 13 (14.6%) |
| Total | 73 (100.0%) | 89 (100.0%) |
Housing Occupancy in D LO
Occupancy by Ownership in D LO
Of the total 179 dwellings in D LO, owner-occupied units account for 139 (77.6%), while renter-occupied units make up 40 (22.4%).
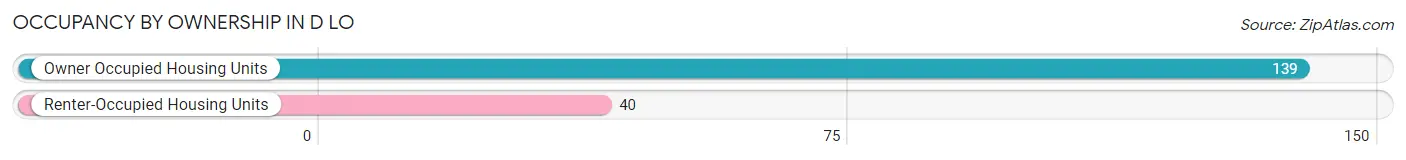
| Occupancy | # Housing Units | % Housing Units |
| Owner Occupied Housing Units | 139 | 77.6% |
| Renter-Occupied Housing Units | 40 | 22.4% |
| Total Occupied Housing Units | 179 | 100.0% |
Occupancy by Household Size in D LO
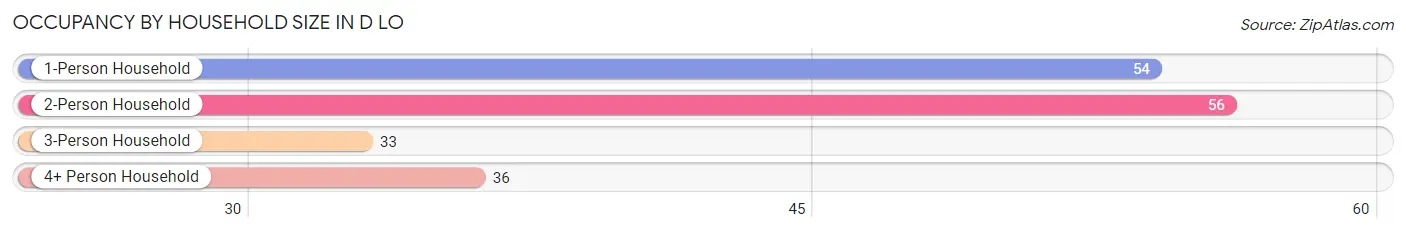
| Household Size | # Housing Units | % Housing Units |
| 1-Person Household | 54 | 30.2% |
| 2-Person Household | 56 | 31.3% |
| 3-Person Household | 33 | 18.4% |
| 4+ Person Household | 36 | 20.1% |
| Total Housing Units | 179 | 100.0% |
Occupancy by Ownership by Household Size in D LO
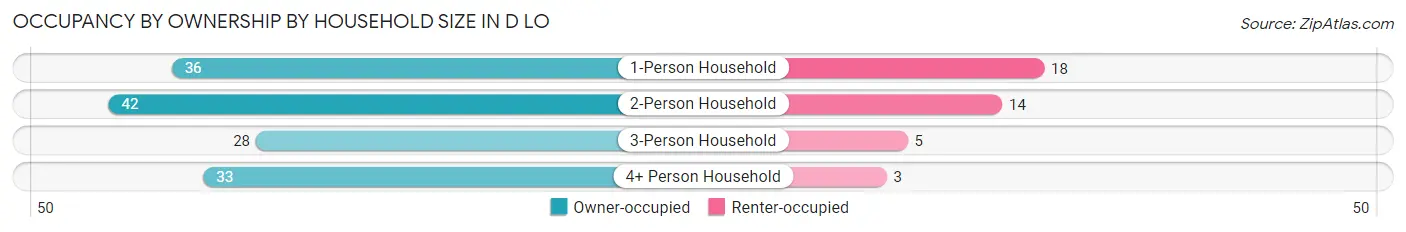
| Household Size | Owner-occupied | Renter-occupied |
| 1-Person Household | 36 (66.7%) | 18 (33.3%) |
| 2-Person Household | 42 (75.0%) | 14 (25.0%) |
| 3-Person Household | 28 (84.9%) | 5 (15.1%) |
| 4+ Person Household | 33 (91.7%) | 3 (8.3%) |
| Total Housing Units | 139 (77.6%) | 40 (22.4%) |
Occupancy by Educational Attainment in D LO
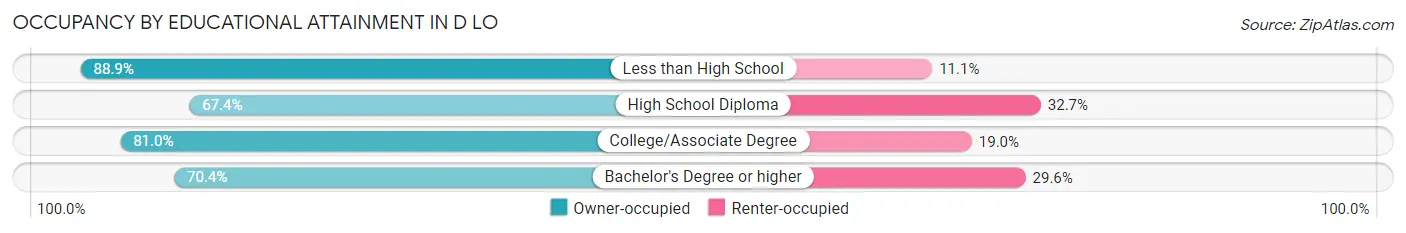
| Household Size | Owner-occupied | Renter-occupied |
| Less than High School | 40 (88.9%) | 5 (11.1%) |
| High School Diploma | 33 (67.3%) | 16 (32.7%) |
| College/Associate Degree | 47 (81.0%) | 11 (19.0%) |
| Bachelor's Degree or higher | 19 (70.4%) | 8 (29.6%) |
Occupancy by Age of Householder in D LO
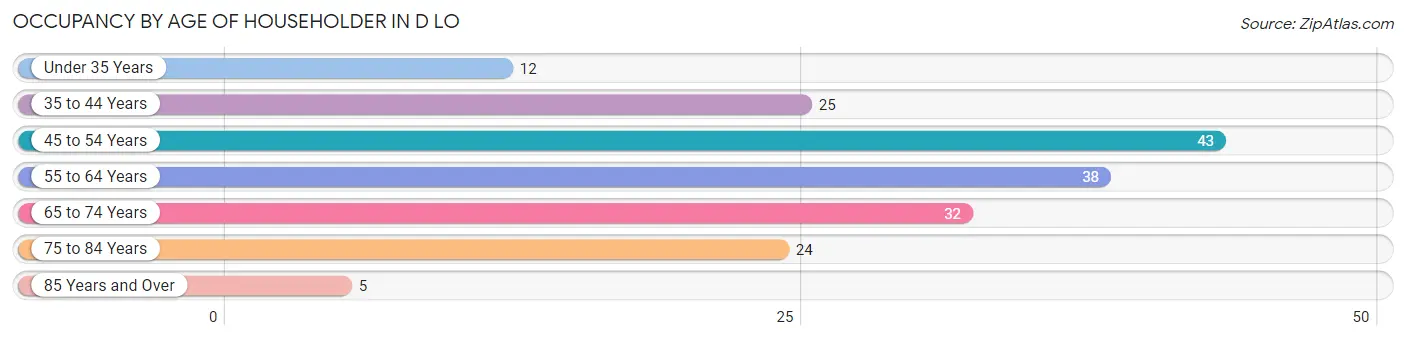
| Age Bracket | # Households | % Households |
| Under 35 Years | 12 | 6.7% |
| 35 to 44 Years | 25 | 14.0% |
| 45 to 54 Years | 43 | 24.0% |
| 55 to 64 Years | 38 | 21.2% |
| 65 to 74 Years | 32 | 17.9% |
| 75 to 84 Years | 24 | 13.4% |
| 85 Years and Over | 5 | 2.8% |
| Total | 179 | 100.0% |
Housing Finances in D LO
Median Income by Occupancy in D LO
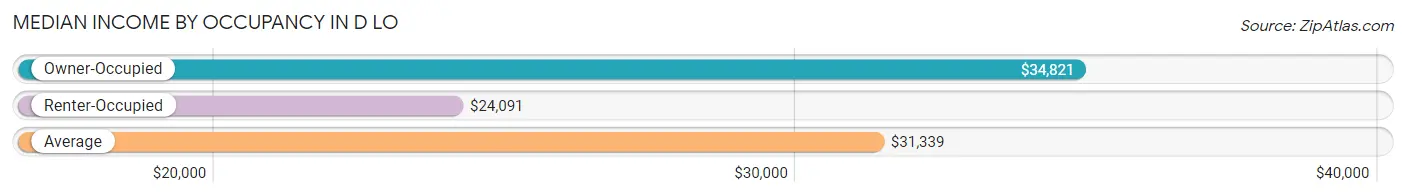
| Occupancy Type | # Households | Median Income |
| Owner-Occupied | 139 (77.6%) | $34,821 |
| Renter-Occupied | 40 (22.4%) | $24,091 |
| Average | 179 (100.0%) | $31,339 |
Occupancy by Householder Income Bracket in D LO
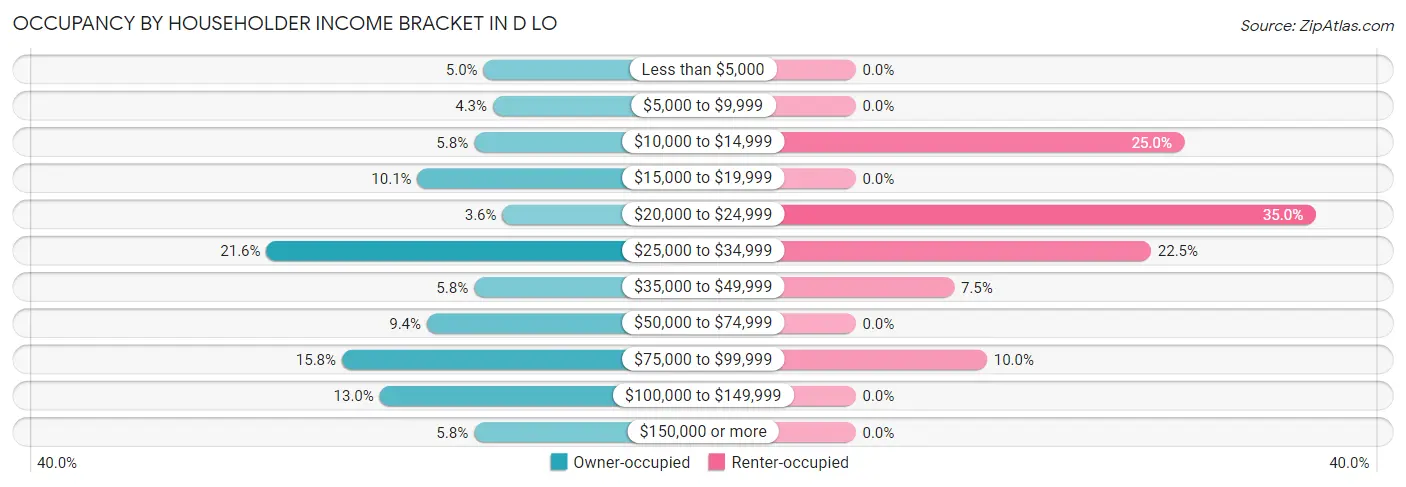
| Income Bracket | Owner-occupied | Renter-occupied |
| Less than $5,000 | 7 (5.0%) | 0 (0.0%) |
| $5,000 to $9,999 | 6 (4.3%) | 0 (0.0%) |
| $10,000 to $14,999 | 8 (5.8%) | 10 (25.0%) |
| $15,000 to $19,999 | 14 (10.1%) | 0 (0.0%) |
| $20,000 to $24,999 | 5 (3.6%) | 14 (35.0%) |
| $25,000 to $34,999 | 30 (21.6%) | 9 (22.5%) |
| $35,000 to $49,999 | 8 (5.8%) | 3 (7.5%) |
| $50,000 to $74,999 | 13 (9.3%) | 0 (0.0%) |
| $75,000 to $99,999 | 22 (15.8%) | 4 (10.0%) |
| $100,000 to $149,999 | 18 (13.0%) | 0 (0.0%) |
| $150,000 or more | 8 (5.8%) | 0 (0.0%) |
| Total | 139 (100.0%) | 40 (100.0%) |
Monthly Housing Cost Tiers in D LO
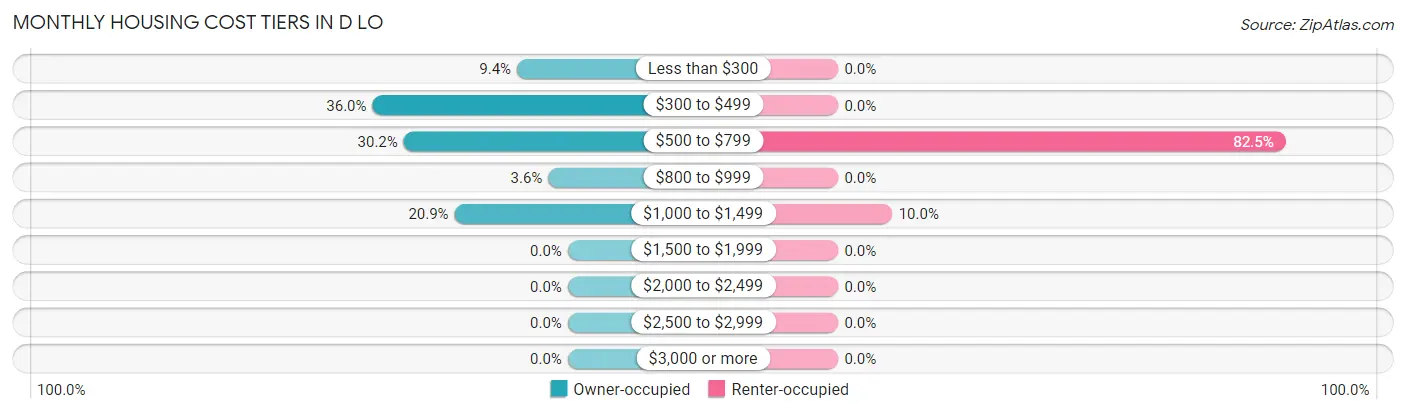
| Monthly Cost | Owner-occupied | Renter-occupied |
| Less than $300 | 13 (9.3%) | 0 (0.0%) |
| $300 to $499 | 50 (36.0%) | 0 (0.0%) |
| $500 to $799 | 42 (30.2%) | 33 (82.5%) |
| $800 to $999 | 5 (3.6%) | 0 (0.0%) |
| $1,000 to $1,499 | 29 (20.9%) | 4 (10.0%) |
| $1,500 to $1,999 | 0 (0.0%) | 0 (0.0%) |
| $2,000 to $2,499 | 0 (0.0%) | 0 (0.0%) |
| $2,500 to $2,999 | 0 (0.0%) | 0 (0.0%) |
| $3,000 or more | 0 (0.0%) | 0 (0.0%) |
| Total | 139 (100.0%) | 40 (100.0%) |
Physical Housing Characteristics in D LO
Housing Structures in D LO
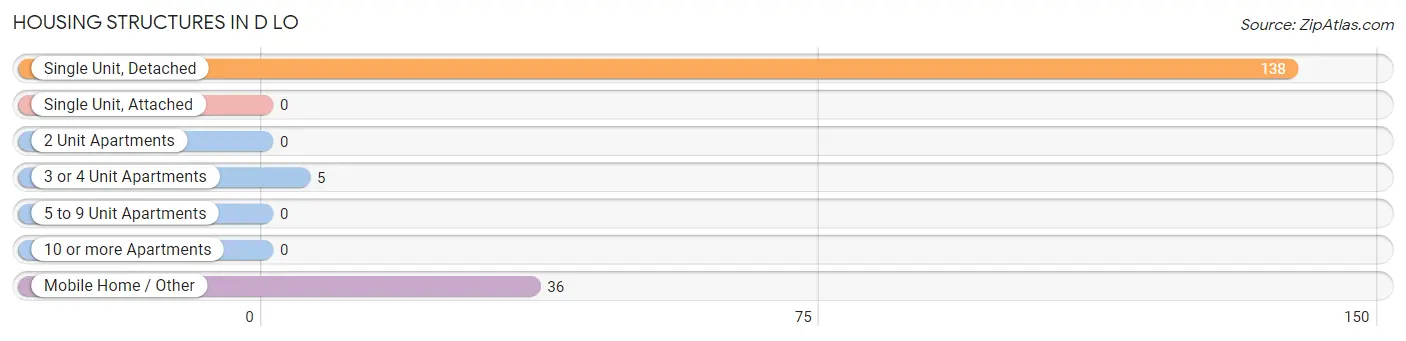
| Structure Type | # Housing Units | % Housing Units |
| Single Unit, Detached | 138 | 77.1% |
| Single Unit, Attached | 0 | 0.0% |
| 2 Unit Apartments | 0 | 0.0% |
| 3 or 4 Unit Apartments | 5 | 2.8% |
| 5 to 9 Unit Apartments | 0 | 0.0% |
| 10 or more Apartments | 0 | 0.0% |
| Mobile Home / Other | 36 | 20.1% |
| Total | 179 | 100.0% |
Housing Structures by Occupancy in D LO
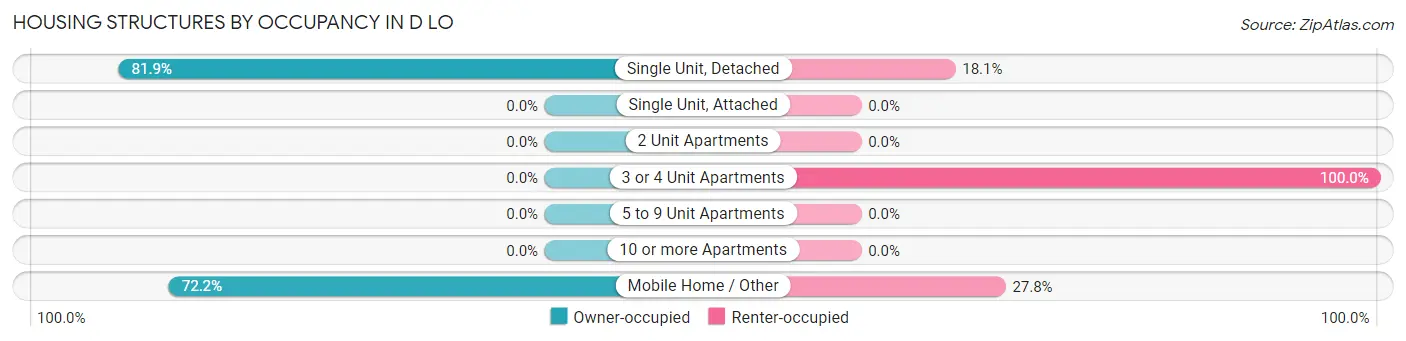
| Structure Type | Owner-occupied | Renter-occupied |
| Single Unit, Detached | 113 (81.9%) | 25 (18.1%) |
| Single Unit, Attached | 0 (0.0%) | 0 (0.0%) |
| 2 Unit Apartments | 0 (0.0%) | 0 (0.0%) |
| 3 or 4 Unit Apartments | 0 (0.0%) | 5 (100.0%) |
| 5 to 9 Unit Apartments | 0 (0.0%) | 0 (0.0%) |
| 10 or more Apartments | 0 (0.0%) | 0 (0.0%) |
| Mobile Home / Other | 26 (72.2%) | 10 (27.8%) |
| Total | 139 (77.6%) | 40 (22.4%) |
Housing Structures by Number of Rooms in D LO
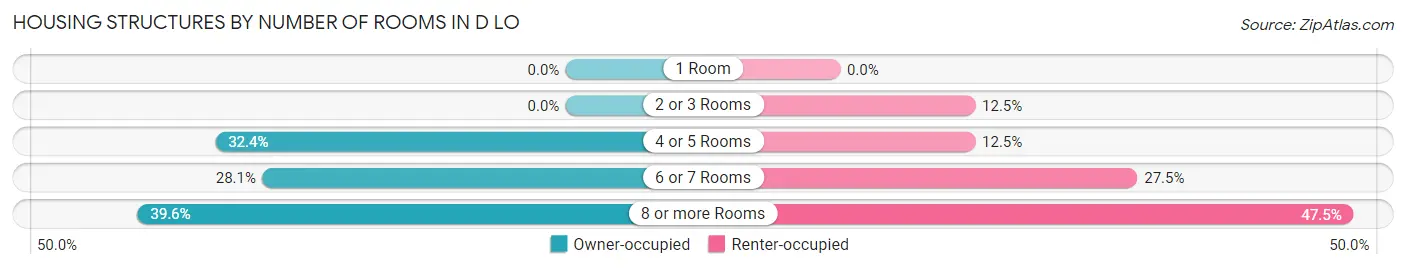
| Number of Rooms | Owner-occupied | Renter-occupied |
| 1 Room | 0 (0.0%) | 0 (0.0%) |
| 2 or 3 Rooms | 0 (0.0%) | 5 (12.5%) |
| 4 or 5 Rooms | 45 (32.4%) | 5 (12.5%) |
| 6 or 7 Rooms | 39 (28.1%) | 11 (27.5%) |
| 8 or more Rooms | 55 (39.6%) | 19 (47.5%) |
| Total | 139 (100.0%) | 40 (100.0%) |
Housing Structure by Heating Type in D LO
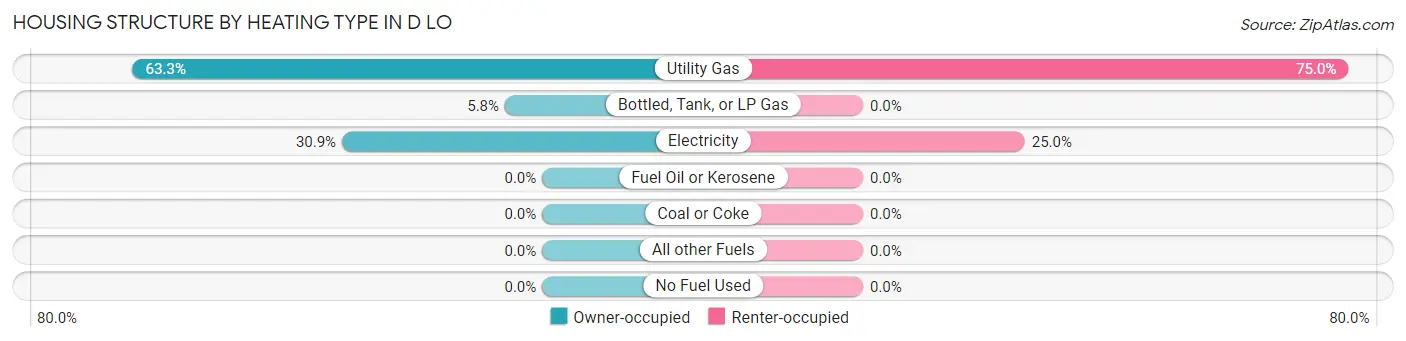
| Heating Type | Owner-occupied | Renter-occupied |
| Utility Gas | 88 (63.3%) | 30 (75.0%) |
| Bottled, Tank, or LP Gas | 8 (5.8%) | 0 (0.0%) |
| Electricity | 43 (30.9%) | 10 (25.0%) |
| Fuel Oil or Kerosene | 0 (0.0%) | 0 (0.0%) |
| Coal or Coke | 0 (0.0%) | 0 (0.0%) |
| All other Fuels | 0 (0.0%) | 0 (0.0%) |
| No Fuel Used | 0 (0.0%) | 0 (0.0%) |
| Total | 139 (100.0%) | 40 (100.0%) |
Household Vehicle Usage in D LO
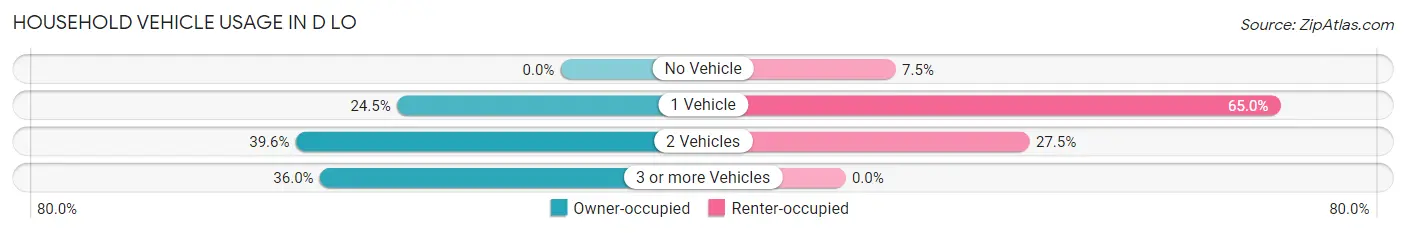
| Vehicles per Household | Owner-occupied | Renter-occupied |
| No Vehicle | 0 (0.0%) | 3 (7.5%) |
| 1 Vehicle | 34 (24.5%) | 26 (65.0%) |
| 2 Vehicles | 55 (39.6%) | 11 (27.5%) |
| 3 or more Vehicles | 50 (36.0%) | 0 (0.0%) |
| Total | 139 (100.0%) | 40 (100.0%) |
Real Estate & Mortgages in D LO
Real Estate and Mortgage Overview in D LO
| Characteristic | Without Mortgage | With Mortgage |
| Housing Units | 80 | 59 |
| Median Property Value | $89,200 | $87,200 |
| Median Household Income | $41,000 | $8 |
| Monthly Housing Costs | $393 | $0 |
| Real Estate Taxes | $546 | $19 |
Property Value by Mortgage Status in D LO
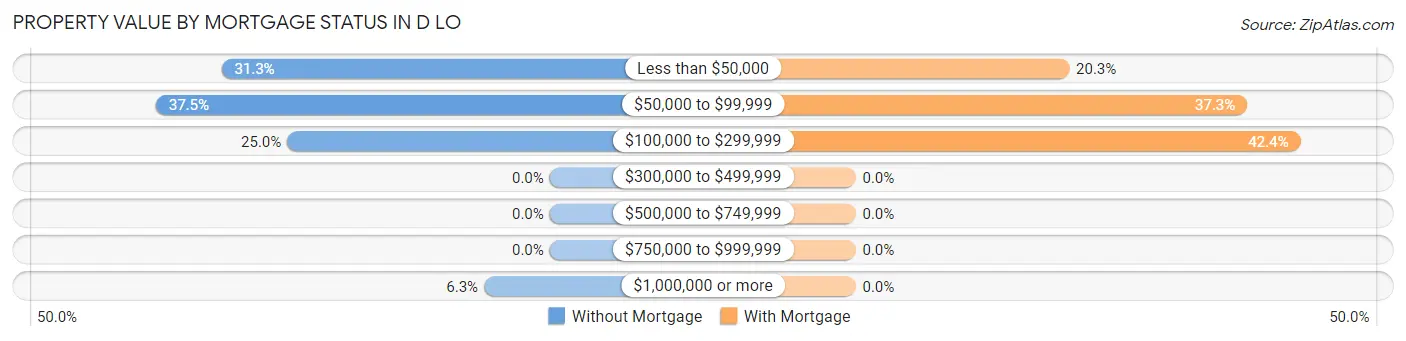
| Property Value | Without Mortgage | With Mortgage |
| Less than $50,000 | 25 (31.2%) | 12 (20.3%) |
| $50,000 to $99,999 | 30 (37.5%) | 22 (37.3%) |
| $100,000 to $299,999 | 20 (25.0%) | 25 (42.4%) |
| $300,000 to $499,999 | 0 (0.0%) | 0 (0.0%) |
| $500,000 to $749,999 | 0 (0.0%) | 0 (0.0%) |
| $750,000 to $999,999 | 0 (0.0%) | 0 (0.0%) |
| $1,000,000 or more | 5 (6.2%) | 0 (0.0%) |
| Total | 80 (100.0%) | 59 (100.0%) |
Household Income by Mortgage Status in D LO
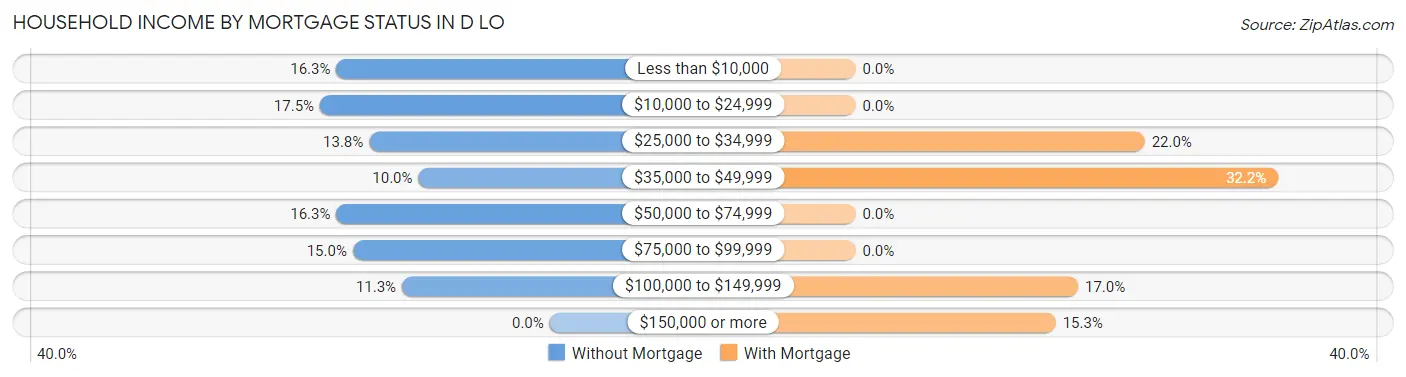
| Household Income | Without Mortgage | With Mortgage |
| Less than $10,000 | 13 (16.3%) | 0 (0.0%) |
| $10,000 to $24,999 | 14 (17.5%) | 0 (0.0%) |
| $25,000 to $34,999 | 11 (13.8%) | 13 (22.0%) |
| $35,000 to $49,999 | 8 (10.0%) | 19 (32.2%) |
| $50,000 to $74,999 | 13 (16.3%) | 0 (0.0%) |
| $75,000 to $99,999 | 12 (15.0%) | 0 (0.0%) |
| $100,000 to $149,999 | 9 (11.3%) | 10 (17.0%) |
| $150,000 or more | 0 (0.0%) | 9 (15.2%) |
| Total | 80 (100.0%) | 59 (100.0%) |
Property Value to Household Income Ratio in D LO
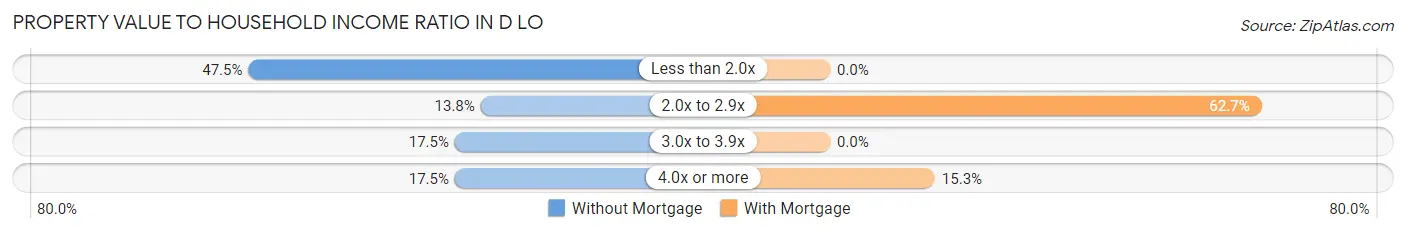
| Value-to-Income Ratio | Without Mortgage | With Mortgage |
| Less than 2.0x | 38 (47.5%) | 0 (0.0%) |
| 2.0x to 2.9x | 11 (13.8%) | 37 (62.7%) |
| 3.0x to 3.9x | 14 (17.5%) | 0 (0.0%) |
| 4.0x or more | 14 (17.5%) | 9 (15.2%) |
| Total | 80 (100.0%) | 59 (100.0%) |
Real Estate Taxes by Mortgage Status in D LO
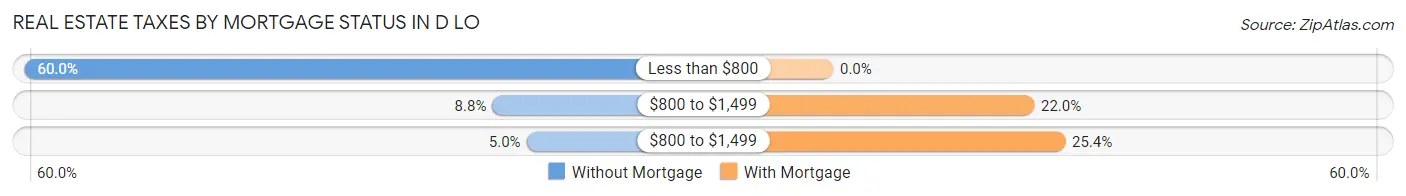
| Property Taxes | Without Mortgage | With Mortgage |
| Less than $800 | 48 (60.0%) | 0 (0.0%) |
| $800 to $1,499 | 7 (8.7%) | 13 (22.0%) |
| $800 to $1,499 | 4 (5.0%) | 15 (25.4%) |
| Total | 80 (100.0%) | 59 (100.0%) |
Health & Disability in D LO
Health Insurance Coverage by Age in D LO
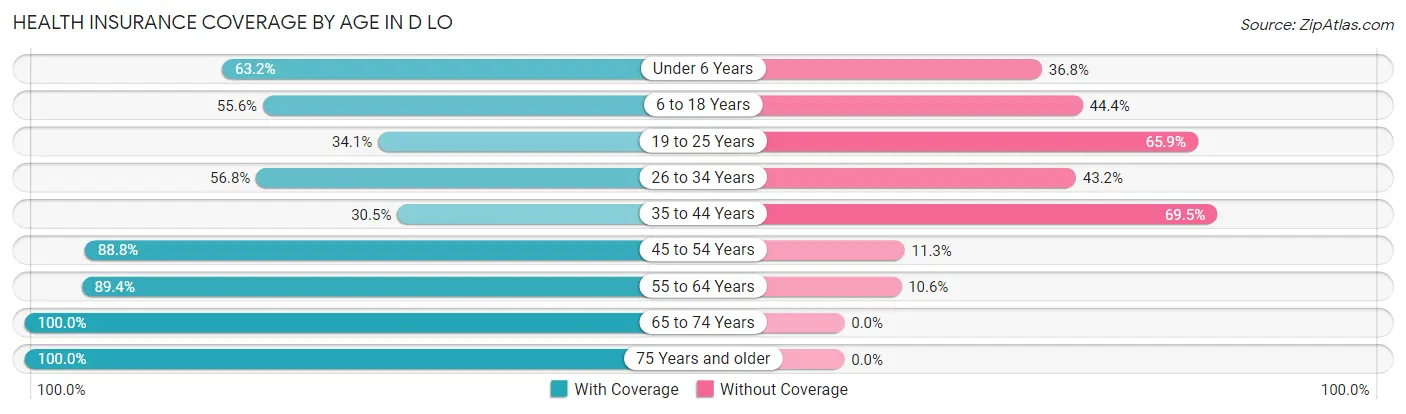
| Age Bracket | With Coverage | Without Coverage |
| Under 6 Years | 12 (63.2%) | 7 (36.8%) |
| 6 to 18 Years | 75 (55.6%) | 60 (44.4%) |
| 19 to 25 Years | 15 (34.1%) | 29 (65.9%) |
| 26 to 34 Years | 25 (56.8%) | 19 (43.2%) |
| 35 to 44 Years | 18 (30.5%) | 41 (69.5%) |
| 45 to 54 Years | 71 (88.7%) | 9 (11.3%) |
| 55 to 64 Years | 59 (89.4%) | 7 (10.6%) |
| 65 to 74 Years | 50 (100.0%) | 0 (0.0%) |
| 75 Years and older | 43 (100.0%) | 0 (0.0%) |
| Total | 368 (68.1%) | 172 (31.9%) |
Health Insurance Coverage by Citizenship Status in D LO
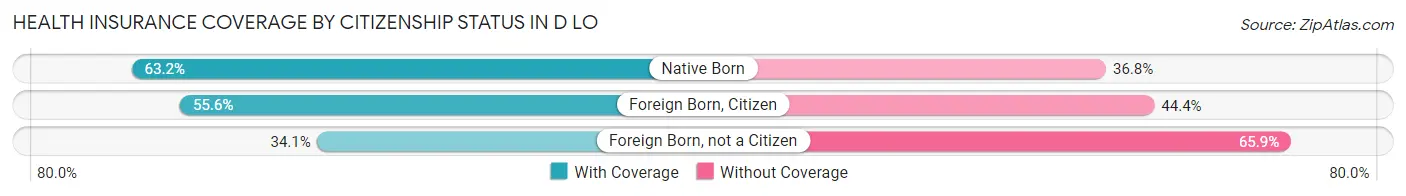
| Citizenship Status | With Coverage | Without Coverage |
| Native Born | 12 (63.2%) | 7 (36.8%) |
| Foreign Born, Citizen | 75 (55.6%) | 60 (44.4%) |
| Foreign Born, not a Citizen | 15 (34.1%) | 29 (65.9%) |
Health Insurance Coverage by Household Income in D LO
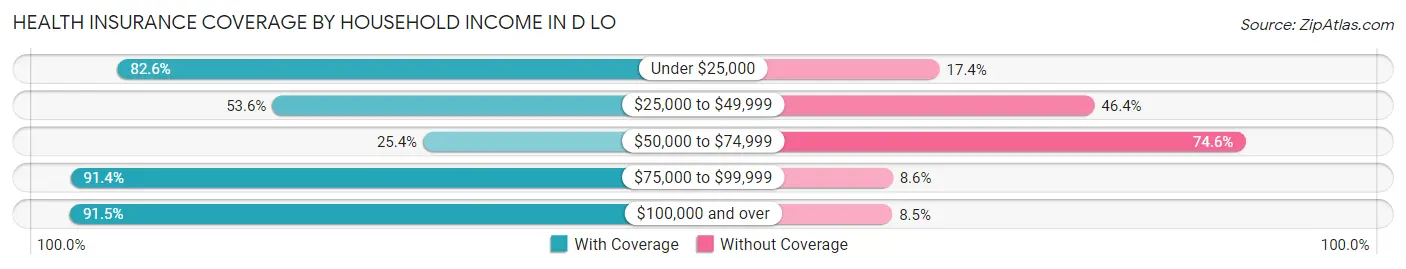
| Household Income | With Coverage | Without Coverage |
| Under $25,000 | 76 (82.6%) | 16 (17.4%) |
| $25,000 to $49,999 | 104 (53.6%) | 90 (46.4%) |
| $50,000 to $74,999 | 17 (25.4%) | 50 (74.6%) |
| $75,000 to $99,999 | 85 (91.4%) | 8 (8.6%) |
| $100,000 and over | 86 (91.5%) | 8 (8.5%) |
Public vs Private Health Insurance Coverage by Age in D LO
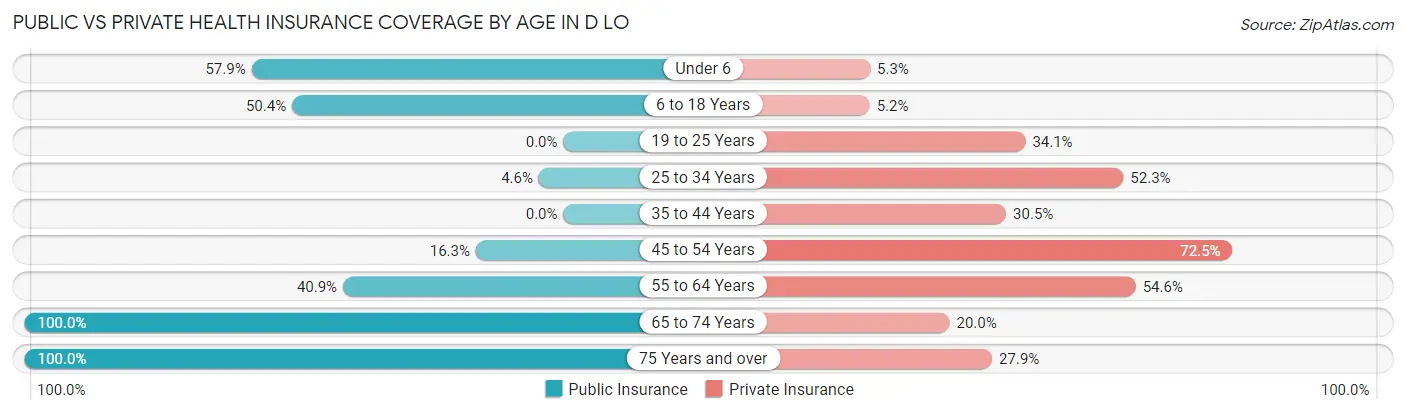
| Age Bracket | Public Insurance | Private Insurance |
| Under 6 | 11 (57.9%) | 1 (5.3%) |
| 6 to 18 Years | 68 (50.4%) | 7 (5.2%) |
| 19 to 25 Years | 0 (0.0%) | 15 (34.1%) |
| 25 to 34 Years | 2 (4.5%) | 23 (52.3%) |
| 35 to 44 Years | 0 (0.0%) | 18 (30.5%) |
| 45 to 54 Years | 13 (16.3%) | 58 (72.5%) |
| 55 to 64 Years | 27 (40.9%) | 36 (54.5%) |
| 65 to 74 Years | 50 (100.0%) | 10 (20.0%) |
| 75 Years and over | 43 (100.0%) | 12 (27.9%) |
| Total | 214 (39.6%) | 180 (33.3%) |
Disability Status by Sex by Age in D LO
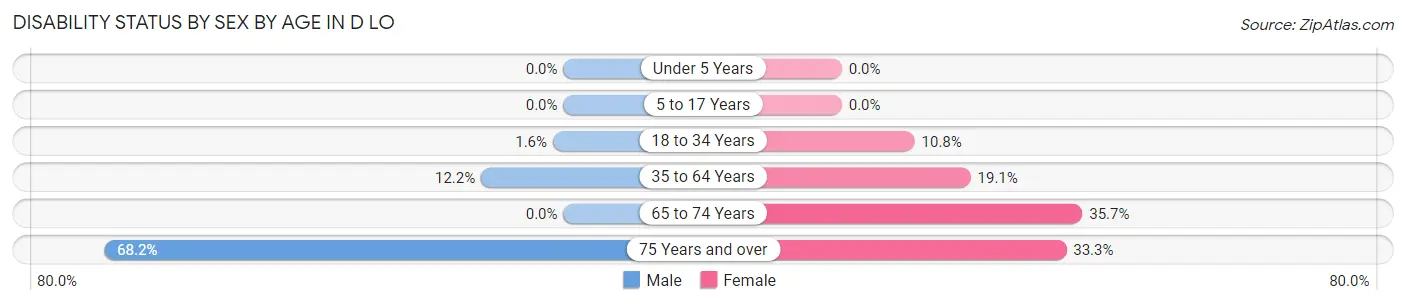
| Age Bracket | Male | Female |
| Under 5 Years | 0 (0.0%) | 0 (0.0%) |
| 5 to 17 Years | 0 (0.0%) | 0 (0.0%) |
| 18 to 34 Years | 1 (1.6%) | 4 (10.8%) |
| 35 to 64 Years | 11 (12.2%) | 22 (19.1%) |
| 65 to 74 Years | 0 (0.0%) | 10 (35.7%) |
| 75 Years and over | 15 (68.2%) | 7 (33.3%) |
Disability Class by Sex by Age in D LO
Disability Class: Hearing Difficulty
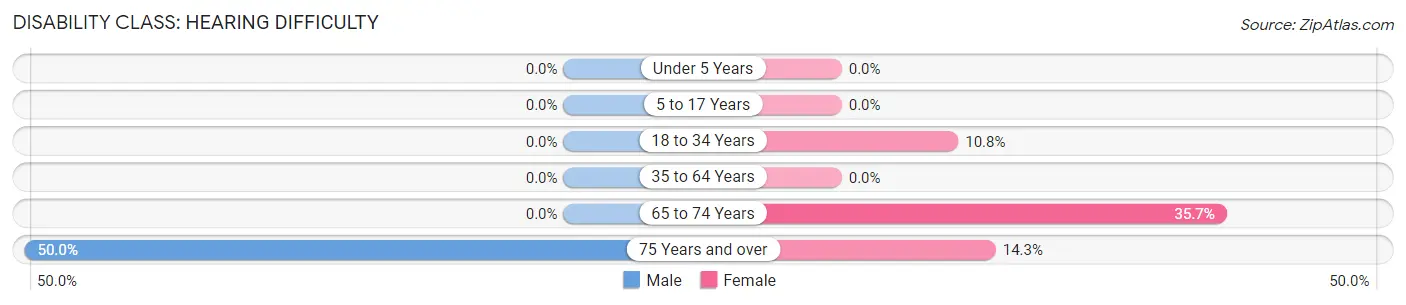
| Age Bracket | Male | Female |
| Under 5 Years | 0 (0.0%) | 0 (0.0%) |
| 5 to 17 Years | 0 (0.0%) | 0 (0.0%) |
| 18 to 34 Years | 0 (0.0%) | 4 (10.8%) |
| 35 to 64 Years | 0 (0.0%) | 0 (0.0%) |
| 65 to 74 Years | 0 (0.0%) | 10 (35.7%) |
| 75 Years and over | 11 (50.0%) | 3 (14.3%) |
Disability Class: Vision Difficulty
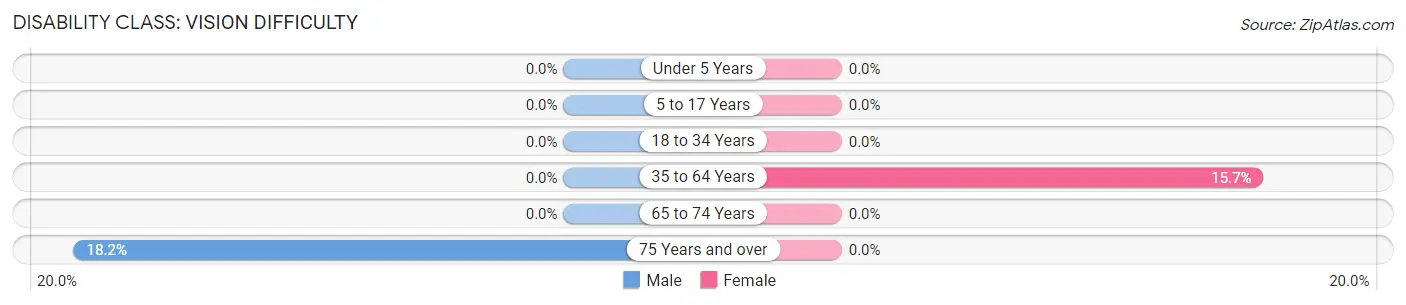
| Age Bracket | Male | Female |
| Under 5 Years | 0 (0.0%) | 0 (0.0%) |
| 5 to 17 Years | 0 (0.0%) | 0 (0.0%) |
| 18 to 34 Years | 0 (0.0%) | 0 (0.0%) |
| 35 to 64 Years | 0 (0.0%) | 18 (15.7%) |
| 65 to 74 Years | 0 (0.0%) | 0 (0.0%) |
| 75 Years and over | 4 (18.2%) | 0 (0.0%) |
Disability Class: Cognitive Difficulty
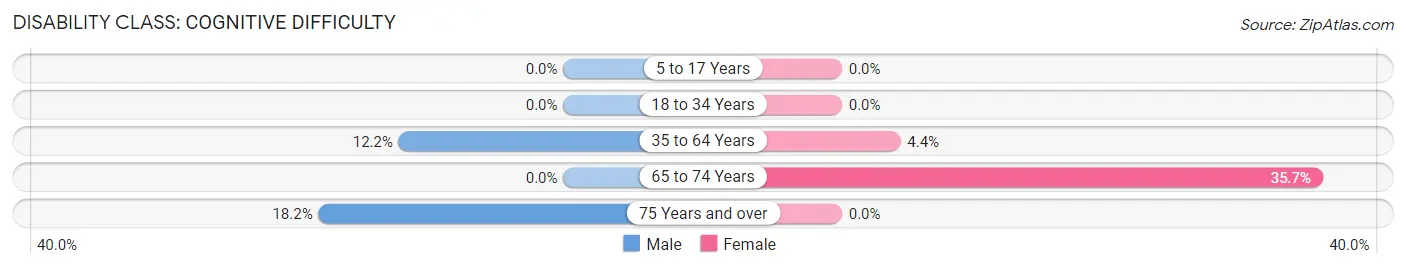
| Age Bracket | Male | Female |
| 5 to 17 Years | 0 (0.0%) | 0 (0.0%) |
| 18 to 34 Years | 0 (0.0%) | 0 (0.0%) |
| 35 to 64 Years | 11 (12.2%) | 5 (4.3%) |
| 65 to 74 Years | 0 (0.0%) | 10 (35.7%) |
| 75 Years and over | 4 (18.2%) | 0 (0.0%) |
Disability Class: Ambulatory Difficulty
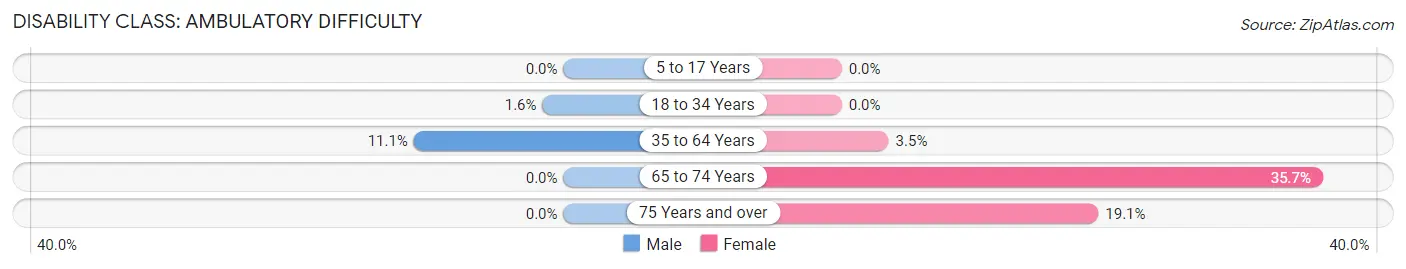
| Age Bracket | Male | Female |
| 5 to 17 Years | 0 (0.0%) | 0 (0.0%) |
| 18 to 34 Years | 1 (1.6%) | 0 (0.0%) |
| 35 to 64 Years | 10 (11.1%) | 4 (3.5%) |
| 65 to 74 Years | 0 (0.0%) | 10 (35.7%) |
| 75 Years and over | 0 (0.0%) | 4 (19.1%) |
Disability Class: Self-Care Difficulty
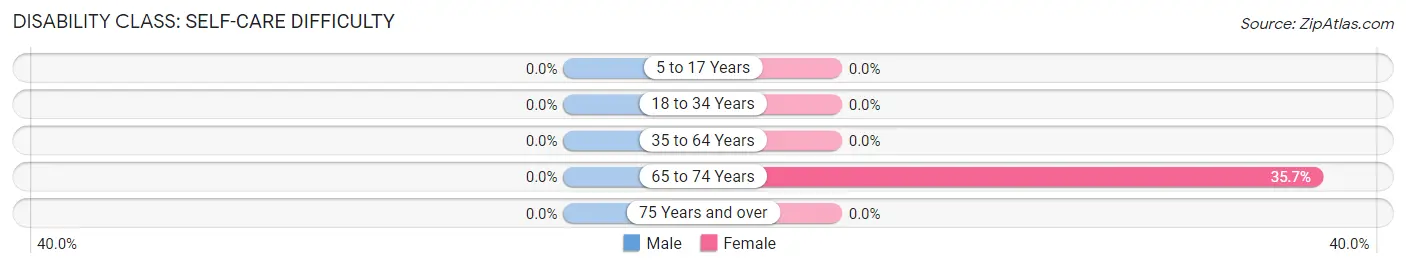
| Age Bracket | Male | Female |
| 5 to 17 Years | 0 (0.0%) | 0 (0.0%) |
| 18 to 34 Years | 0 (0.0%) | 0 (0.0%) |
| 35 to 64 Years | 0 (0.0%) | 0 (0.0%) |
| 65 to 74 Years | 0 (0.0%) | 10 (35.7%) |
| 75 Years and over | 0 (0.0%) | 0 (0.0%) |
Technology Access in D LO
Computing Device Access in D LO
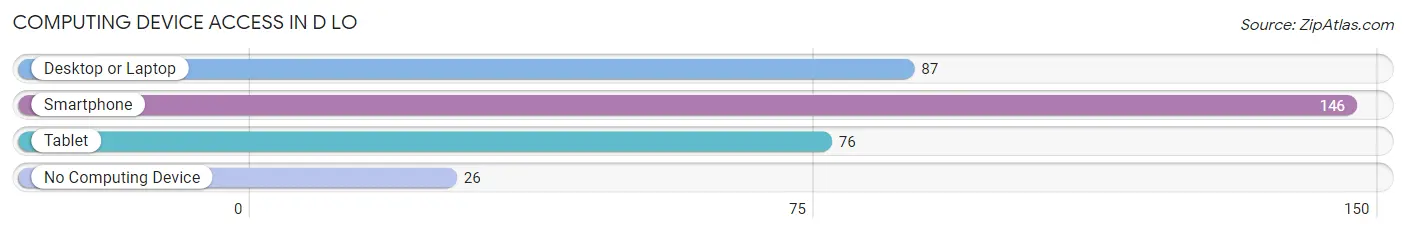
| Device Type | # Households | % Households |
| Desktop or Laptop | 87 | 48.6% |
| Smartphone | 146 | 81.6% |
| Tablet | 76 | 42.5% |
| No Computing Device | 26 | 14.5% |
| Total | 179 | 100.0% |
Internet Access in D LO
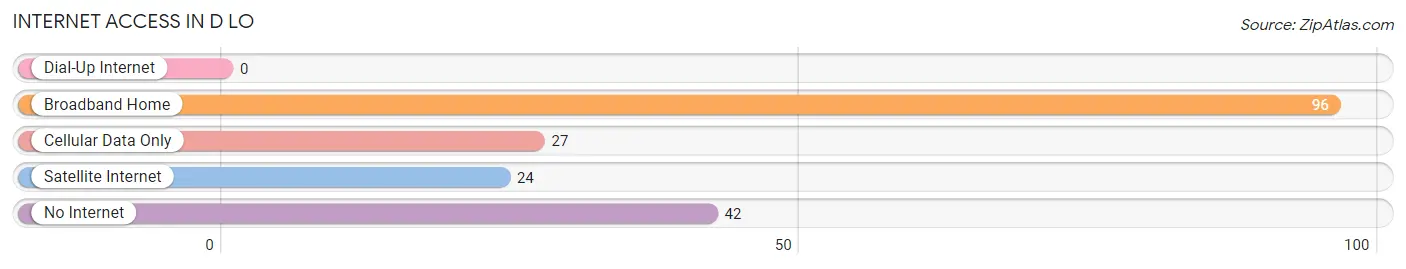
| Internet Type | # Households | % Households |
| Dial-Up Internet | 0 | 0.0% |
| Broadband Home | 96 | 53.6% |
| Cellular Data Only | 27 | 15.1% |
| Satellite Internet | 24 | 13.4% |
| No Internet | 42 | 23.5% |
| Total | 179 | 100.0% |
D LO Summary
The state of Mississippi is located in the southeastern region of the United States. It is bordered by Tennessee to the north, Alabama to the east, the Gulf of Mexico to the south, and Louisiana and Arkansas to the west. Mississippi is the 32nd largest state in the United States, with a total area of 48,430 square miles. It is the 31st most populous state, with a population of approximately 2.9 million people.
History
The history of Mississippi dates back to the early 16th century, when the region was first explored by Spanish explorers. The first permanent European settlement in the area was established in 1699 by French colonists. The region was ceded to the United States in 1798, and became part of the Mississippi Territory in 1817. Mississippi was admitted to the Union as the 20th state in 1817.
During the 19th century, Mississippi was a slave state, and was the site of several major battles during the Civil War. After the war, the state was subject to Reconstruction, and the period of Jim Crow laws. In the mid-20th century, the state was a major site of the civil rights movement, and was the site of several major events, including the murder of Emmett Till in 1955.
Geography
Mississippi is located in the southeastern region of the United States. It is bordered by Tennessee to the north, Alabama to the east, the Gulf of Mexico to the south, and Louisiana and Arkansas to the west. The state is divided into three distinct geographic regions: the Gulf Coastal Plain, the Mississippi Alluvial Plain, and the Mississippi Hills.
The Gulf Coastal Plain is located along the Gulf of Mexico, and is characterized by flat, low-lying terrain. The Mississippi Alluvial Plain is located in the northern and central parts of the state, and is characterized by rolling hills and fertile soil. The Mississippi Hills are located in the northwestern part of the state, and are characterized by rugged terrain and steep hills.
Economy
The economy of Mississippi is largely based on agriculture, manufacturing, and services. The state is a major producer of cotton, soybeans, corn, and rice. It is also a major producer of timber, and is home to several large paper mills.
Manufacturing is a major part of the state’s economy, with major industries including automotive, aerospace, and food processing. The state is also home to several large military bases, which provide a significant source of employment.
The service sector is also a major part of the state’s economy, with major industries including tourism, healthcare, and education.
Demographics
As of the 2010 census, the population of Mississippi was approximately 2.9 million people. The state is predominantly white, with approximately 58% of the population identifying as white. African Americans make up approximately 37% of the population, and Hispanics make up approximately 4%.
The median household income in Mississippi is approximately $40,000, and the median home value is approximately $120,000. The state has a poverty rate of approximately 20%, which is higher than the national average.
Common Questions
What is Per Capita Income in D LO?
Per Capita income in D LO is $18,776.
What is the Median Family Income in D LO?
Median Family Income in D LO is $59,063.
What is the Median Household income in D LO?
Median Household Income in D LO is $31,339.
What is Income or Wage Gap in D LO?
Income or Wage Gap in D LO is 30.2%.
Women in D LO earn 69.8 cents for every dollar earned by a man.
What is Inequality or Gini Index in D LO?
Inequality or Gini Index in D LO is 0.46.
What is the Total Population of D LO?
Total Population of D LO is 540.
What is the Total Male Population of D LO?
Total Male Population of D LO is 293.
What is the Total Female Population of D LO?
Total Female Population of D LO is 247.
What is the Ratio of Males per 100 Females in D LO?
There are 118.62 Males per 100 Females in D LO.
What is the Ratio of Females per 100 Males in D LO?
There are 84.30 Females per 100 Males in D LO.
What is the Median Population Age in D LO?
Median Population Age in D LO is 38.5 Years.
What is the Average Family Size in D LO
Average Family Size in D LO is 3.9 People.
What is the Average Household Size in D LO
Average Household Size in D LO is 3.0 People.
How Large is the Labor Force in D LO?
There are 203 People in the Labor Forcein in D LO.
What is the Percentage of People in the Labor Force in D LO?
48.3% of People are in the Labor Force in D LO.
What is the Unemployment Rate in D LO?
Unemployment Rate in D LO is 17.2%.