Artesia, MS Map & Demographics
Artesia Map
Artesia Overview
$17,246
PER CAPITA INCOME
$36,364
AVG FAMILY INCOME
$19,444
AVG HOUSEHOLD INCOME
18.6%
WAGE / INCOME GAP [ % ]
81.4¢/ $1
WAGE / INCOME GAP [ $ ]
$19,895
FAMILY INCOME DEFICIT
0.56
INEQUALITY / GINI INDEX
374
TOTAL POPULATION
165
MALE POPULATION
209
FEMALE POPULATION
78.95
MALES / 100 FEMALES
126.67
FEMALES / 100 MALES
36.0
MEDIAN AGE
3.0
AVG FAMILY SIZE
2.2
AVG HOUSEHOLD SIZE
130
LABOR FORCE [ PEOPLE ]
42.5%
PERCENT IN LABOR FORCE
1.5%
UNEMPLOYMENT RATE
Artesia Zip Codes
Artesia Area Codes
Income in Artesia
Income Overview in Artesia
Per Capita Income in Artesia is $17,246, while median incomes of families and households are $36,364 and $19,444 respectively.
| Characteristic | Number | Measure |
| Per Capita Income | 374 | $17,246 |
| Median Family Income | 102 | $36,364 |
| Mean Family Income | 102 | $42,612 |
| Median Household Income | 170 | $19,444 |
| Mean Household Income | 170 | $33,765 |
| Income Deficit | 102 | $19,895 |
| Wage / Income Gap (%) | 374 | 18.56% |
| Wage / Income Gap ($) | 374 | 81.44¢ per $1 |
| Gini / Inequality Index | 374 | 0.56 |
Earnings by Sex in Artesia
Average Earnings in Artesia are $37,500, $32,917 for men and $40,417 for women, a difference of 18.6%.
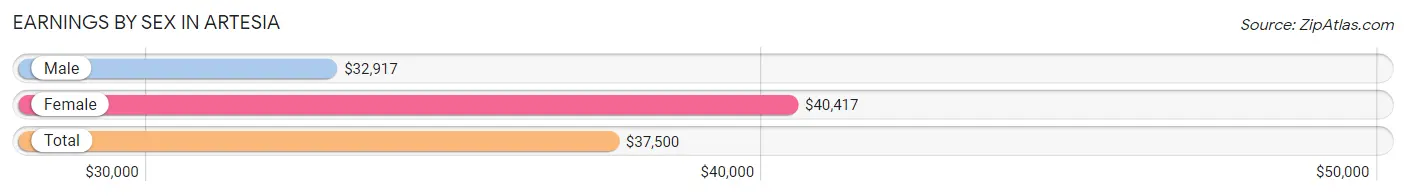
| Sex | Number | Average Earnings |
| Male | 61 (46.2%) | $32,917 |
| Female | 71 (53.8%) | $40,417 |
| Total | 132 (100.0%) | $37,500 |
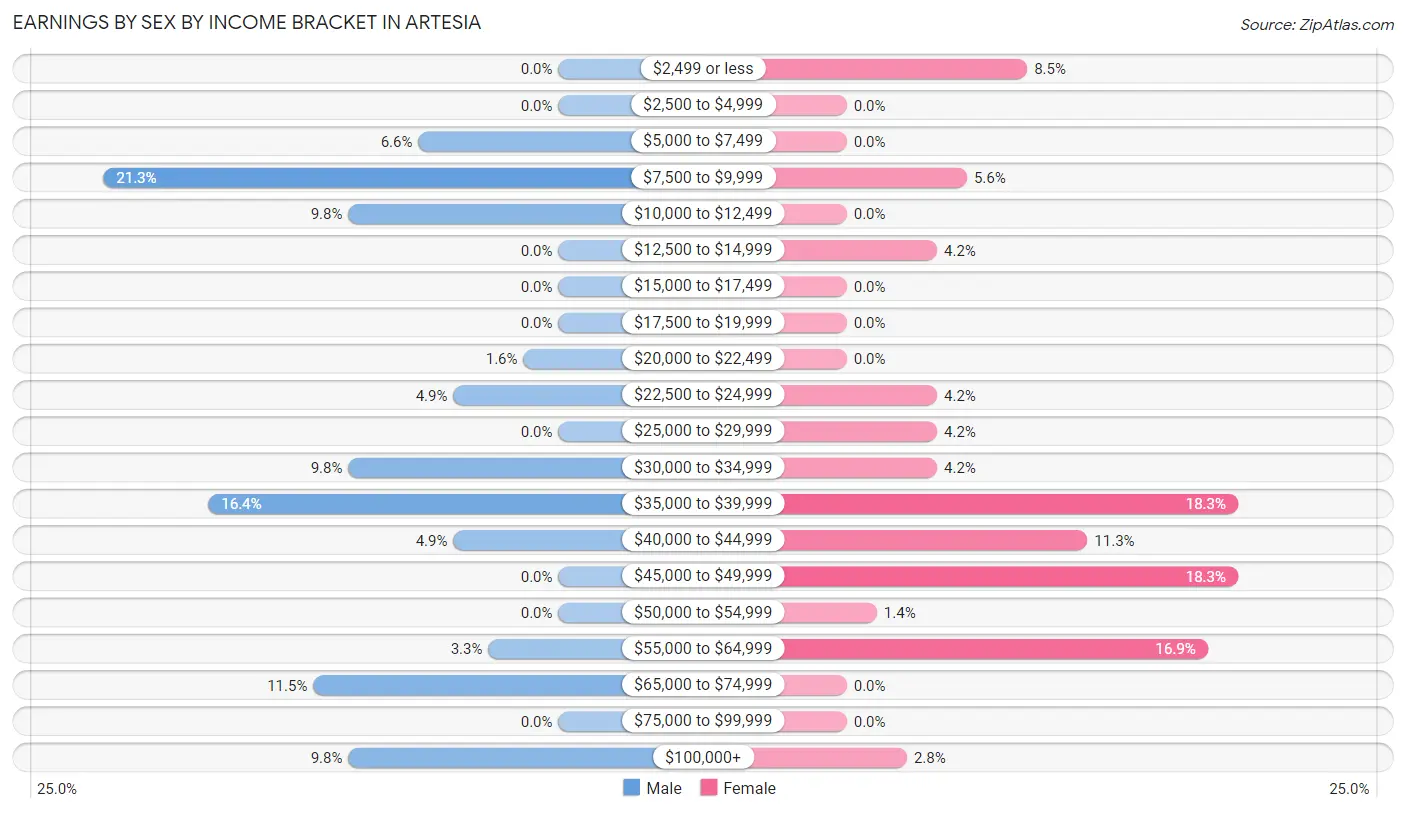
Earnings by Sex by Income Bracket in Artesia
The most common earnings brackets in Artesia are $7,500 to $9,999 for men (13 | 21.3%) and $35,000 to $39,999 for women (13 | 18.3%).
| Income | Male | Female |
| $2,499 or less | 0 (0.0%) | 6 (8.5%) |
| $2,500 to $4,999 | 0 (0.0%) | 0 (0.0%) |
| $5,000 to $7,499 | 4 (6.6%) | 0 (0.0%) |
| $7,500 to $9,999 | 13 (21.3%) | 4 (5.6%) |
| $10,000 to $12,499 | 6 (9.8%) | 0 (0.0%) |
| $12,500 to $14,999 | 0 (0.0%) | 3 (4.2%) |
| $15,000 to $17,499 | 0 (0.0%) | 0 (0.0%) |
| $17,500 to $19,999 | 0 (0.0%) | 0 (0.0%) |
| $20,000 to $22,499 | 1 (1.6%) | 0 (0.0%) |
| $22,500 to $24,999 | 3 (4.9%) | 3 (4.2%) |
| $25,000 to $29,999 | 0 (0.0%) | 3 (4.2%) |
| $30,000 to $34,999 | 6 (9.8%) | 3 (4.2%) |
| $35,000 to $39,999 | 10 (16.4%) | 13 (18.3%) |
| $40,000 to $44,999 | 3 (4.9%) | 8 (11.3%) |
| $45,000 to $49,999 | 0 (0.0%) | 13 (18.3%) |
| $50,000 to $54,999 | 0 (0.0%) | 1 (1.4%) |
| $55,000 to $64,999 | 2 (3.3%) | 12 (16.9%) |
| $65,000 to $74,999 | 7 (11.5%) | 0 (0.0%) |
| $75,000 to $99,999 | 0 (0.0%) | 0 (0.0%) |
| $100,000+ | 6 (9.8%) | 2 (2.8%) |
| Total | 61 (100.0%) | 71 (100.0%) |
Earnings by Sex by Educational Attainment in Artesia
Average earnings in Artesia are $33,750 for men and $43,000 for women, a difference of 21.5%. Men with an educational attainment of high school diploma enjoy the highest average annual earnings of $35,750, while those with high school diploma education earn the least with $35,750. Women with an educational attainment of high school diploma earn the most with the average annual earnings of $47,857, while those with college or associate's degree education have the smallest earnings of $38,393.
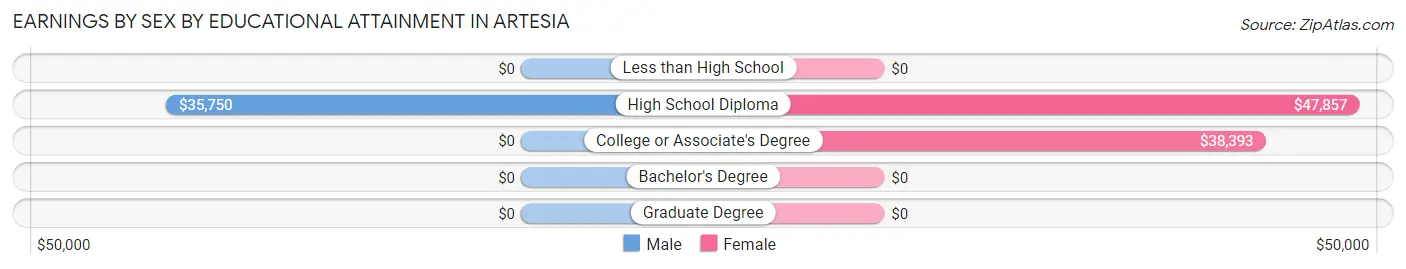
| Educational Attainment | Male Income | Female Income |
| Less than High School | - | - |
| High School Diploma | $35,750 | $47,857 |
| College or Associate's Degree | - | - |
| Bachelor's Degree | - | - |
| Graduate Degree | - | - |
| Total | $33,750 | $43,000 |
Family Income in Artesia
Family Income Brackets in Artesia
According to the Artesia family income data, there are 39 families falling into the less than $10,000 income range, which is the most common income bracket and makes up 38.2% of all families.
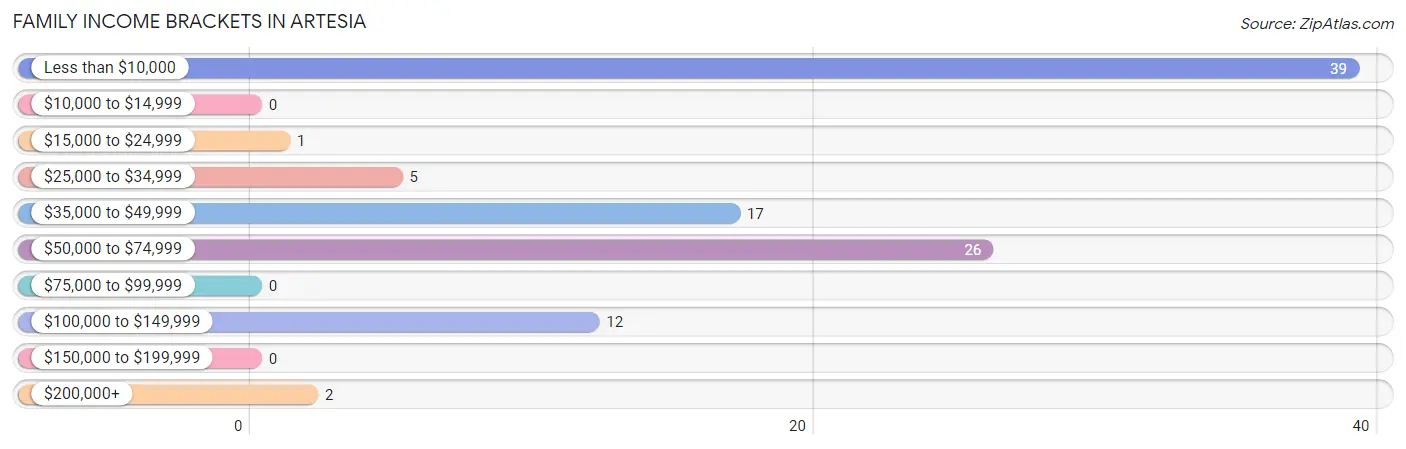
| Income Bracket | # Families | % Families |
| Less than $10,000 | 39 | 38.2% |
| $10,000 to $14,999 | 0 | 0.0% |
| $15,000 to $24,999 | 1 | 1.0% |
| $25,000 to $34,999 | 5 | 4.9% |
| $35,000 to $49,999 | 17 | 16.7% |
| $50,000 to $74,999 | 26 | 25.5% |
| $75,000 to $99,999 | 0 | 0.0% |
| $100,000 to $149,999 | 12 | 11.8% |
| $150,000 to $199,999 | 0 | 0.0% |
| $200,000+ | 2 | 2.0% |
Family Income by Famaliy Size in Artesia
2-person families (60 | 58.8%) account for the highest median family income in Artesia with $50,833 per family, while 2-person families (60 | 58.8%) have the highest median income of $25,416 per family member.
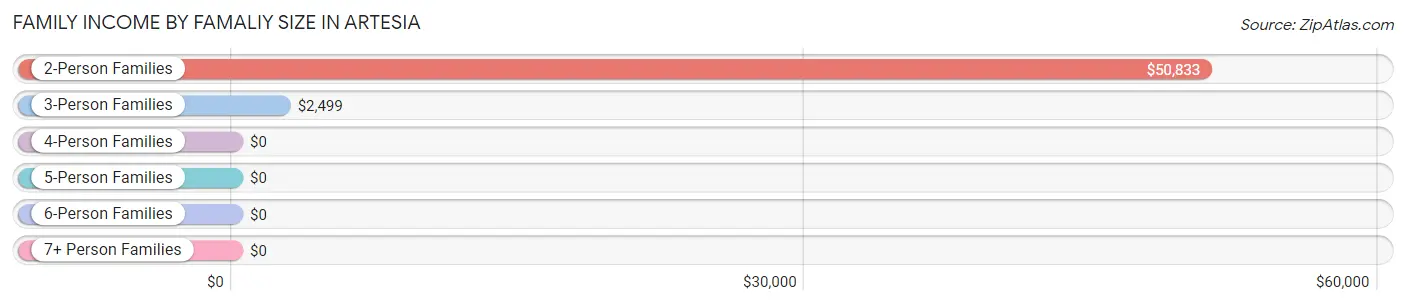
| Income Bracket | # Families | Median Income |
| 2-Person Families | 60 (58.8%) | $50,833 |
| 3-Person Families | 25 (24.5%) | $2,499 |
| 4-Person Families | 11 (10.8%) | $0 |
| 5-Person Families | 6 (5.9%) | $0 |
| 6-Person Families | 0 (0.0%) | $0 |
| 7+ Person Families | 0 (0.0%) | $0 |
| Total | 102 (100.0%) | $36,364 |
Family Income by Number of Earners in Artesia
The median family income in Artesia is $36,364, with families comprising 3+ earners (9) having the highest median family income of $137,917, while families with no earners (46) have the lowest median family income of $2,499, accounting for 8.8% and 45.1% of families, respectively.
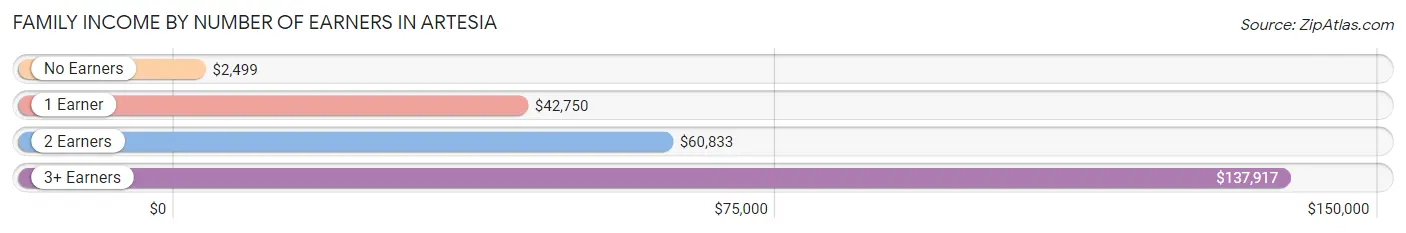
| Number of Earners | # Families | Median Income |
| No Earners | 46 (45.1%) | $2,499 |
| 1 Earner | 21 (20.6%) | $42,750 |
| 2 Earners | 26 (25.5%) | $60,833 |
| 3+ Earners | 9 (8.8%) | $137,917 |
| Total | 102 (100.0%) | $36,364 |
Household Income in Artesia
Household Income Brackets in Artesia
With 51 households falling in the category, the less than $10,000 income range is the most frequent in Artesia, accounting for 30.0% of all households.
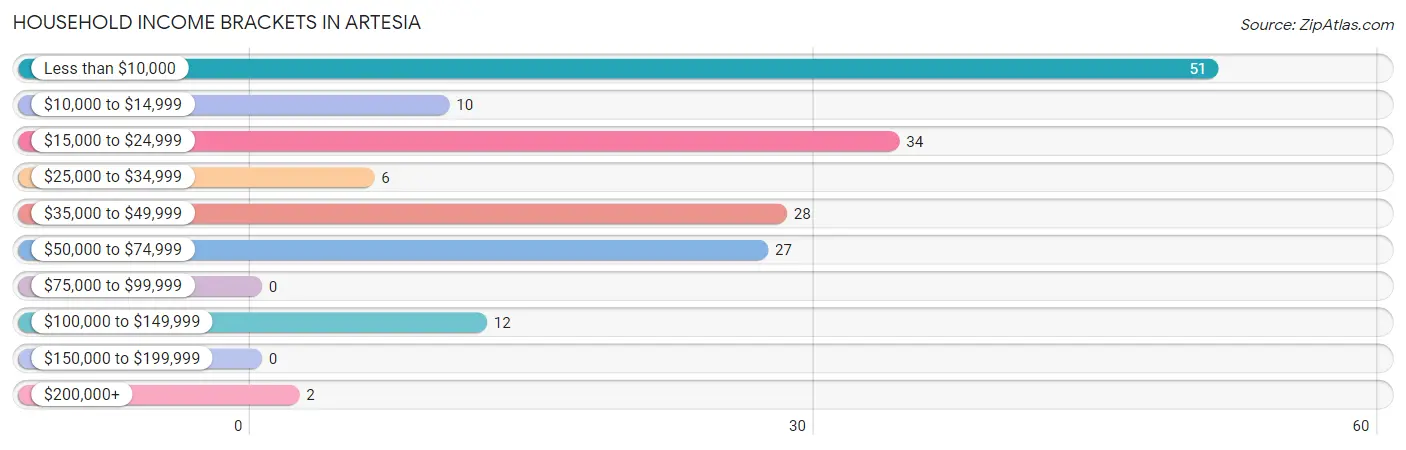
| Income Bracket | # Households | % Households |
| Less than $10,000 | 51 | 30.0% |
| $10,000 to $14,999 | 10 | 5.9% |
| $15,000 to $24,999 | 34 | 20.0% |
| $25,000 to $34,999 | 6 | 3.5% |
| $35,000 to $49,999 | 28 | 16.5% |
| $50,000 to $74,999 | 27 | 15.9% |
| $75,000 to $99,999 | 0 | 0.0% |
| $100,000 to $149,999 | 12 | 7.1% |
| $150,000 to $199,999 | 0 | 0.0% |
| $200,000+ | 2 | 1.2% |
Household Income by Householder Age in Artesia
The median household income in Artesia is $19,444, with the highest median household income of $44,000 found in the 45 to 64 years age bracket for the primary householder. A total of 62 households (36.5%) fall into this category. Meanwhile, the 15 to 24 years age bracket for the primary householder has the lowest median household income of $0, with 3 households (1.8%) in this group.
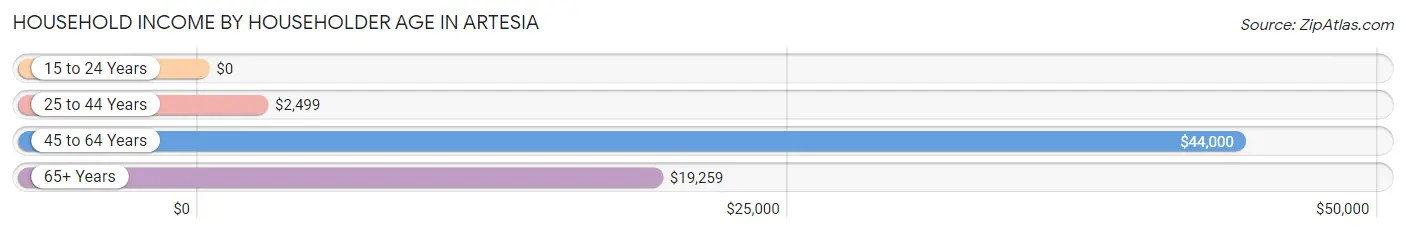
| Income Bracket | # Households | Median Income |
| 15 to 24 Years | 3 (1.8%) | $0 |
| 25 to 44 Years | 35 (20.6%) | $2,499 |
| 45 to 64 Years | 62 (36.5%) | $44,000 |
| 65+ Years | 70 (41.2%) | $19,259 |
| Total | 170 (100.0%) | $19,444 |
Poverty in Artesia
Income Below Poverty by Sex and Age in Artesia
With 20.0% poverty level for males and 40.2% for females among the residents of Artesia, 6 to 11 year old males and 6 to 11 year old females are the most vulnerable to poverty, with 1 males (100.0%) and 34 females (100.0%) in their respective age groups living below the poverty level.
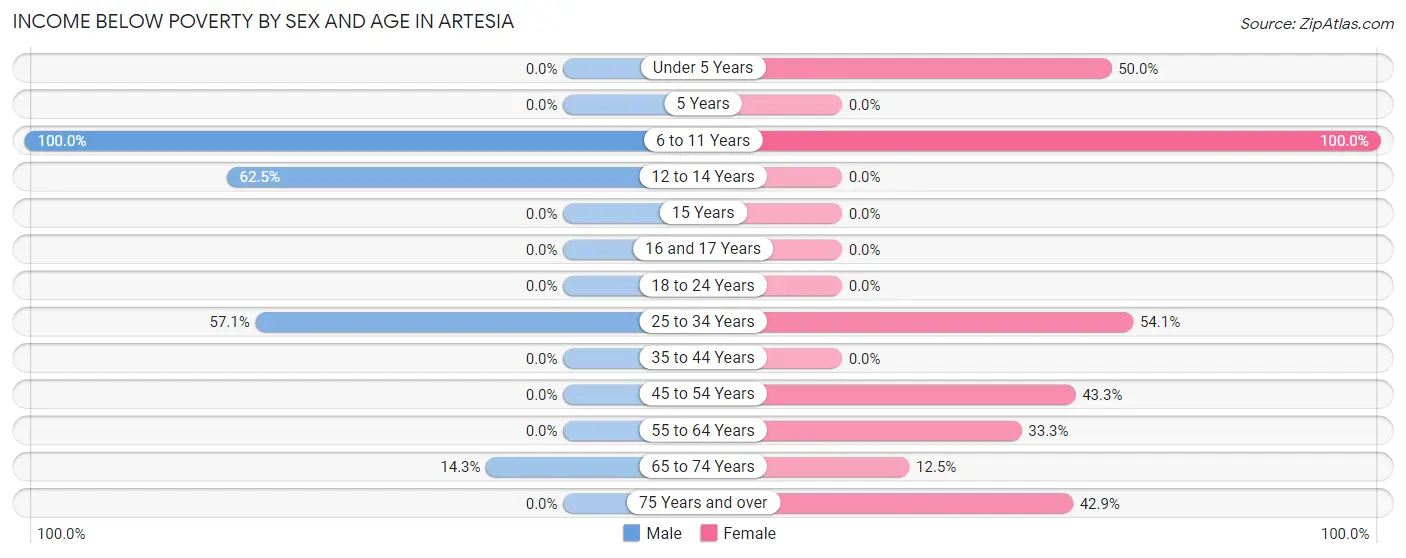
| Age Bracket | Male | Female |
| Under 5 Years | 0 (0.0%) | 2 (50.0%) |
| 5 Years | 0 (0.0%) | 0 (0.0%) |
| 6 to 11 Years | 1 (100.0%) | 34 (100.0%) |
| 12 to 14 Years | 5 (62.5%) | 0 (0.0%) |
| 15 Years | 0 (0.0%) | 0 (0.0%) |
| 16 and 17 Years | 0 (0.0%) | 0 (0.0%) |
| 18 to 24 Years | 0 (0.0%) | 0 (0.0%) |
| 25 to 34 Years | 20 (57.1%) | 20 (54.0%) |
| 35 to 44 Years | 0 (0.0%) | 0 (0.0%) |
| 45 to 54 Years | 0 (0.0%) | 13 (43.3%) |
| 55 to 64 Years | 0 (0.0%) | 9 (33.3%) |
| 65 to 74 Years | 7 (14.3%) | 3 (12.5%) |
| 75 Years and over | 0 (0.0%) | 3 (42.9%) |
| Total | 33 (20.0%) | 84 (40.2%) |
Income Above Poverty by Sex and Age in Artesia
According to the poverty statistics in Artesia, males aged under 5 years and females aged 12 to 14 years are the age groups that are most secure financially, with 100.0% of males and 100.0% of females in these age groups living above the poverty line.
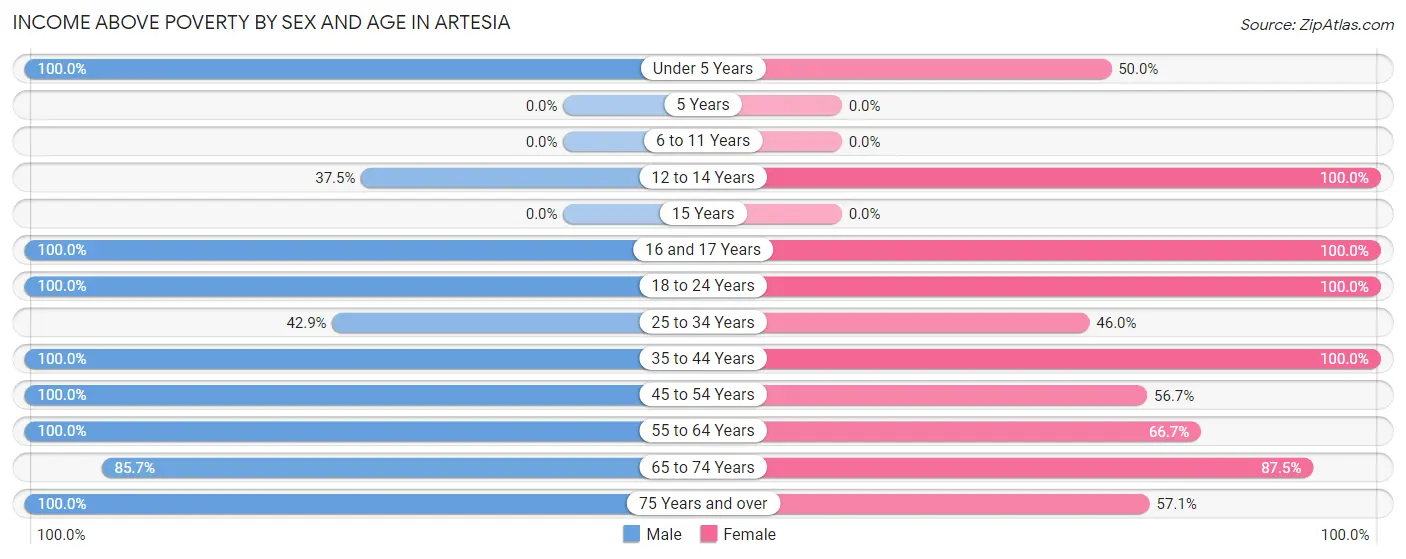
| Age Bracket | Male | Female |
| Under 5 Years | 4 (100.0%) | 2 (50.0%) |
| 5 Years | 0 (0.0%) | 0 (0.0%) |
| 6 to 11 Years | 0 (0.0%) | 0 (0.0%) |
| 12 to 14 Years | 3 (37.5%) | 17 (100.0%) |
| 15 Years | 0 (0.0%) | 0 (0.0%) |
| 16 and 17 Years | 9 (100.0%) | 7 (100.0%) |
| 18 to 24 Years | 18 (100.0%) | 11 (100.0%) |
| 25 to 34 Years | 15 (42.9%) | 17 (46.0%) |
| 35 to 44 Years | 7 (100.0%) | 11 (100.0%) |
| 45 to 54 Years | 11 (100.0%) | 17 (56.7%) |
| 55 to 64 Years | 16 (100.0%) | 18 (66.7%) |
| 65 to 74 Years | 42 (85.7%) | 21 (87.5%) |
| 75 Years and over | 7 (100.0%) | 4 (57.1%) |
| Total | 132 (80.0%) | 125 (59.8%) |
Income Below Poverty Among Married-Couple Families in Artesia
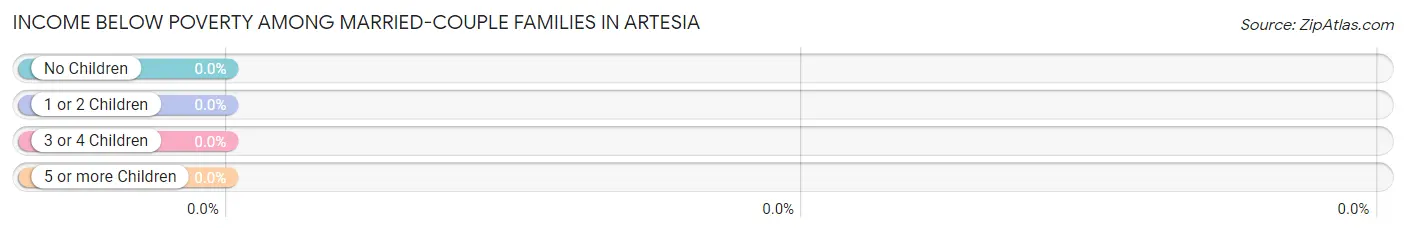
| Children | Above Poverty | Below Poverty |
| No Children | 33 (100.0%) | 0 (0.0%) |
| 1 or 2 Children | 7 (100.0%) | 0 (0.0%) |
| 3 or 4 Children | 0 (0.0%) | 0 (0.0%) |
| 5 or more Children | 0 (0.0%) | 0 (0.0%) |
| Total | 40 (100.0%) | 0 (0.0%) |
Income Below Poverty Among Single-Parent Households in Artesia
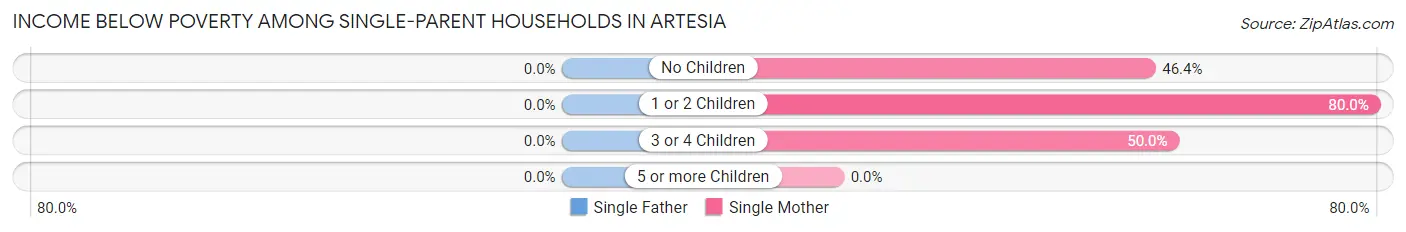
| Children | Single Father | Single Mother |
| No Children | 0 (0.0%) | 13 (46.4%) |
| 1 or 2 Children | 0 (0.0%) | 24 (80.0%) |
| 3 or 4 Children | 0 (0.0%) | 2 (50.0%) |
| 5 or more Children | 0 (0.0%) | 0 (0.0%) |
| Total | 0 (0.0%) | 39 (62.9%) |
Income Below Poverty Among Married-Couple vs Single-Parent Households in Artesia
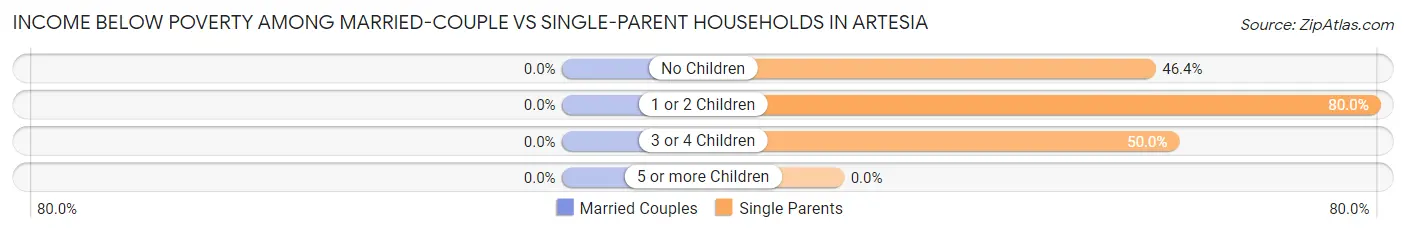
| Children | Married-Couple Families | Single-Parent Households |
| No Children | 0 (0.0%) | 13 (46.4%) |
| 1 or 2 Children | 0 (0.0%) | 24 (80.0%) |
| 3 or 4 Children | 0 (0.0%) | 2 (50.0%) |
| 5 or more Children | 0 (0.0%) | 0 (0.0%) |
| Total | 0 (0.0%) | 39 (62.9%) |
Race in Artesia
The most populous races in Artesia are Black / African American (343 | 91.7%), White / Caucasian (23 | 6.1%), and Two or more Races (8 | 2.1%).
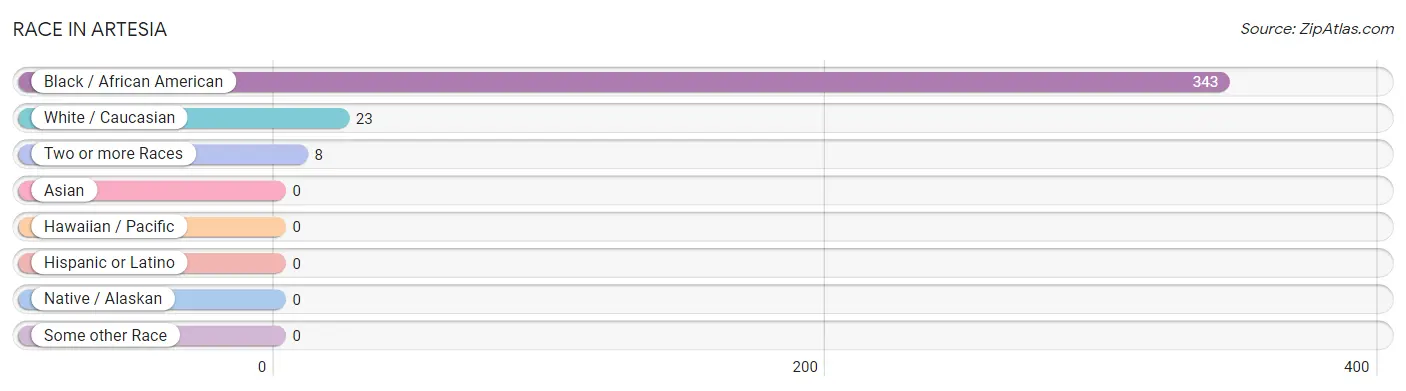
| Race | # Population | % Population |
| Asian | 0 | 0.0% |
| Black / African American | 343 | 91.7% |
| Hawaiian / Pacific | 0 | 0.0% |
| Hispanic or Latino | 0 | 0.0% |
| Native / Alaskan | 0 | 0.0% |
| White / Caucasian | 23 | 6.1% |
| Two or more Races | 8 | 2.1% |
| Some other Race | 0 | 0.0% |
| Total | 374 | 100.0% |
Ancestry in Artesia
The most populous ancestries reported in Artesia are African (9 | 2.4%), Subsaharan African (9 | 2.4%), English (8 | 2.1%), Irish (5 | 1.3%), and American (4 | 1.1%), together accounting for 9.4% of all Artesia residents.
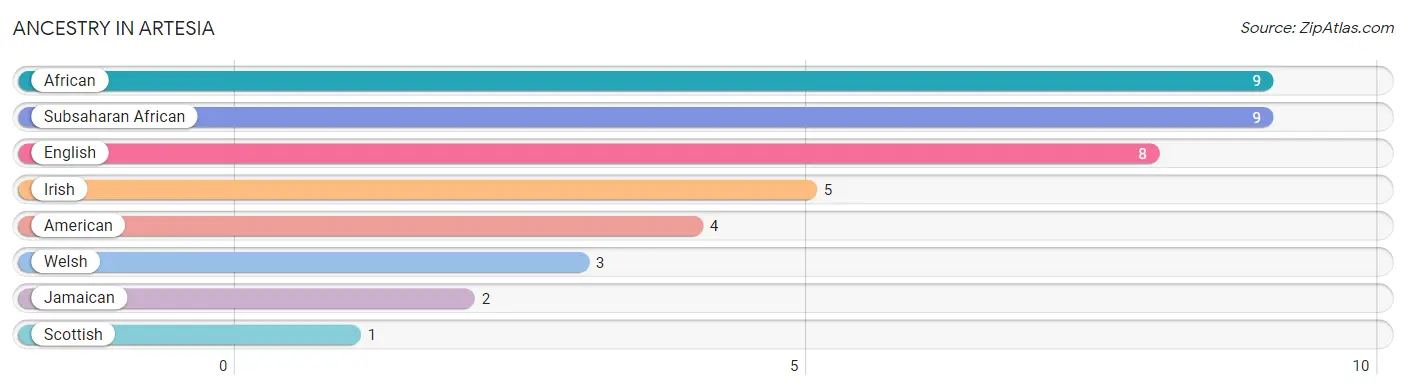
| Ancestry | # Population | % Population |
| African | 9 | 2.4% |
| American | 4 | 1.1% |
| English | 8 | 2.1% |
| Irish | 5 | 1.3% |
| Jamaican | 2 | 0.5% |
| Scottish | 1 | 0.3% |
| Subsaharan African | 9 | 2.4% |
| Welsh | 3 | 0.8% | View All 8 Rows |
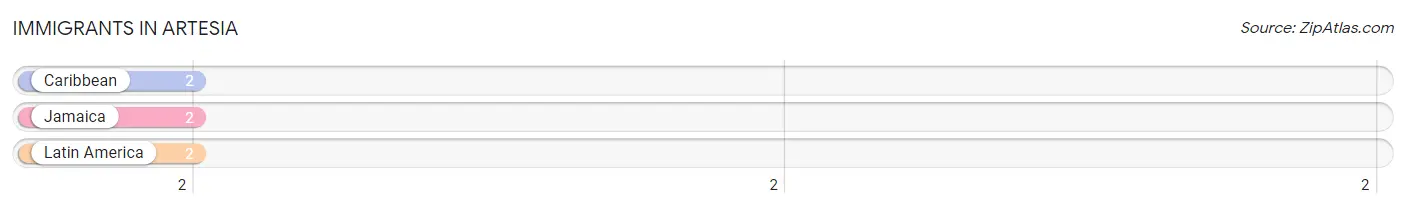
Immigrants in Artesia
The most numerous immigrant groups reported in Artesia came from Caribbean (2 | 0.5%), Jamaica (2 | 0.5%), and Latin America (2 | 0.5%), together accounting for 1.6% of all Artesia residents.
| Immigration Origin | # Population | % Population |
| Caribbean | 2 | 0.5% |
| Jamaica | 2 | 0.5% |
| Latin America | 2 | 0.5% | View All 3 Rows |
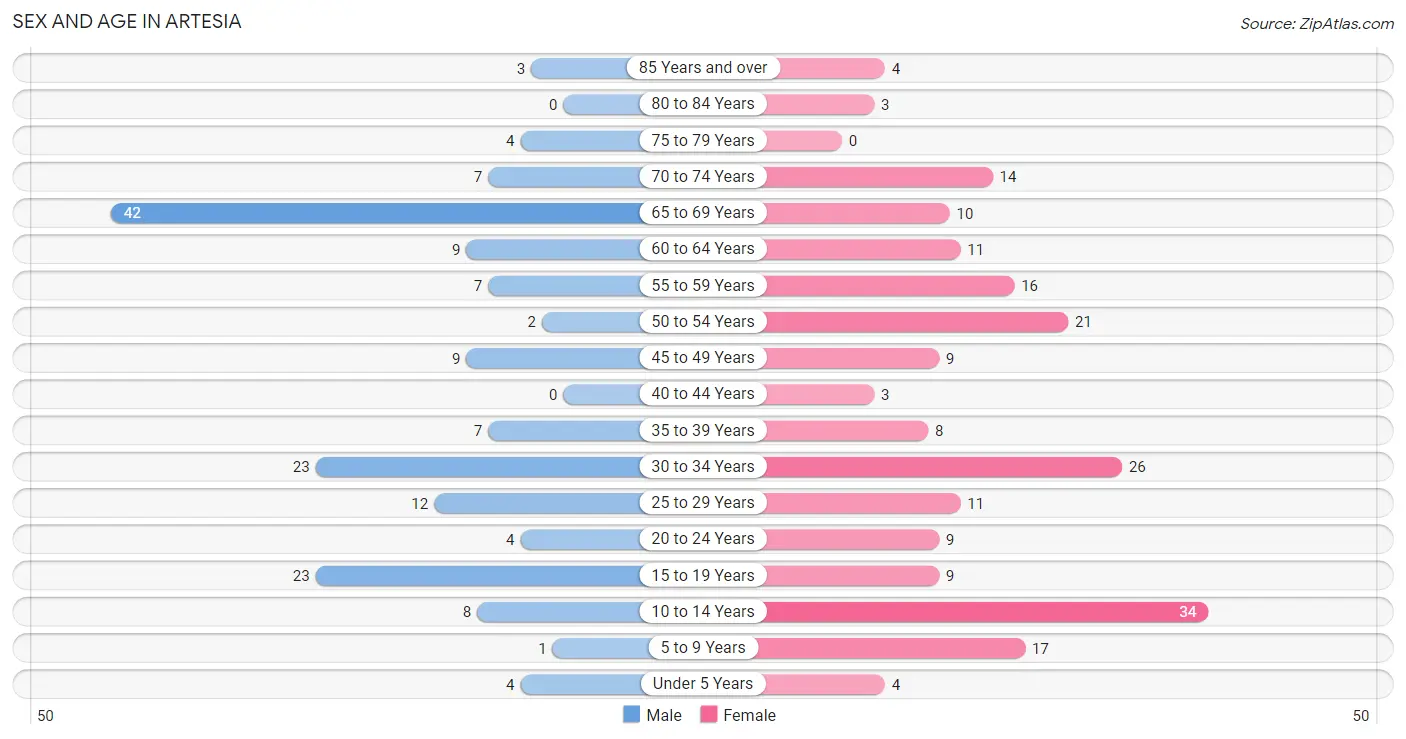
Sex and Age in Artesia
Sex and Age in Artesia
The most populous age groups in Artesia are 65 to 69 Years (42 | 25.5%) for men and 10 to 14 Years (34 | 16.3%) for women.
| Age Bracket | Male | Female |
| Under 5 Years | 4 (2.4%) | 4 (1.9%) |
| 5 to 9 Years | 1 (0.6%) | 17 (8.1%) |
| 10 to 14 Years | 8 (4.9%) | 34 (16.3%) |
| 15 to 19 Years | 23 (13.9%) | 9 (4.3%) |
| 20 to 24 Years | 4 (2.4%) | 9 (4.3%) |
| 25 to 29 Years | 12 (7.3%) | 11 (5.3%) |
| 30 to 34 Years | 23 (13.9%) | 26 (12.4%) |
| 35 to 39 Years | 7 (4.2%) | 8 (3.8%) |
| 40 to 44 Years | 0 (0.0%) | 3 (1.4%) |
| 45 to 49 Years | 9 (5.4%) | 9 (4.3%) |
| 50 to 54 Years | 2 (1.2%) | 21 (10.1%) |
| 55 to 59 Years | 7 (4.2%) | 16 (7.7%) |
| 60 to 64 Years | 9 (5.4%) | 11 (5.3%) |
| 65 to 69 Years | 42 (25.5%) | 10 (4.8%) |
| 70 to 74 Years | 7 (4.2%) | 14 (6.7%) |
| 75 to 79 Years | 4 (2.4%) | 0 (0.0%) |
| 80 to 84 Years | 0 (0.0%) | 3 (1.4%) |
| 85 Years and over | 3 (1.8%) | 4 (1.9%) |
| Total | 165 (100.0%) | 209 (100.0%) |
Families and Households in Artesia
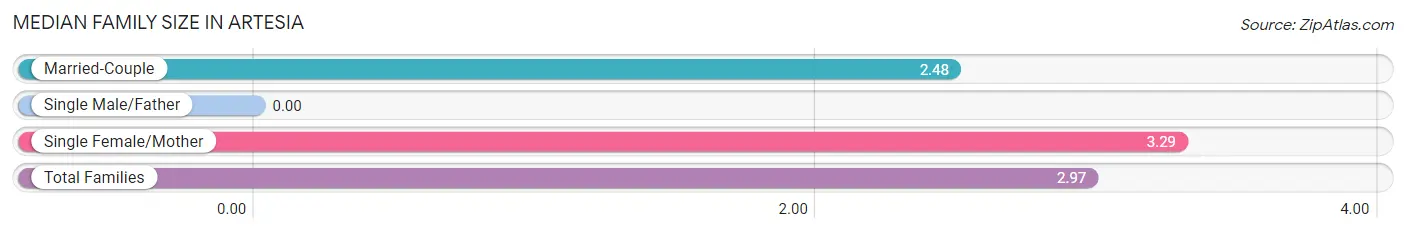
Median Family Size in Artesia
| Family Type | # Families | Family Size |
| Married-Couple | 40 (39.2%) | 2.48 |
| Single Male/Father | 0 (0.0%) | - |
| Single Female/Mother | 62 (60.8%) | 3.29 |
| Total Families | 102 (100.0%) | 2.97 |
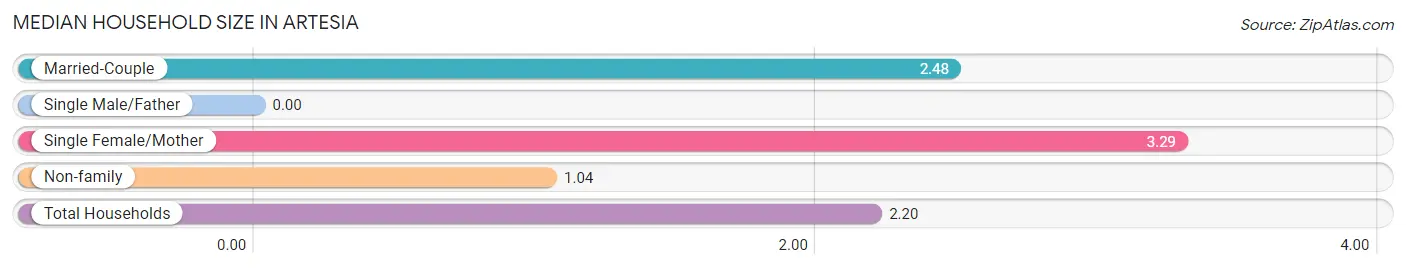
Median Household Size in Artesia
| Household Type | # Households | Household Size |
| Married-Couple | 40 (23.5%) | 2.48 |
| Single Male/Father | 0 (0.0%) | - |
| Single Female/Mother | 62 (36.5%) | 3.29 |
| Non-family | 68 (40.0%) | 1.04 |
| Total Households | 170 (100.0%) | 2.20 |
Household Size by Marriage Status in Artesia
Out of a total of 170 households in Artesia, 102 (60.0%) are family households, while 68 (40.0%) are nonfamily households. The most numerous type of family households are 2-person households, comprising 60, and the most common type of nonfamily households are 1-person households, comprising 65.
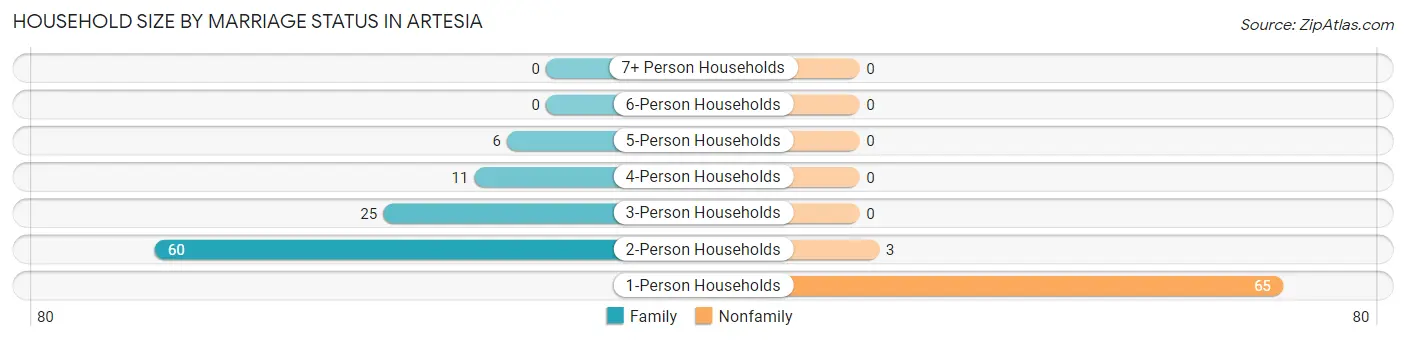
| Household Size | Family Households | Nonfamily Households |
| 1-Person Households | - | 65 (38.2%) |
| 2-Person Households | 60 (35.3%) | 3 (1.8%) |
| 3-Person Households | 25 (14.7%) | 0 (0.0%) |
| 4-Person Households | 11 (6.5%) | 0 (0.0%) |
| 5-Person Households | 6 (3.5%) | 0 (0.0%) |
| 6-Person Households | 0 (0.0%) | 0 (0.0%) |
| 7+ Person Households | 0 (0.0%) | 0 (0.0%) |
| Total | 102 (60.0%) | 68 (40.0%) |
Female Fertility in Artesia
Fertility by Age in Artesia
Average fertility rate in Artesia is 25.0 births per 1,000 women. Women in the age bracket of 20 to 34 years have the highest fertility rate with 43.0 births per 1,000 women. Women in the age bracket of 20 to 34 years acount for 100.0% of all women with births.
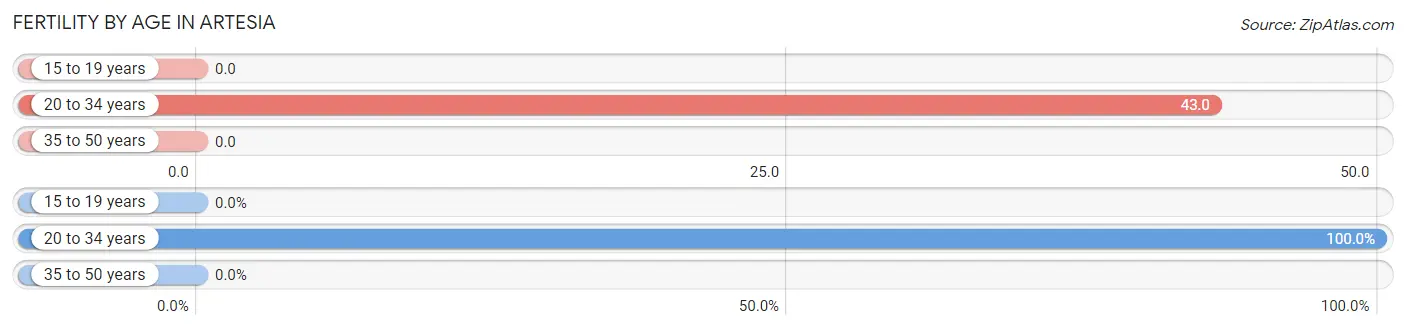
| Age Bracket | Women with Births | Births / 1,000 Women |
| 15 to 19 years | 0 (0.0%) | 0.0 |
| 20 to 34 years | 2 (100.0%) | 43.0 |
| 35 to 50 years | 0 (0.0%) | 0.0 |
| Total | 2 (100.0%) | 25.0 |
Fertility by Age by Marriage Status in Artesia
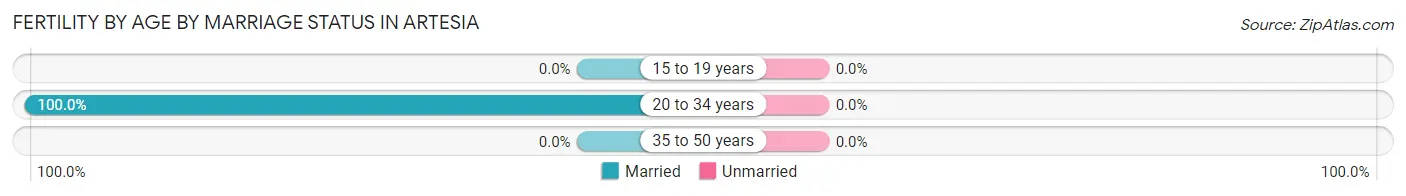
| Age Bracket | Married | Unmarried |
| 15 to 19 years | 0 (0.0%) | 0 (0.0%) |
| 20 to 34 years | 2 (100.0%) | 0 (0.0%) |
| 35 to 50 years | 0 (0.0%) | 0 (0.0%) |
| Total | 2 (100.0%) | 0 (0.0%) |
Fertility by Education in Artesia
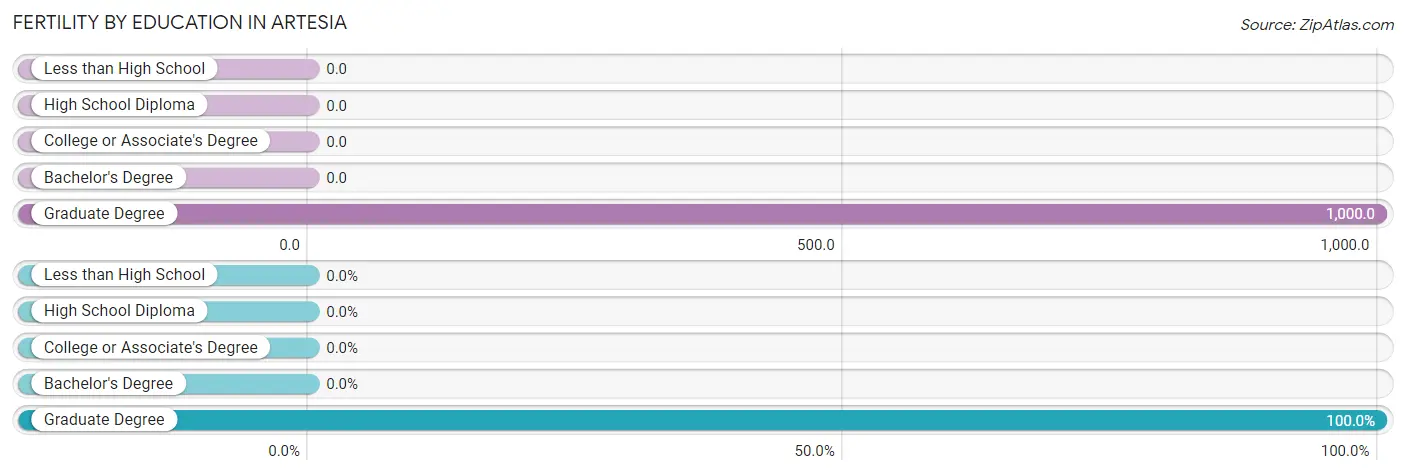
| Educational Attainment | Women with Births | Births / 1,000 Women |
| Less than High School | 0 (0.0%) | 0.0 |
| High School Diploma | 0 (0.0%) | 0.0 |
| College or Associate's Degree | 0 (0.0%) | 0.0 |
| Bachelor's Degree | 0 (0.0%) | 0.0 |
| Graduate Degree | 2 (100.0%) | 1,000.0 |
| Total | 2 (100.0%) | 25.0 |
Fertility by Education by Marriage Status in Artesia
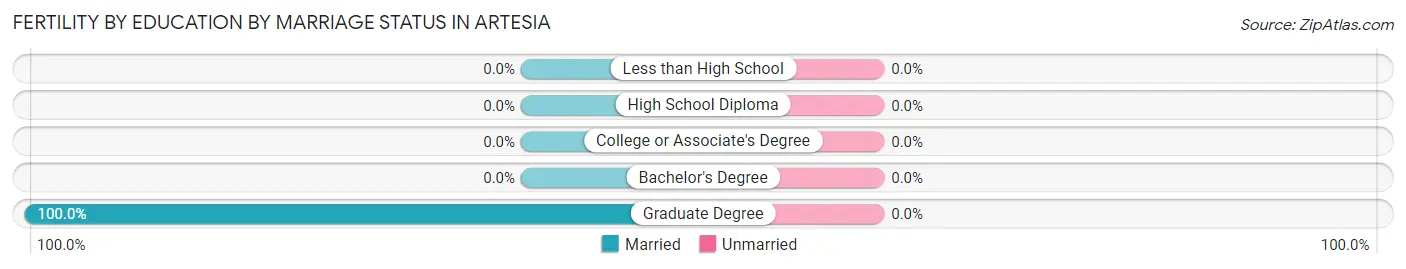
| Educational Attainment | Married | Unmarried |
| Less than High School | 0 (0.0%) | 0 (0.0%) |
| High School Diploma | 0 (0.0%) | 0 (0.0%) |
| College or Associate's Degree | 0 (0.0%) | 0 (0.0%) |
| Bachelor's Degree | 0 (0.0%) | 0 (0.0%) |
| Graduate Degree | 2 (100.0%) | 0 (0.0%) |
| Total | 2 (100.0%) | 0 (0.0%) |
Employment Characteristics in Artesia
Employment by Class of Employer in Artesia
Among the 128 employed individuals in Artesia, private company employees (67 | 52.3%), state government employees (22 | 17.2%), and local government employees (21 | 16.4%) make up the most common classes of employment.
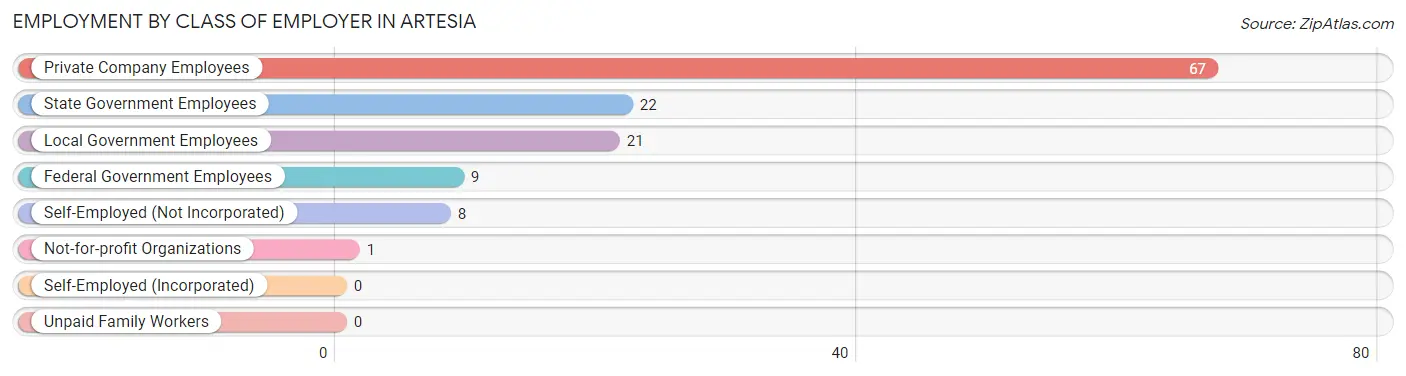
| Employer Class | # Employees | % Employees |
| Private Company Employees | 67 | 52.3% |
| Self-Employed (Incorporated) | 0 | 0.0% |
| Self-Employed (Not Incorporated) | 8 | 6.2% |
| Not-for-profit Organizations | 1 | 0.8% |
| Local Government Employees | 21 | 16.4% |
| State Government Employees | 22 | 17.2% |
| Federal Government Employees | 9 | 7.0% |
| Unpaid Family Workers | 0 | 0.0% |
| Total | 128 | 100.0% |
Employment Status by Age in Artesia
According to the labor force statistics for Artesia, out of the total population over 16 years of age (306), 42.5% or 130 individuals are in the labor force, with 1.5% or 2 of them unemployed. The age group with the highest labor force participation rate is 35 to 44 years, with 100.0% or 18 individuals in the labor force. Within the labor force, the 35 to 44 years age range has the highest percentage of unemployed individuals, with 11.1% or 2 of them being unemployed.
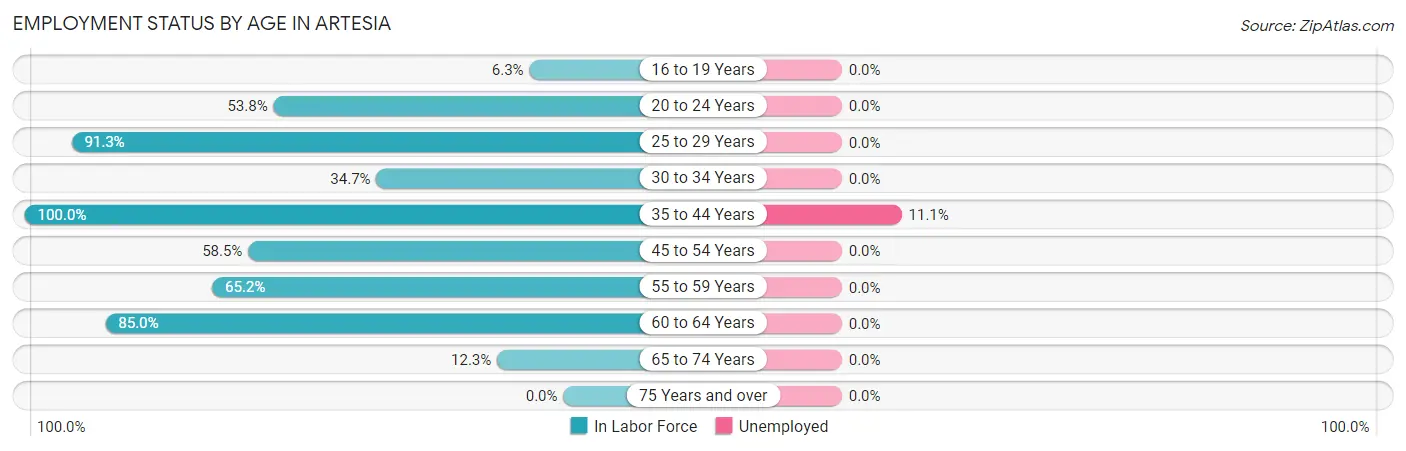
| Age Bracket | In Labor Force | Unemployed |
| 16 to 19 Years | 2 (6.3%) | 0 (0.0%) |
| 20 to 24 Years | 7 (53.8%) | 0 (0.0%) |
| 25 to 29 Years | 21 (91.3%) | 0 (0.0%) |
| 30 to 34 Years | 17 (34.7%) | 0 (0.0%) |
| 35 to 44 Years | 18 (100.0%) | 2 (11.1%) |
| 45 to 54 Years | 24 (58.5%) | 0 (0.0%) |
| 55 to 59 Years | 15 (65.2%) | 0 (0.0%) |
| 60 to 64 Years | 17 (85.0%) | 0 (0.0%) |
| 65 to 74 Years | 9 (12.3%) | 0 (0.0%) |
| 75 Years and over | 0 (0.0%) | 0 (0.0%) |
| Total | 130 (42.5%) | 2 (1.5%) |
Employment Status by Educational Attainment in Artesia
According to labor force statistics for Artesia, 64.4% of individuals (112) out of the total population between 25 and 64 years of age (174) are in the labor force, with 1.8% or 2 of them being unemployed. The group with the highest labor force participation rate are those with the educational attainment of college / associate degree, with 80.3% or 53 individuals in the labor force. Within the labor force, individuals with high school diploma education have the highest percentage of unemployment, with 4.5% or 2 of them being unemployed.
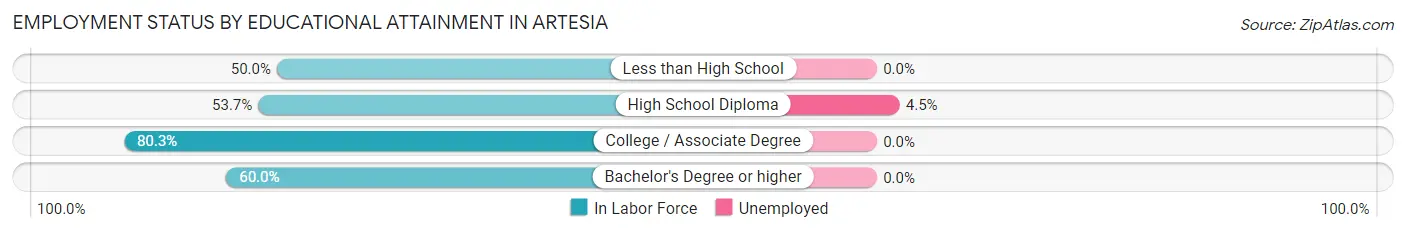
| Educational Attainment | In Labor Force | Unemployed |
| Less than High School | 3 (50.0%) | 0 (0.0%) |
| High School Diploma | 44 (53.7%) | 4 (4.5%) |
| College / Associate Degree | 53 (80.3%) | 0 (0.0%) |
| Bachelor's Degree or higher | 12 (60.0%) | 0 (0.0%) |
| Total | 112 (64.4%) | 3 (1.8%) |
Employment Occupations by Sex in Artesia
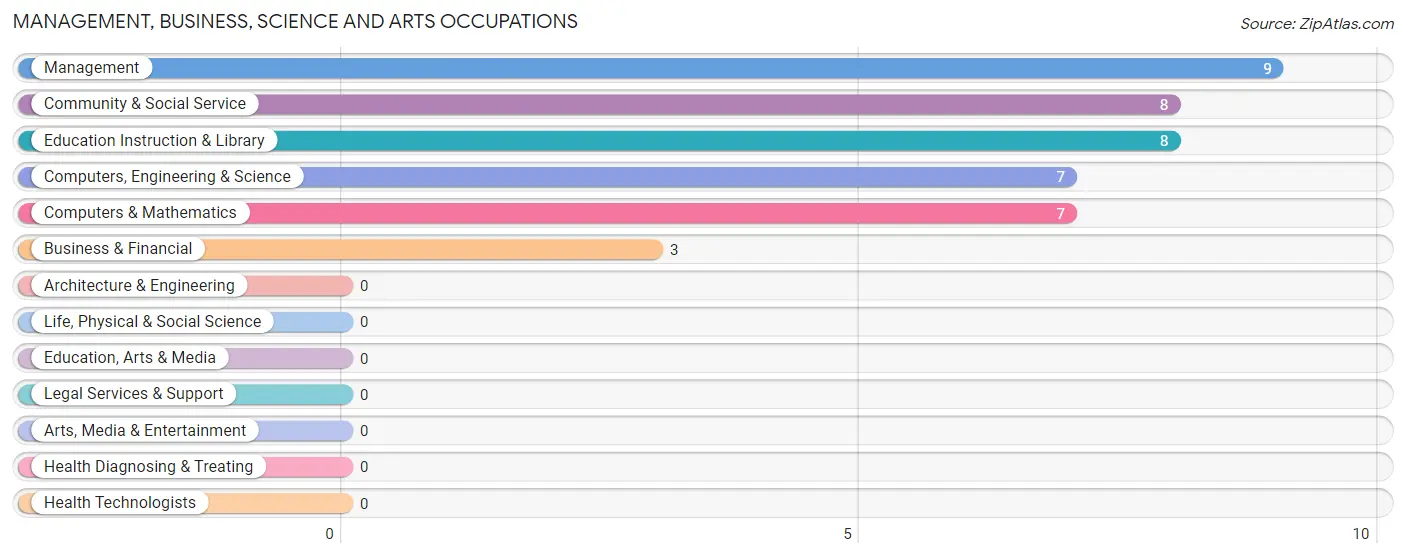
Management, Business, Science and Arts Occupations
The most common Management, Business, Science and Arts occupations in Artesia are Management (9 | 7.0%), Community & Social Service (8 | 6.2%), Education Instruction & Library (8 | 6.2%), Computers, Engineering & Science (7 | 5.5%), and Computers & Mathematics (7 | 5.5%).
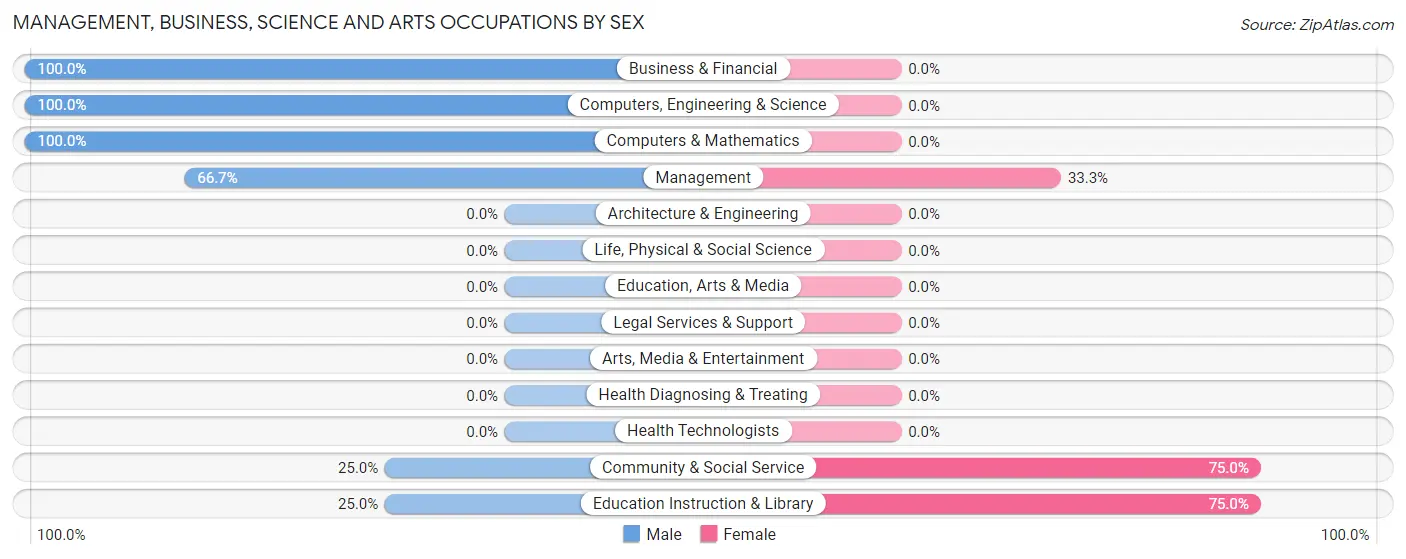
Management, Business, Science and Arts Occupations by Sex
Within the Management, Business, Science and Arts occupations in Artesia, the most male-oriented occupations are Business & Financial (100.0%), Computers, Engineering & Science (100.0%), and Computers & Mathematics (100.0%), while the most female-oriented occupations are Community & Social Service (75.0%), Education Instruction & Library (75.0%), and Management (33.3%).
| Occupation | Male | Female |
| Management | 6 (66.7%) | 3 (33.3%) |
| Business & Financial | 3 (100.0%) | 0 (0.0%) |
| Computers, Engineering & Science | 7 (100.0%) | 0 (0.0%) |
| Computers & Mathematics | 7 (100.0%) | 0 (0.0%) |
| Architecture & Engineering | 0 (0.0%) | 0 (0.0%) |
| Life, Physical & Social Science | 0 (0.0%) | 0 (0.0%) |
| Community & Social Service | 2 (25.0%) | 6 (75.0%) |
| Education, Arts & Media | 0 (0.0%) | 0 (0.0%) |
| Legal Services & Support | 0 (0.0%) | 0 (0.0%) |
| Education Instruction & Library | 2 (25.0%) | 6 (75.0%) |
| Arts, Media & Entertainment | 0 (0.0%) | 0 (0.0%) |
| Health Diagnosing & Treating | 0 (0.0%) | 0 (0.0%) |
| Health Technologists | 0 (0.0%) | 0 (0.0%) |
| Total (Category) | 18 (66.7%) | 9 (33.3%) |
| Total (Overall) | 61 (47.7%) | 67 (52.3%) |
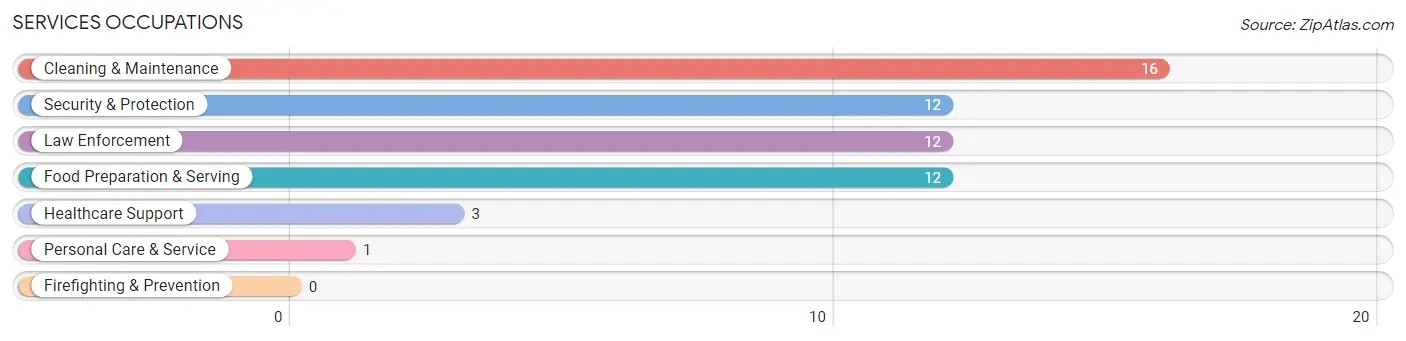
Services Occupations
The most common Services occupations in Artesia are Cleaning & Maintenance (16 | 12.5%), Security & Protection (12 | 9.4%), Law Enforcement (12 | 9.4%), Food Preparation & Serving (12 | 9.4%), and Healthcare Support (3 | 2.3%).
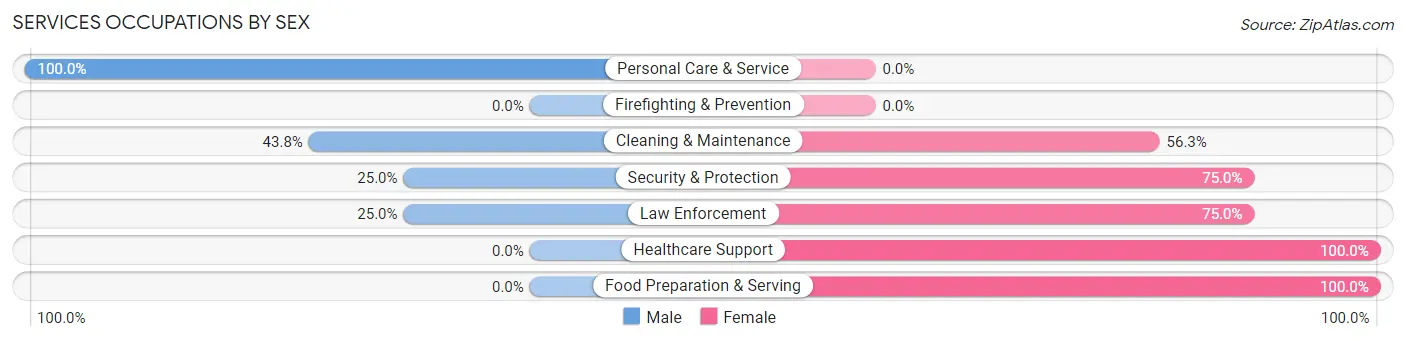
Services Occupations by Sex
Within the Services occupations in Artesia, the most male-oriented occupations are Personal Care & Service (100.0%), Cleaning & Maintenance (43.8%), and Security & Protection (25.0%), while the most female-oriented occupations are Healthcare Support (100.0%), Food Preparation & Serving (100.0%), and Security & Protection (75.0%).
| Occupation | Male | Female |
| Healthcare Support | 0 (0.0%) | 3 (100.0%) |
| Security & Protection | 3 (25.0%) | 9 (75.0%) |
| Firefighting & Prevention | 0 (0.0%) | 0 (0.0%) |
| Law Enforcement | 3 (25.0%) | 9 (75.0%) |
| Food Preparation & Serving | 0 (0.0%) | 12 (100.0%) |
| Cleaning & Maintenance | 7 (43.8%) | 9 (56.2%) |
| Personal Care & Service | 1 (100.0%) | 0 (0.0%) |
| Total (Category) | 11 (25.0%) | 33 (75.0%) |
| Total (Overall) | 61 (47.7%) | 67 (52.3%) |
Sales and Office Occupations
The most common Sales and Office occupations in Artesia are Office & Administration (10 | 7.8%), and Sales & Related (2 | 1.6%).
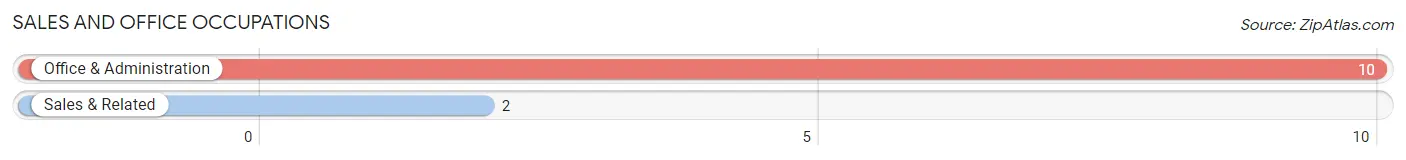
Sales and Office Occupations by Sex
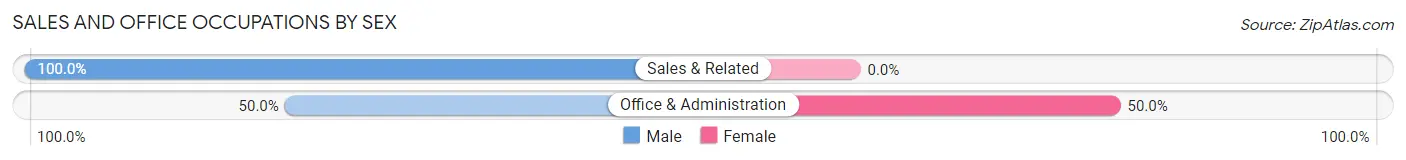
| Occupation | Male | Female |
| Sales & Related | 2 (100.0%) | 0 (0.0%) |
| Office & Administration | 5 (50.0%) | 5 (50.0%) |
| Total (Category) | 7 (58.3%) | 5 (41.7%) |
| Total (Overall) | 61 (47.7%) | 67 (52.3%) |
Natural Resources, Construction and Maintenance Occupations
The most common Natural Resources, Construction and Maintenance occupations in Artesia are Construction & Extraction (5 | 3.9%), Installation, Maintenance & Repair (3 | 2.3%), and Farming, Fishing & Forestry (2 | 1.6%).
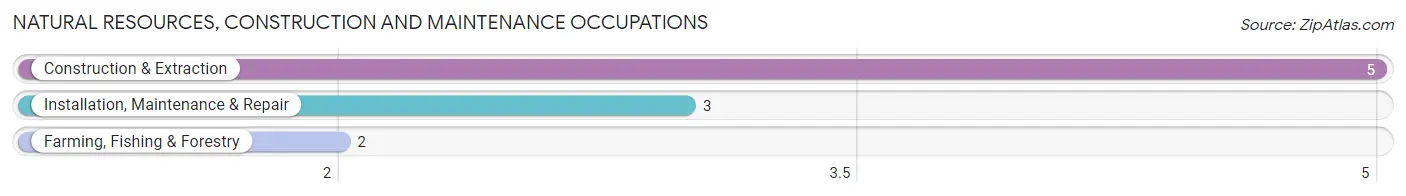
Natural Resources, Construction and Maintenance Occupations by Sex
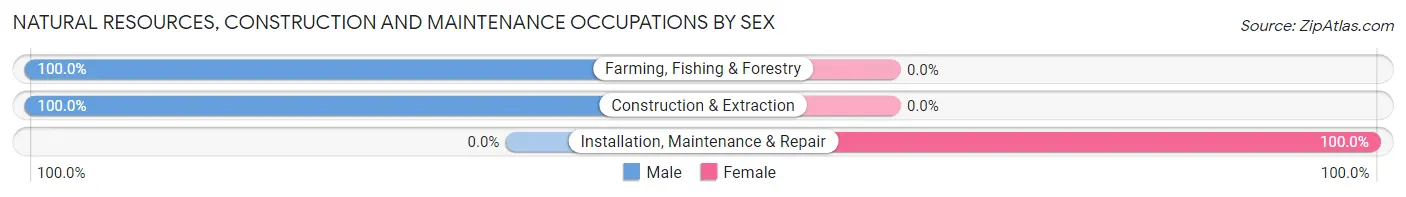
| Occupation | Male | Female |
| Farming, Fishing & Forestry | 2 (100.0%) | 0 (0.0%) |
| Construction & Extraction | 5 (100.0%) | 0 (0.0%) |
| Installation, Maintenance & Repair | 0 (0.0%) | 3 (100.0%) |
| Total (Category) | 7 (70.0%) | 3 (30.0%) |
| Total (Overall) | 61 (47.7%) | 67 (52.3%) |
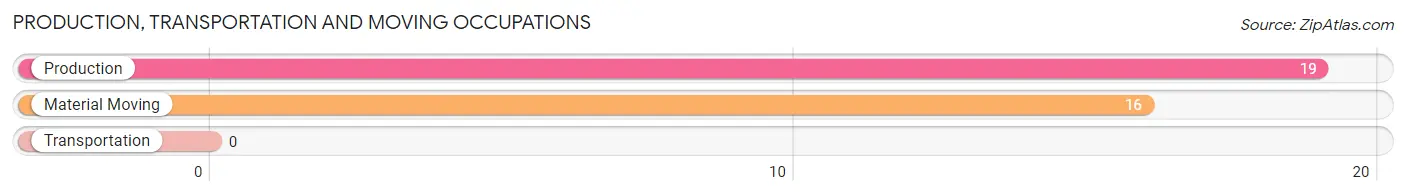
Production, Transportation and Moving Occupations
The most common Production, Transportation and Moving occupations in Artesia are Production (19 | 14.8%), and Material Moving (16 | 12.5%).
Production, Transportation and Moving Occupations by Sex
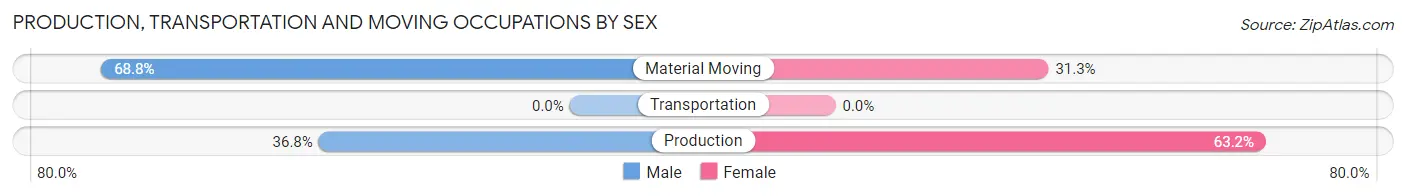
| Occupation | Male | Female |
| Production | 7 (36.8%) | 12 (63.2%) |
| Transportation | 0 (0.0%) | 0 (0.0%) |
| Material Moving | 11 (68.8%) | 5 (31.2%) |
| Total (Category) | 18 (51.4%) | 17 (48.6%) |
| Total (Overall) | 61 (47.7%) | 67 (52.3%) |
Employment Industries by Sex in Artesia
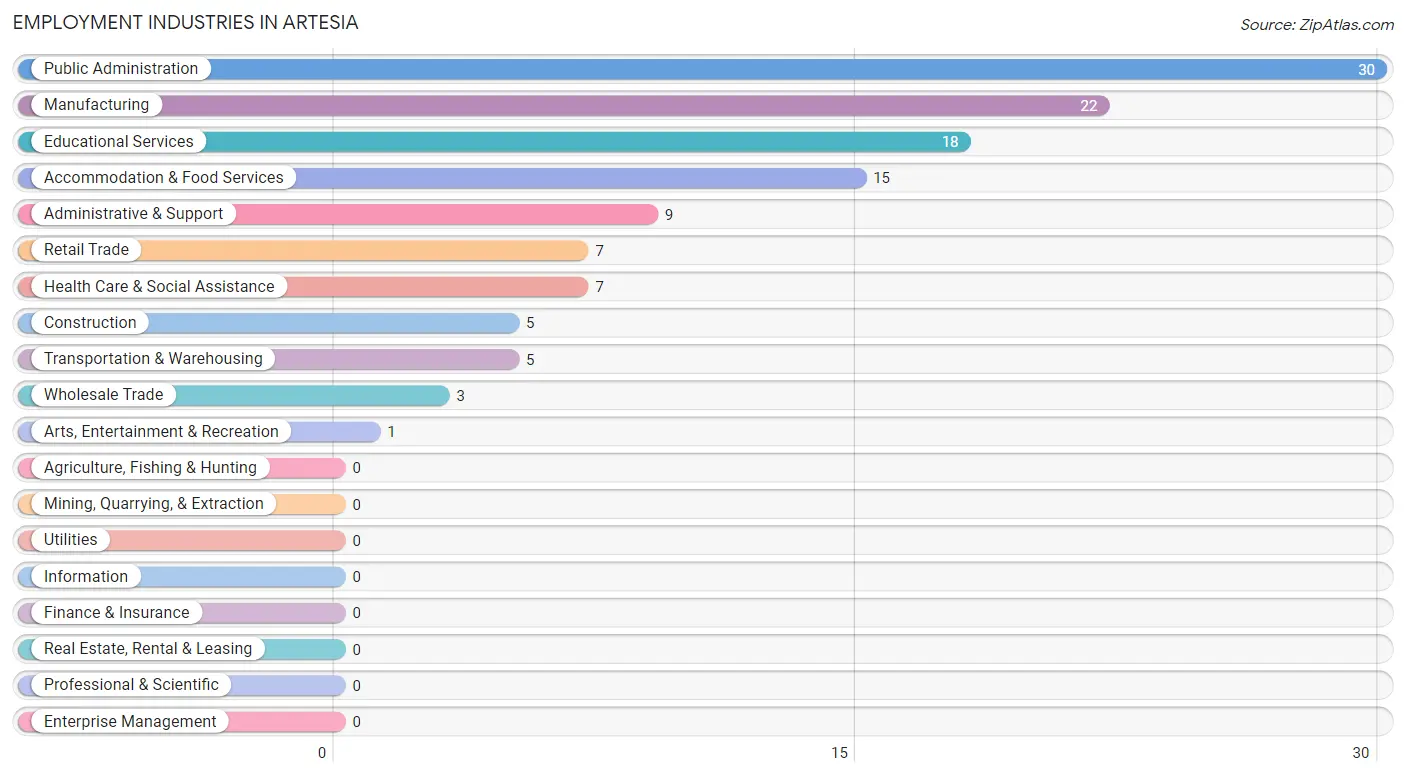
Employment Industries in Artesia
The major employment industries in Artesia include Public Administration (30 | 23.4%), Manufacturing (22 | 17.2%), Educational Services (18 | 14.1%), Accommodation & Food Services (15 | 11.7%), and Administrative & Support (9 | 7.0%).
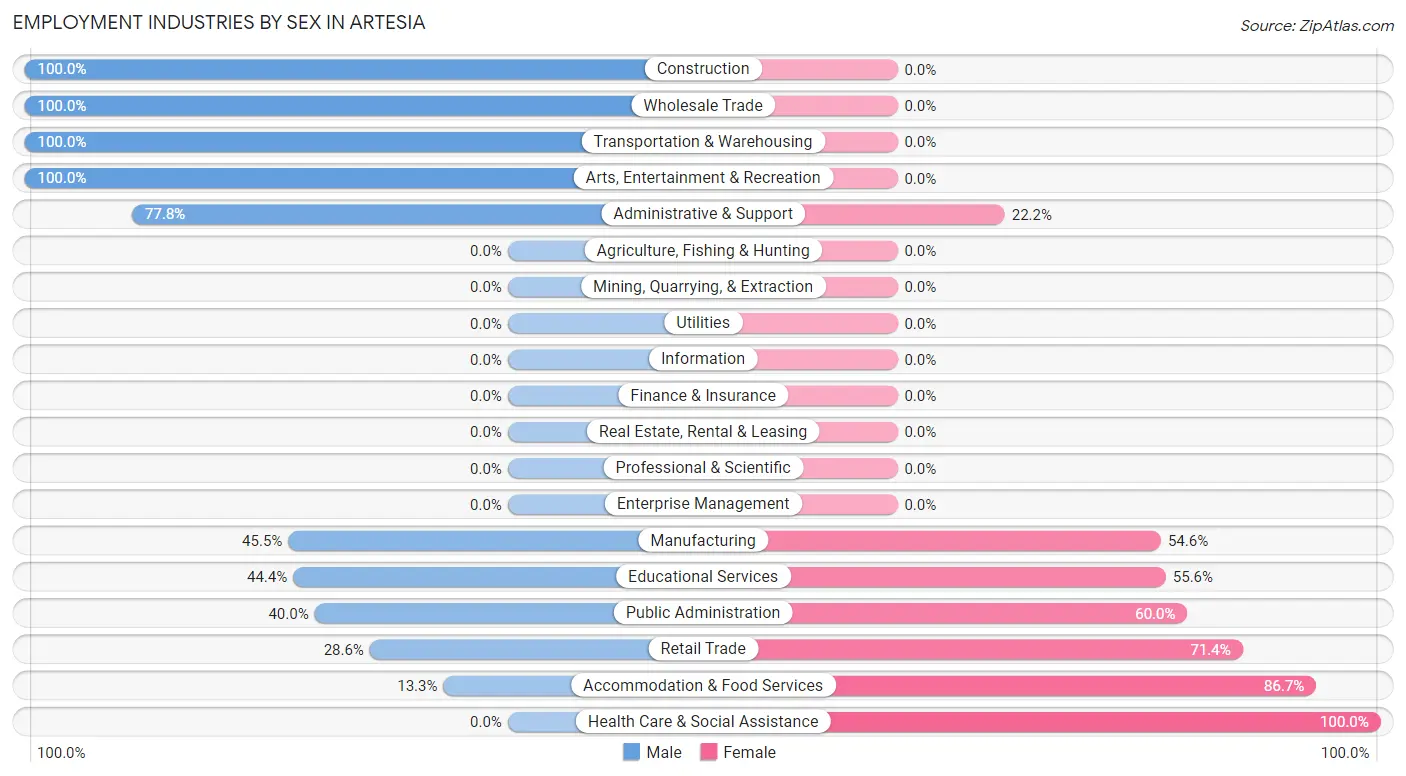
Employment Industries by Sex in Artesia
The Artesia industries that see more men than women are Construction (100.0%), Wholesale Trade (100.0%), and Transportation & Warehousing (100.0%), whereas the industries that tend to have a higher number of women are Health Care & Social Assistance (100.0%), Accommodation & Food Services (86.7%), and Retail Trade (71.4%).
| Industry | Male | Female |
| Agriculture, Fishing & Hunting | 0 (0.0%) | 0 (0.0%) |
| Mining, Quarrying, & Extraction | 0 (0.0%) | 0 (0.0%) |
| Construction | 5 (100.0%) | 0 (0.0%) |
| Manufacturing | 10 (45.5%) | 12 (54.5%) |
| Wholesale Trade | 3 (100.0%) | 0 (0.0%) |
| Retail Trade | 2 (28.6%) | 5 (71.4%) |
| Transportation & Warehousing | 5 (100.0%) | 0 (0.0%) |
| Utilities | 0 (0.0%) | 0 (0.0%) |
| Information | 0 (0.0%) | 0 (0.0%) |
| Finance & Insurance | 0 (0.0%) | 0 (0.0%) |
| Real Estate, Rental & Leasing | 0 (0.0%) | 0 (0.0%) |
| Professional & Scientific | 0 (0.0%) | 0 (0.0%) |
| Enterprise Management | 0 (0.0%) | 0 (0.0%) |
| Administrative & Support | 7 (77.8%) | 2 (22.2%) |
| Educational Services | 8 (44.4%) | 10 (55.6%) |
| Health Care & Social Assistance | 0 (0.0%) | 7 (100.0%) |
| Arts, Entertainment & Recreation | 1 (100.0%) | 0 (0.0%) |
| Accommodation & Food Services | 2 (13.3%) | 13 (86.7%) |
| Public Administration | 12 (40.0%) | 18 (60.0%) |
| Total | 61 (47.7%) | 67 (52.3%) |
Education in Artesia
School Enrollment in Artesia
The most common levels of schooling among the 107 students in Artesia are middle school (42 | 39.3%), college / undergraduate (26 | 24.3%), and elementary school (18 | 16.8%).
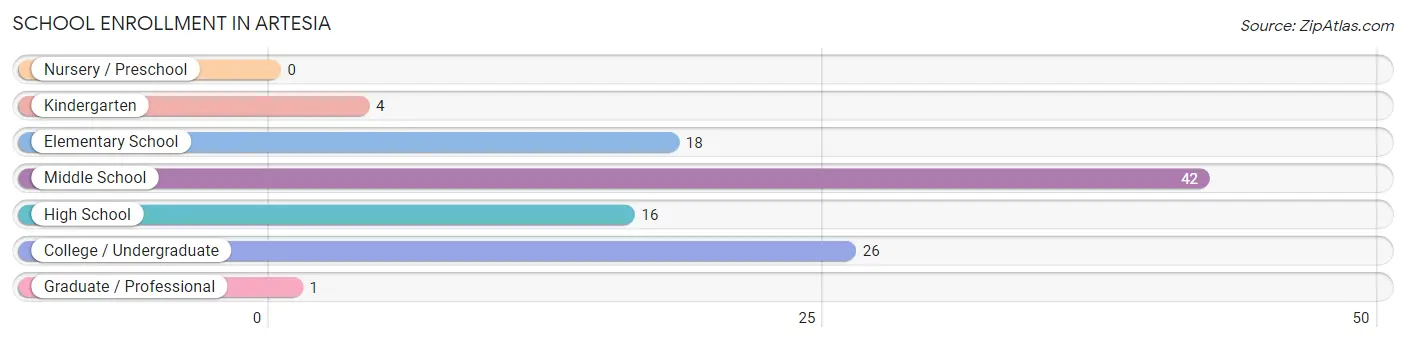
| School Level | # Students | % Students |
| Nursery / Preschool | 0 | 0.0% |
| Kindergarten | 4 | 3.7% |
| Elementary School | 18 | 16.8% |
| Middle School | 42 | 39.3% |
| High School | 16 | 14.9% |
| College / Undergraduate | 26 | 24.3% |
| Graduate / Professional | 1 | 0.9% |
| Total | 107 | 100.0% |
School Enrollment by Age by Funding Source in Artesia
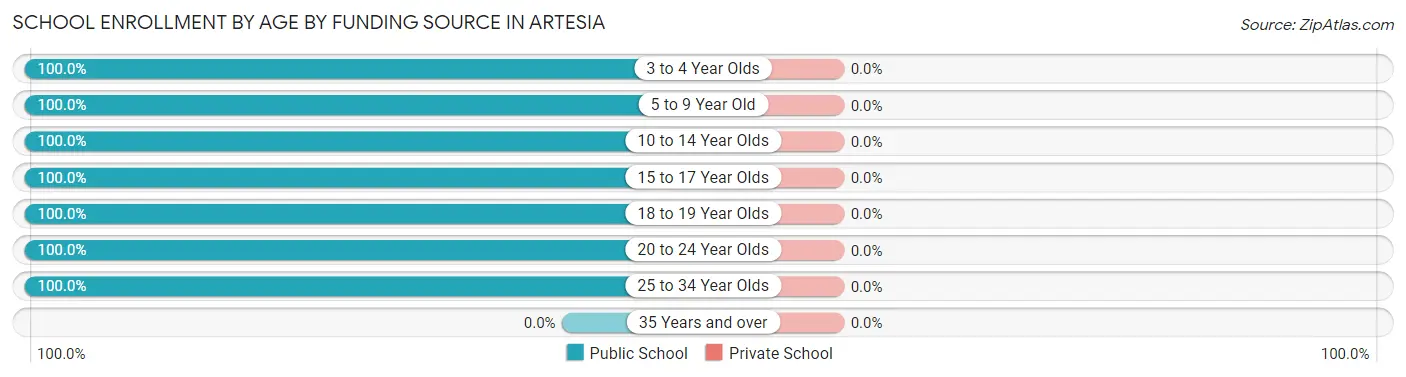
| Age Bracket | Public School | Private School |
| 3 to 4 Year Olds | 4 (100.0%) | 0 (0.0%) |
| 5 to 9 Year Old | 18 (100.0%) | 0 (0.0%) |
| 10 to 14 Year Olds | 42 (100.0%) | 0 (0.0%) |
| 15 to 17 Year Olds | 16 (100.0%) | 0 (0.0%) |
| 18 to 19 Year Olds | 14 (100.0%) | 0 (0.0%) |
| 20 to 24 Year Olds | 6 (100.0%) | 0 (0.0%) |
| 25 to 34 Year Olds | 7 (100.0%) | 0 (0.0%) |
| 35 Years and over | 0 (0.0%) | 0 (0.0%) |
| Total | 107 (100.0%) | 0 (0.0%) |
Educational Attainment by Field of Study in Artesia
Computers & mathematics (7 | 26.9%), psychology (6 | 23.1%), business (4 | 15.4%), education (4 | 15.4%), and science & technology (2 | 7.7%) are the most common fields of study among 26 individuals in Artesia who have obtained a bachelor's degree or higher.
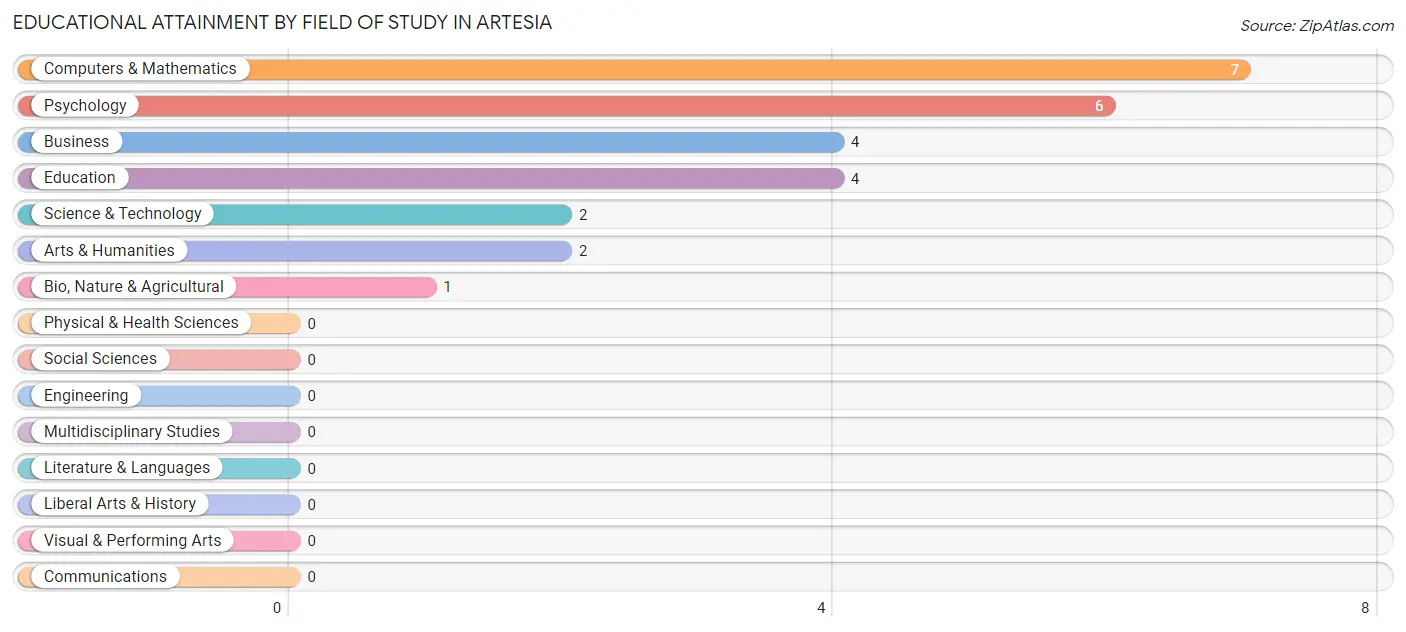
| Field of Study | # Graduates | % Graduates |
| Computers & Mathematics | 7 | 26.9% |
| Bio, Nature & Agricultural | 1 | 3.8% |
| Physical & Health Sciences | 0 | 0.0% |
| Psychology | 6 | 23.1% |
| Social Sciences | 0 | 0.0% |
| Engineering | 0 | 0.0% |
| Multidisciplinary Studies | 0 | 0.0% |
| Science & Technology | 2 | 7.7% |
| Business | 4 | 15.4% |
| Education | 4 | 15.4% |
| Literature & Languages | 0 | 0.0% |
| Liberal Arts & History | 0 | 0.0% |
| Visual & Performing Arts | 0 | 0.0% |
| Communications | 0 | 0.0% |
| Arts & Humanities | 2 | 7.7% |
| Total | 26 | 100.0% |
Transportation & Commute in Artesia
Vehicle Availability by Sex in Artesia
The most prevalent vehicle ownership categories in Artesia are males with 2 vehicles (26, accounting for 42.6%) and females with 2 vehicles (24, making up 38.8%).
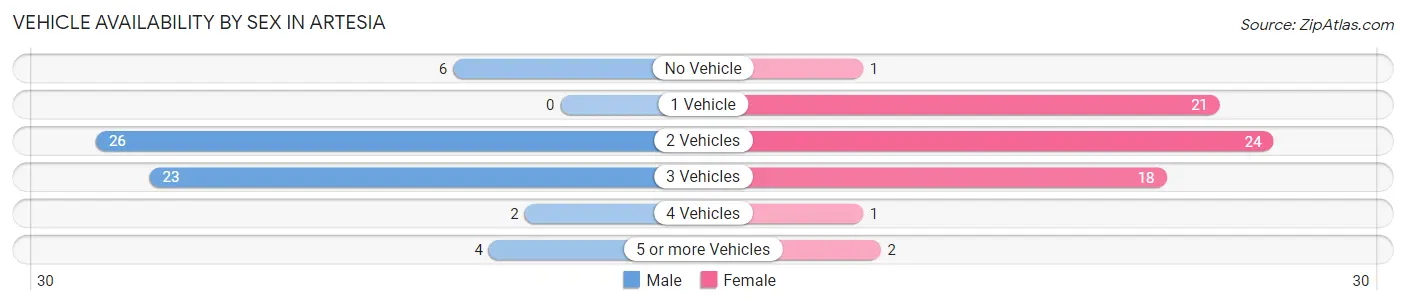
| Vehicles Available | Male | Female |
| No Vehicle | 6 (9.8%) | 1 (1.5%) |
| 1 Vehicle | 0 (0.0%) | 21 (31.3%) |
| 2 Vehicles | 26 (42.6%) | 24 (35.8%) |
| 3 Vehicles | 23 (37.7%) | 18 (26.9%) |
| 4 Vehicles | 2 (3.3%) | 1 (1.5%) |
| 5 or more Vehicles | 4 (6.6%) | 2 (3.0%) |
| Total | 61 (100.0%) | 67 (100.0%) |
Commute Time in Artesia
The most frequently occuring commute durations in Artesia are 20 to 24 minutes (38 commuters, 31.4%), 25 to 29 minutes (28 commuters, 23.1%), and 30 to 34 minutes (14 commuters, 11.6%).
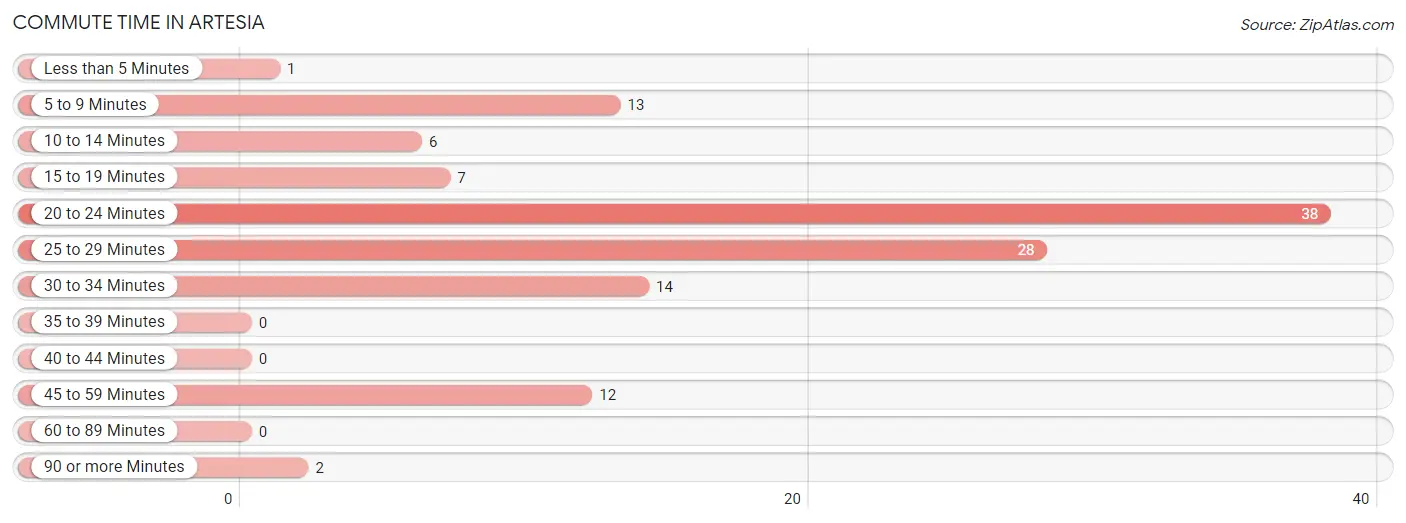
| Commute Time | # Commuters | % Commuters |
| Less than 5 Minutes | 1 | 0.8% |
| 5 to 9 Minutes | 13 | 10.7% |
| 10 to 14 Minutes | 6 | 5.0% |
| 15 to 19 Minutes | 7 | 5.8% |
| 20 to 24 Minutes | 38 | 31.4% |
| 25 to 29 Minutes | 28 | 23.1% |
| 30 to 34 Minutes | 14 | 11.6% |
| 35 to 39 Minutes | 0 | 0.0% |
| 40 to 44 Minutes | 0 | 0.0% |
| 45 to 59 Minutes | 12 | 9.9% |
| 60 to 89 Minutes | 0 | 0.0% |
| 90 or more Minutes | 2 | 1.7% |
Commute Time by Sex in Artesia
The most common commute times in Artesia are 25 to 29 minutes (19 commuters, 32.8%) for males and 20 to 24 minutes (26 commuters, 41.3%) for females.
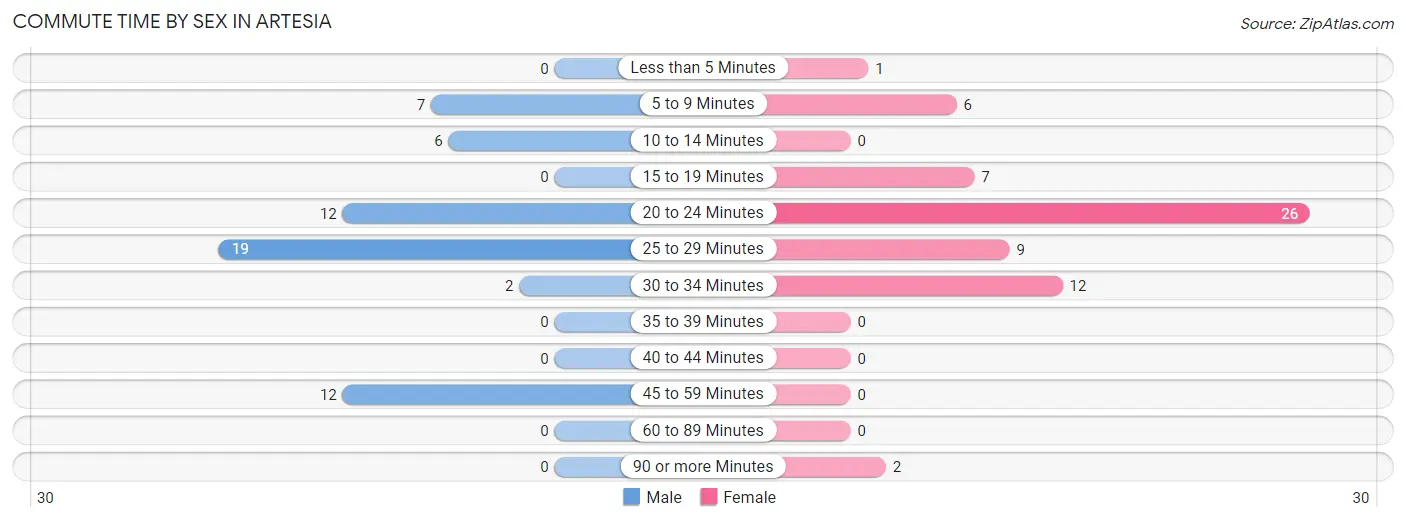
| Commute Time | Male | Female |
| Less than 5 Minutes | 0 (0.0%) | 1 (1.6%) |
| 5 to 9 Minutes | 7 (12.1%) | 6 (9.5%) |
| 10 to 14 Minutes | 6 (10.3%) | 0 (0.0%) |
| 15 to 19 Minutes | 0 (0.0%) | 7 (11.1%) |
| 20 to 24 Minutes | 12 (20.7%) | 26 (41.3%) |
| 25 to 29 Minutes | 19 (32.8%) | 9 (14.3%) |
| 30 to 34 Minutes | 2 (3.5%) | 12 (19.1%) |
| 35 to 39 Minutes | 0 (0.0%) | 0 (0.0%) |
| 40 to 44 Minutes | 0 (0.0%) | 0 (0.0%) |
| 45 to 59 Minutes | 12 (20.7%) | 0 (0.0%) |
| 60 to 89 Minutes | 0 (0.0%) | 0 (0.0%) |
| 90 or more Minutes | 0 (0.0%) | 2 (3.2%) |
Time of Departure to Work by Sex in Artesia
The most frequent times of departure to work in Artesia are 7:00 AM to 7:29 AM (20, 34.5%) for males and 7:00 AM to 7:29 AM (20, 31.8%) for females.
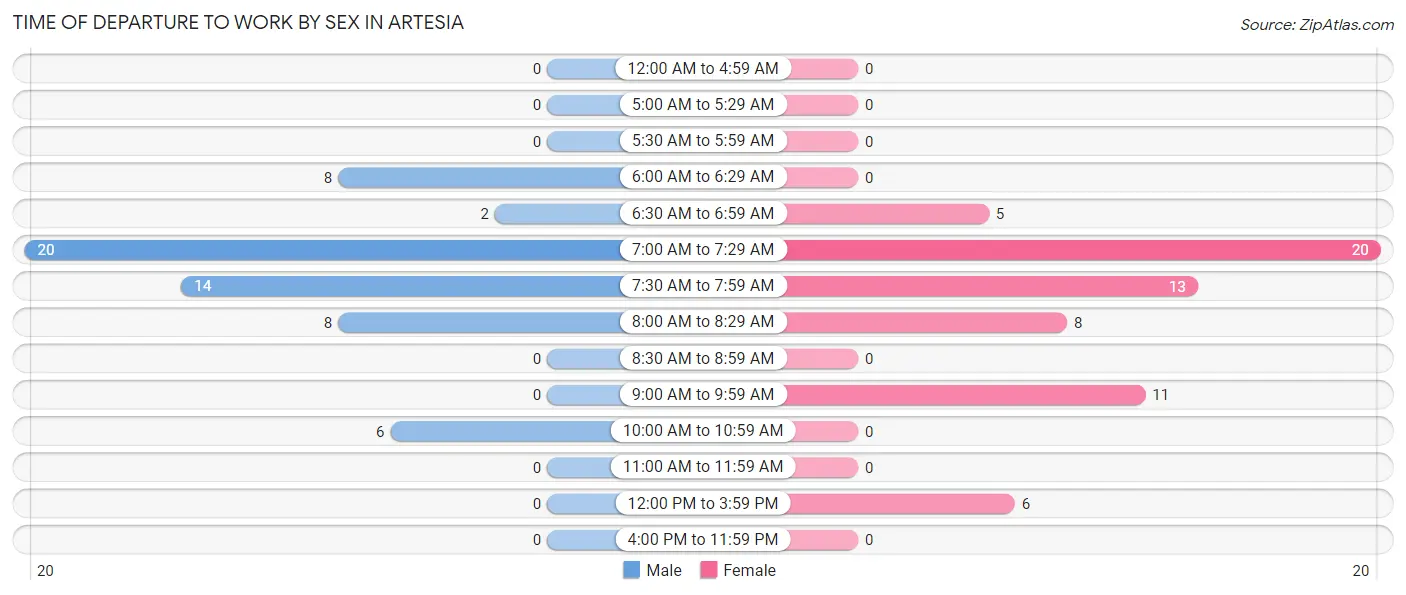
| Time of Departure | Male | Female |
| 12:00 AM to 4:59 AM | 0 (0.0%) | 0 (0.0%) |
| 5:00 AM to 5:29 AM | 0 (0.0%) | 0 (0.0%) |
| 5:30 AM to 5:59 AM | 0 (0.0%) | 0 (0.0%) |
| 6:00 AM to 6:29 AM | 8 (13.8%) | 0 (0.0%) |
| 6:30 AM to 6:59 AM | 2 (3.5%) | 5 (7.9%) |
| 7:00 AM to 7:29 AM | 20 (34.5%) | 20 (31.8%) |
| 7:30 AM to 7:59 AM | 14 (24.1%) | 13 (20.6%) |
| 8:00 AM to 8:29 AM | 8 (13.8%) | 8 (12.7%) |
| 8:30 AM to 8:59 AM | 0 (0.0%) | 0 (0.0%) |
| 9:00 AM to 9:59 AM | 0 (0.0%) | 11 (17.5%) |
| 10:00 AM to 10:59 AM | 6 (10.3%) | 0 (0.0%) |
| 11:00 AM to 11:59 AM | 0 (0.0%) | 0 (0.0%) |
| 12:00 PM to 3:59 PM | 0 (0.0%) | 6 (9.5%) |
| 4:00 PM to 11:59 PM | 0 (0.0%) | 0 (0.0%) |
| Total | 58 (100.0%) | 63 (100.0%) |
Housing Occupancy in Artesia
Occupancy by Ownership in Artesia
Of the total 170 dwellings in Artesia, owner-occupied units account for 101 (59.4%), while renter-occupied units make up 69 (40.6%).
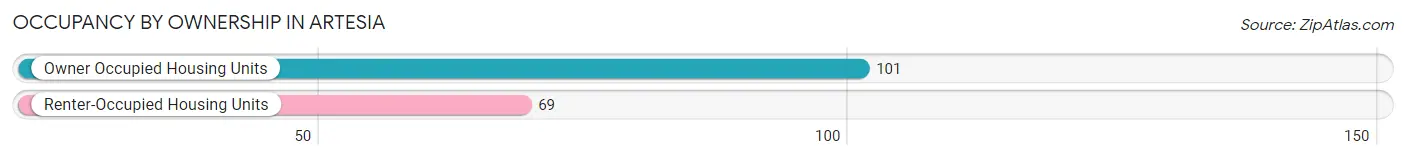
| Occupancy | # Housing Units | % Housing Units |
| Owner Occupied Housing Units | 101 | 59.4% |
| Renter-Occupied Housing Units | 69 | 40.6% |
| Total Occupied Housing Units | 170 | 100.0% |
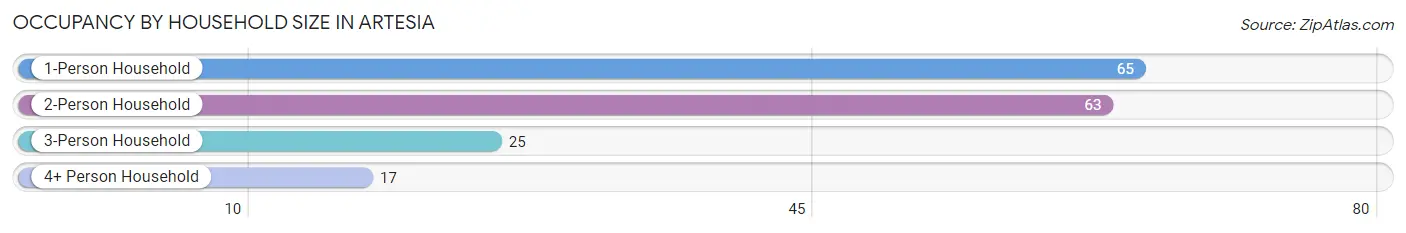
Occupancy by Household Size in Artesia
| Household Size | # Housing Units | % Housing Units |
| 1-Person Household | 65 | 38.2% |
| 2-Person Household | 63 | 37.1% |
| 3-Person Household | 25 | 14.7% |
| 4+ Person Household | 17 | 10.0% |
| Total Housing Units | 170 | 100.0% |
Occupancy by Ownership by Household Size in Artesia
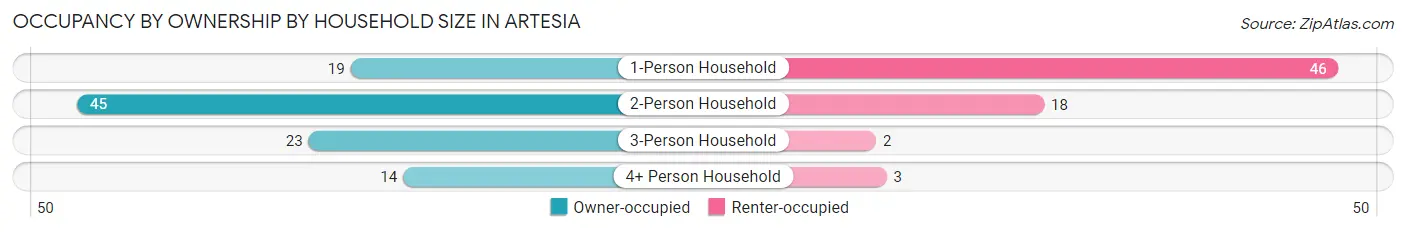
| Household Size | Owner-occupied | Renter-occupied |
| 1-Person Household | 19 (29.2%) | 46 (70.8%) |
| 2-Person Household | 45 (71.4%) | 18 (28.6%) |
| 3-Person Household | 23 (92.0%) | 2 (8.0%) |
| 4+ Person Household | 14 (82.4%) | 3 (17.6%) |
| Total Housing Units | 101 (59.4%) | 69 (40.6%) |
Occupancy by Educational Attainment in Artesia
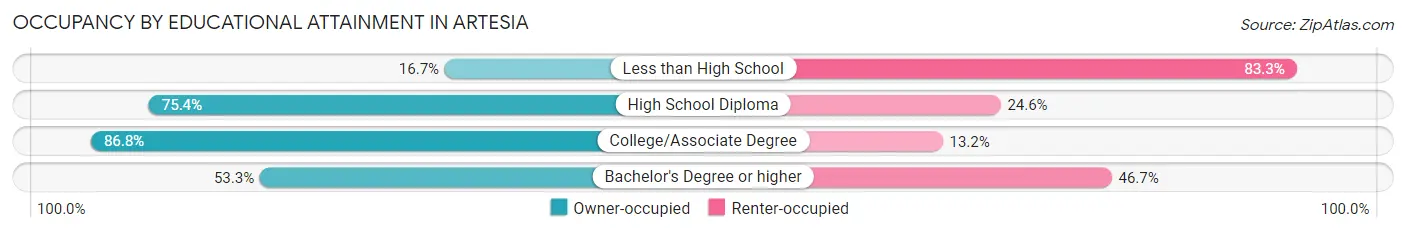
| Household Size | Owner-occupied | Renter-occupied |
| Less than High School | 8 (16.7%) | 40 (83.3%) |
| High School Diploma | 52 (75.4%) | 17 (24.6%) |
| College/Associate Degree | 33 (86.8%) | 5 (13.2%) |
| Bachelor's Degree or higher | 8 (53.3%) | 7 (46.7%) |
Occupancy by Age of Householder in Artesia
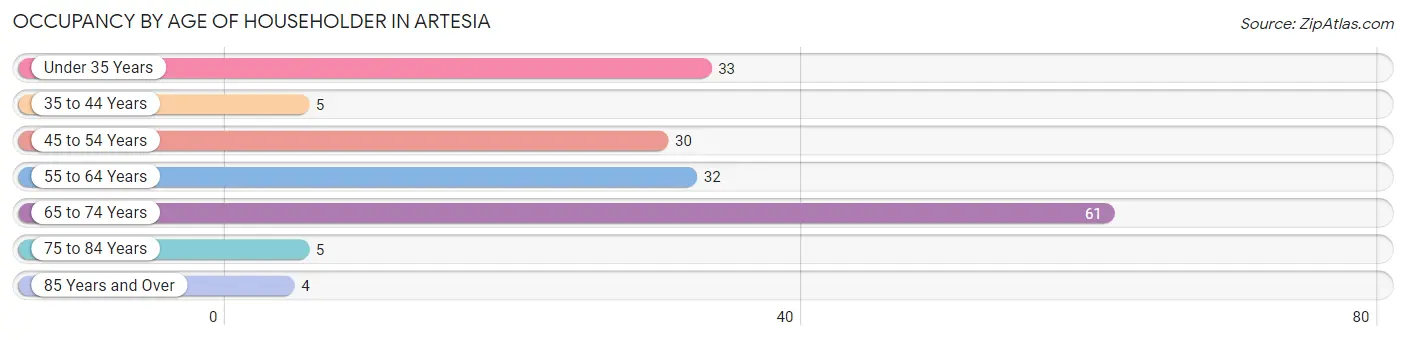
| Age Bracket | # Households | % Households |
| Under 35 Years | 33 | 19.4% |
| 35 to 44 Years | 5 | 2.9% |
| 45 to 54 Years | 30 | 17.6% |
| 55 to 64 Years | 32 | 18.8% |
| 65 to 74 Years | 61 | 35.9% |
| 75 to 84 Years | 5 | 2.9% |
| 85 Years and Over | 4 | 2.4% |
| Total | 170 | 100.0% |
Housing Finances in Artesia
Median Income by Occupancy in Artesia
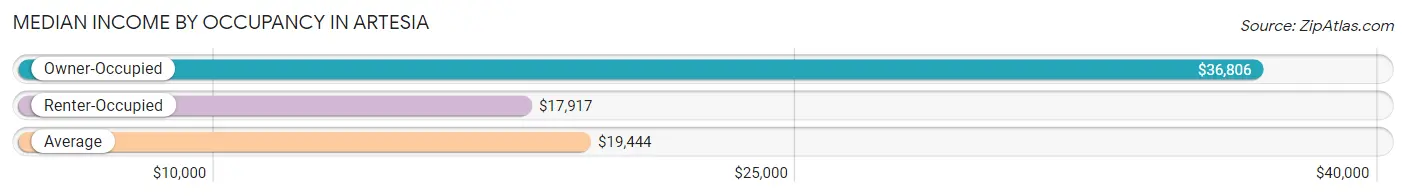
| Occupancy Type | # Households | Median Income |
| Owner-Occupied | 101 (59.4%) | $36,806 |
| Renter-Occupied | 69 (40.6%) | $17,917 |
| Average | 170 (100.0%) | $19,444 |
Occupancy by Householder Income Bracket in Artesia
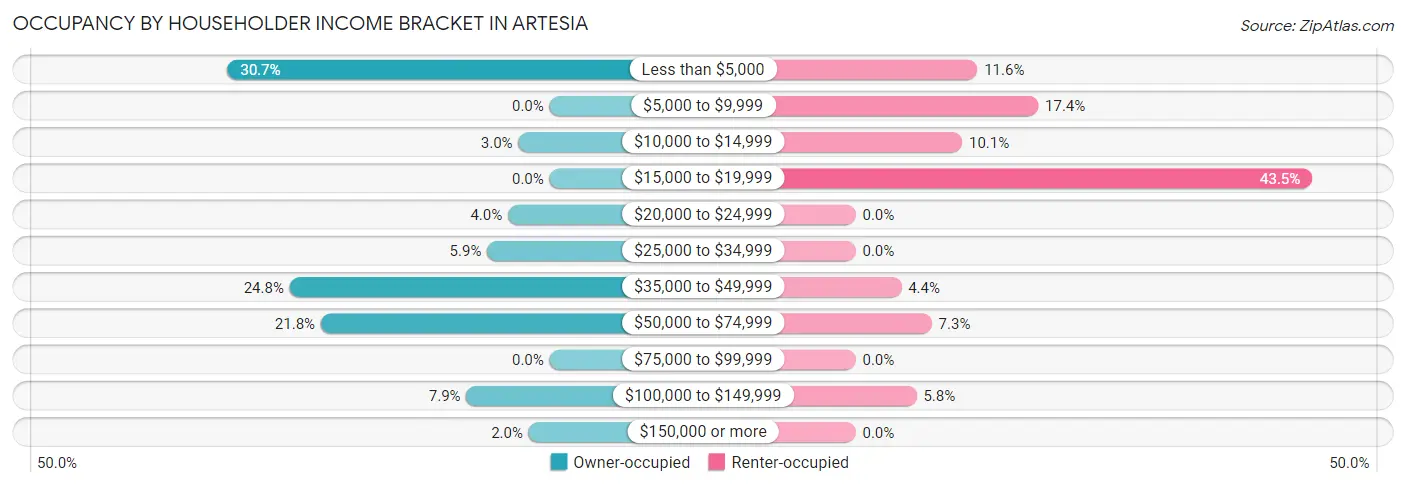
| Income Bracket | Owner-occupied | Renter-occupied |
| Less than $5,000 | 31 (30.7%) | 8 (11.6%) |
| $5,000 to $9,999 | 0 (0.0%) | 12 (17.4%) |
| $10,000 to $14,999 | 3 (3.0%) | 7 (10.1%) |
| $15,000 to $19,999 | 0 (0.0%) | 30 (43.5%) |
| $20,000 to $24,999 | 4 (4.0%) | 0 (0.0%) |
| $25,000 to $34,999 | 6 (5.9%) | 0 (0.0%) |
| $35,000 to $49,999 | 25 (24.7%) | 3 (4.3%) |
| $50,000 to $74,999 | 22 (21.8%) | 5 (7.2%) |
| $75,000 to $99,999 | 0 (0.0%) | 0 (0.0%) |
| $100,000 to $149,999 | 8 (7.9%) | 4 (5.8%) |
| $150,000 or more | 2 (2.0%) | 0 (0.0%) |
| Total | 101 (100.0%) | 69 (100.0%) |
Monthly Housing Cost Tiers in Artesia
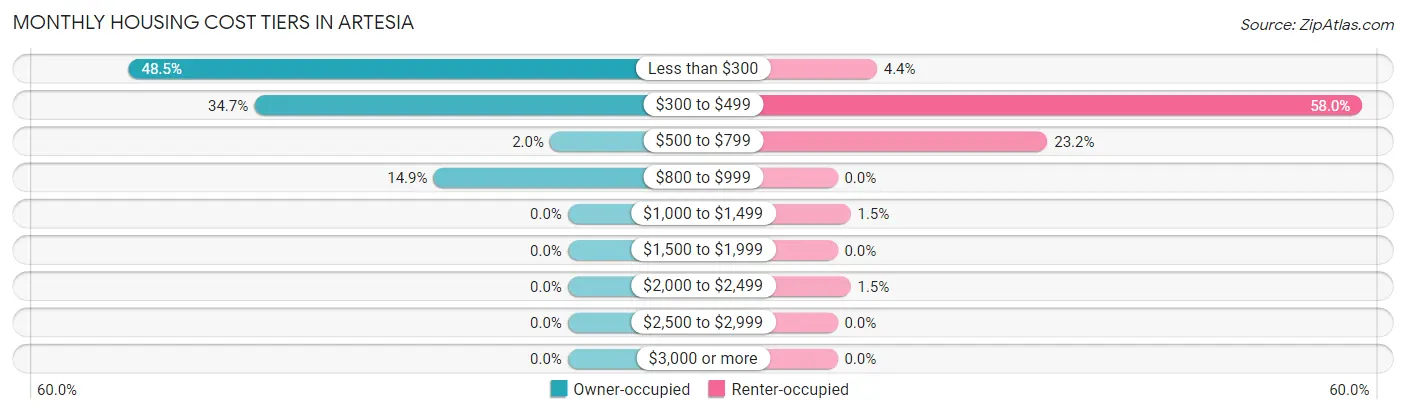
| Monthly Cost | Owner-occupied | Renter-occupied |
| Less than $300 | 49 (48.5%) | 3 (4.3%) |
| $300 to $499 | 35 (34.6%) | 40 (58.0%) |
| $500 to $799 | 2 (2.0%) | 16 (23.2%) |
| $800 to $999 | 15 (14.8%) | 0 (0.0%) |
| $1,000 to $1,499 | 0 (0.0%) | 1 (1.5%) |
| $1,500 to $1,999 | 0 (0.0%) | 0 (0.0%) |
| $2,000 to $2,499 | 0 (0.0%) | 1 (1.5%) |
| $2,500 to $2,999 | 0 (0.0%) | 0 (0.0%) |
| $3,000 or more | 0 (0.0%) | 0 (0.0%) |
| Total | 101 (100.0%) | 69 (100.0%) |
Physical Housing Characteristics in Artesia
Housing Structures in Artesia
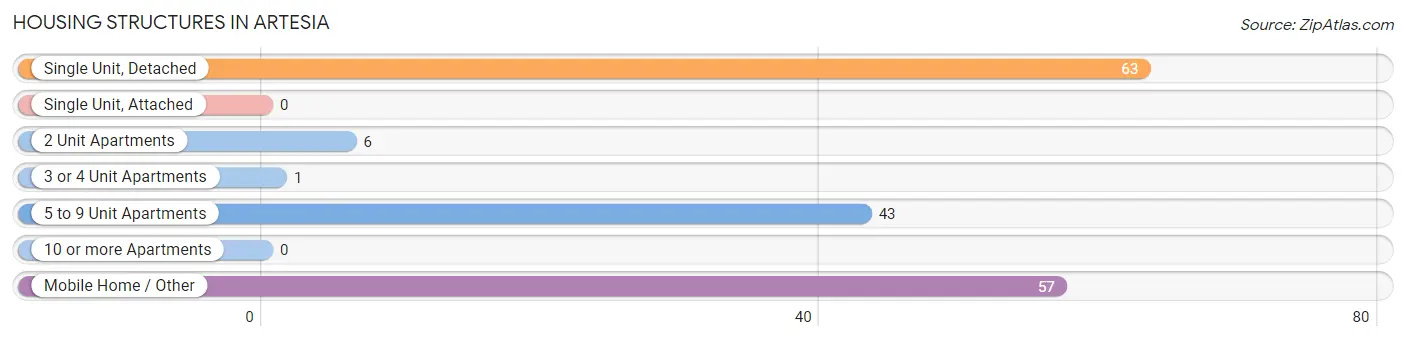
| Structure Type | # Housing Units | % Housing Units |
| Single Unit, Detached | 63 | 37.1% |
| Single Unit, Attached | 0 | 0.0% |
| 2 Unit Apartments | 6 | 3.5% |
| 3 or 4 Unit Apartments | 1 | 0.6% |
| 5 to 9 Unit Apartments | 43 | 25.3% |
| 10 or more Apartments | 0 | 0.0% |
| Mobile Home / Other | 57 | 33.5% |
| Total | 170 | 100.0% |
Housing Structures by Occupancy in Artesia
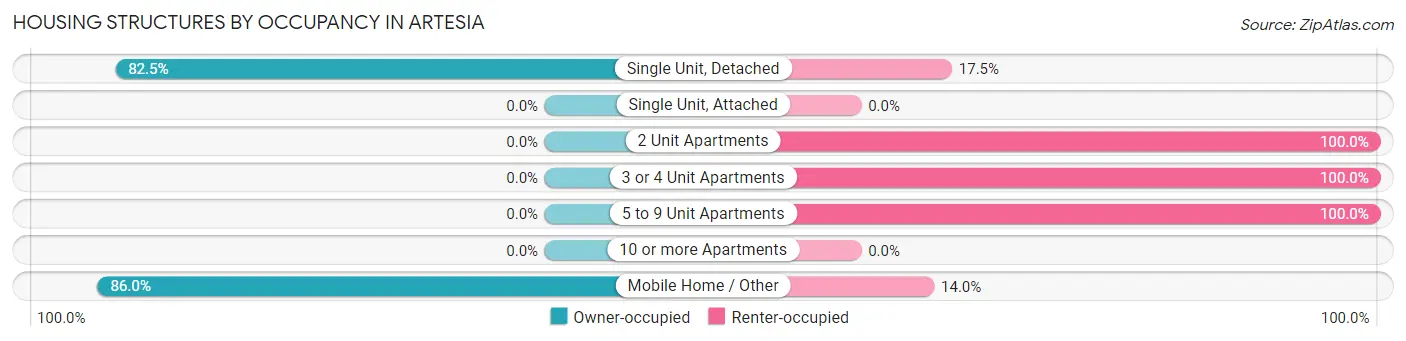
| Structure Type | Owner-occupied | Renter-occupied |
| Single Unit, Detached | 52 (82.5%) | 11 (17.5%) |
| Single Unit, Attached | 0 (0.0%) | 0 (0.0%) |
| 2 Unit Apartments | 0 (0.0%) | 6 (100.0%) |
| 3 or 4 Unit Apartments | 0 (0.0%) | 1 (100.0%) |
| 5 to 9 Unit Apartments | 0 (0.0%) | 43 (100.0%) |
| 10 or more Apartments | 0 (0.0%) | 0 (0.0%) |
| Mobile Home / Other | 49 (86.0%) | 8 (14.0%) |
| Total | 101 (59.4%) | 69 (40.6%) |
Housing Structures by Number of Rooms in Artesia
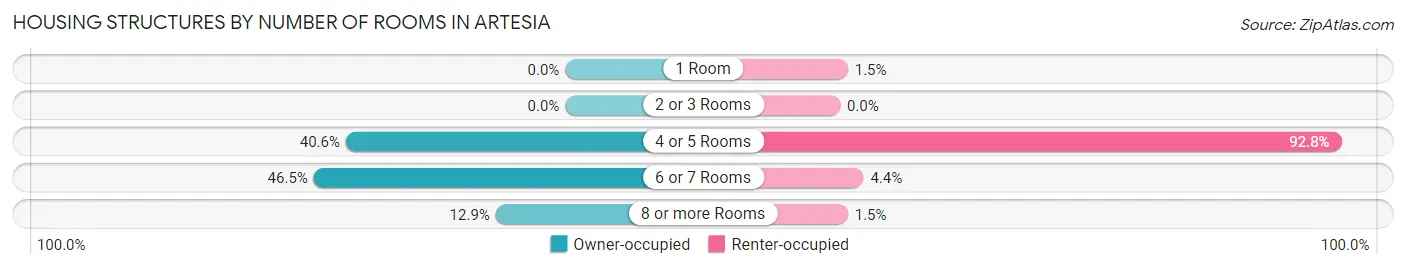
| Number of Rooms | Owner-occupied | Renter-occupied |
| 1 Room | 0 (0.0%) | 1 (1.5%) |
| 2 or 3 Rooms | 0 (0.0%) | 0 (0.0%) |
| 4 or 5 Rooms | 41 (40.6%) | 64 (92.7%) |
| 6 or 7 Rooms | 47 (46.5%) | 3 (4.3%) |
| 8 or more Rooms | 13 (12.9%) | 1 (1.5%) |
| Total | 101 (100.0%) | 69 (100.0%) |
Housing Structure by Heating Type in Artesia
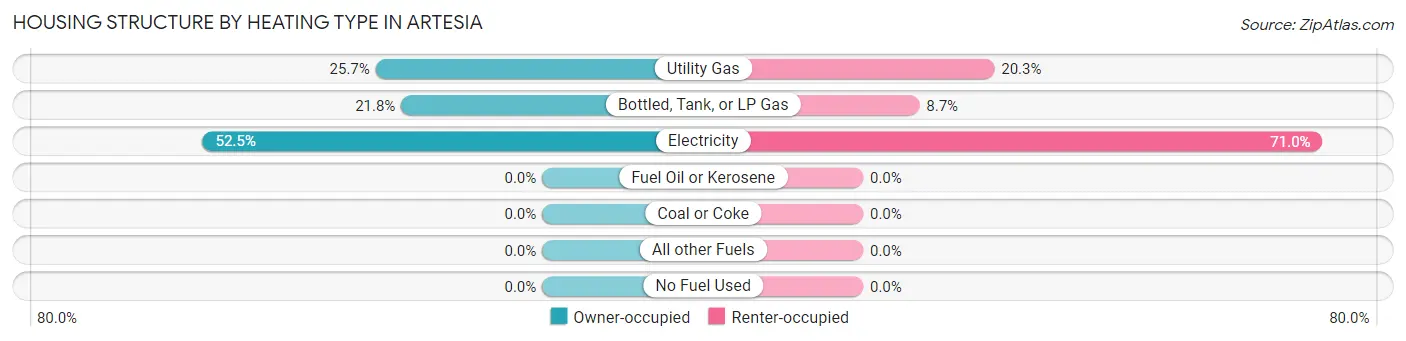
| Heating Type | Owner-occupied | Renter-occupied |
| Utility Gas | 26 (25.7%) | 14 (20.3%) |
| Bottled, Tank, or LP Gas | 22 (21.8%) | 6 (8.7%) |
| Electricity | 53 (52.5%) | 49 (71.0%) |
| Fuel Oil or Kerosene | 0 (0.0%) | 0 (0.0%) |
| Coal or Coke | 0 (0.0%) | 0 (0.0%) |
| All other Fuels | 0 (0.0%) | 0 (0.0%) |
| No Fuel Used | 0 (0.0%) | 0 (0.0%) |
| Total | 101 (100.0%) | 69 (100.0%) |
Household Vehicle Usage in Artesia
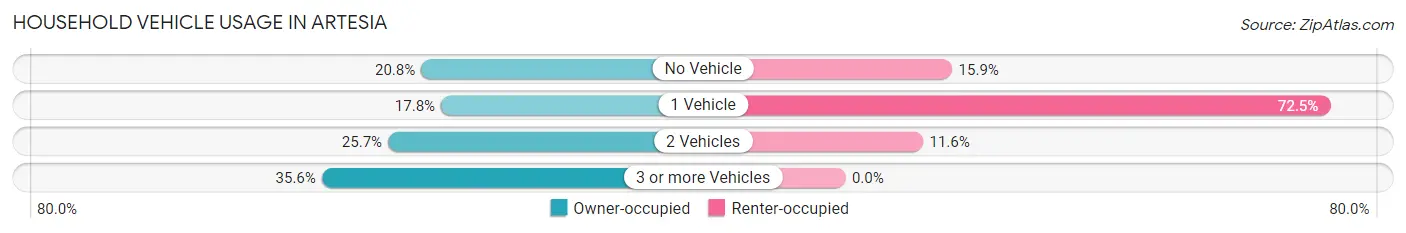
| Vehicles per Household | Owner-occupied | Renter-occupied |
| No Vehicle | 21 (20.8%) | 11 (15.9%) |
| 1 Vehicle | 18 (17.8%) | 50 (72.5%) |
| 2 Vehicles | 26 (25.7%) | 8 (11.6%) |
| 3 or more Vehicles | 36 (35.6%) | 0 (0.0%) |
| Total | 101 (100.0%) | 69 (100.0%) |
Real Estate & Mortgages in Artesia
Real Estate and Mortgage Overview in Artesia
| Characteristic | Without Mortgage | With Mortgage |
| Housing Units | 86 | 15 |
| Median Property Value | $112,500 | $96,300 |
| Median Household Income | $36,667 | $0 |
| Monthly Housing Costs | $288 | $0 |
| Real Estate Taxes | $631 | $3 |
Property Value by Mortgage Status in Artesia
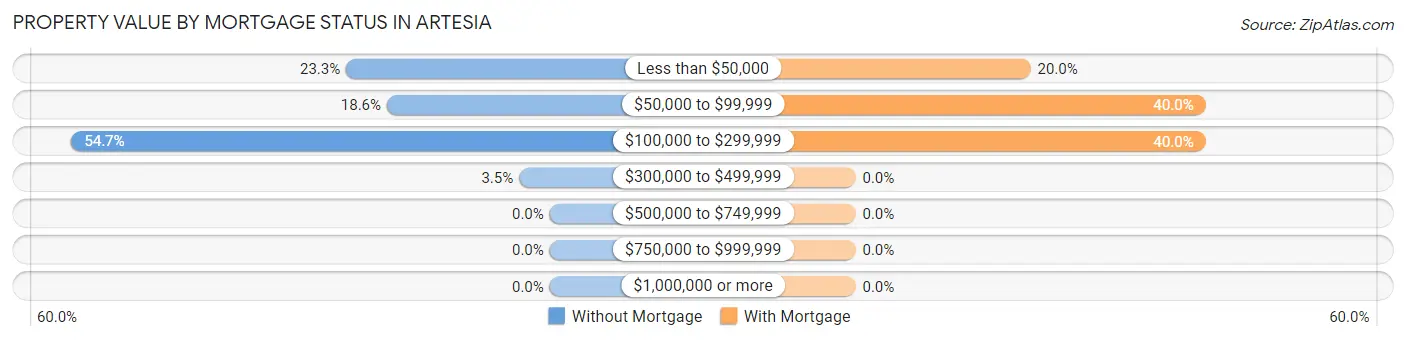
| Property Value | Without Mortgage | With Mortgage |
| Less than $50,000 | 20 (23.3%) | 3 (20.0%) |
| $50,000 to $99,999 | 16 (18.6%) | 6 (40.0%) |
| $100,000 to $299,999 | 47 (54.6%) | 6 (40.0%) |
| $300,000 to $499,999 | 3 (3.5%) | 0 (0.0%) |
| $500,000 to $749,999 | 0 (0.0%) | 0 (0.0%) |
| $750,000 to $999,999 | 0 (0.0%) | 0 (0.0%) |
| $1,000,000 or more | 0 (0.0%) | 0 (0.0%) |
| Total | 86 (100.0%) | 15 (100.0%) |
Household Income by Mortgage Status in Artesia
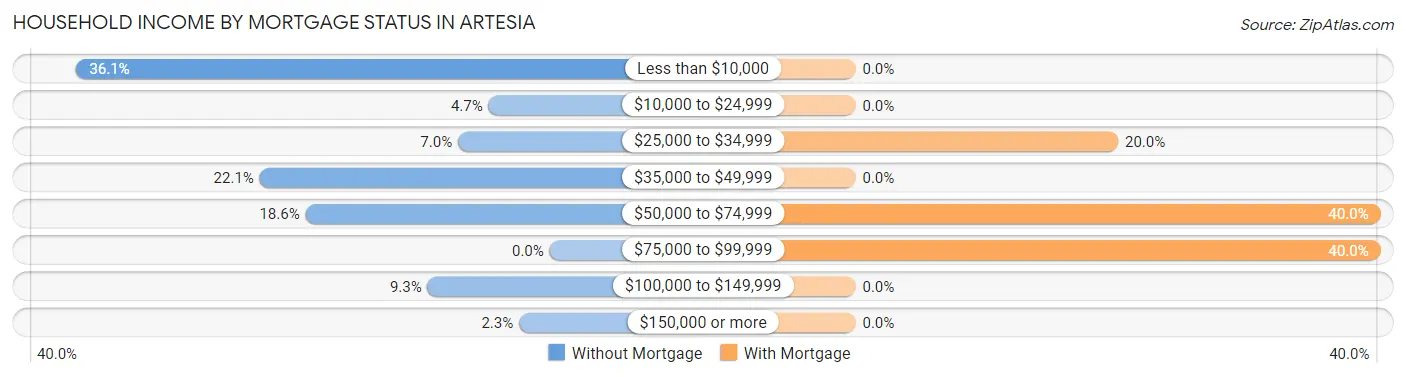
| Household Income | Without Mortgage | With Mortgage |
| Less than $10,000 | 31 (36.0%) | 0 (0.0%) |
| $10,000 to $24,999 | 4 (4.6%) | 0 (0.0%) |
| $25,000 to $34,999 | 6 (7.0%) | 3 (20.0%) |
| $35,000 to $49,999 | 19 (22.1%) | 0 (0.0%) |
| $50,000 to $74,999 | 16 (18.6%) | 6 (40.0%) |
| $75,000 to $99,999 | 0 (0.0%) | 6 (40.0%) |
| $100,000 to $149,999 | 8 (9.3%) | 0 (0.0%) |
| $150,000 or more | 2 (2.3%) | 0 (0.0%) |
| Total | 86 (100.0%) | 15 (100.0%) |
Property Value to Household Income Ratio in Artesia
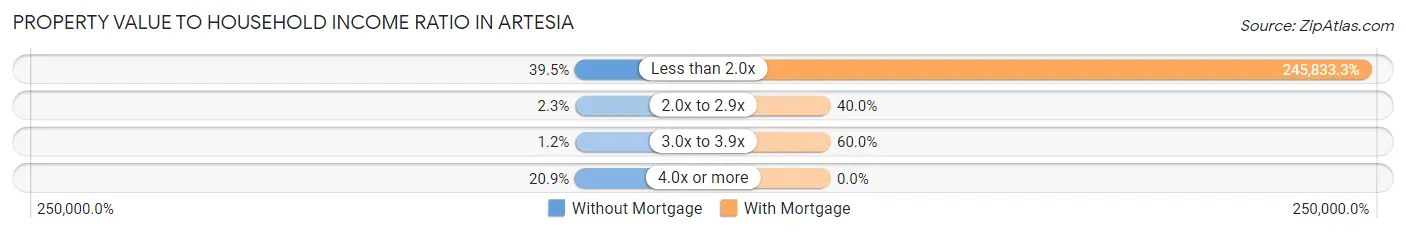
| Value-to-Income Ratio | Without Mortgage | With Mortgage |
| Less than 2.0x | 34 (39.5%) | 36,875 (245,833.3%) |
| 2.0x to 2.9x | 2 (2.3%) | 6 (40.0%) |
| 3.0x to 3.9x | 1 (1.2%) | 9 (60.0%) |
| 4.0x or more | 18 (20.9%) | 0 (0.0%) |
| Total | 86 (100.0%) | 15 (100.0%) |
Real Estate Taxes by Mortgage Status in Artesia
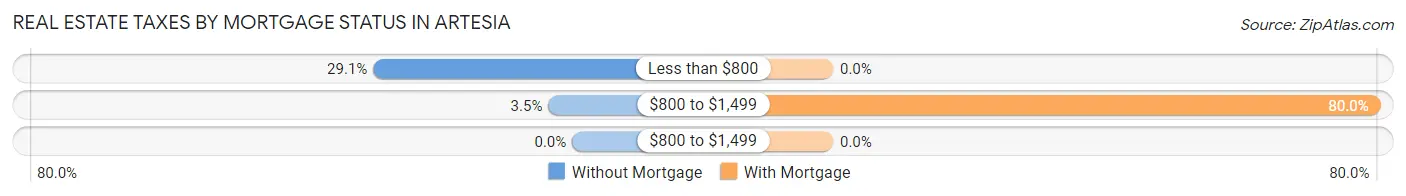
| Property Taxes | Without Mortgage | With Mortgage |
| Less than $800 | 25 (29.1%) | 0 (0.0%) |
| $800 to $1,499 | 3 (3.5%) | 12 (80.0%) |
| $800 to $1,499 | 0 (0.0%) | 0 (0.0%) |
| Total | 86 (100.0%) | 15 (100.0%) |
Health & Disability in Artesia
Health Insurance Coverage by Age in Artesia
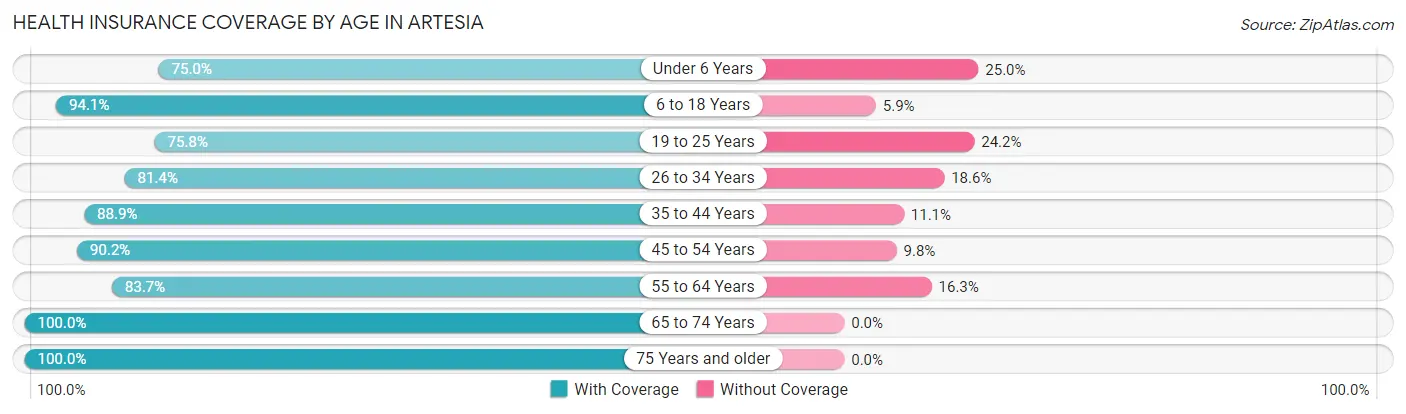
| Age Bracket | With Coverage | Without Coverage |
| Under 6 Years | 6 (75.0%) | 2 (25.0%) |
| 6 to 18 Years | 80 (94.1%) | 5 (5.9%) |
| 19 to 25 Years | 25 (75.8%) | 8 (24.2%) |
| 26 to 34 Years | 48 (81.4%) | 11 (18.6%) |
| 35 to 44 Years | 16 (88.9%) | 2 (11.1%) |
| 45 to 54 Years | 37 (90.2%) | 4 (9.8%) |
| 55 to 64 Years | 36 (83.7%) | 7 (16.3%) |
| 65 to 74 Years | 73 (100.0%) | 0 (0.0%) |
| 75 Years and older | 14 (100.0%) | 0 (0.0%) |
| Total | 335 (89.6%) | 39 (10.4%) |
Health Insurance Coverage by Citizenship Status in Artesia
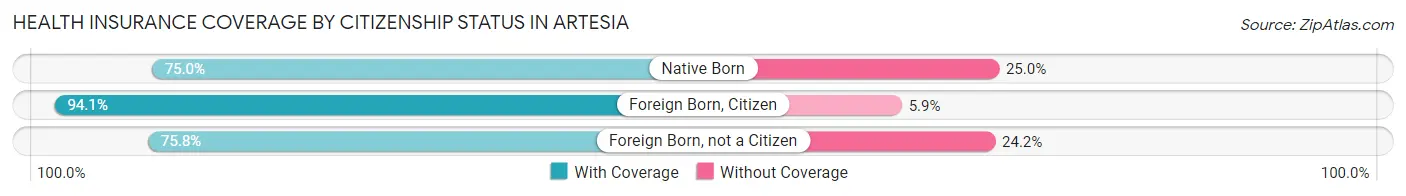
| Citizenship Status | With Coverage | Without Coverage |
| Native Born | 6 (75.0%) | 2 (25.0%) |
| Foreign Born, Citizen | 80 (94.1%) | 5 (5.9%) |
| Foreign Born, not a Citizen | 25 (75.8%) | 8 (24.2%) |
Health Insurance Coverage by Household Income in Artesia
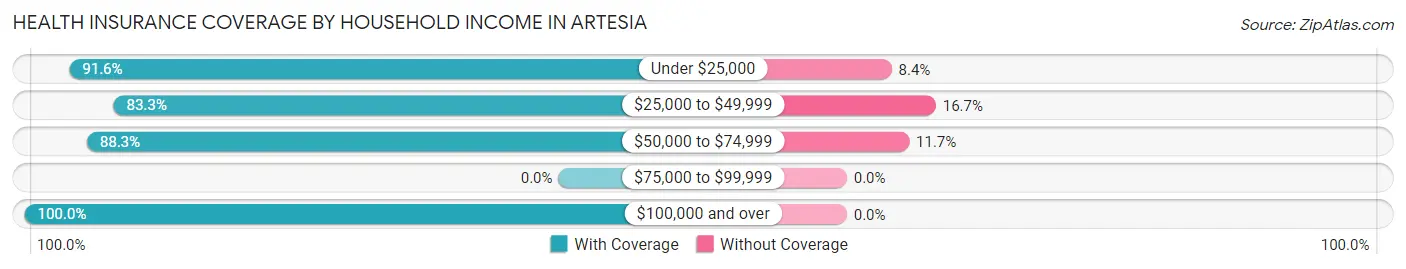
| Household Income | With Coverage | Without Coverage |
| Under $25,000 | 142 (91.6%) | 13 (8.4%) |
| $25,000 to $49,999 | 95 (83.3%) | 19 (16.7%) |
| $50,000 to $74,999 | 53 (88.3%) | 7 (11.7%) |
| $75,000 to $99,999 | 0 (0.0%) | 0 (0.0%) |
| $100,000 and over | 45 (100.0%) | 0 (0.0%) |
Public vs Private Health Insurance Coverage by Age in Artesia
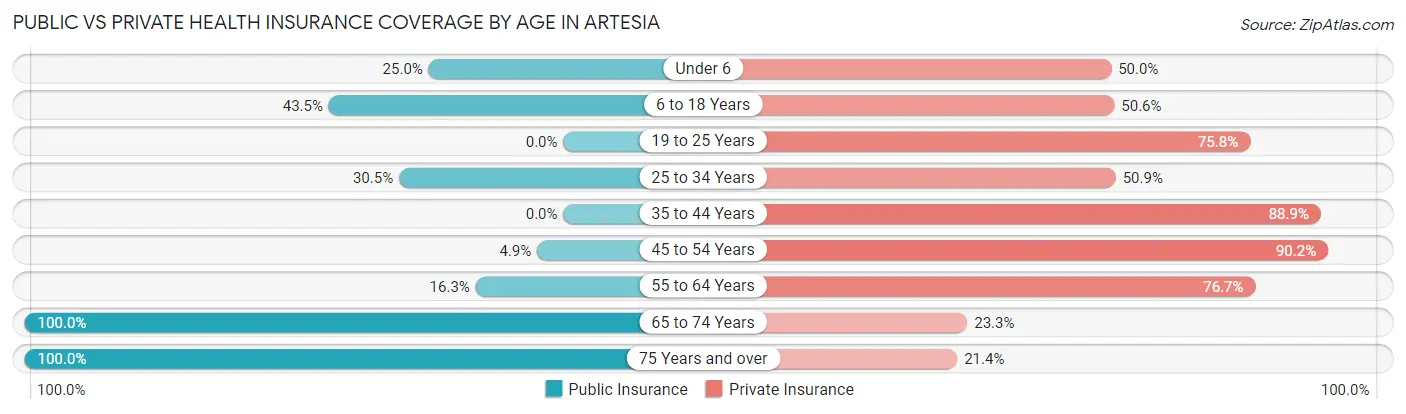
| Age Bracket | Public Insurance | Private Insurance |
| Under 6 | 2 (25.0%) | 4 (50.0%) |
| 6 to 18 Years | 37 (43.5%) | 43 (50.6%) |
| 19 to 25 Years | 0 (0.0%) | 25 (75.8%) |
| 25 to 34 Years | 18 (30.5%) | 30 (50.8%) |
| 35 to 44 Years | 0 (0.0%) | 16 (88.9%) |
| 45 to 54 Years | 2 (4.9%) | 37 (90.2%) |
| 55 to 64 Years | 7 (16.3%) | 33 (76.7%) |
| 65 to 74 Years | 73 (100.0%) | 17 (23.3%) |
| 75 Years and over | 14 (100.0%) | 3 (21.4%) |
| Total | 153 (40.9%) | 208 (55.6%) |
Disability Status by Sex by Age in Artesia
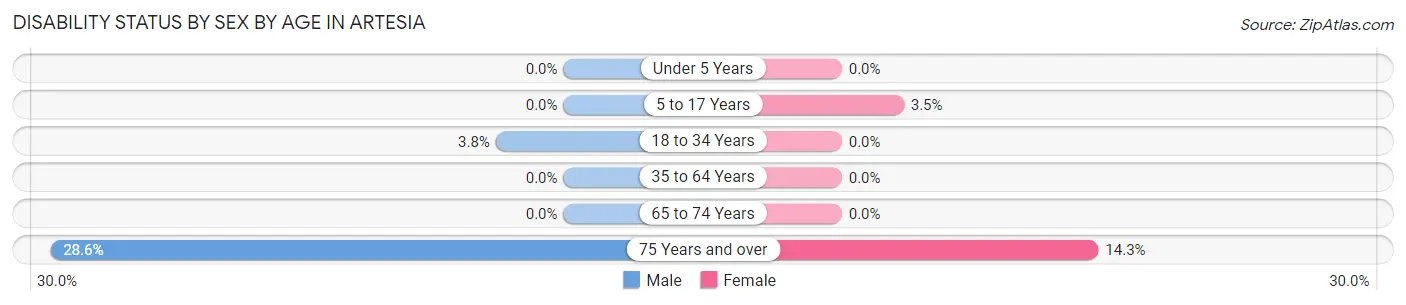
| Age Bracket | Male | Female |
| Under 5 Years | 0 (0.0%) | 0 (0.0%) |
| 5 to 17 Years | 0 (0.0%) | 2 (3.5%) |
| 18 to 34 Years | 2 (3.8%) | 0 (0.0%) |
| 35 to 64 Years | 0 (0.0%) | 0 (0.0%) |
| 65 to 74 Years | 0 (0.0%) | 0 (0.0%) |
| 75 Years and over | 2 (28.6%) | 1 (14.3%) |
Disability Class by Sex by Age in Artesia
Disability Class: Hearing Difficulty
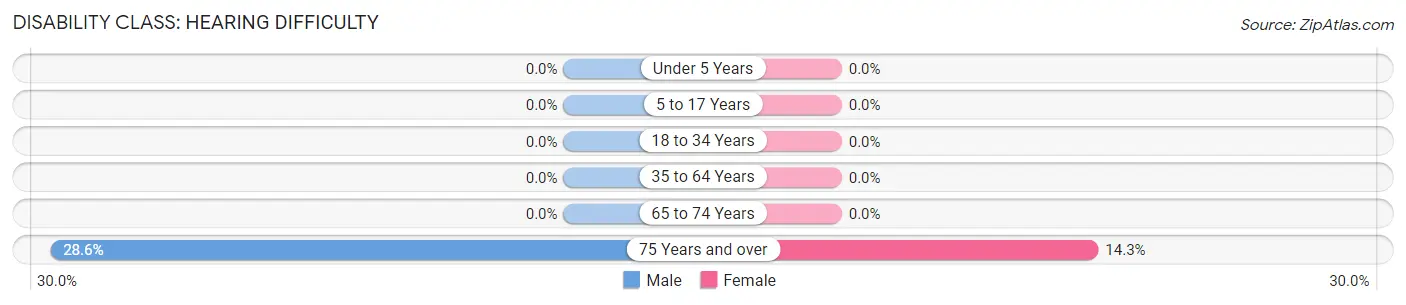
| Age Bracket | Male | Female |
| Under 5 Years | 0 (0.0%) | 0 (0.0%) |
| 5 to 17 Years | 0 (0.0%) | 0 (0.0%) |
| 18 to 34 Years | 0 (0.0%) | 0 (0.0%) |
| 35 to 64 Years | 0 (0.0%) | 0 (0.0%) |
| 65 to 74 Years | 0 (0.0%) | 0 (0.0%) |
| 75 Years and over | 2 (28.6%) | 1 (14.3%) |
Disability Class: Vision Difficulty
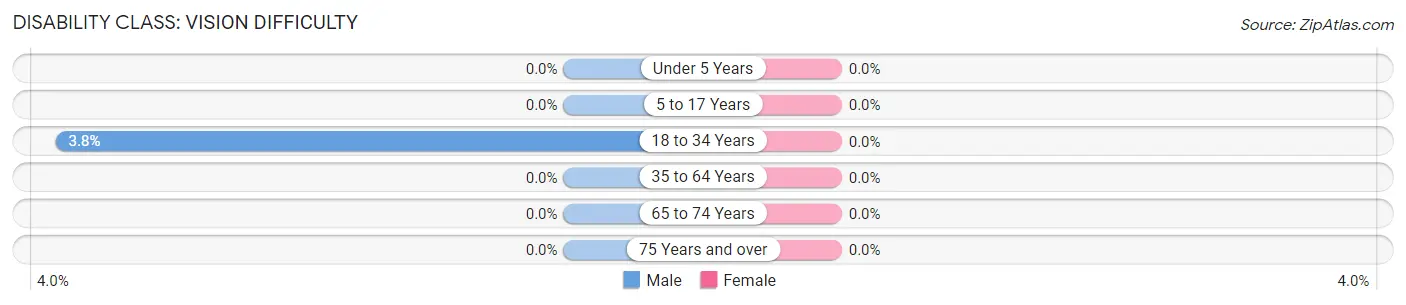
| Age Bracket | Male | Female |
| Under 5 Years | 0 (0.0%) | 0 (0.0%) |
| 5 to 17 Years | 0 (0.0%) | 0 (0.0%) |
| 18 to 34 Years | 2 (3.8%) | 0 (0.0%) |
| 35 to 64 Years | 0 (0.0%) | 0 (0.0%) |
| 65 to 74 Years | 0 (0.0%) | 0 (0.0%) |
| 75 Years and over | 0 (0.0%) | 0 (0.0%) |
Disability Class: Cognitive Difficulty
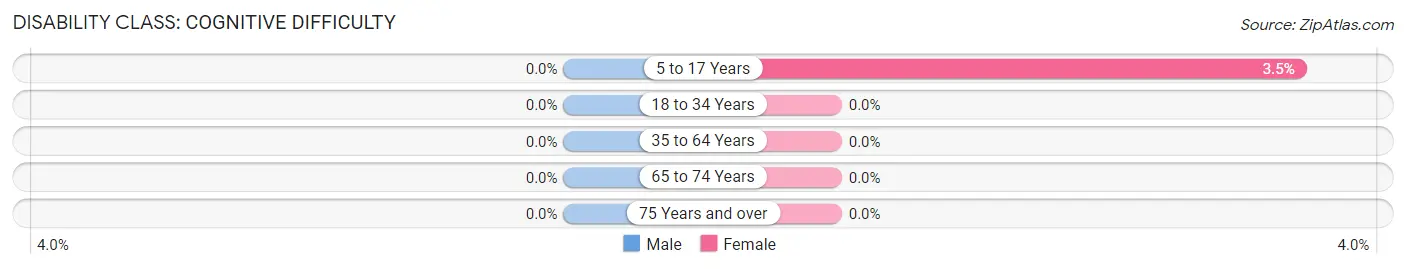
| Age Bracket | Male | Female |
| 5 to 17 Years | 0 (0.0%) | 2 (3.5%) |
| 18 to 34 Years | 0 (0.0%) | 0 (0.0%) |
| 35 to 64 Years | 0 (0.0%) | 0 (0.0%) |
| 65 to 74 Years | 0 (0.0%) | 0 (0.0%) |
| 75 Years and over | 0 (0.0%) | 0 (0.0%) |
Disability Class: Ambulatory Difficulty
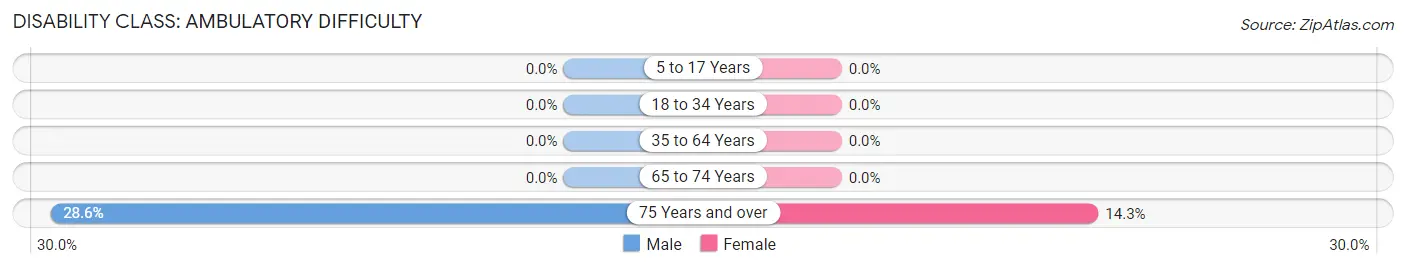
| Age Bracket | Male | Female |
| 5 to 17 Years | 0 (0.0%) | 0 (0.0%) |
| 18 to 34 Years | 0 (0.0%) | 0 (0.0%) |
| 35 to 64 Years | 0 (0.0%) | 0 (0.0%) |
| 65 to 74 Years | 0 (0.0%) | 0 (0.0%) |
| 75 Years and over | 2 (28.6%) | 1 (14.3%) |
Disability Class: Self-Care Difficulty
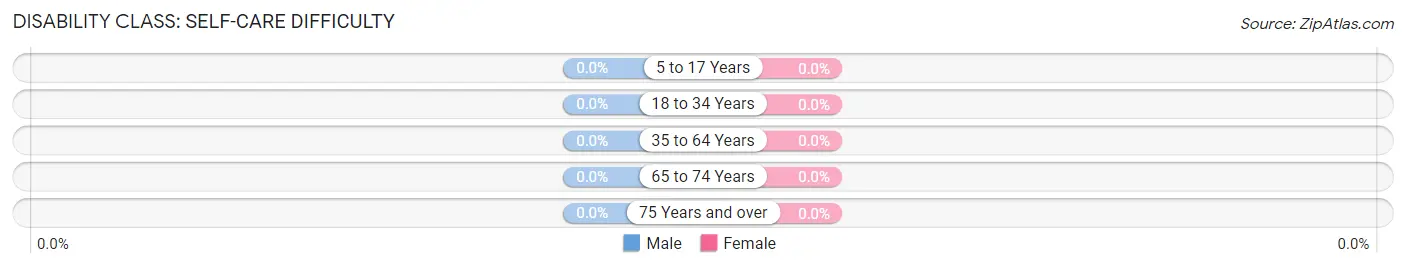
| Age Bracket | Male | Female |
| 5 to 17 Years | 0 (0.0%) | 0 (0.0%) |
| 18 to 34 Years | 0 (0.0%) | 0 (0.0%) |
| 35 to 64 Years | 0 (0.0%) | 0 (0.0%) |
| 65 to 74 Years | 0 (0.0%) | 0 (0.0%) |
| 75 Years and over | 0 (0.0%) | 0 (0.0%) |
Technology Access in Artesia
Computing Device Access in Artesia
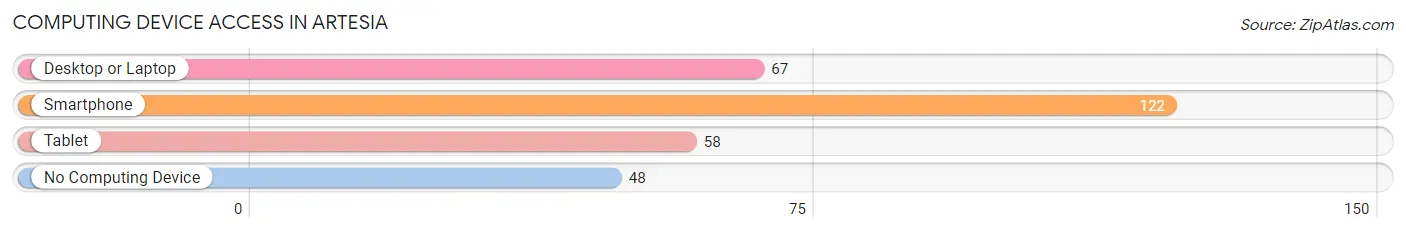
| Device Type | # Households | % Households |
| Desktop or Laptop | 67 | 39.4% |
| Smartphone | 122 | 71.8% |
| Tablet | 58 | 34.1% |
| No Computing Device | 48 | 28.2% |
| Total | 170 | 100.0% |
Internet Access in Artesia
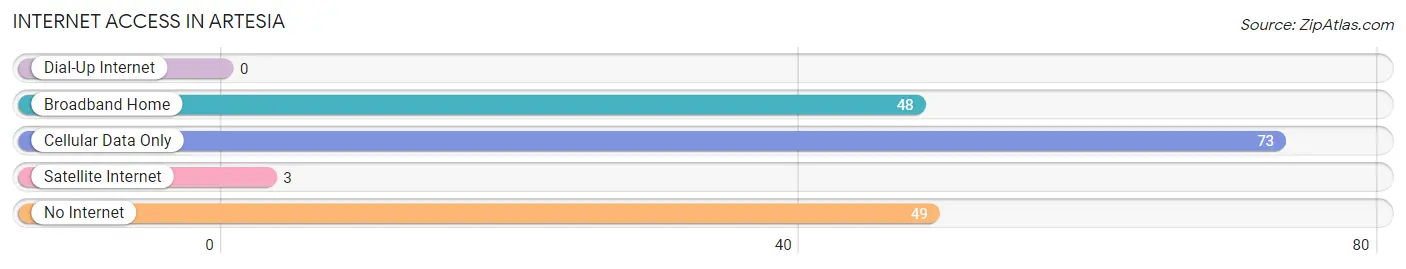
| Internet Type | # Households | % Households |
| Dial-Up Internet | 0 | 0.0% |
| Broadband Home | 48 | 28.2% |
| Cellular Data Only | 73 | 42.9% |
| Satellite Internet | 3 | 1.8% |
| No Internet | 49 | 28.8% |
| Total | 170 | 100.0% |
Artesia Summary
Artesia is a small town located in the state of Mississippi, in the United States. It is situated in the northeastern part of the state, in Lowndes County. The town has a population of approximately 1,000 people, and is part of the Columbus, Mississippi Metropolitan Statistical Area.
History
Artesia was founded in 1837 by a group of settlers from Georgia. The town was named after the nearby Artesia Creek, which was named after the Greek goddess of the arts, Artemis. The town was originally a farming community, and the main crops grown were cotton and corn.
In the late 19th century, the town began to grow and develop. The railroad was built through the town in 1887, and this helped to spur economic growth. The town also became a center for timber production, and the lumber industry was a major employer in the area.
In the early 20th century, Artesia began to experience a decline in population. This was due to the Great Depression and the mechanization of the cotton industry. The town was also affected by the Civil Rights Movement, and many African Americans left the area in search of better opportunities.
Geography
Artesia is located in the northeastern part of Mississippi, in Lowndes County. The town is situated on the banks of the Artesia Creek, and is surrounded by rolling hills and forests. The town is located about 30 miles south of the state capital, Jackson.
The climate in Artesia is humid subtropical, with hot summers and mild winters. The average annual temperature is around 70 degrees Fahrenheit. The town receives an average of 48 inches of precipitation per year.
Economy
The economy of Artesia is largely based on agriculture. The main crops grown in the area are cotton, corn, soybeans, and wheat. The town is also home to several timber companies, which provide jobs for many of the town’s residents.
In addition to agriculture and timber, Artesia is home to several small businesses. These include restaurants, retail stores, and other service-based businesses. The town is also home to a few manufacturing companies, which produce a variety of products.
Demographics
As of the 2010 census, the population of Artesia was 1,000 people. The racial makeup of the town was 79.2% White, 18.2% African American, 0.7% Native American, 0.2% Asian, and 1.9% from other races. The median household income was $30,000, and the median age was 37 years.
Artesia is a small town with a rich history and a diverse population. The town is home to a variety of businesses, and the economy is largely based on agriculture and timber. The town is also home to a few manufacturing companies, which provide jobs for many of the town’s residents.
Common Questions
What is Per Capita Income in Artesia?
Per Capita income in Artesia is $17,246.
What is the Median Family Income in Artesia?
Median Family Income in Artesia is $36,364.
What is the Median Household income in Artesia?
Median Household Income in Artesia is $19,444.
What is Income or Wage Gap in Artesia?
Income or Wage Gap in Artesia is 18.6%.
Women in Artesia earn 81.4 cents for every dollar earned by a man.
What is Family Income Deficit in Artesia?
Family Income Deficit in Artesia is $19,895.
Families that are below poverty line in Artesia earn $19,895 less on average than the poverty threshold level.
What is Inequality or Gini Index in Artesia?
Inequality or Gini Index in Artesia is 0.56.
What is the Total Population of Artesia?
Total Population of Artesia is 374.
What is the Total Male Population of Artesia?
Total Male Population of Artesia is 165.
What is the Total Female Population of Artesia?
Total Female Population of Artesia is 209.
What is the Ratio of Males per 100 Females in Artesia?
There are 78.95 Males per 100 Females in Artesia.
What is the Ratio of Females per 100 Males in Artesia?
There are 126.67 Females per 100 Males in Artesia.
What is the Median Population Age in Artesia?
Median Population Age in Artesia is 36.0 Years.
What is the Average Family Size in Artesia
Average Family Size in Artesia is 3.0 People.
What is the Average Household Size in Artesia
Average Household Size in Artesia is 2.2 People.
How Large is the Labor Force in Artesia?
There are 130 People in the Labor Forcein in Artesia.
What is the Percentage of People in the Labor Force in Artesia?
42.5% of People are in the Labor Force in Artesia.
What is the Unemployment Rate in Artesia?
Unemployment Rate in Artesia is 1.5%.