Cary, MS Map & Demographics
Cary Map
Cary Overview
$20,535
PER CAPITA INCOME
$53,125
AVG FAMILY INCOME
$40,000
AVG HOUSEHOLD INCOME
64.5%
WAGE / INCOME GAP [ % ]
35.5¢/ $1
WAGE / INCOME GAP [ $ ]
0.44
INEQUALITY / GINI INDEX
414
TOTAL POPULATION
229
MALE POPULATION
185
FEMALE POPULATION
123.78
MALES / 100 FEMALES
80.79
FEMALES / 100 MALES
26.0
MEDIAN AGE
4.9
AVG FAMILY SIZE
4.1
AVG HOUSEHOLD SIZE
203
LABOR FORCE [ PEOPLE ]
61.9%
PERCENT IN LABOR FORCE
8.4%
UNEMPLOYMENT RATE
Cary Zip Codes
Cary Area Codes
Income in Cary
Income Overview in Cary
Per Capita Income in Cary is $20,535, while median incomes of families and households are $53,125 and $40,000 respectively.
| Characteristic | Number | Measure |
| Per Capita Income | 414 | $20,535 |
| Median Family Income | 65 | $53,125 |
| Mean Family Income | 65 | $55,726 |
| Median Household Income | 102 | $40,000 |
| Mean Household Income | 102 | $52,094 |
| Income Deficit | 65 | $0 |
| Wage / Income Gap (%) | 414 | 64.48% |
| Wage / Income Gap ($) | 414 | 35.52¢ per $1 |
| Gini / Inequality Index | 414 | 0.44 |
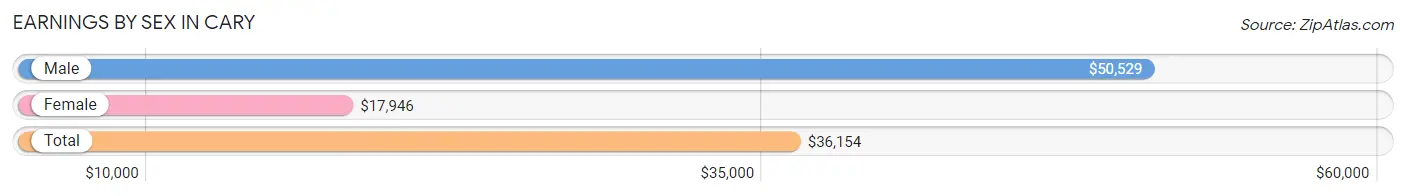
Earnings by Sex in Cary
Average Earnings in Cary are $36,154, $50,529 for men and $17,946 for women, a difference of 64.5%.
| Sex | Number | Average Earnings |
| Male | 109 (58.0%) | $50,529 |
| Female | 79 (42.0%) | $17,946 |
| Total | 188 (100.0%) | $36,154 |
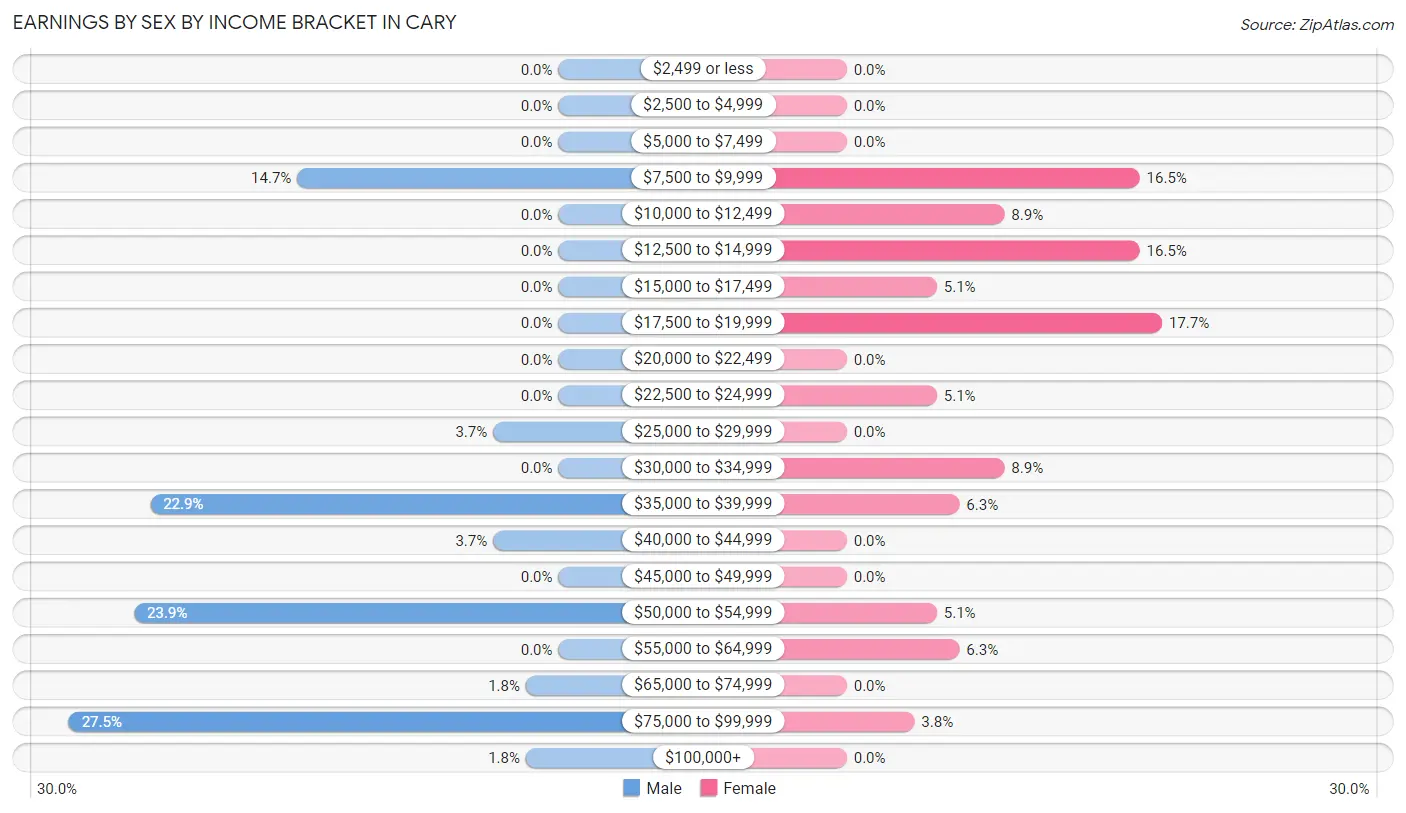
Earnings by Sex by Income Bracket in Cary
The most common earnings brackets in Cary are $75,000 to $99,999 for men (30 | 27.5%) and $17,500 to $19,999 for women (14 | 17.7%).
| Income | Male | Female |
| $2,499 or less | 0 (0.0%) | 0 (0.0%) |
| $2,500 to $4,999 | 0 (0.0%) | 0 (0.0%) |
| $5,000 to $7,499 | 0 (0.0%) | 0 (0.0%) |
| $7,500 to $9,999 | 16 (14.7%) | 13 (16.5%) |
| $10,000 to $12,499 | 0 (0.0%) | 7 (8.9%) |
| $12,500 to $14,999 | 0 (0.0%) | 13 (16.5%) |
| $15,000 to $17,499 | 0 (0.0%) | 4 (5.1%) |
| $17,500 to $19,999 | 0 (0.0%) | 14 (17.7%) |
| $20,000 to $22,499 | 0 (0.0%) | 0 (0.0%) |
| $22,500 to $24,999 | 0 (0.0%) | 4 (5.1%) |
| $25,000 to $29,999 | 4 (3.7%) | 0 (0.0%) |
| $30,000 to $34,999 | 0 (0.0%) | 7 (8.9%) |
| $35,000 to $39,999 | 25 (22.9%) | 5 (6.3%) |
| $40,000 to $44,999 | 4 (3.7%) | 0 (0.0%) |
| $45,000 to $49,999 | 0 (0.0%) | 0 (0.0%) |
| $50,000 to $54,999 | 26 (23.8%) | 4 (5.1%) |
| $55,000 to $64,999 | 0 (0.0%) | 5 (6.3%) |
| $65,000 to $74,999 | 2 (1.8%) | 0 (0.0%) |
| $75,000 to $99,999 | 30 (27.5%) | 3 (3.8%) |
| $100,000+ | 2 (1.8%) | 0 (0.0%) |
| Total | 109 (100.0%) | 79 (100.0%) |
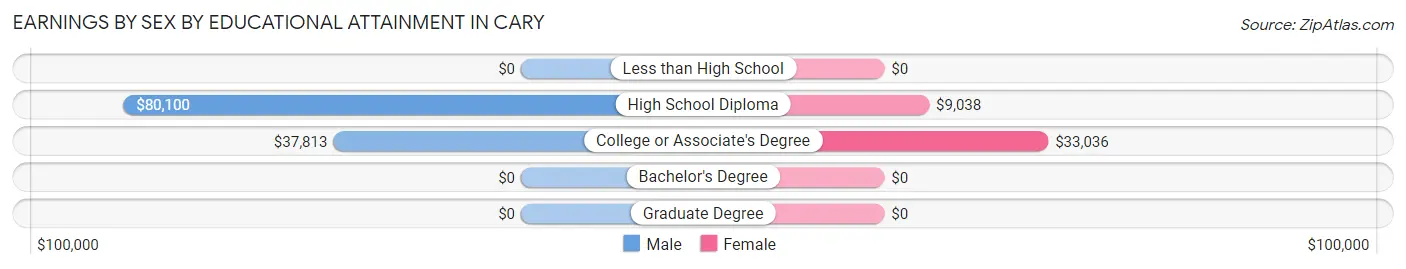
Earnings by Sex by Educational Attainment in Cary
Average earnings in Cary are $51,827 for men and $19,286 for women, a difference of 62.8%. Men with an educational attainment of high school diploma enjoy the highest average annual earnings of $80,100, while those with college or associate's degree education earn the least with $37,813. Women with an educational attainment of college or associate's degree earn the most with the average annual earnings of $33,036, while those with high school diploma education have the smallest earnings of $9,038.
| Educational Attainment | Male Income | Female Income |
| Less than High School | - | - |
| High School Diploma | $80,100 | $9,038 |
| College or Associate's Degree | $37,813 | $33,036 |
| Bachelor's Degree | - | - |
| Graduate Degree | - | - |
| Total | $51,827 | $19,286 |
Family Income in Cary
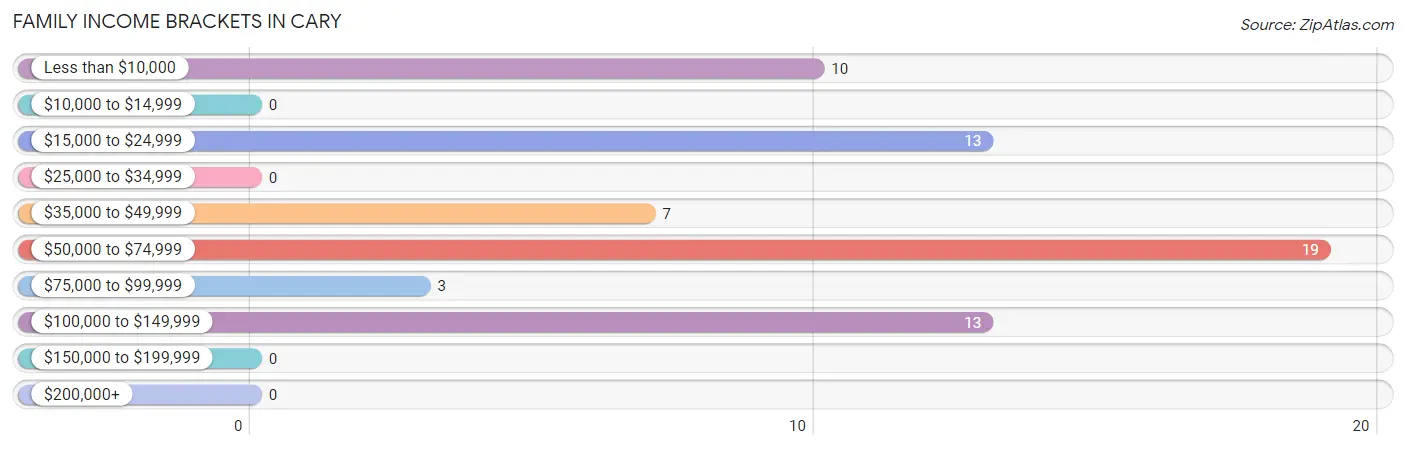
Family Income Brackets in Cary
According to the Cary family income data, there are 19 families falling into the $50,000 to $74,999 income range, which is the most common income bracket and makes up 29.2% of all families.
| Income Bracket | # Families | % Families |
| Less than $10,000 | 10 | 15.4% |
| $10,000 to $14,999 | 0 | 0.0% |
| $15,000 to $24,999 | 13 | 20.0% |
| $25,000 to $34,999 | 0 | 0.0% |
| $35,000 to $49,999 | 7 | 10.8% |
| $50,000 to $74,999 | 19 | 29.2% |
| $75,000 to $99,999 | 3 | 4.6% |
| $100,000 to $149,999 | 13 | 20.0% |
| $150,000 to $199,999 | 0 | 0.0% |
| $200,000+ | 0 | 0.0% |
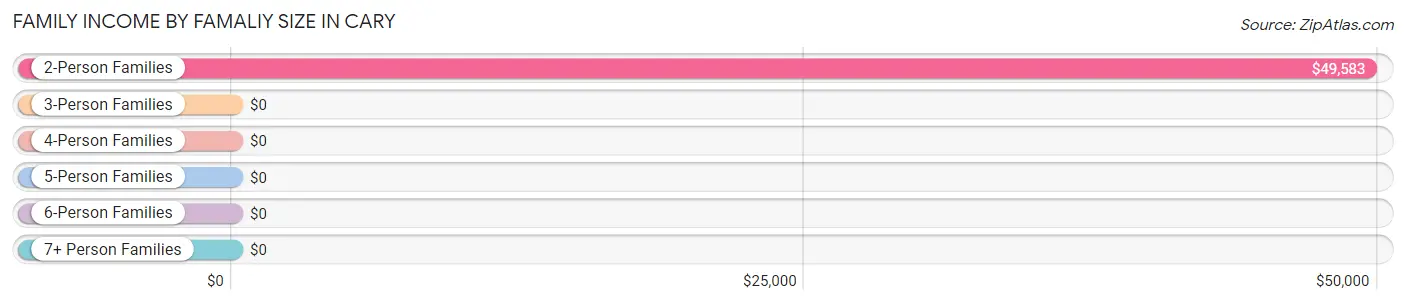
Family Income by Famaliy Size in Cary
2-person families (29 | 44.6%) account for the highest median family income in Cary with $49,583 per family, while 2-person families (29 | 44.6%) have the highest median income of $24,792 per family member.
| Income Bracket | # Families | Median Income |
| 2-Person Families | 29 (44.6%) | $49,583 |
| 3-Person Families | 25 (38.5%) | $0 |
| 4-Person Families | 3 (4.6%) | $0 |
| 5-Person Families | 0 (0.0%) | $0 |
| 6-Person Families | 4 (6.1%) | $0 |
| 7+ Person Families | 4 (6.1%) | $0 |
| Total | 65 (100.0%) | $53,125 |
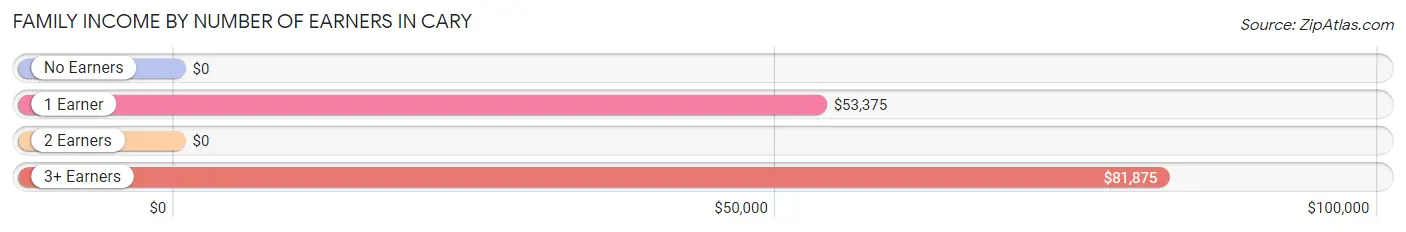
Family Income by Number of Earners in Cary
| Number of Earners | # Families | Median Income |
| No Earners | 16 (24.6%) | $0 |
| 1 Earner | 31 (47.7%) | $53,375 |
| 2 Earners | 7 (10.8%) | $0 |
| 3+ Earners | 11 (16.9%) | $81,875 |
| Total | 65 (100.0%) | $53,125 |
Household Income in Cary
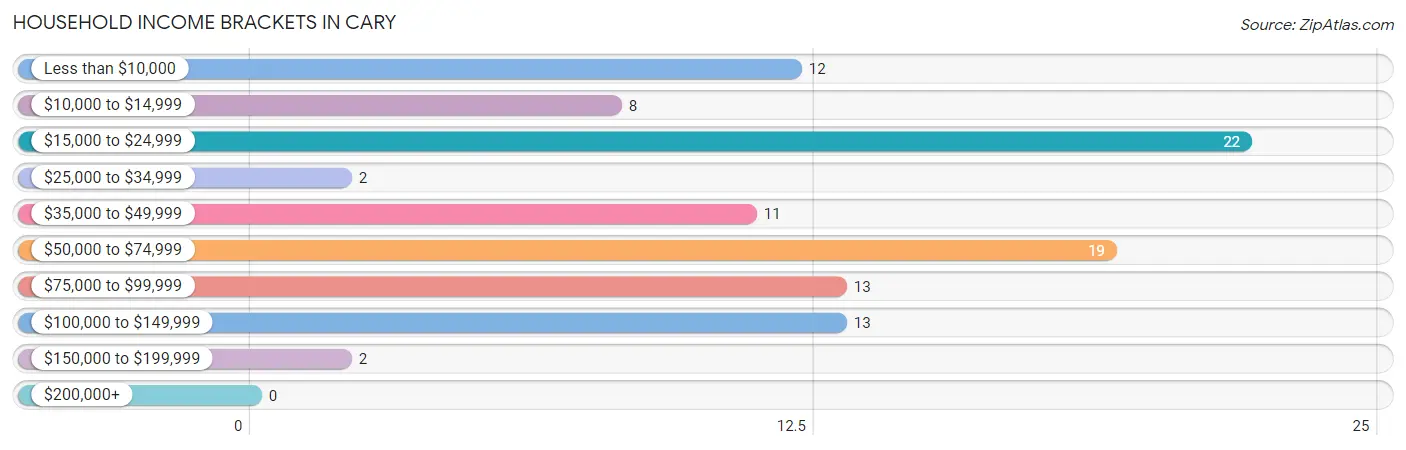
Household Income Brackets in Cary
With 22 households falling in the category, the $15,000 to $24,999 income range is the most frequent in Cary, accounting for 21.6% of all households.
| Income Bracket | # Households | % Households |
| Less than $10,000 | 12 | 11.8% |
| $10,000 to $14,999 | 8 | 7.8% |
| $15,000 to $24,999 | 22 | 21.6% |
| $25,000 to $34,999 | 2 | 2.0% |
| $35,000 to $49,999 | 11 | 10.8% |
| $50,000 to $74,999 | 19 | 18.6% |
| $75,000 to $99,999 | 13 | 12.7% |
| $100,000 to $149,999 | 13 | 12.7% |
| $150,000 to $199,999 | 2 | 2.0% |
| $200,000+ | 0 | 0.0% |
Household Income by Householder Age in Cary
The median household income in Cary is $40,000, with the highest median household income of $45,000 found in the 65+ years age bracket for the primary householder. A total of 36 households (35.3%) fall into this category. Meanwhile, the 15 to 24 years age bracket for the primary householder has the lowest median household income of $0, with 10 households (9.8%) in this group.
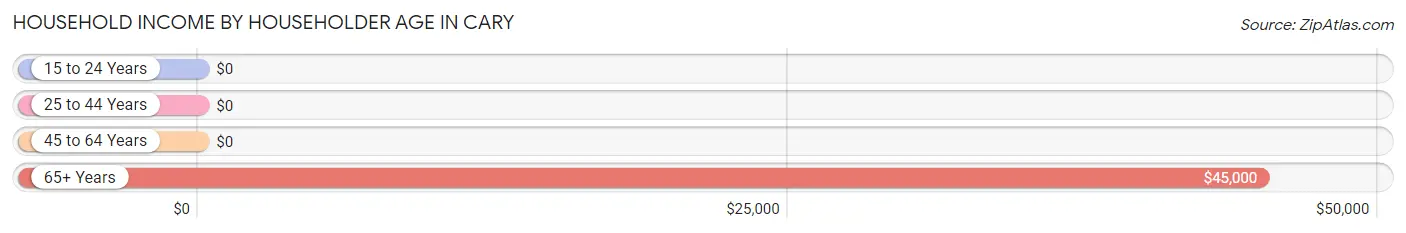
| Income Bracket | # Households | Median Income |
| 15 to 24 Years | 10 (9.8%) | $0 |
| 25 to 44 Years | 5 (4.9%) | $0 |
| 45 to 64 Years | 51 (50.0%) | $0 |
| 65+ Years | 36 (35.3%) | $45,000 |
| Total | 102 (100.0%) | $40,000 |
Poverty in Cary
Income Below Poverty by Sex and Age in Cary
With 43.7% poverty level for males and 38.4% for females among the residents of Cary, under 5 year old males and under 5 year old females are the most vulnerable to poverty, with 12 males (100.0%) and 19 females (100.0%) in their respective age groups living below the poverty level.
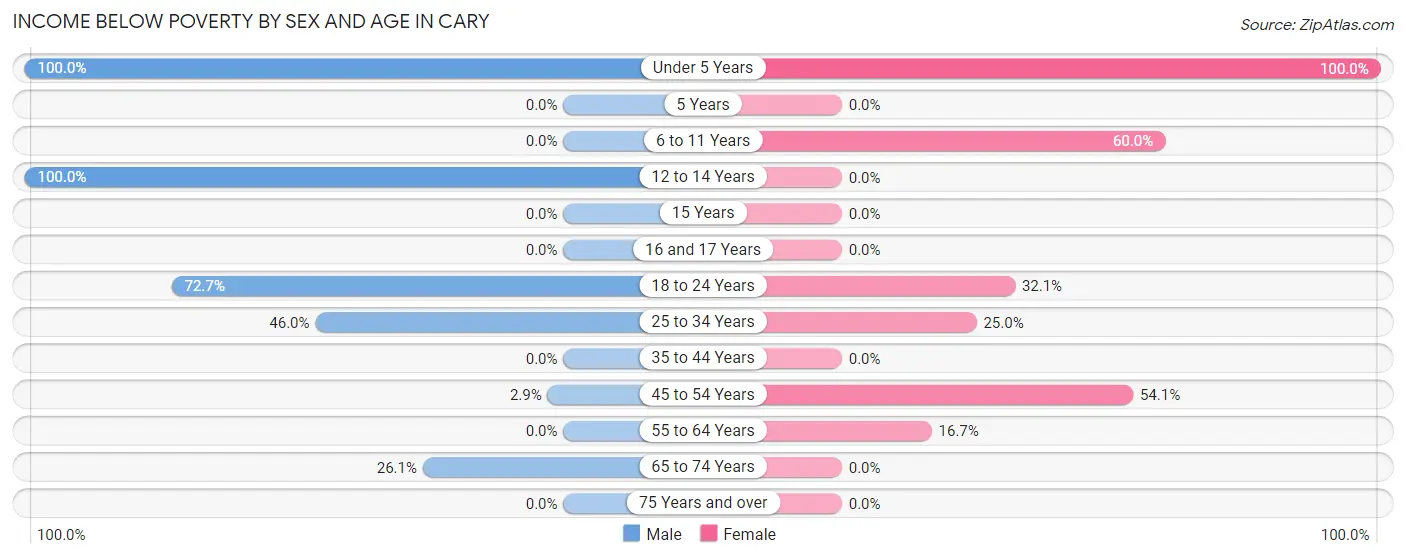
| Age Bracket | Male | Female |
| Under 5 Years | 12 (100.0%) | 19 (100.0%) |
| 5 Years | 0 (0.0%) | 0 (0.0%) |
| 6 to 11 Years | 0 (0.0%) | 15 (60.0%) |
| 12 to 14 Years | 20 (100.0%) | 0 (0.0%) |
| 15 Years | 0 (0.0%) | 0 (0.0%) |
| 16 and 17 Years | 0 (0.0%) | 0 (0.0%) |
| 18 to 24 Years | 32 (72.7%) | 9 (32.1%) |
| 25 to 34 Years | 29 (46.0%) | 4 (25.0%) |
| 35 to 44 Years | 0 (0.0%) | 0 (0.0%) |
| 45 to 54 Years | 1 (2.9%) | 20 (54.0%) |
| 55 to 64 Years | 0 (0.0%) | 4 (16.7%) |
| 65 to 74 Years | 6 (26.1%) | 0 (0.0%) |
| 75 Years and over | 0 (0.0%) | 0 (0.0%) |
| Total | 100 (43.7%) | 71 (38.4%) |
Income Above Poverty by Sex and Age in Cary
According to the poverty statistics in Cary, males aged 6 to 11 years and females aged 16 and 17 years are the age groups that are most secure financially, with 100.0% of males and 100.0% of females in these age groups living above the poverty line.
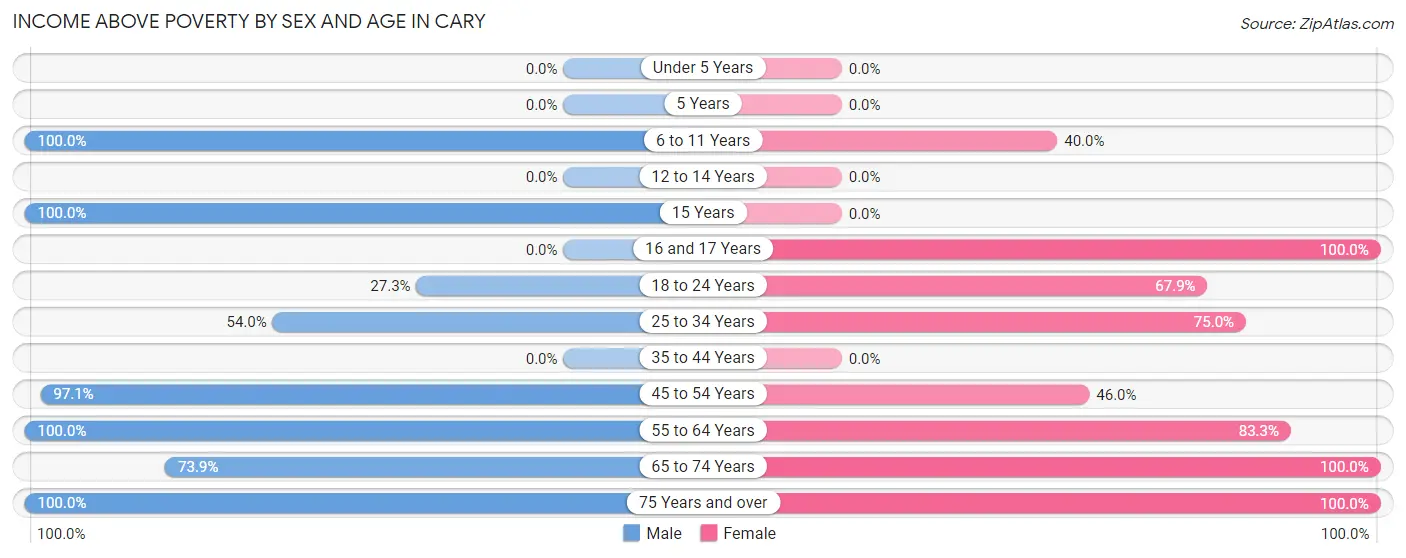
| Age Bracket | Male | Female |
| Under 5 Years | 0 (0.0%) | 0 (0.0%) |
| 5 Years | 0 (0.0%) | 0 (0.0%) |
| 6 to 11 Years | 2 (100.0%) | 10 (40.0%) |
| 12 to 14 Years | 0 (0.0%) | 0 (0.0%) |
| 15 Years | 8 (100.0%) | 0 (0.0%) |
| 16 and 17 Years | 0 (0.0%) | 17 (100.0%) |
| 18 to 24 Years | 12 (27.3%) | 19 (67.9%) |
| 25 to 34 Years | 34 (54.0%) | 12 (75.0%) |
| 35 to 44 Years | 0 (0.0%) | 0 (0.0%) |
| 45 to 54 Years | 33 (97.1%) | 17 (46.0%) |
| 55 to 64 Years | 15 (100.0%) | 20 (83.3%) |
| 65 to 74 Years | 17 (73.9%) | 6 (100.0%) |
| 75 Years and over | 8 (100.0%) | 13 (100.0%) |
| Total | 129 (56.3%) | 114 (61.6%) |
Income Below Poverty Among Married-Couple Families in Cary
The poverty statistics for married-couple families in Cary show that 3.8% or 1 of the total 26 families live below the poverty line. Families with 1 or 2 children have the highest poverty rate of 14.3%, comprising of 1 families. On the other hand, families with no children have the lowest poverty rate of 0.0%, which includes 0 families.
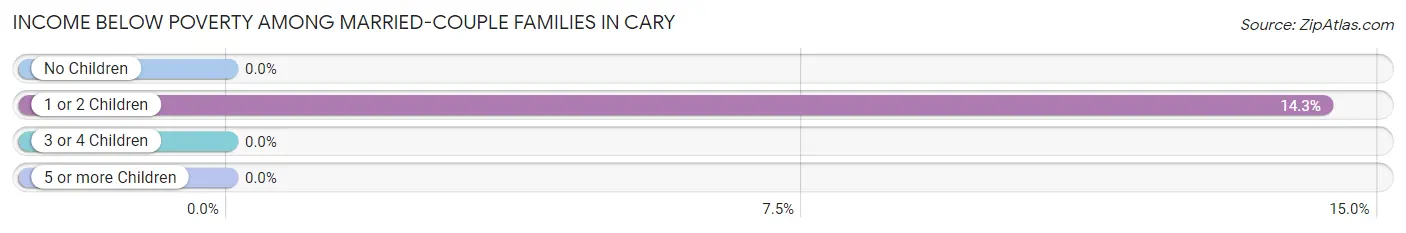
| Children | Above Poverty | Below Poverty |
| No Children | 19 (100.0%) | 0 (0.0%) |
| 1 or 2 Children | 6 (85.7%) | 1 (14.3%) |
| 3 or 4 Children | 0 (0.0%) | 0 (0.0%) |
| 5 or more Children | 0 (0.0%) | 0 (0.0%) |
| Total | 25 (96.2%) | 1 (3.8%) |
Income Below Poverty Among Single-Parent Households in Cary
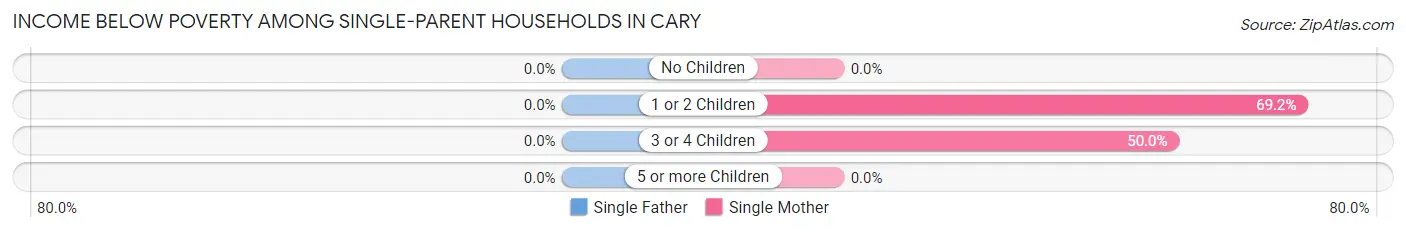
| Children | Single Father | Single Mother |
| No Children | 0 (0.0%) | 0 (0.0%) |
| 1 or 2 Children | 0 (0.0%) | 9 (69.2%) |
| 3 or 4 Children | 0 (0.0%) | 4 (50.0%) |
| 5 or more Children | 0 (0.0%) | 0 (0.0%) |
| Total | 0 (0.0%) | 13 (34.2%) |
Income Below Poverty Among Married-Couple vs Single-Parent Households in Cary
The poverty data for Cary shows that 1 of the married-couple family households (3.8%) and 13 of the single-parent households (33.3%) are living below the poverty level. Within the married-couple family households, those with 1 or 2 children have the highest poverty rate, with 1 households (14.3%) falling below the poverty line. Among the single-parent households, those with 1 or 2 children have the highest poverty rate, with 9 household (69.2%) living below poverty.
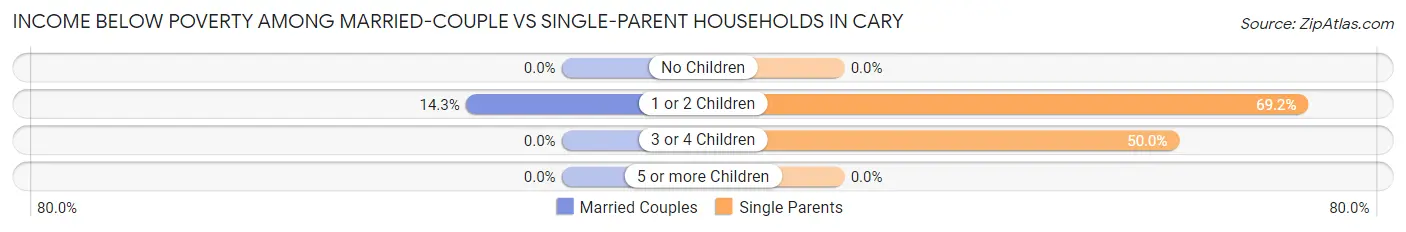
| Children | Married-Couple Families | Single-Parent Households |
| No Children | 0 (0.0%) | 0 (0.0%) |
| 1 or 2 Children | 1 (14.3%) | 9 (69.2%) |
| 3 or 4 Children | 0 (0.0%) | 4 (50.0%) |
| 5 or more Children | 0 (0.0%) | 0 (0.0%) |
| Total | 1 (3.8%) | 13 (33.3%) |
Race in Cary
The most populous races in Cary are Black / African American (301 | 72.7%), White / Caucasian (85 | 20.5%), and Hispanic or Latino (28 | 6.8%).
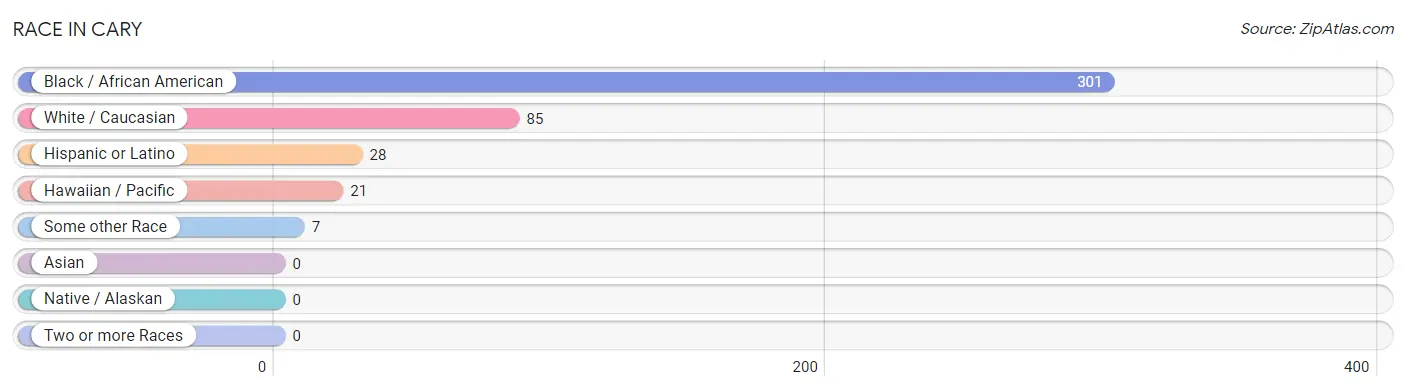
| Race | # Population | % Population |
| Asian | 0 | 0.0% |
| Black / African American | 301 | 72.7% |
| Hawaiian / Pacific | 21 | 5.1% |
| Hispanic or Latino | 28 | 6.8% |
| Native / Alaskan | 0 | 0.0% |
| White / Caucasian | 85 | 20.5% |
| Two or more Races | 0 | 0.0% |
| Some other Race | 7 | 1.7% |
| Total | 414 | 100.0% |
Ancestry in Cary
The most populous ancestries reported in Cary are Cuban (21 | 5.1%), American (16 | 3.9%), English (15 | 3.6%), Irish (8 | 1.9%), and Mexican (7 | 1.7%), together accounting for 16.2% of all Cary residents.
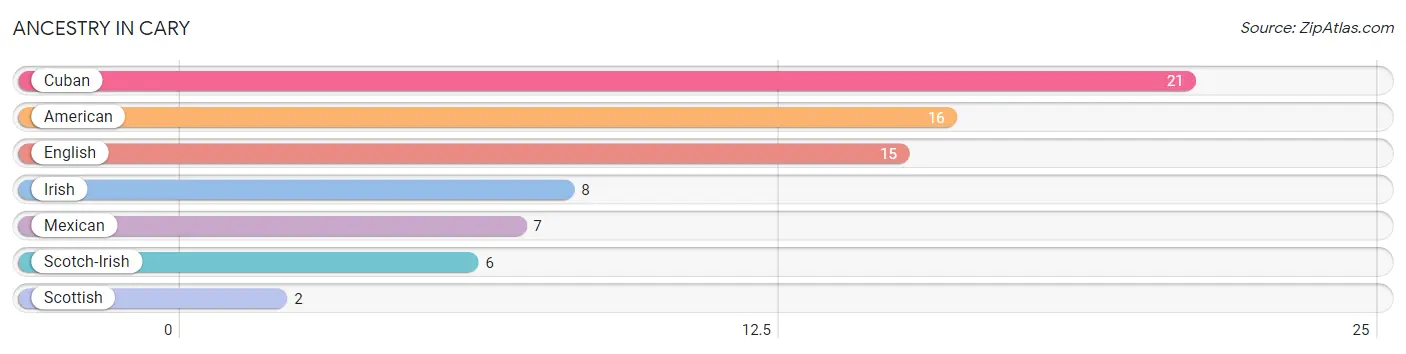
| Ancestry | # Population | % Population |
| American | 16 | 3.9% |
| Cuban | 21 | 5.1% |
| English | 15 | 3.6% |
| Irish | 8 | 1.9% |
| Mexican | 7 | 1.7% |
| Scotch-Irish | 6 | 1.5% |
| Scottish | 2 | 0.5% | View All 7 Rows |
Immigrants in Cary

| Immigration Origin | # Population | % Population | View All 0 Rows |
Sex and Age in Cary
Sex and Age in Cary
The most populous age groups in Cary are 25 to 29 Years (61 | 26.6%) for men and 20 to 24 Years (28 | 15.1%) for women.
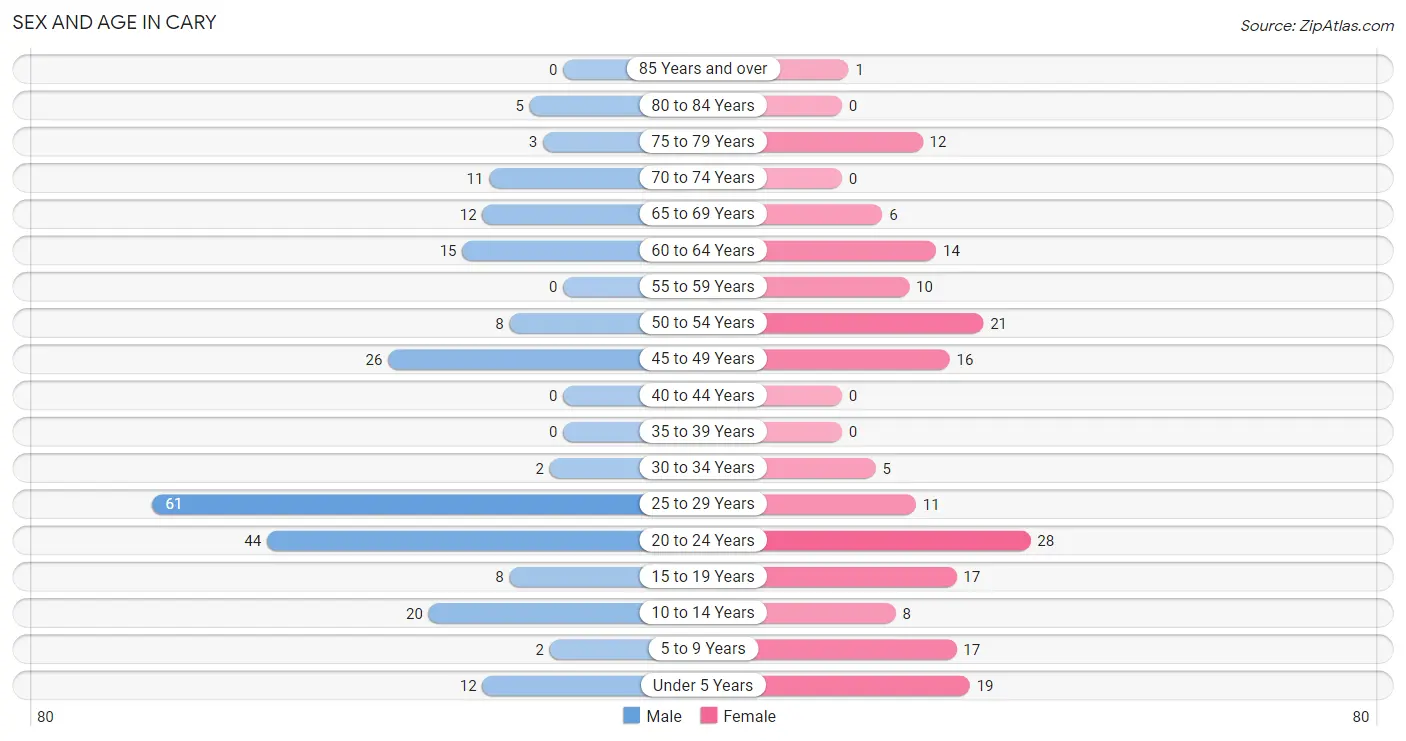
| Age Bracket | Male | Female |
| Under 5 Years | 12 (5.2%) | 19 (10.3%) |
| 5 to 9 Years | 2 (0.9%) | 17 (9.2%) |
| 10 to 14 Years | 20 (8.7%) | 8 (4.3%) |
| 15 to 19 Years | 8 (3.5%) | 17 (9.2%) |
| 20 to 24 Years | 44 (19.2%) | 28 (15.1%) |
| 25 to 29 Years | 61 (26.6%) | 11 (5.9%) |
| 30 to 34 Years | 2 (0.9%) | 5 (2.7%) |
| 35 to 39 Years | 0 (0.0%) | 0 (0.0%) |
| 40 to 44 Years | 0 (0.0%) | 0 (0.0%) |
| 45 to 49 Years | 26 (11.4%) | 16 (8.6%) |
| 50 to 54 Years | 8 (3.5%) | 21 (11.4%) |
| 55 to 59 Years | 0 (0.0%) | 10 (5.4%) |
| 60 to 64 Years | 15 (6.6%) | 14 (7.6%) |
| 65 to 69 Years | 12 (5.2%) | 6 (3.2%) |
| 70 to 74 Years | 11 (4.8%) | 0 (0.0%) |
| 75 to 79 Years | 3 (1.3%) | 12 (6.5%) |
| 80 to 84 Years | 5 (2.2%) | 0 (0.0%) |
| 85 Years and over | 0 (0.0%) | 1 (0.5%) |
| Total | 229 (100.0%) | 185 (100.0%) |
Families and Households in Cary
Median Family Size in Cary
The median family size in Cary is 4.89 persons per family, with single female/mother families (38 | 58.5%) accounting for the largest median family size of 5.68 persons per family. On the other hand, married-couple families (26 | 40.0%) represent the smallest median family size with 3.77 persons per family.
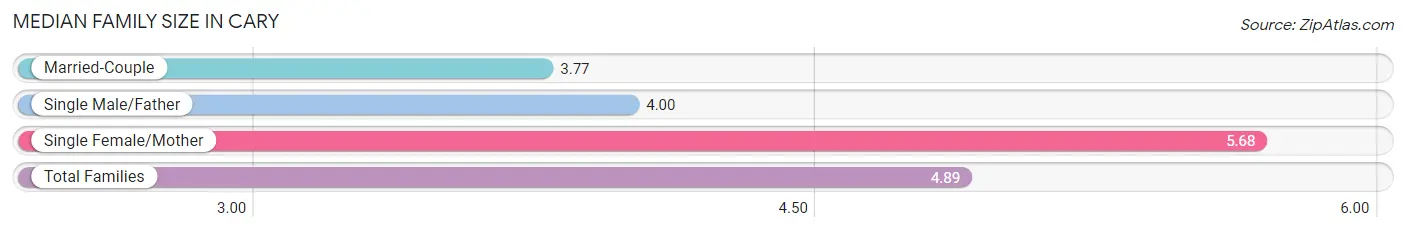
| Family Type | # Families | Family Size |
| Married-Couple | 26 (40.0%) | 3.77 |
| Single Male/Father | 1 (1.5%) | 4.00 |
| Single Female/Mother | 38 (58.5%) | 5.68 |
| Total Families | 65 (100.0%) | 4.89 |
Median Household Size in Cary
The median household size in Cary is 4.06 persons per household, with single female/mother households (38 | 37.2%) accounting for the largest median household size of 6.45 persons per household. non-family households (37 | 36.3%) represent the smallest median household size with 1.70 persons per household.
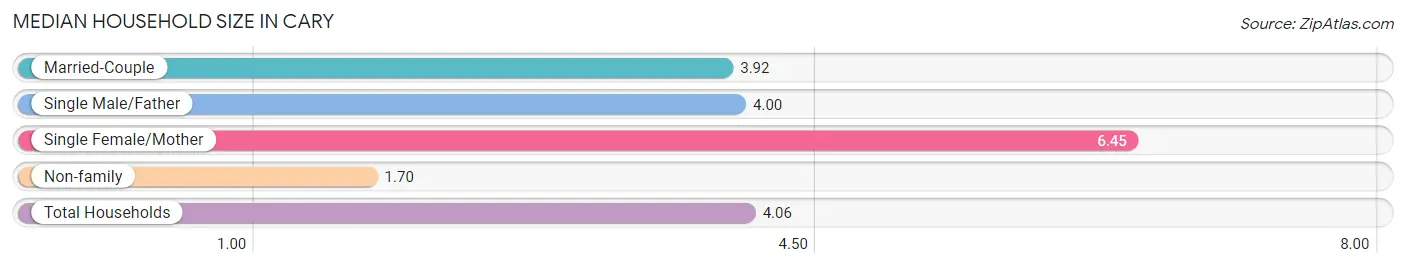
| Household Type | # Households | Household Size |
| Married-Couple | 26 (25.5%) | 3.92 |
| Single Male/Father | 1 (1.0%) | 4.00 |
| Single Female/Mother | 38 (37.2%) | 6.45 |
| Non-family | 37 (36.3%) | 1.70 |
| Total Households | 102 (100.0%) | 4.06 |
Household Size by Marriage Status in Cary
Out of a total of 102 households in Cary, 65 (63.7%) are family households, while 37 (36.3%) are nonfamily households. The most numerous type of family households are 2-person households, comprising 26, and the most common type of nonfamily households are 1-person households, comprising 28.
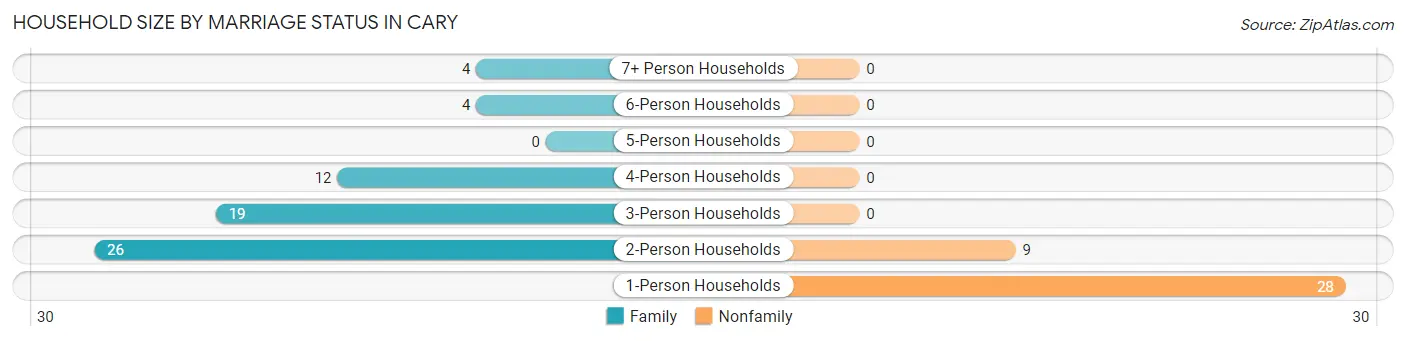
| Household Size | Family Households | Nonfamily Households |
| 1-Person Households | - | 28 (27.5%) |
| 2-Person Households | 26 (25.5%) | 9 (8.8%) |
| 3-Person Households | 19 (18.6%) | 0 (0.0%) |
| 4-Person Households | 12 (11.8%) | 0 (0.0%) |
| 5-Person Households | 0 (0.0%) | 0 (0.0%) |
| 6-Person Households | 4 (3.9%) | 0 (0.0%) |
| 7+ Person Households | 4 (3.9%) | 0 (0.0%) |
| Total | 65 (63.7%) | 37 (36.3%) |
Female Fertility in Cary
Fertility by Age in Cary
Average fertility rate in Cary is 169.0 births per 1,000 women. Women in the age bracket of 20 to 34 years have the highest fertility rate with 295.0 births per 1,000 women. Women in the age bracket of 20 to 34 years acount for 100.0% of all women with births.
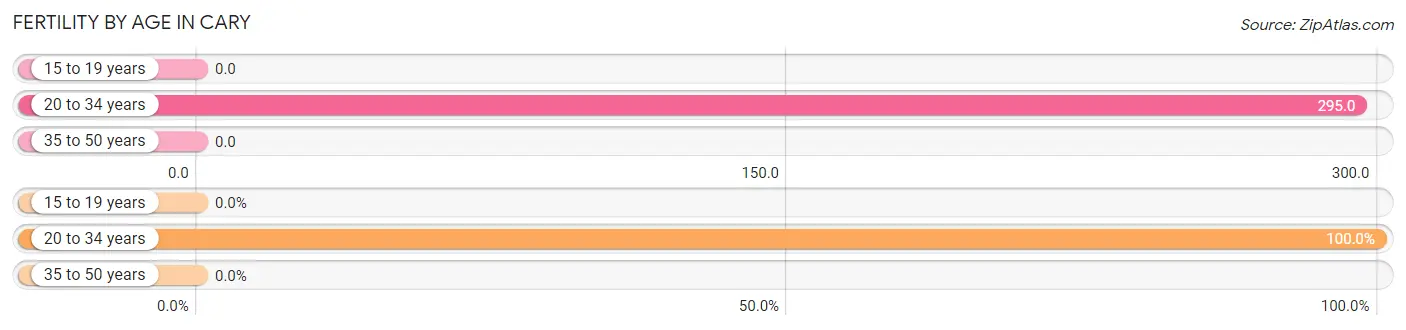
| Age Bracket | Women with Births | Births / 1,000 Women |
| 15 to 19 years | 0 (0.0%) | 0.0 |
| 20 to 34 years | 13 (100.0%) | 295.0 |
| 35 to 50 years | 0 (0.0%) | 0.0 |
| Total | 13 (100.0%) | 169.0 |
Fertility by Age by Marriage Status in Cary
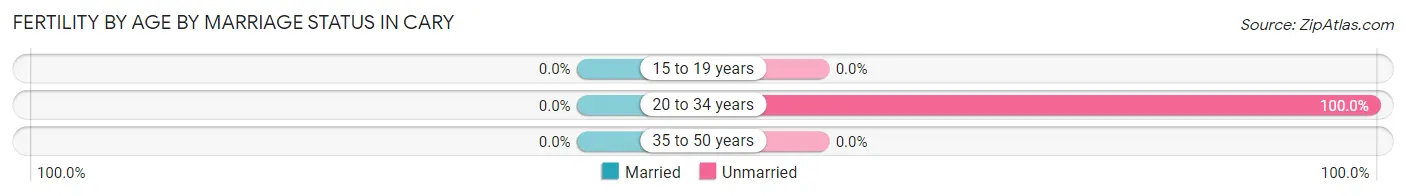
| Age Bracket | Married | Unmarried |
| 15 to 19 years | 0 (0.0%) | 0 (0.0%) |
| 20 to 34 years | 0 (0.0%) | 13 (100.0%) |
| 35 to 50 years | 0 (0.0%) | 0 (0.0%) |
| Total | 0 (0.0%) | 13 (100.0%) |
Fertility by Education in Cary
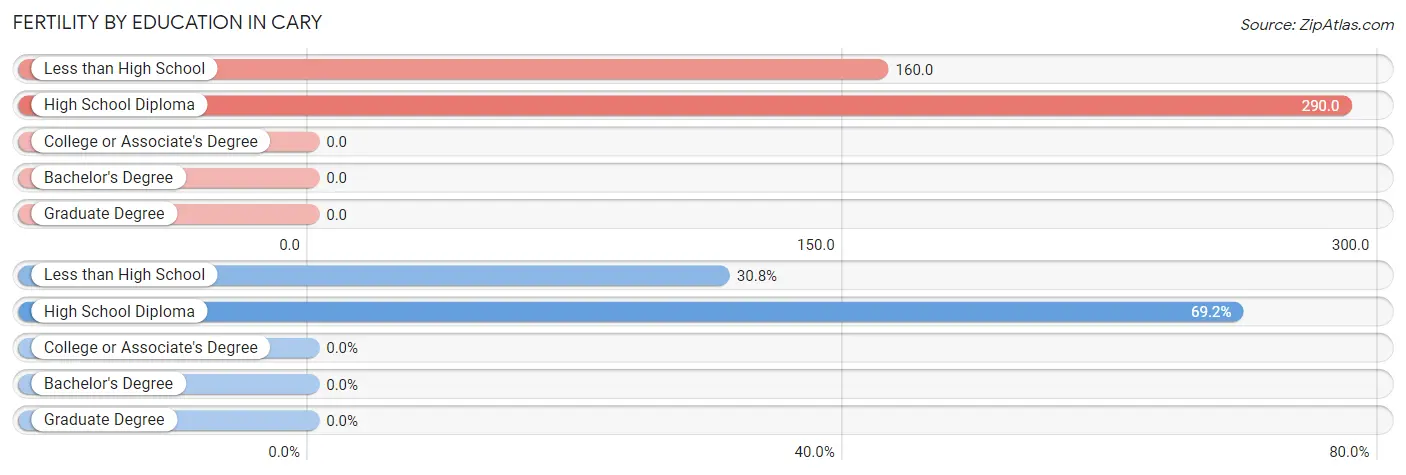
| Educational Attainment | Women with Births | Births / 1,000 Women |
| Less than High School | 4 (30.8%) | 160.0 |
| High School Diploma | 9 (69.2%) | 290.0 |
| College or Associate's Degree | 0 (0.0%) | 0.0 |
| Bachelor's Degree | 0 (0.0%) | 0.0 |
| Graduate Degree | 0 (0.0%) | 0.0 |
| Total | 13 (100.0%) | 169.0 |
Fertility by Education by Marriage Status in Cary
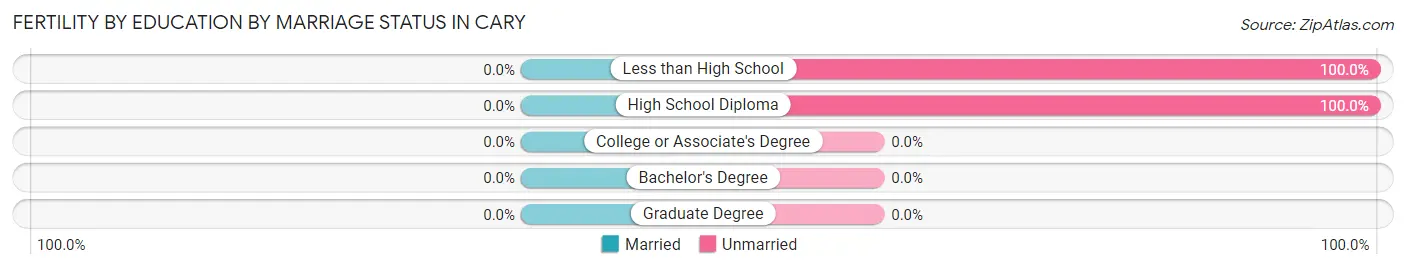
| Educational Attainment | Married | Unmarried |
| Less than High School | 0 (0.0%) | 4 (100.0%) |
| High School Diploma | 0 (0.0%) | 9 (100.0%) |
| College or Associate's Degree | 0 (0.0%) | 0 (0.0%) |
| Bachelor's Degree | 0 (0.0%) | 0 (0.0%) |
| Graduate Degree | 0 (0.0%) | 0 (0.0%) |
| Total | 0 (0.0%) | 13 (100.0%) |
Employment Characteristics in Cary
Employment by Class of Employer in Cary
Among the 186 employed individuals in Cary, private company employees (95 | 51.1%), not-for-profit organizations (73 | 39.3%), and state government employees (11 | 5.9%) make up the most common classes of employment.
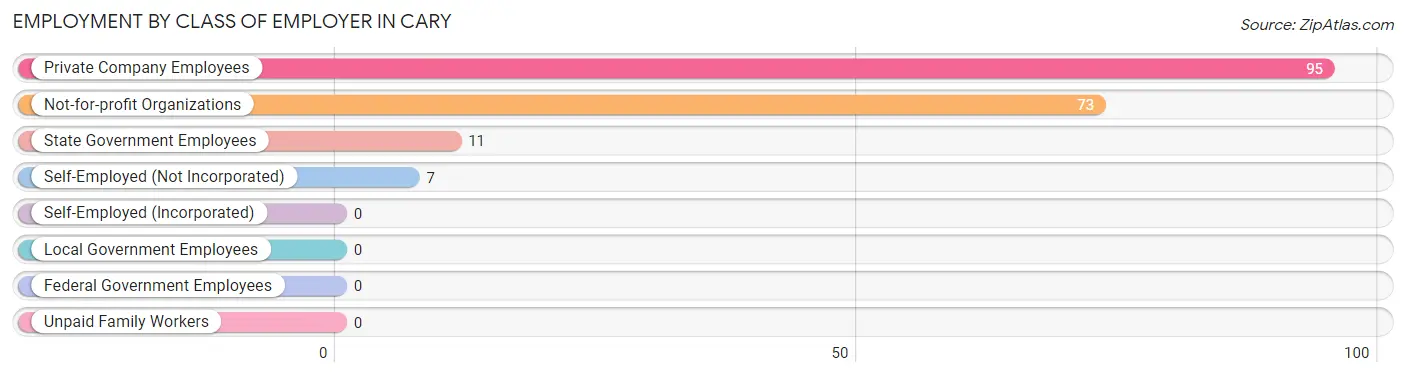
| Employer Class | # Employees | % Employees |
| Private Company Employees | 95 | 51.1% |
| Self-Employed (Incorporated) | 0 | 0.0% |
| Self-Employed (Not Incorporated) | 7 | 3.8% |
| Not-for-profit Organizations | 73 | 39.3% |
| Local Government Employees | 0 | 0.0% |
| State Government Employees | 11 | 5.9% |
| Federal Government Employees | 0 | 0.0% |
| Unpaid Family Workers | 0 | 0.0% |
| Total | 186 | 100.0% |
Employment Status by Age in Cary
According to the labor force statistics for Cary, out of the total population over 16 years of age (328), 61.9% or 203 individuals are in the labor force, with 8.4% or 17 of them unemployed. The age group with the highest labor force participation rate is 30 to 34 years, with 100.0% or 7 individuals in the labor force. Within the labor force, the 20 to 24 years age range has the highest percentage of unemployed individuals, with 25.8% or 16 of them being unemployed.
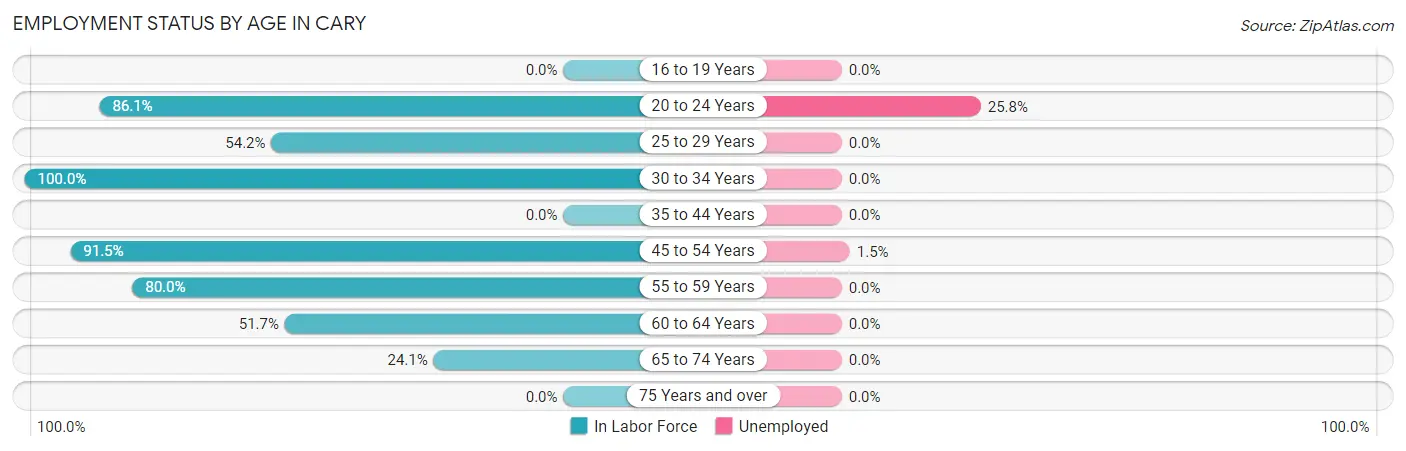
| Age Bracket | In Labor Force | Unemployed |
| 16 to 19 Years | 0 (0.0%) | 0 (0.0%) |
| 20 to 24 Years | 62 (86.1%) | 16 (25.8%) |
| 25 to 29 Years | 39 (54.2%) | 0 (0.0%) |
| 30 to 34 Years | 7 (100.0%) | 0 (0.0%) |
| 35 to 44 Years | 0 (0.0%) | 0 (0.0%) |
| 45 to 54 Years | 65 (91.5%) | 1 (1.5%) |
| 55 to 59 Years | 8 (80.0%) | 0 (0.0%) |
| 60 to 64 Years | 15 (51.7%) | 0 (0.0%) |
| 65 to 74 Years | 7 (24.1%) | 0 (0.0%) |
| 75 Years and over | 0 (0.0%) | 0 (0.0%) |
| Total | 203 (61.9%) | 17 (8.4%) |
Employment Status by Educational Attainment in Cary
According to labor force statistics for Cary, 70.9% of individuals (134) out of the total population between 25 and 64 years of age (189) are in the labor force, with 0.7% or 1 of them being unemployed. The group with the highest labor force participation rate are those with the educational attainment of bachelor's degree or higher, with 95.5% or 21 individuals in the labor force. Within the labor force, individuals with college / associate degree education have the highest percentage of unemployment, with 3.2% or 1 of them being unemployed.
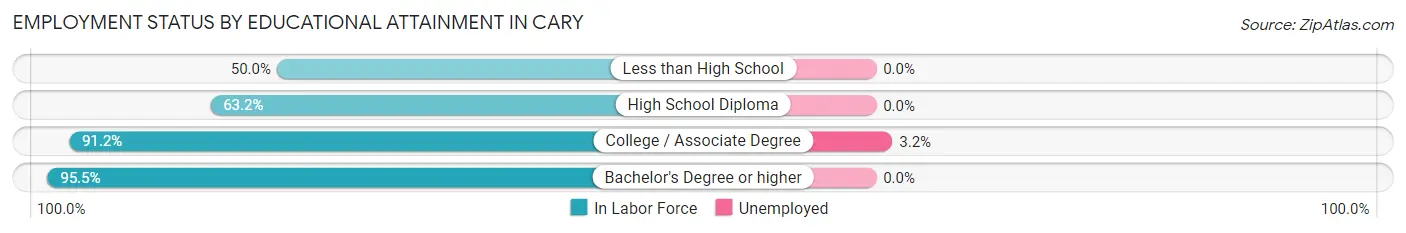
| Educational Attainment | In Labor Force | Unemployed |
| Less than High School | 8 (50.0%) | 0 (0.0%) |
| High School Diploma | 74 (63.2%) | 0 (0.0%) |
| College / Associate Degree | 31 (91.2%) | 1 (3.2%) |
| Bachelor's Degree or higher | 21 (95.5%) | 0 (0.0%) |
| Total | 134 (70.9%) | 1 (0.7%) |
Employment Occupations by Sex in Cary
Management, Business, Science and Arts Occupations
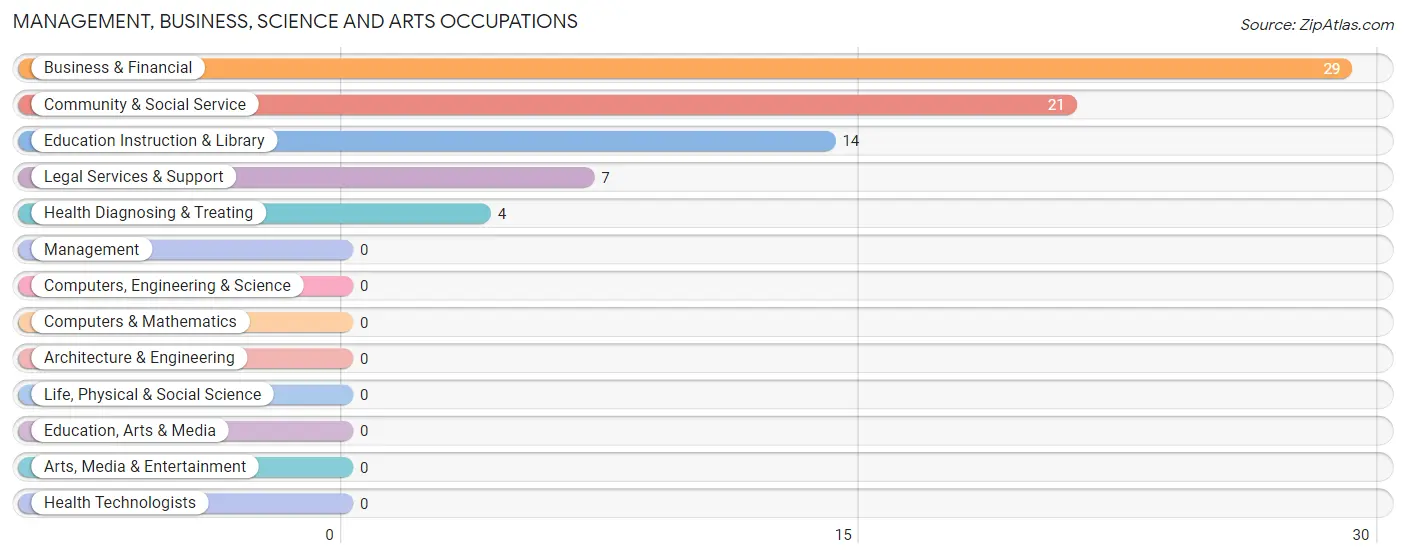
The most common Management, Business, Science and Arts occupations in Cary are Business & Financial (29 | 15.6%), Community & Social Service (21 | 11.3%), Education Instruction & Library (14 | 7.5%), Legal Services & Support (7 | 3.8%), and Health Diagnosing & Treating (4 | 2.1%).
Management, Business, Science and Arts Occupations by Sex
Within the Management, Business, Science and Arts occupations in Cary, the most male-oriented occupations are Health Diagnosing & Treating (100.0%), and Business & Financial (89.7%), while the most female-oriented occupations are Community & Social Service (100.0%), Legal Services & Support (100.0%), and Education Instruction & Library (100.0%).
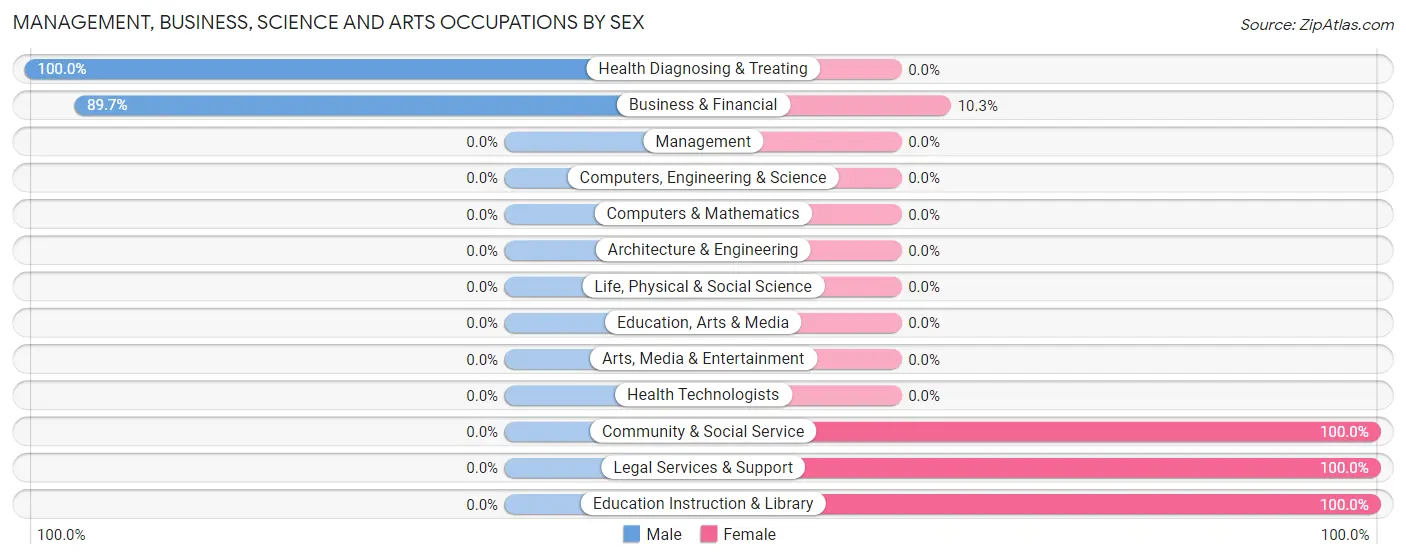
| Occupation | Male | Female |
| Management | 0 (0.0%) | 0 (0.0%) |
| Business & Financial | 26 (89.7%) | 3 (10.3%) |
| Computers, Engineering & Science | 0 (0.0%) | 0 (0.0%) |
| Computers & Mathematics | 0 (0.0%) | 0 (0.0%) |
| Architecture & Engineering | 0 (0.0%) | 0 (0.0%) |
| Life, Physical & Social Science | 0 (0.0%) | 0 (0.0%) |
| Community & Social Service | 0 (0.0%) | 21 (100.0%) |
| Education, Arts & Media | 0 (0.0%) | 0 (0.0%) |
| Legal Services & Support | 0 (0.0%) | 7 (100.0%) |
| Education Instruction & Library | 0 (0.0%) | 14 (100.0%) |
| Arts, Media & Entertainment | 0 (0.0%) | 0 (0.0%) |
| Health Diagnosing & Treating | 4 (100.0%) | 0 (0.0%) |
| Health Technologists | 0 (0.0%) | 0 (0.0%) |
| Total (Category) | 30 (55.6%) | 24 (44.4%) |
| Total (Overall) | 107 (57.5%) | 79 (42.5%) |
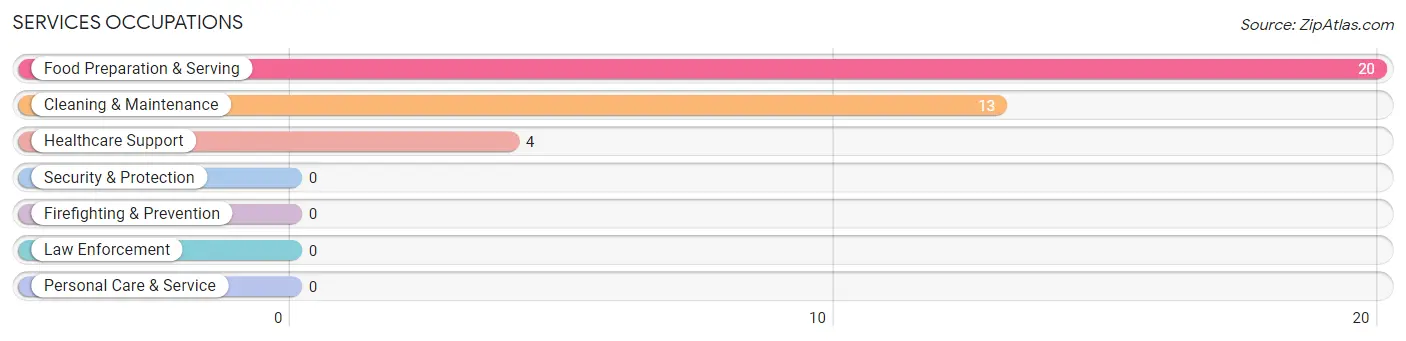
Services Occupations
The most common Services occupations in Cary are Food Preparation & Serving (20 | 10.7%), Cleaning & Maintenance (13 | 7.0%), and Healthcare Support (4 | 2.1%).
Services Occupations by Sex
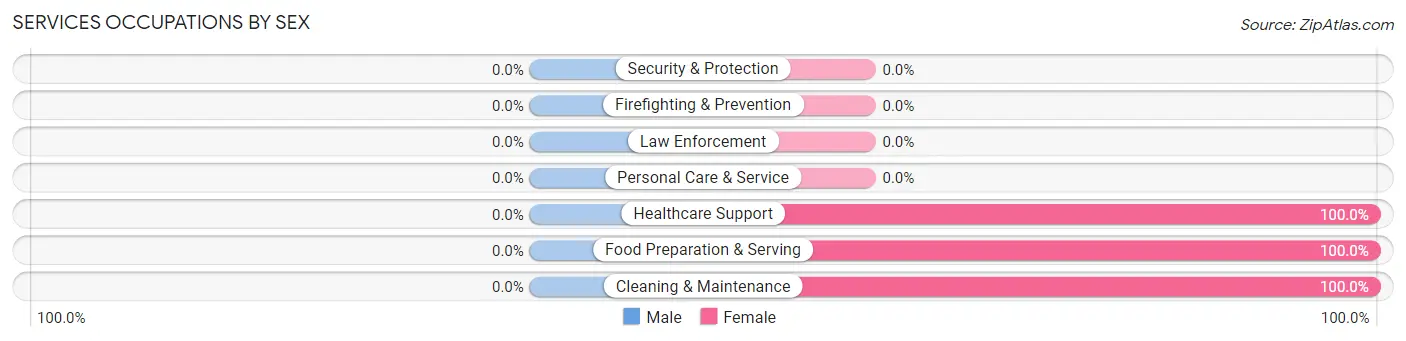
| Occupation | Male | Female |
| Healthcare Support | 0 (0.0%) | 4 (100.0%) |
| Security & Protection | 0 (0.0%) | 0 (0.0%) |
| Firefighting & Prevention | 0 (0.0%) | 0 (0.0%) |
| Law Enforcement | 0 (0.0%) | 0 (0.0%) |
| Food Preparation & Serving | 0 (0.0%) | 20 (100.0%) |
| Cleaning & Maintenance | 0 (0.0%) | 13 (100.0%) |
| Personal Care & Service | 0 (0.0%) | 0 (0.0%) |
| Total (Category) | 0 (0.0%) | 37 (100.0%) |
| Total (Overall) | 107 (57.5%) | 79 (42.5%) |
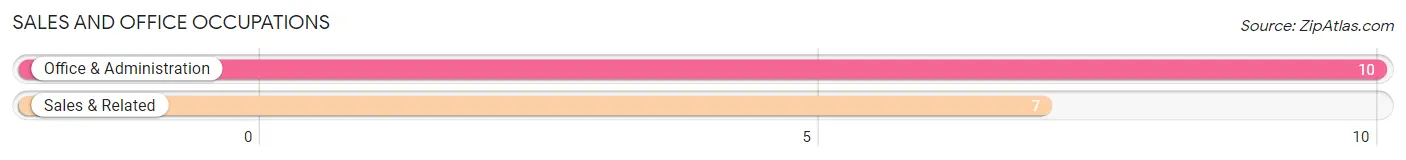
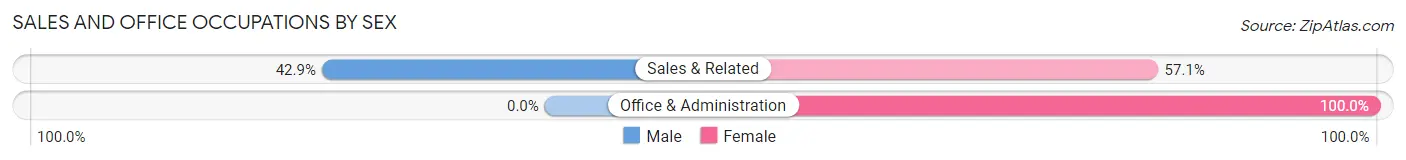
Sales and Office Occupations
The most common Sales and Office occupations in Cary are Office & Administration (10 | 5.4%), and Sales & Related (7 | 3.8%).
Sales and Office Occupations by Sex
| Occupation | Male | Female |
| Sales & Related | 3 (42.9%) | 4 (57.1%) |
| Office & Administration | 0 (0.0%) | 10 (100.0%) |
| Total (Category) | 3 (17.6%) | 14 (82.4%) |
| Total (Overall) | 107 (57.5%) | 79 (42.5%) |
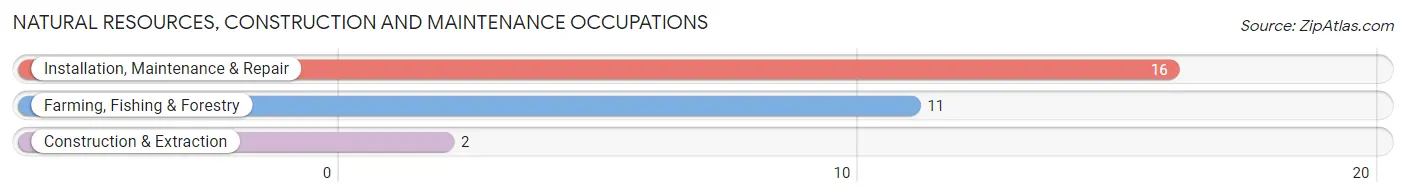
Natural Resources, Construction and Maintenance Occupations
The most common Natural Resources, Construction and Maintenance occupations in Cary are Installation, Maintenance & Repair (16 | 8.6%), Farming, Fishing & Forestry (11 | 5.9%), and Construction & Extraction (2 | 1.1%).
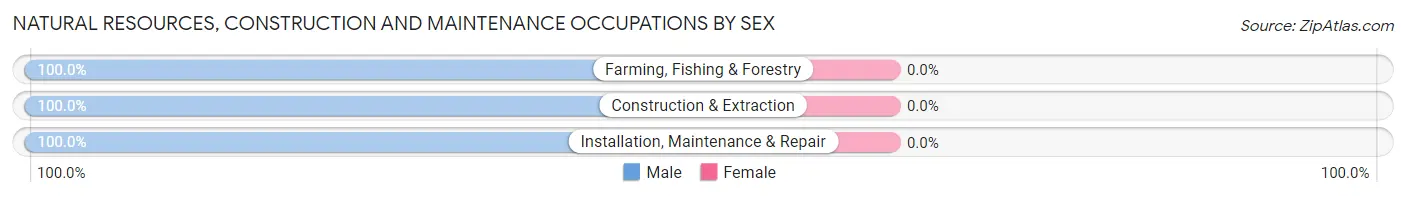
Natural Resources, Construction and Maintenance Occupations by Sex
| Occupation | Male | Female |
| Farming, Fishing & Forestry | 11 (100.0%) | 0 (0.0%) |
| Construction & Extraction | 2 (100.0%) | 0 (0.0%) |
| Installation, Maintenance & Repair | 16 (100.0%) | 0 (0.0%) |
| Total (Category) | 29 (100.0%) | 0 (0.0%) |
| Total (Overall) | 107 (57.5%) | 79 (42.5%) |
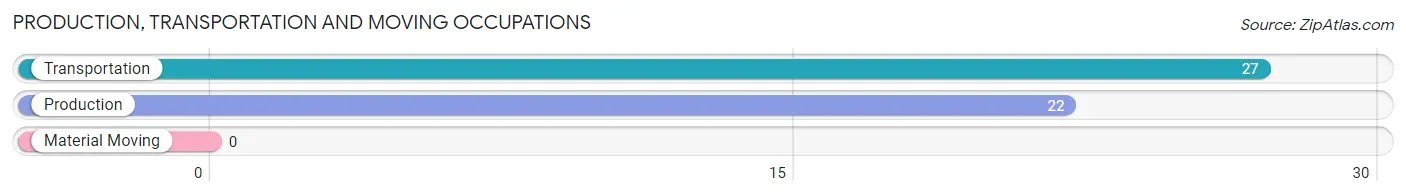
Production, Transportation and Moving Occupations
The most common Production, Transportation and Moving occupations in Cary are Transportation (27 | 14.5%), and Production (22 | 11.8%).
Production, Transportation and Moving Occupations by Sex
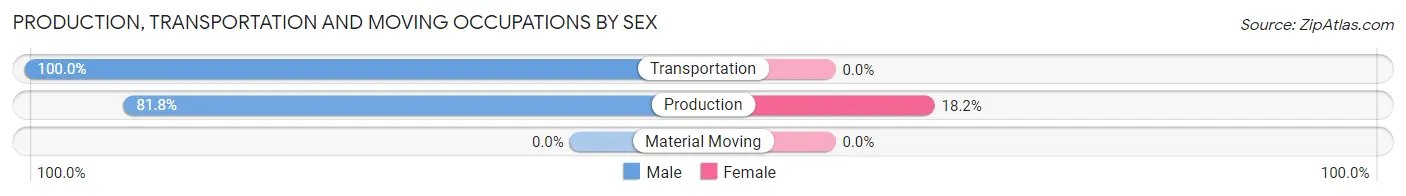
| Occupation | Male | Female |
| Production | 18 (81.8%) | 4 (18.2%) |
| Transportation | 27 (100.0%) | 0 (0.0%) |
| Material Moving | 0 (0.0%) | 0 (0.0%) |
| Total (Category) | 45 (91.8%) | 4 (8.2%) |
| Total (Overall) | 107 (57.5%) | 79 (42.5%) |
Employment Industries by Sex in Cary
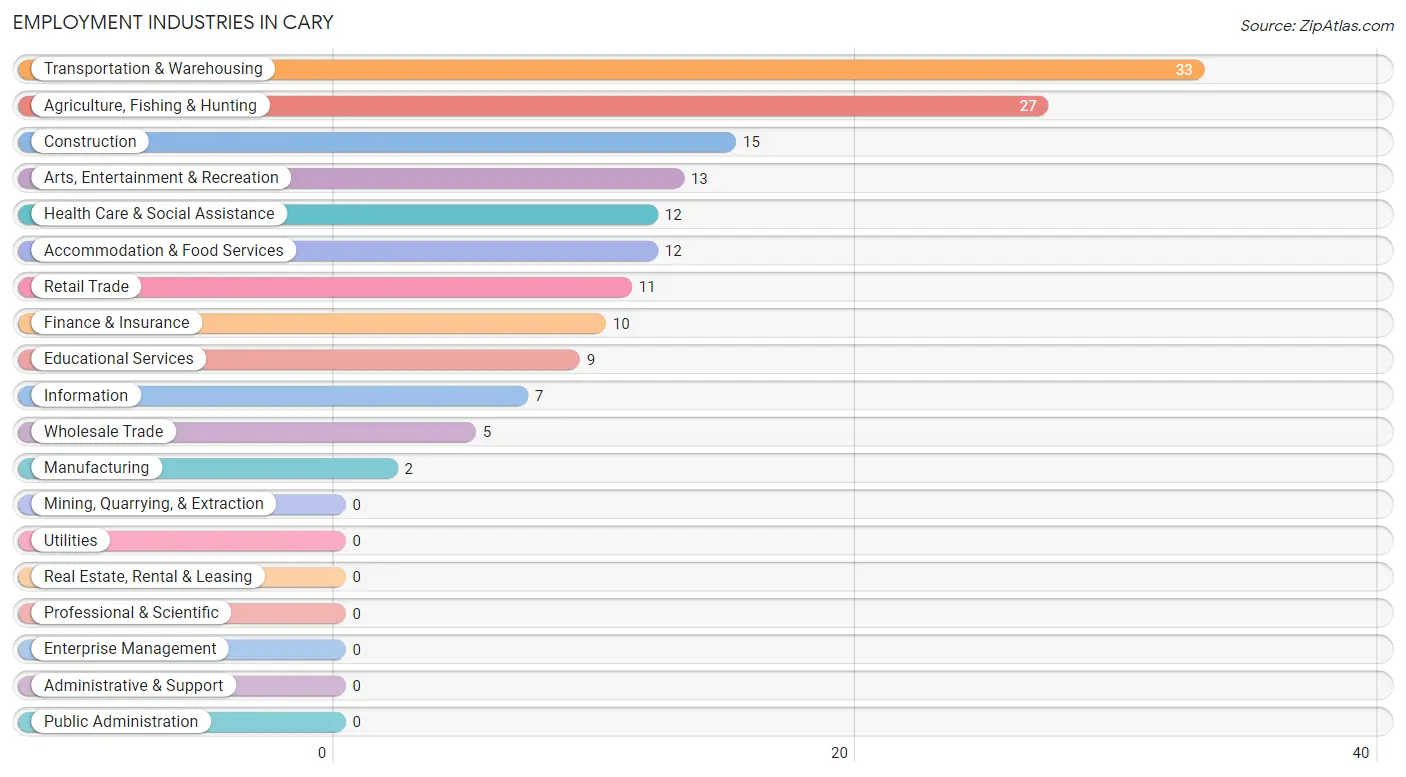
Employment Industries in Cary
The major employment industries in Cary include Transportation & Warehousing (33 | 17.7%), Agriculture, Fishing & Hunting (27 | 14.5%), Construction (15 | 8.1%), Arts, Entertainment & Recreation (13 | 7.0%), and Health Care & Social Assistance (12 | 6.5%).
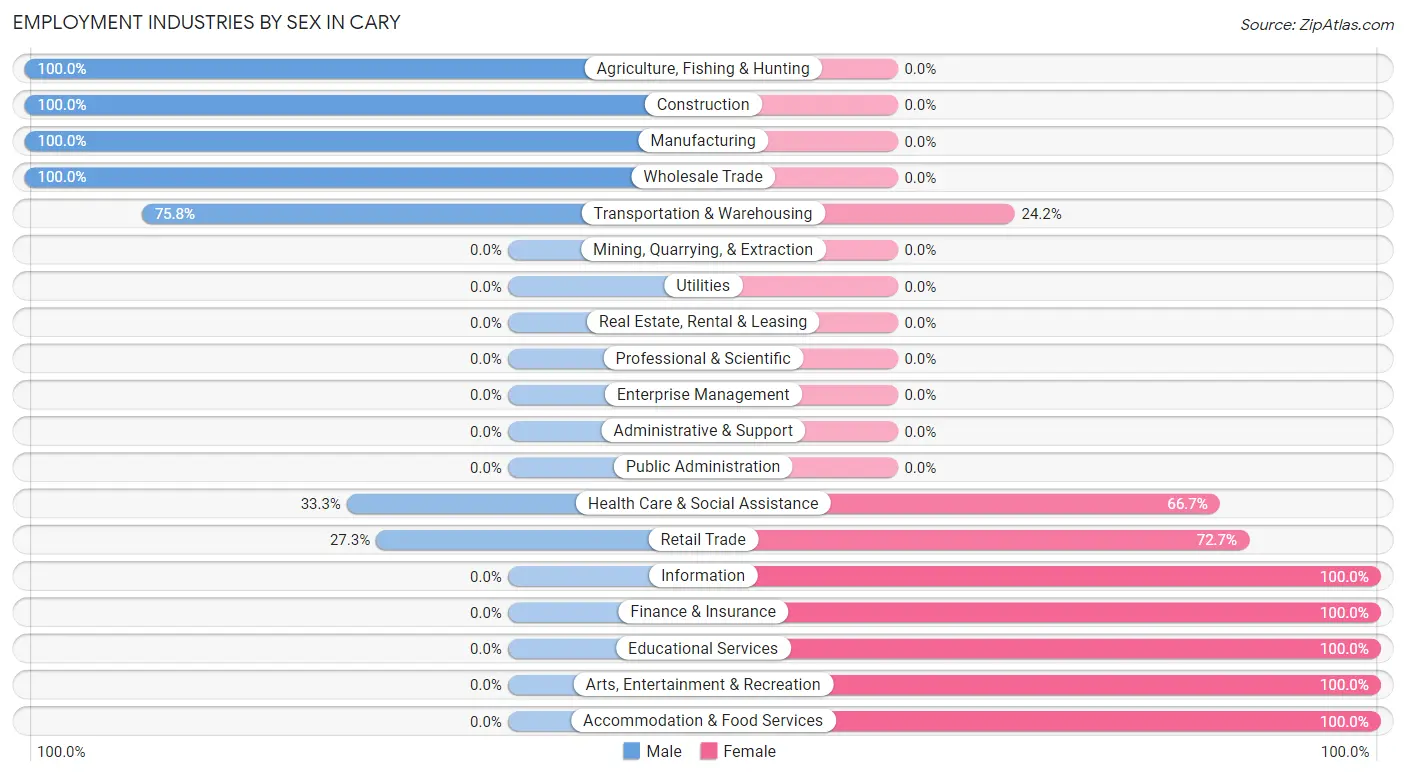
Employment Industries by Sex in Cary
The Cary industries that see more men than women are Agriculture, Fishing & Hunting (100.0%), Construction (100.0%), and Manufacturing (100.0%), whereas the industries that tend to have a higher number of women are Information (100.0%), Finance & Insurance (100.0%), and Educational Services (100.0%).
| Industry | Male | Female |
| Agriculture, Fishing & Hunting | 27 (100.0%) | 0 (0.0%) |
| Mining, Quarrying, & Extraction | 0 (0.0%) | 0 (0.0%) |
| Construction | 15 (100.0%) | 0 (0.0%) |
| Manufacturing | 2 (100.0%) | 0 (0.0%) |
| Wholesale Trade | 5 (100.0%) | 0 (0.0%) |
| Retail Trade | 3 (27.3%) | 8 (72.7%) |
| Transportation & Warehousing | 25 (75.8%) | 8 (24.2%) |
| Utilities | 0 (0.0%) | 0 (0.0%) |
| Information | 0 (0.0%) | 7 (100.0%) |
| Finance & Insurance | 0 (0.0%) | 10 (100.0%) |
| Real Estate, Rental & Leasing | 0 (0.0%) | 0 (0.0%) |
| Professional & Scientific | 0 (0.0%) | 0 (0.0%) |
| Enterprise Management | 0 (0.0%) | 0 (0.0%) |
| Administrative & Support | 0 (0.0%) | 0 (0.0%) |
| Educational Services | 0 (0.0%) | 9 (100.0%) |
| Health Care & Social Assistance | 4 (33.3%) | 8 (66.7%) |
| Arts, Entertainment & Recreation | 0 (0.0%) | 13 (100.0%) |
| Accommodation & Food Services | 0 (0.0%) | 12 (100.0%) |
| Public Administration | 0 (0.0%) | 0 (0.0%) |
| Total | 107 (57.5%) | 79 (42.5%) |
Education in Cary
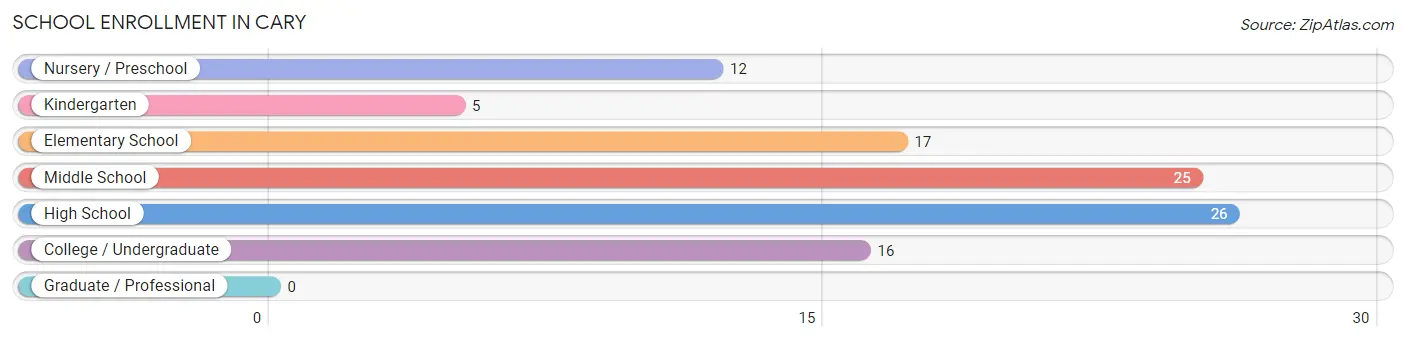
School Enrollment in Cary
The most common levels of schooling among the 101 students in Cary are high school (26 | 25.7%), middle school (25 | 24.7%), and elementary school (17 | 16.8%).
| School Level | # Students | % Students |
| Nursery / Preschool | 12 | 11.9% |
| Kindergarten | 5 | 5.0% |
| Elementary School | 17 | 16.8% |
| Middle School | 25 | 24.7% |
| High School | 26 | 25.7% |
| College / Undergraduate | 16 | 15.8% |
| Graduate / Professional | 0 | 0.0% |
| Total | 101 | 100.0% |
School Enrollment by Age by Funding Source in Cary
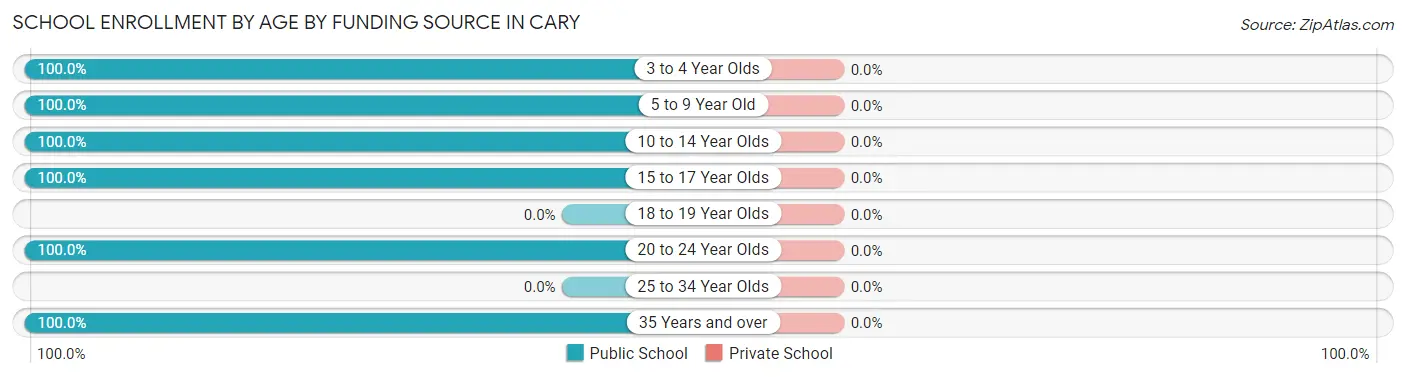
| Age Bracket | Public School | Private School |
| 3 to 4 Year Olds | 12 (100.0%) | 0 (0.0%) |
| 5 to 9 Year Old | 19 (100.0%) | 0 (0.0%) |
| 10 to 14 Year Olds | 28 (100.0%) | 0 (0.0%) |
| 15 to 17 Year Olds | 25 (100.0%) | 0 (0.0%) |
| 18 to 19 Year Olds | 0 (0.0%) | 0 (0.0%) |
| 20 to 24 Year Olds | 16 (100.0%) | 0 (0.0%) |
| 25 to 34 Year Olds | 0 (0.0%) | 0 (0.0%) |
| 35 Years and over | 1 (100.0%) | 0 (0.0%) |
| Total | 101 (100.0%) | 0 (0.0%) |
Educational Attainment by Field of Study in Cary
Education (20 | 50.0%), arts & humanities (7 | 17.5%), computers & mathematics (4 | 10.0%), bio, nature & agricultural (4 | 10.0%), and business (3 | 7.5%) are the most common fields of study among 40 individuals in Cary who have obtained a bachelor's degree or higher.
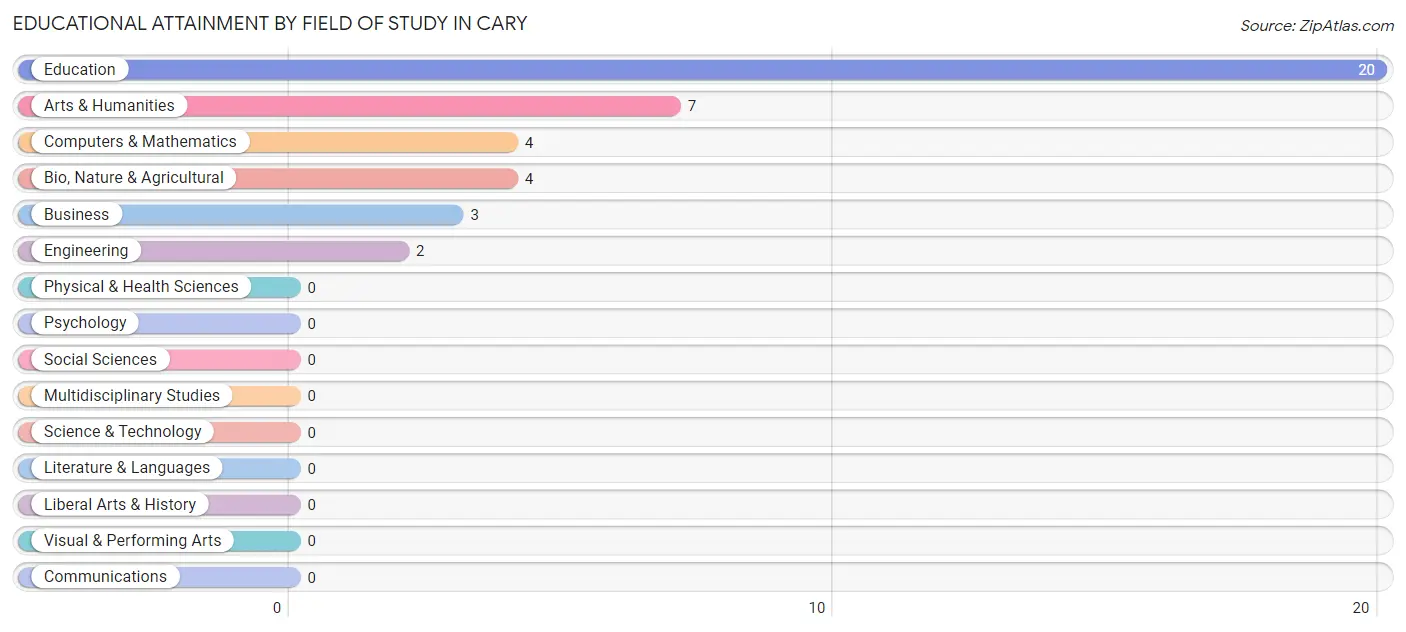
| Field of Study | # Graduates | % Graduates |
| Computers & Mathematics | 4 | 10.0% |
| Bio, Nature & Agricultural | 4 | 10.0% |
| Physical & Health Sciences | 0 | 0.0% |
| Psychology | 0 | 0.0% |
| Social Sciences | 0 | 0.0% |
| Engineering | 2 | 5.0% |
| Multidisciplinary Studies | 0 | 0.0% |
| Science & Technology | 0 | 0.0% |
| Business | 3 | 7.5% |
| Education | 20 | 50.0% |
| Literature & Languages | 0 | 0.0% |
| Liberal Arts & History | 0 | 0.0% |
| Visual & Performing Arts | 0 | 0.0% |
| Communications | 0 | 0.0% |
| Arts & Humanities | 7 | 17.5% |
| Total | 40 | 100.0% |
Transportation & Commute in Cary
Vehicle Availability by Sex in Cary
The most prevalent vehicle ownership categories in Cary are males with 3 vehicles (53, accounting for 49.5%) and females with 3 vehicles (18, making up 67.1%).
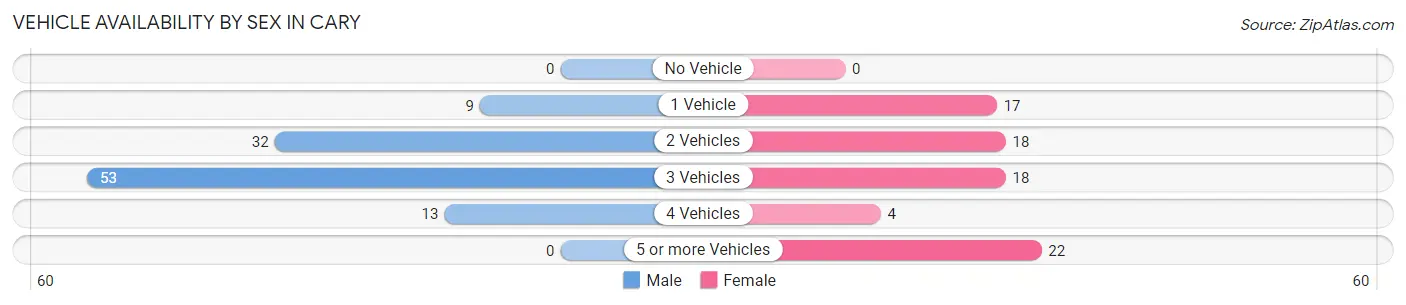
| Vehicles Available | Male | Female |
| No Vehicle | 0 (0.0%) | 0 (0.0%) |
| 1 Vehicle | 9 (8.4%) | 17 (21.5%) |
| 2 Vehicles | 32 (29.9%) | 18 (22.8%) |
| 3 Vehicles | 53 (49.5%) | 18 (22.8%) |
| 4 Vehicles | 13 (12.1%) | 4 (5.1%) |
| 5 or more Vehicles | 0 (0.0%) | 22 (27.9%) |
| Total | 107 (100.0%) | 79 (100.0%) |
Commute Time in Cary
The most frequently occuring commute durations in Cary are 60 to 89 minutes (54 commuters, 29.0%), 45 to 59 minutes (42 commuters, 22.6%), and less than 5 minutes (38 commuters, 20.4%).
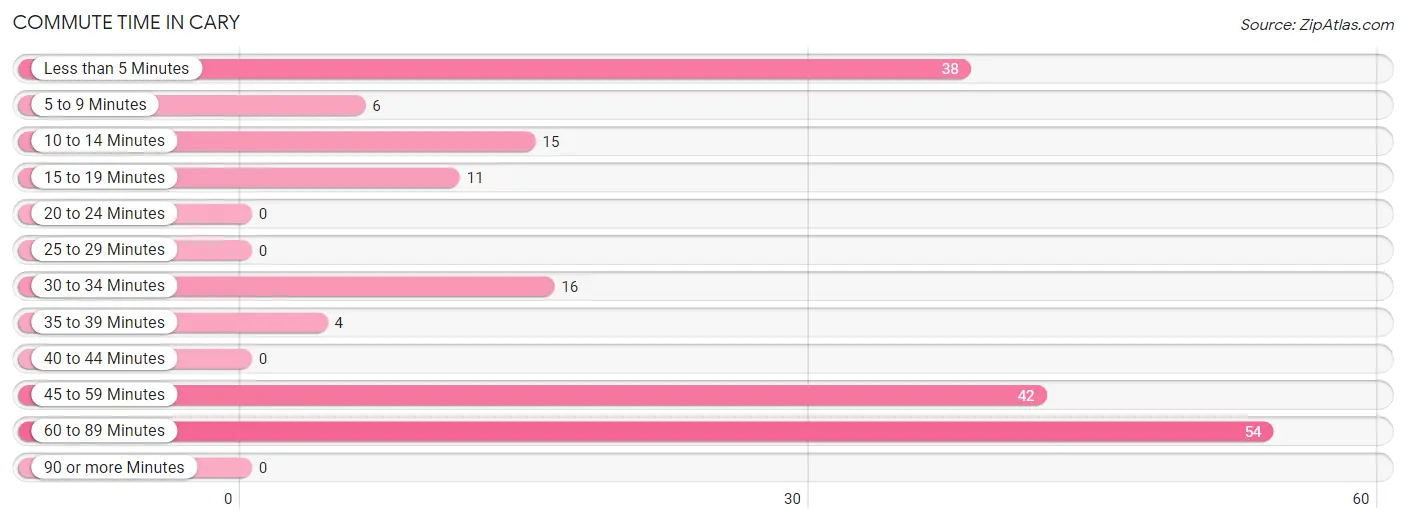
| Commute Time | # Commuters | % Commuters |
| Less than 5 Minutes | 38 | 20.4% |
| 5 to 9 Minutes | 6 | 3.2% |
| 10 to 14 Minutes | 15 | 8.1% |
| 15 to 19 Minutes | 11 | 5.9% |
| 20 to 24 Minutes | 0 | 0.0% |
| 25 to 29 Minutes | 0 | 0.0% |
| 30 to 34 Minutes | 16 | 8.6% |
| 35 to 39 Minutes | 4 | 2.1% |
| 40 to 44 Minutes | 0 | 0.0% |
| 45 to 59 Minutes | 42 | 22.6% |
| 60 to 89 Minutes | 54 | 29.0% |
| 90 or more Minutes | 0 | 0.0% |
Commute Time by Sex in Cary
The most common commute times in Cary are 60 to 89 minutes (54 commuters, 50.5%) for males and 45 to 59 minutes (42 commuters, 53.2%) for females.
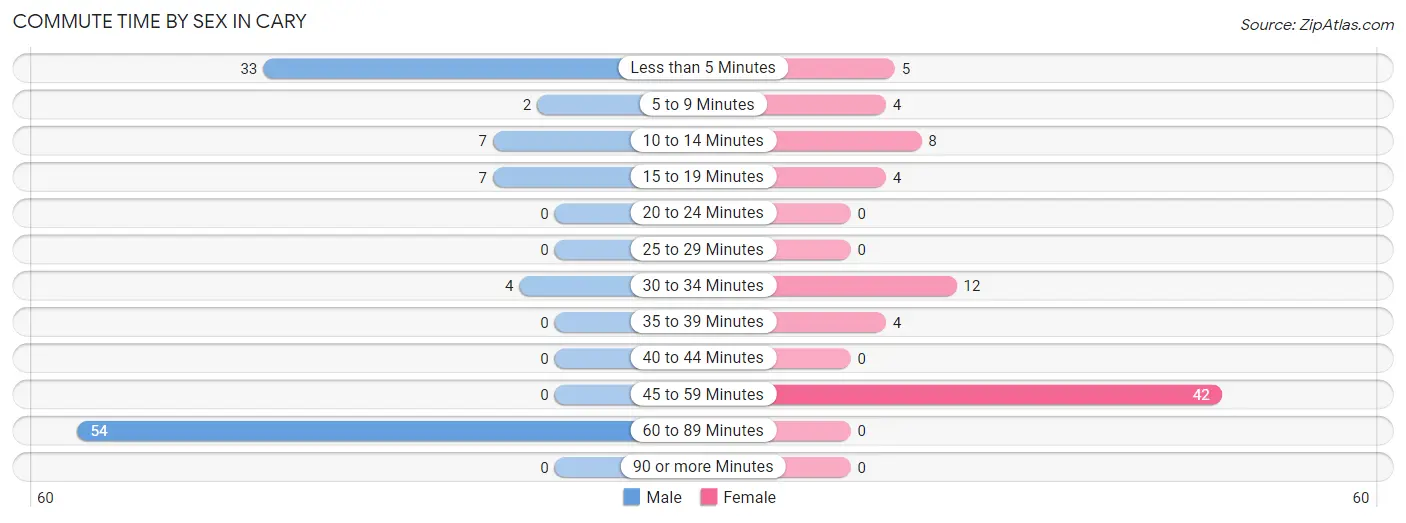
| Commute Time | Male | Female |
| Less than 5 Minutes | 33 (30.8%) | 5 (6.3%) |
| 5 to 9 Minutes | 2 (1.9%) | 4 (5.1%) |
| 10 to 14 Minutes | 7 (6.5%) | 8 (10.1%) |
| 15 to 19 Minutes | 7 (6.5%) | 4 (5.1%) |
| 20 to 24 Minutes | 0 (0.0%) | 0 (0.0%) |
| 25 to 29 Minutes | 0 (0.0%) | 0 (0.0%) |
| 30 to 34 Minutes | 4 (3.7%) | 12 (15.2%) |
| 35 to 39 Minutes | 0 (0.0%) | 4 (5.1%) |
| 40 to 44 Minutes | 0 (0.0%) | 0 (0.0%) |
| 45 to 59 Minutes | 0 (0.0%) | 42 (53.2%) |
| 60 to 89 Minutes | 54 (50.5%) | 0 (0.0%) |
| 90 or more Minutes | 0 (0.0%) | 0 (0.0%) |
Time of Departure to Work by Sex in Cary
The most frequent times of departure to work in Cary are 7:00 AM to 7:29 AM (56, 52.3%) for males and 12:00 AM to 4:59 AM (15, 19.0%) for females.
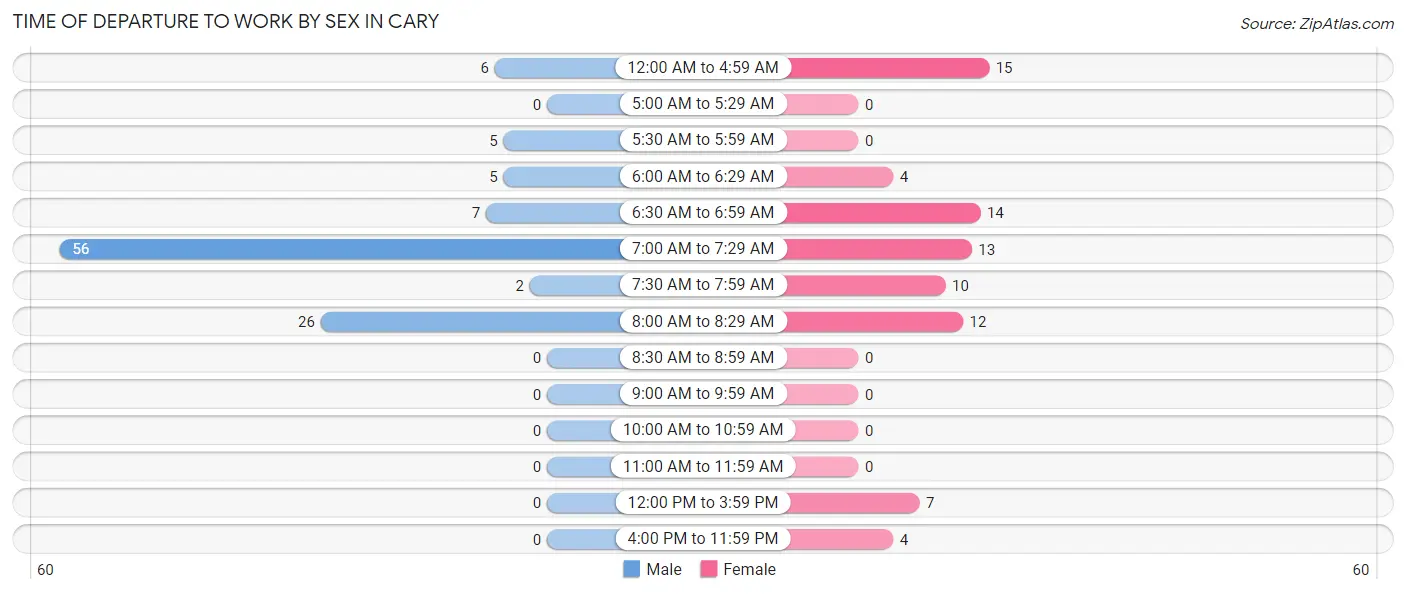
| Time of Departure | Male | Female |
| 12:00 AM to 4:59 AM | 6 (5.6%) | 15 (19.0%) |
| 5:00 AM to 5:29 AM | 0 (0.0%) | 0 (0.0%) |
| 5:30 AM to 5:59 AM | 5 (4.7%) | 0 (0.0%) |
| 6:00 AM to 6:29 AM | 5 (4.7%) | 4 (5.1%) |
| 6:30 AM to 6:59 AM | 7 (6.5%) | 14 (17.7%) |
| 7:00 AM to 7:29 AM | 56 (52.3%) | 13 (16.5%) |
| 7:30 AM to 7:59 AM | 2 (1.9%) | 10 (12.7%) |
| 8:00 AM to 8:29 AM | 26 (24.3%) | 12 (15.2%) |
| 8:30 AM to 8:59 AM | 0 (0.0%) | 0 (0.0%) |
| 9:00 AM to 9:59 AM | 0 (0.0%) | 0 (0.0%) |
| 10:00 AM to 10:59 AM | 0 (0.0%) | 0 (0.0%) |
| 11:00 AM to 11:59 AM | 0 (0.0%) | 0 (0.0%) |
| 12:00 PM to 3:59 PM | 0 (0.0%) | 7 (8.9%) |
| 4:00 PM to 11:59 PM | 0 (0.0%) | 4 (5.1%) |
| Total | 107 (100.0%) | 79 (100.0%) |
Housing Occupancy in Cary
Occupancy by Ownership in Cary
Of the total 102 dwellings in Cary, owner-occupied units account for 69 (67.6%), while renter-occupied units make up 33 (32.4%).
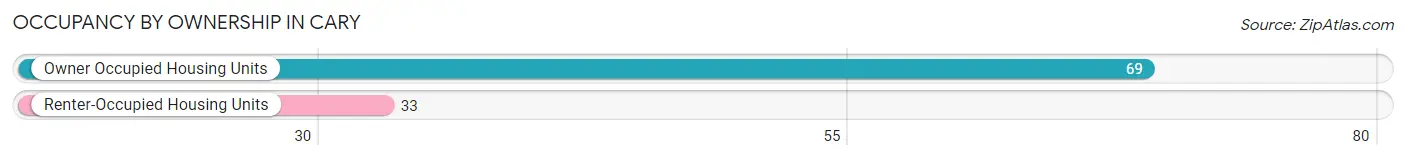
| Occupancy | # Housing Units | % Housing Units |
| Owner Occupied Housing Units | 69 | 67.6% |
| Renter-Occupied Housing Units | 33 | 32.4% |
| Total Occupied Housing Units | 102 | 100.0% |
Occupancy by Household Size in Cary
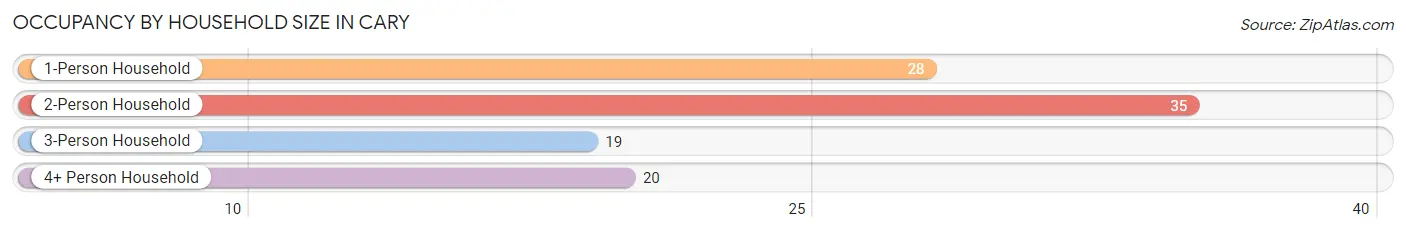
| Household Size | # Housing Units | % Housing Units |
| 1-Person Household | 28 | 27.5% |
| 2-Person Household | 35 | 34.3% |
| 3-Person Household | 19 | 18.6% |
| 4+ Person Household | 20 | 19.6% |
| Total Housing Units | 102 | 100.0% |
Occupancy by Ownership by Household Size in Cary
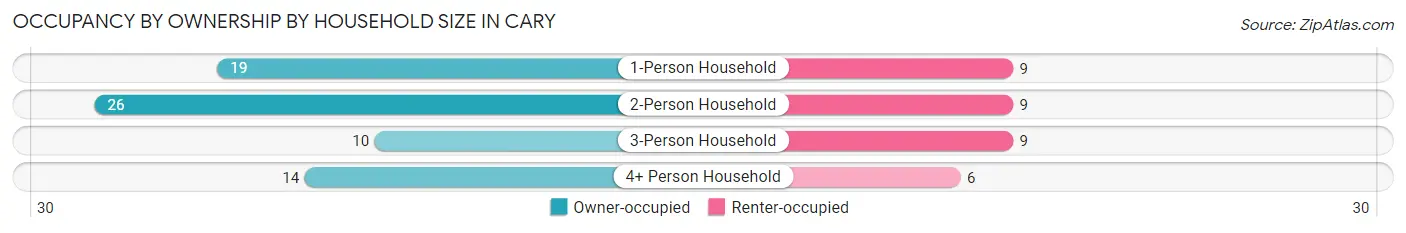
| Household Size | Owner-occupied | Renter-occupied |
| 1-Person Household | 19 (67.9%) | 9 (32.1%) |
| 2-Person Household | 26 (74.3%) | 9 (25.7%) |
| 3-Person Household | 10 (52.6%) | 9 (47.4%) |
| 4+ Person Household | 14 (70.0%) | 6 (30.0%) |
| Total Housing Units | 69 (67.6%) | 33 (32.4%) |
Occupancy by Educational Attainment in Cary
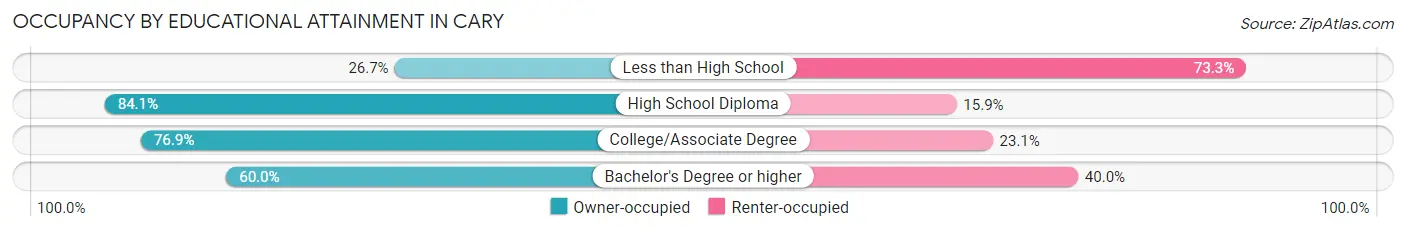
| Household Size | Owner-occupied | Renter-occupied |
| Less than High School | 4 (26.7%) | 11 (73.3%) |
| High School Diploma | 37 (84.1%) | 7 (15.9%) |
| College/Associate Degree | 10 (76.9%) | 3 (23.1%) |
| Bachelor's Degree or higher | 18 (60.0%) | 12 (40.0%) |
Occupancy by Age of Householder in Cary
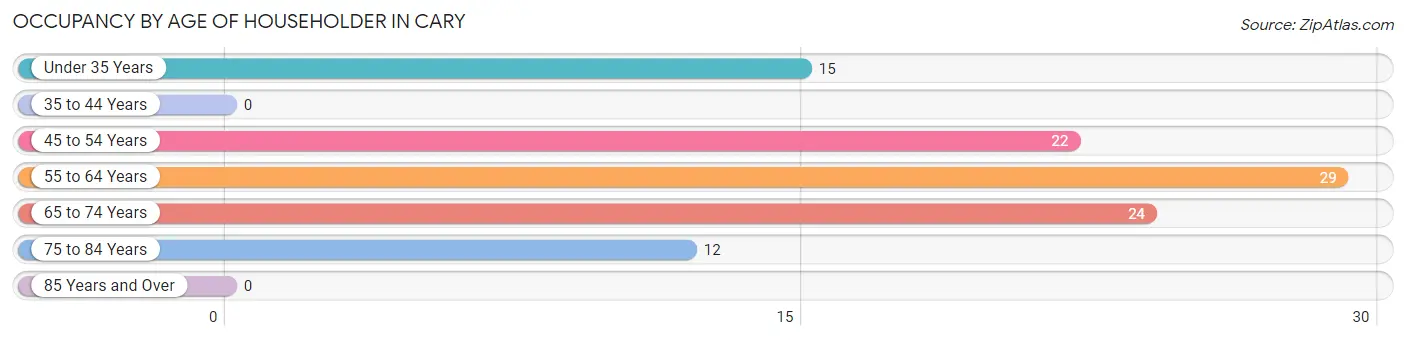
| Age Bracket | # Households | % Households |
| Under 35 Years | 15 | 14.7% |
| 35 to 44 Years | 0 | 0.0% |
| 45 to 54 Years | 22 | 21.6% |
| 55 to 64 Years | 29 | 28.4% |
| 65 to 74 Years | 24 | 23.5% |
| 75 to 84 Years | 12 | 11.8% |
| 85 Years and Over | 0 | 0.0% |
| Total | 102 | 100.0% |
Housing Finances in Cary
Median Income by Occupancy in Cary
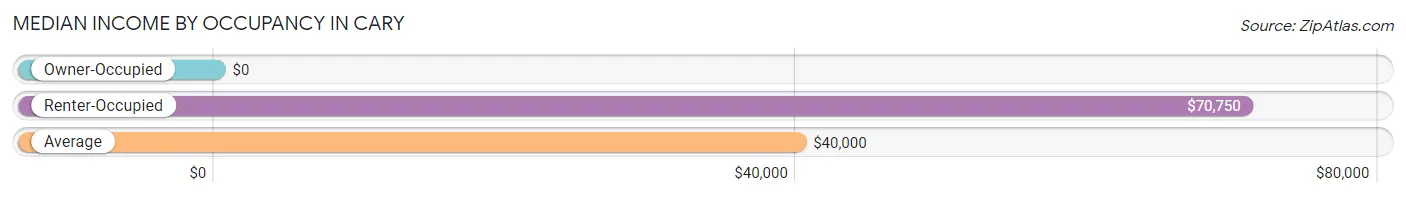
| Occupancy Type | # Households | Median Income |
| Owner-Occupied | 69 (67.6%) | $0 |
| Renter-Occupied | 33 (32.4%) | $70,750 |
| Average | 102 (100.0%) | $40,000 |
Occupancy by Householder Income Bracket in Cary
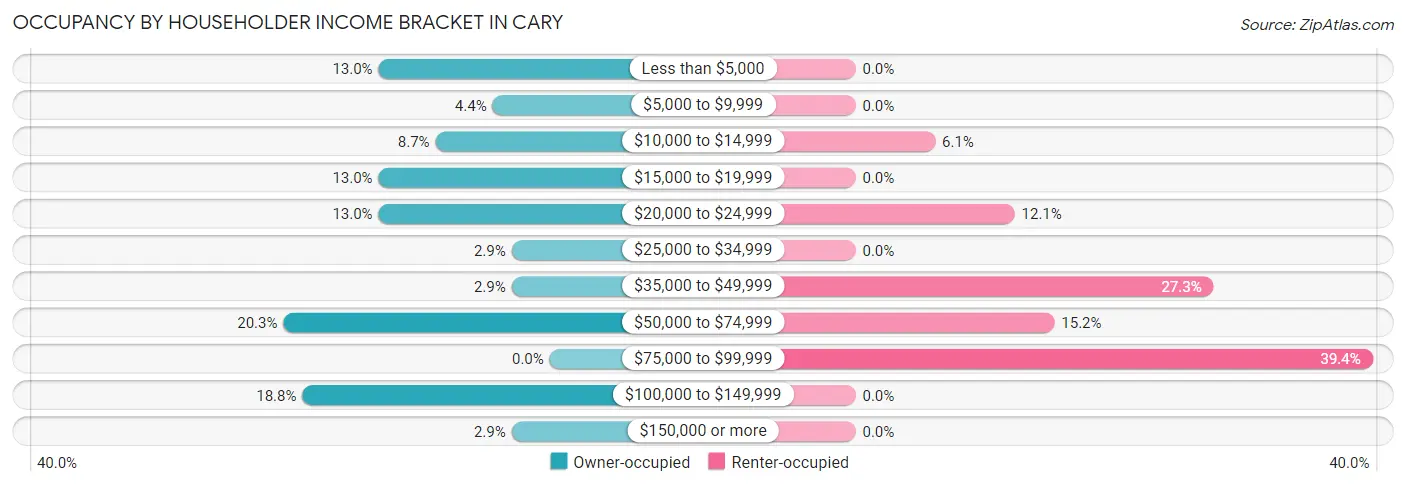
| Income Bracket | Owner-occupied | Renter-occupied |
| Less than $5,000 | 9 (13.0%) | 0 (0.0%) |
| $5,000 to $9,999 | 3 (4.3%) | 0 (0.0%) |
| $10,000 to $14,999 | 6 (8.7%) | 2 (6.1%) |
| $15,000 to $19,999 | 9 (13.0%) | 0 (0.0%) |
| $20,000 to $24,999 | 9 (13.0%) | 4 (12.1%) |
| $25,000 to $34,999 | 2 (2.9%) | 0 (0.0%) |
| $35,000 to $49,999 | 2 (2.9%) | 9 (27.3%) |
| $50,000 to $74,999 | 14 (20.3%) | 5 (15.1%) |
| $75,000 to $99,999 | 0 (0.0%) | 13 (39.4%) |
| $100,000 to $149,999 | 13 (18.8%) | 0 (0.0%) |
| $150,000 or more | 2 (2.9%) | 0 (0.0%) |
| Total | 69 (100.0%) | 33 (100.0%) |
Monthly Housing Cost Tiers in Cary
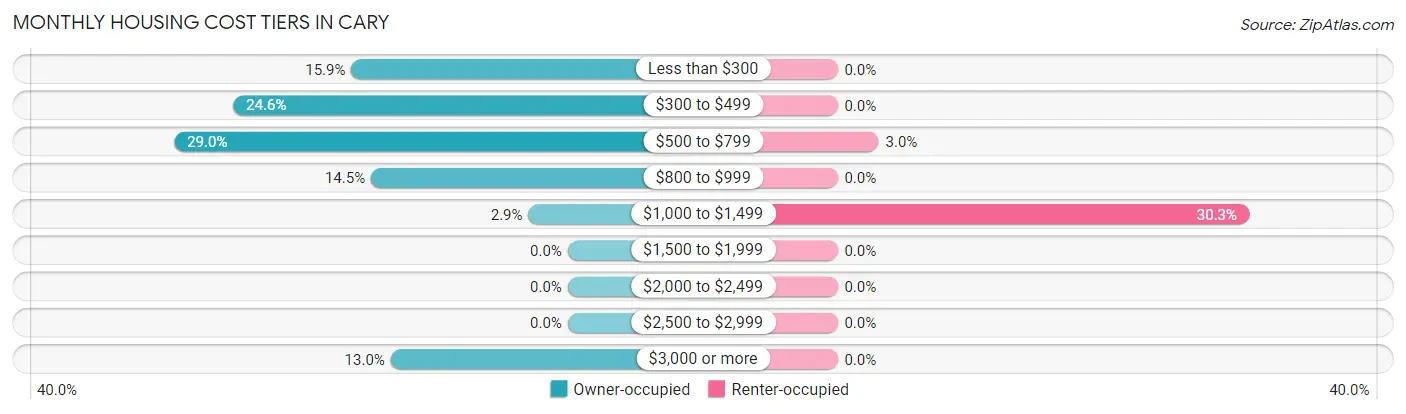
| Monthly Cost | Owner-occupied | Renter-occupied |
| Less than $300 | 11 (15.9%) | 0 (0.0%) |
| $300 to $499 | 17 (24.6%) | 0 (0.0%) |
| $500 to $799 | 20 (29.0%) | 1 (3.0%) |
| $800 to $999 | 10 (14.5%) | 0 (0.0%) |
| $1,000 to $1,499 | 2 (2.9%) | 10 (30.3%) |
| $1,500 to $1,999 | 0 (0.0%) | 0 (0.0%) |
| $2,000 to $2,499 | 0 (0.0%) | 0 (0.0%) |
| $2,500 to $2,999 | 0 (0.0%) | 0 (0.0%) |
| $3,000 or more | 9 (13.0%) | 0 (0.0%) |
| Total | 69 (100.0%) | 33 (100.0%) |
Physical Housing Characteristics in Cary
Housing Structures in Cary
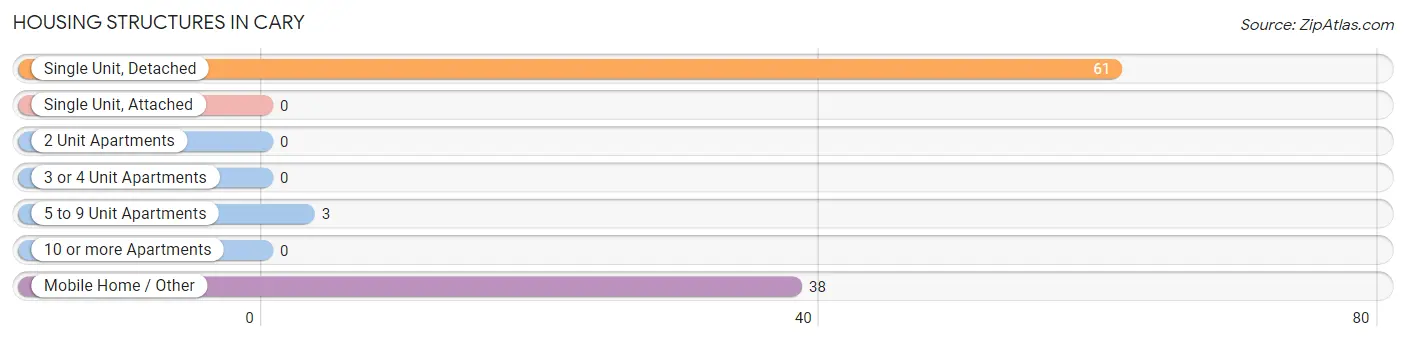
| Structure Type | # Housing Units | % Housing Units |
| Single Unit, Detached | 61 | 59.8% |
| Single Unit, Attached | 0 | 0.0% |
| 2 Unit Apartments | 0 | 0.0% |
| 3 or 4 Unit Apartments | 0 | 0.0% |
| 5 to 9 Unit Apartments | 3 | 2.9% |
| 10 or more Apartments | 0 | 0.0% |
| Mobile Home / Other | 38 | 37.2% |
| Total | 102 | 100.0% |
Housing Structures by Occupancy in Cary
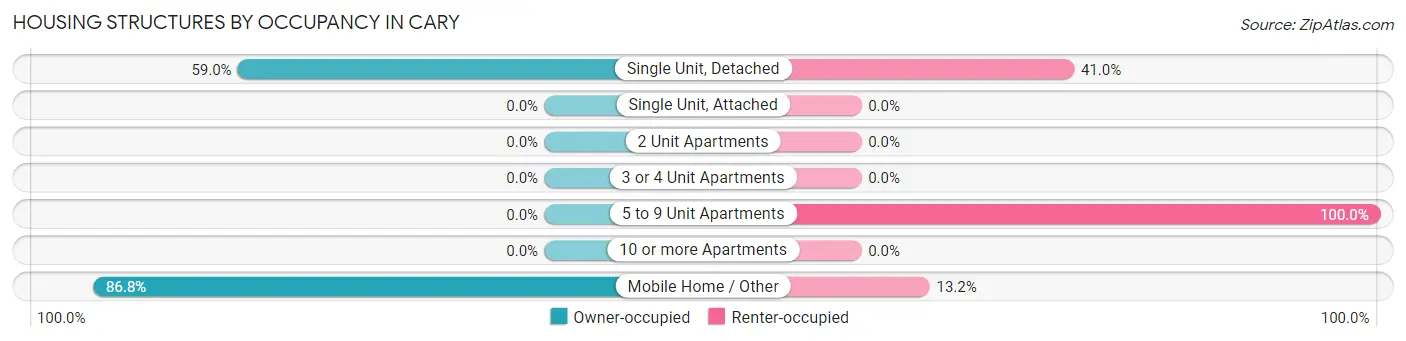
| Structure Type | Owner-occupied | Renter-occupied |
| Single Unit, Detached | 36 (59.0%) | 25 (41.0%) |
| Single Unit, Attached | 0 (0.0%) | 0 (0.0%) |
| 2 Unit Apartments | 0 (0.0%) | 0 (0.0%) |
| 3 or 4 Unit Apartments | 0 (0.0%) | 0 (0.0%) |
| 5 to 9 Unit Apartments | 0 (0.0%) | 3 (100.0%) |
| 10 or more Apartments | 0 (0.0%) | 0 (0.0%) |
| Mobile Home / Other | 33 (86.8%) | 5 (13.2%) |
| Total | 69 (67.6%) | 33 (32.4%) |
Housing Structures by Number of Rooms in Cary
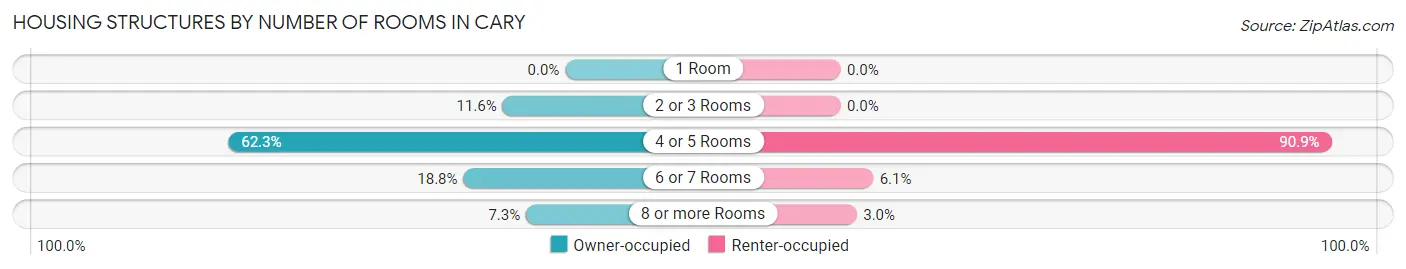
| Number of Rooms | Owner-occupied | Renter-occupied |
| 1 Room | 0 (0.0%) | 0 (0.0%) |
| 2 or 3 Rooms | 8 (11.6%) | 0 (0.0%) |
| 4 or 5 Rooms | 43 (62.3%) | 30 (90.9%) |
| 6 or 7 Rooms | 13 (18.8%) | 2 (6.1%) |
| 8 or more Rooms | 5 (7.2%) | 1 (3.0%) |
| Total | 69 (100.0%) | 33 (100.0%) |
Housing Structure by Heating Type in Cary
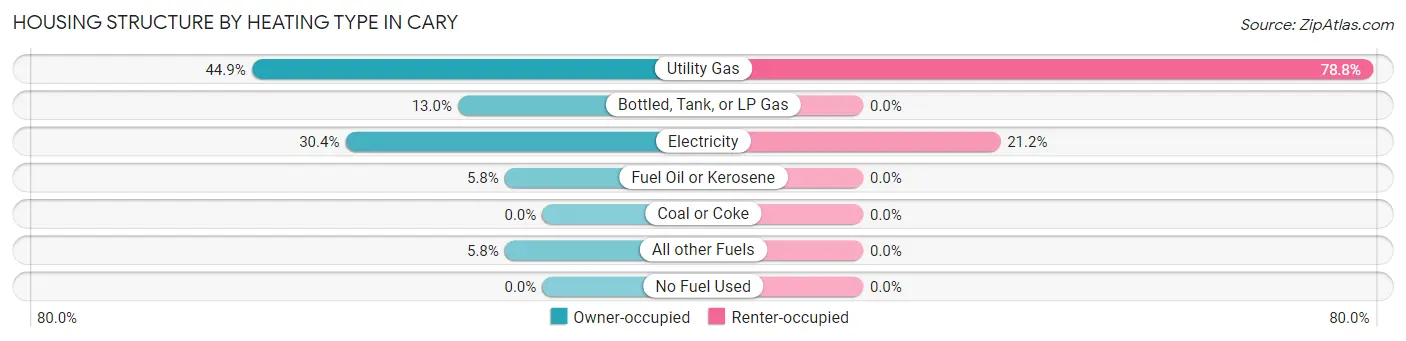
| Heating Type | Owner-occupied | Renter-occupied |
| Utility Gas | 31 (44.9%) | 26 (78.8%) |
| Bottled, Tank, or LP Gas | 9 (13.0%) | 0 (0.0%) |
| Electricity | 21 (30.4%) | 7 (21.2%) |
| Fuel Oil or Kerosene | 4 (5.8%) | 0 (0.0%) |
| Coal or Coke | 0 (0.0%) | 0 (0.0%) |
| All other Fuels | 4 (5.8%) | 0 (0.0%) |
| No Fuel Used | 0 (0.0%) | 0 (0.0%) |
| Total | 69 (100.0%) | 33 (100.0%) |
Household Vehicle Usage in Cary
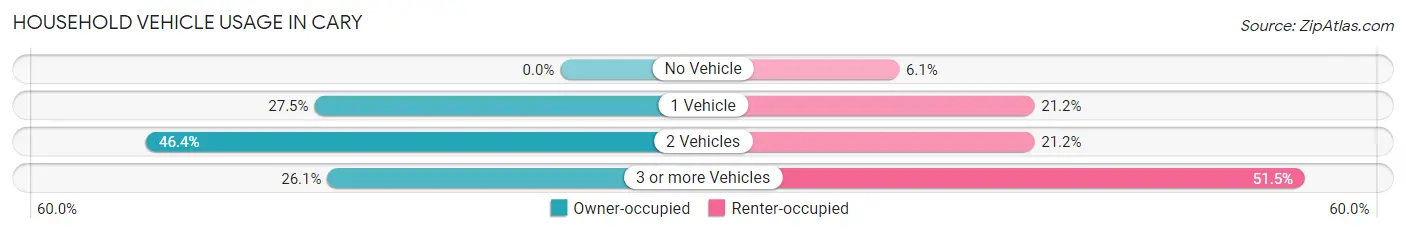
| Vehicles per Household | Owner-occupied | Renter-occupied |
| No Vehicle | 0 (0.0%) | 2 (6.1%) |
| 1 Vehicle | 19 (27.5%) | 7 (21.2%) |
| 2 Vehicles | 32 (46.4%) | 7 (21.2%) |
| 3 or more Vehicles | 18 (26.1%) | 17 (51.5%) |
| Total | 69 (100.0%) | 33 (100.0%) |
Real Estate & Mortgages in Cary
Real Estate and Mortgage Overview in Cary
| Characteristic | Without Mortgage | With Mortgage |
| Housing Units | 42 | 27 |
| Median Property Value | - | - |
| Median Household Income | $18,333 | $0 |
| Monthly Housing Costs | $358 | $0 |
| Real Estate Taxes | $667 | $5 |
Property Value by Mortgage Status in Cary
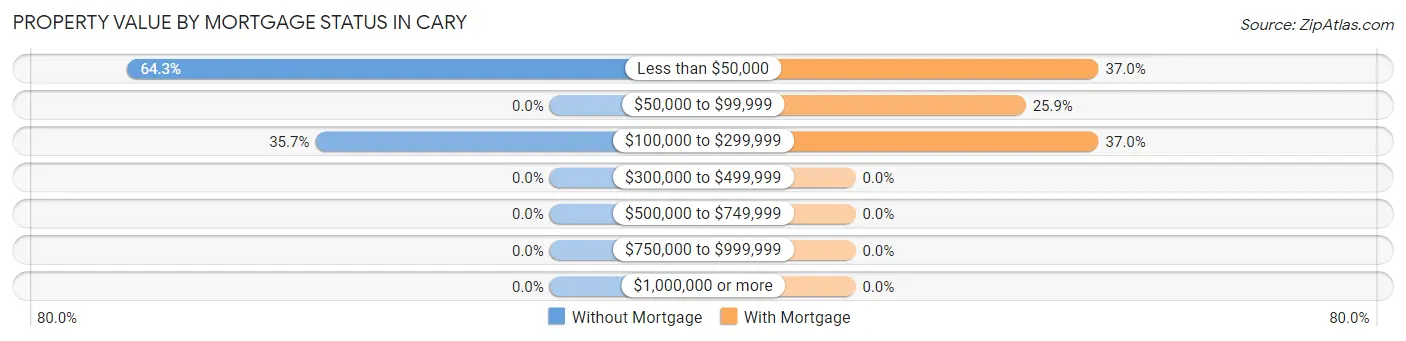
| Property Value | Without Mortgage | With Mortgage |
| Less than $50,000 | 27 (64.3%) | 10 (37.0%) |
| $50,000 to $99,999 | 0 (0.0%) | 7 (25.9%) |
| $100,000 to $299,999 | 15 (35.7%) | 10 (37.0%) |
| $300,000 to $499,999 | 0 (0.0%) | 0 (0.0%) |
| $500,000 to $749,999 | 0 (0.0%) | 0 (0.0%) |
| $750,000 to $999,999 | 0 (0.0%) | 0 (0.0%) |
| $1,000,000 or more | 0 (0.0%) | 0 (0.0%) |
| Total | 42 (100.0%) | 27 (100.0%) |
Household Income by Mortgage Status in Cary
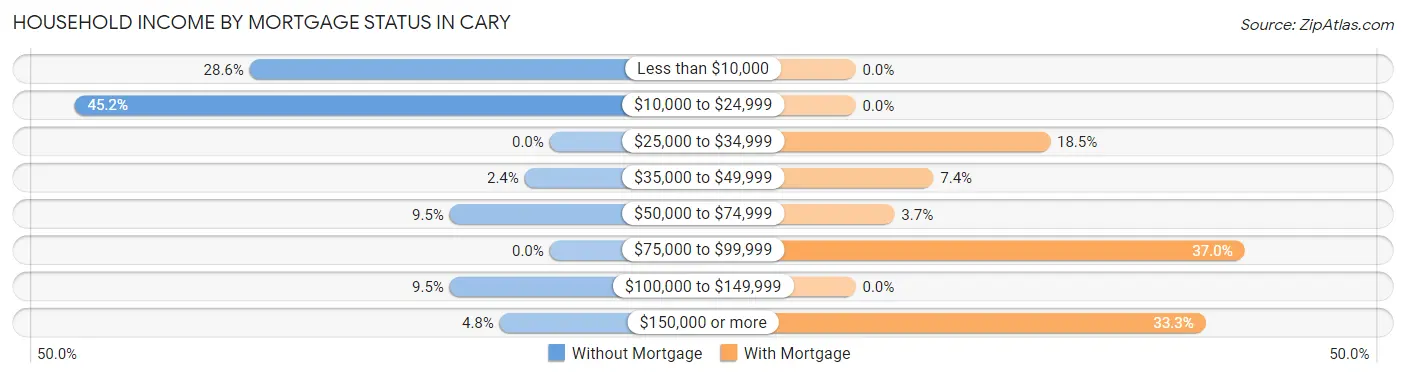
| Household Income | Without Mortgage | With Mortgage |
| Less than $10,000 | 12 (28.6%) | 0 (0.0%) |
| $10,000 to $24,999 | 19 (45.2%) | 0 (0.0%) |
| $25,000 to $34,999 | 0 (0.0%) | 5 (18.5%) |
| $35,000 to $49,999 | 1 (2.4%) | 2 (7.4%) |
| $50,000 to $74,999 | 4 (9.5%) | 1 (3.7%) |
| $75,000 to $99,999 | 0 (0.0%) | 10 (37.0%) |
| $100,000 to $149,999 | 4 (9.5%) | 0 (0.0%) |
| $150,000 or more | 2 (4.8%) | 9 (33.3%) |
| Total | 42 (100.0%) | 27 (100.0%) |
Property Value to Household Income Ratio in Cary
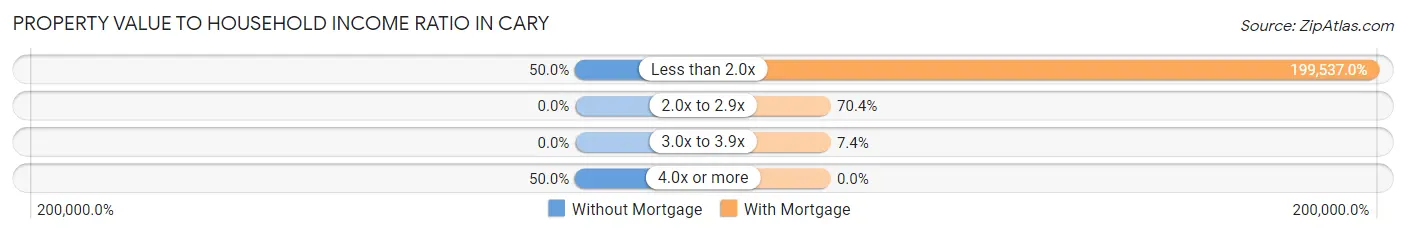
| Value-to-Income Ratio | Without Mortgage | With Mortgage |
| Less than 2.0x | 21 (50.0%) | 53,875 (199,537.0%) |
| 2.0x to 2.9x | 0 (0.0%) | 19 (70.4%) |
| 3.0x to 3.9x | 0 (0.0%) | 2 (7.4%) |
| 4.0x or more | 21 (50.0%) | 0 (0.0%) |
| Total | 42 (100.0%) | 27 (100.0%) |
Real Estate Taxes by Mortgage Status in Cary
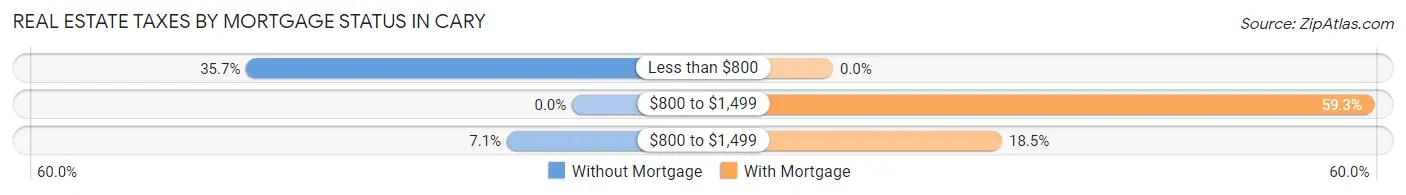
| Property Taxes | Without Mortgage | With Mortgage |
| Less than $800 | 15 (35.7%) | 0 (0.0%) |
| $800 to $1,499 | 0 (0.0%) | 16 (59.3%) |
| $800 to $1,499 | 3 (7.1%) | 5 (18.5%) |
| Total | 42 (100.0%) | 27 (100.0%) |
Health & Disability in Cary
Health Insurance Coverage by Age in Cary
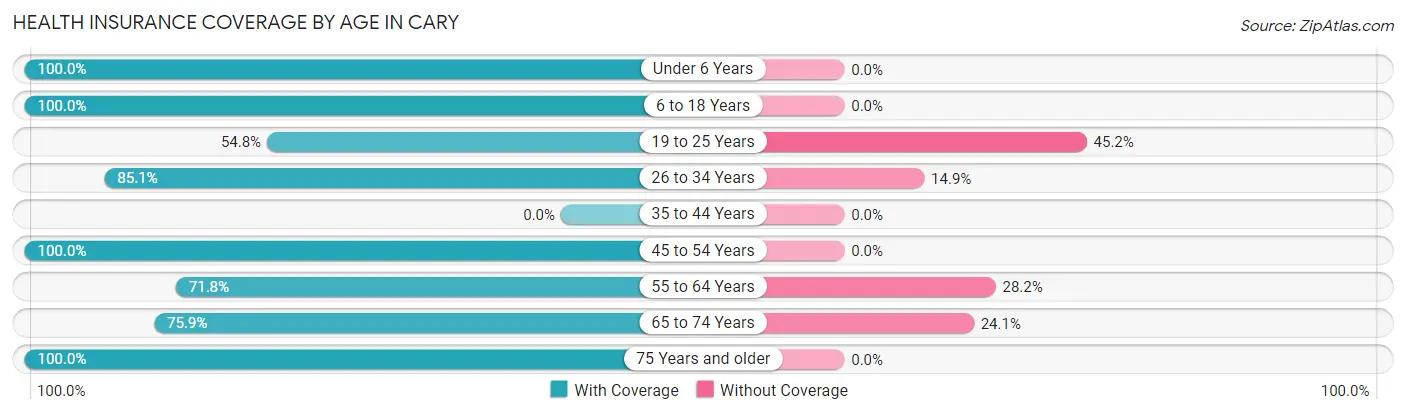
| Age Bracket | With Coverage | Without Coverage |
| Under 6 Years | 31 (100.0%) | 0 (0.0%) |
| 6 to 18 Years | 72 (100.0%) | 0 (0.0%) |
| 19 to 25 Years | 57 (54.8%) | 47 (45.2%) |
| 26 to 34 Years | 40 (85.1%) | 7 (14.9%) |
| 35 to 44 Years | 0 (0.0%) | 0 (0.0%) |
| 45 to 54 Years | 71 (100.0%) | 0 (0.0%) |
| 55 to 64 Years | 28 (71.8%) | 11 (28.2%) |
| 65 to 74 Years | 22 (75.9%) | 7 (24.1%) |
| 75 Years and older | 21 (100.0%) | 0 (0.0%) |
| Total | 342 (82.6%) | 72 (17.4%) |
Health Insurance Coverage by Citizenship Status in Cary
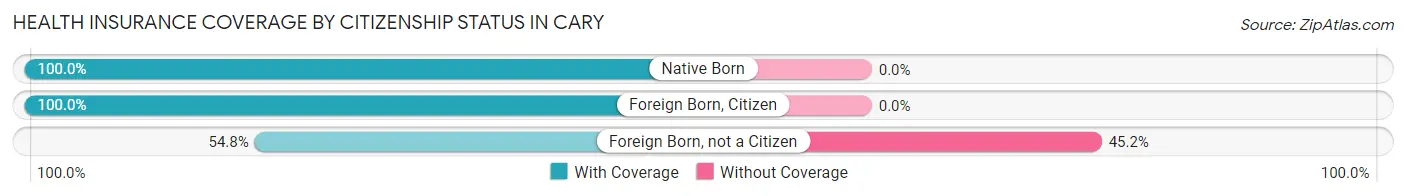
| Citizenship Status | With Coverage | Without Coverage |
| Native Born | 31 (100.0%) | 0 (0.0%) |
| Foreign Born, Citizen | 72 (100.0%) | 0 (0.0%) |
| Foreign Born, not a Citizen | 57 (54.8%) | 47 (45.2%) |
Health Insurance Coverage by Household Income in Cary
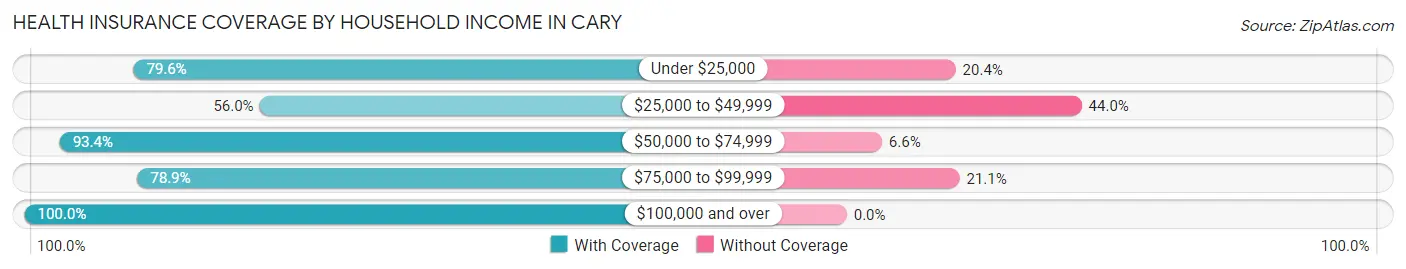
| Household Income | With Coverage | Without Coverage |
| Under $25,000 | 160 (79.6%) | 41 (20.4%) |
| $25,000 to $49,999 | 14 (56.0%) | 11 (44.0%) |
| $50,000 to $74,999 | 71 (93.4%) | 5 (6.6%) |
| $75,000 to $99,999 | 56 (78.9%) | 15 (21.1%) |
| $100,000 and over | 41 (100.0%) | 0 (0.0%) |
Public vs Private Health Insurance Coverage by Age in Cary
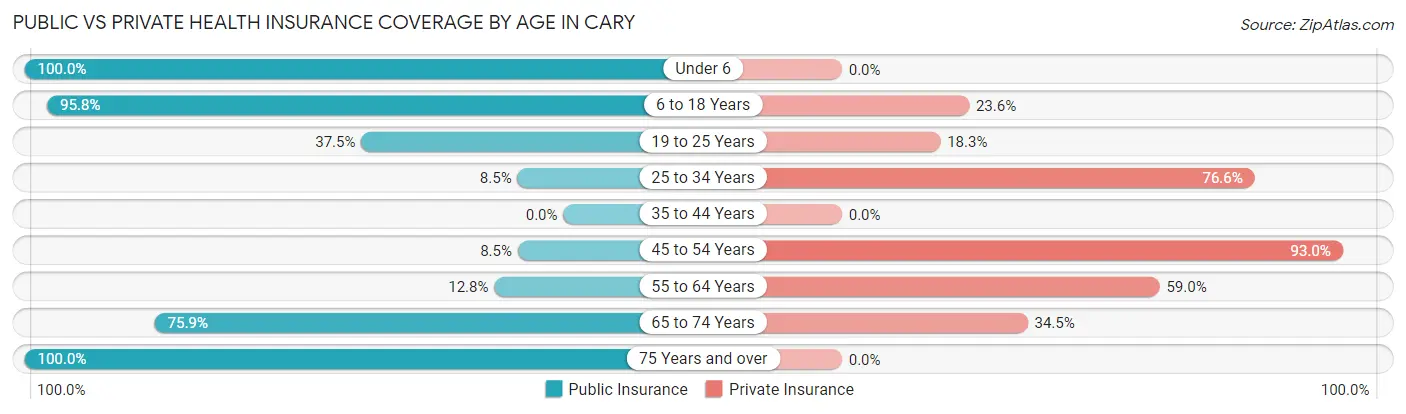
| Age Bracket | Public Insurance | Private Insurance |
| Under 6 | 31 (100.0%) | 0 (0.0%) |
| 6 to 18 Years | 69 (95.8%) | 17 (23.6%) |
| 19 to 25 Years | 39 (37.5%) | 19 (18.3%) |
| 25 to 34 Years | 4 (8.5%) | 36 (76.6%) |
| 35 to 44 Years | 0 (0.0%) | 0 (0.0%) |
| 45 to 54 Years | 6 (8.5%) | 66 (93.0%) |
| 55 to 64 Years | 5 (12.8%) | 23 (59.0%) |
| 65 to 74 Years | 22 (75.9%) | 10 (34.5%) |
| 75 Years and over | 21 (100.0%) | 0 (0.0%) |
| Total | 197 (47.6%) | 171 (41.3%) |
Disability Status by Sex by Age in Cary
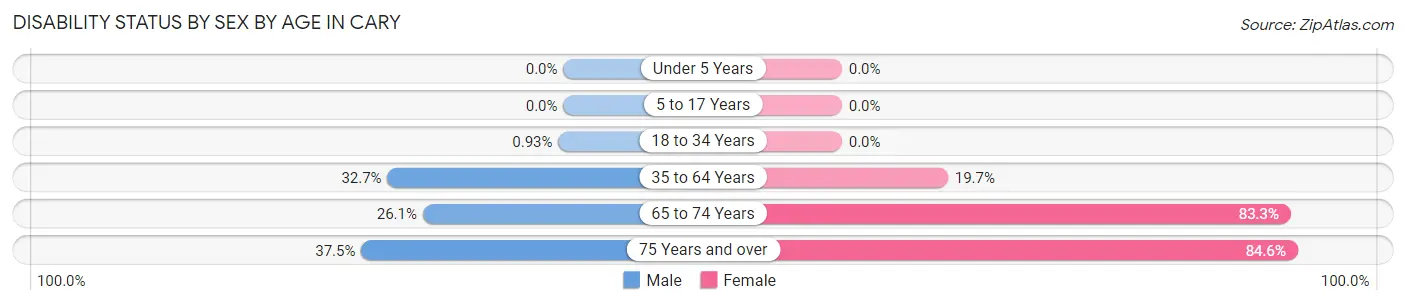
| Age Bracket | Male | Female |
| Under 5 Years | 0 (0.0%) | 0 (0.0%) |
| 5 to 17 Years | 0 (0.0%) | 0 (0.0%) |
| 18 to 34 Years | 1 (0.9%) | 0 (0.0%) |
| 35 to 64 Years | 16 (32.7%) | 12 (19.7%) |
| 65 to 74 Years | 6 (26.1%) | 5 (83.3%) |
| 75 Years and over | 3 (37.5%) | 11 (84.6%) |
Disability Class by Sex by Age in Cary
Disability Class: Hearing Difficulty
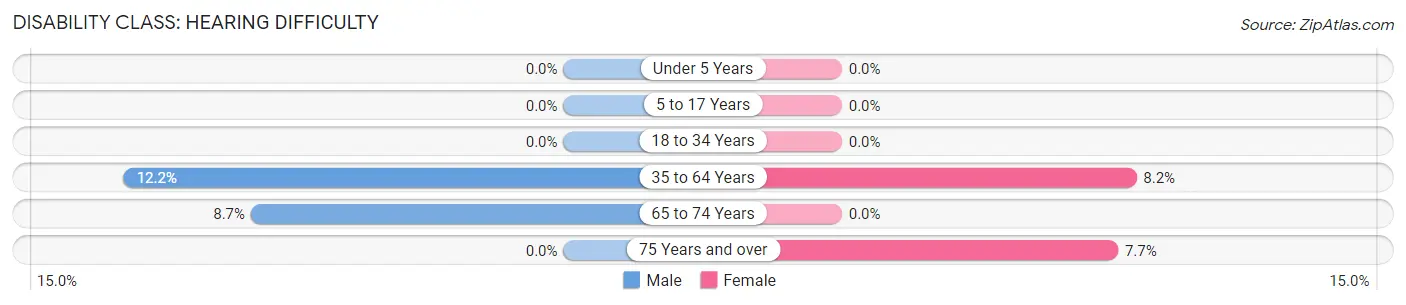
| Age Bracket | Male | Female |
| Under 5 Years | 0 (0.0%) | 0 (0.0%) |
| 5 to 17 Years | 0 (0.0%) | 0 (0.0%) |
| 18 to 34 Years | 0 (0.0%) | 0 (0.0%) |
| 35 to 64 Years | 6 (12.2%) | 5 (8.2%) |
| 65 to 74 Years | 2 (8.7%) | 0 (0.0%) |
| 75 Years and over | 0 (0.0%) | 1 (7.7%) |
Disability Class: Vision Difficulty
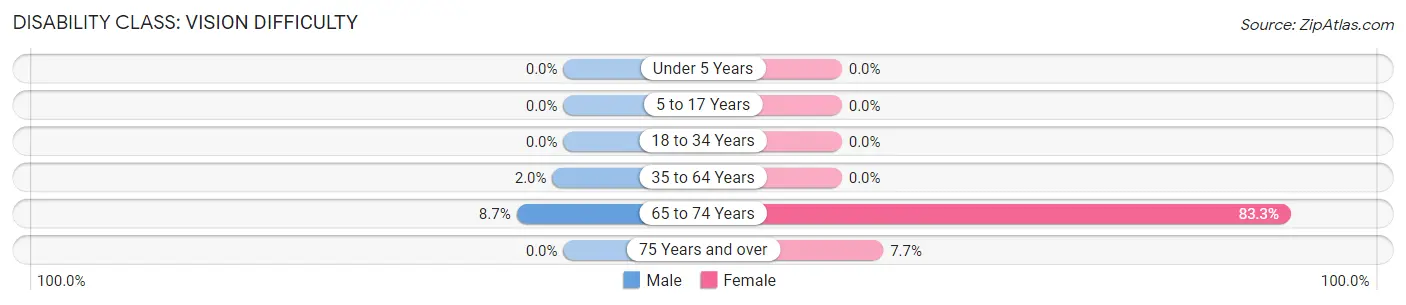
| Age Bracket | Male | Female |
| Under 5 Years | 0 (0.0%) | 0 (0.0%) |
| 5 to 17 Years | 0 (0.0%) | 0 (0.0%) |
| 18 to 34 Years | 0 (0.0%) | 0 (0.0%) |
| 35 to 64 Years | 1 (2.0%) | 0 (0.0%) |
| 65 to 74 Years | 2 (8.7%) | 5 (83.3%) |
| 75 Years and over | 0 (0.0%) | 1 (7.7%) |
Disability Class: Cognitive Difficulty
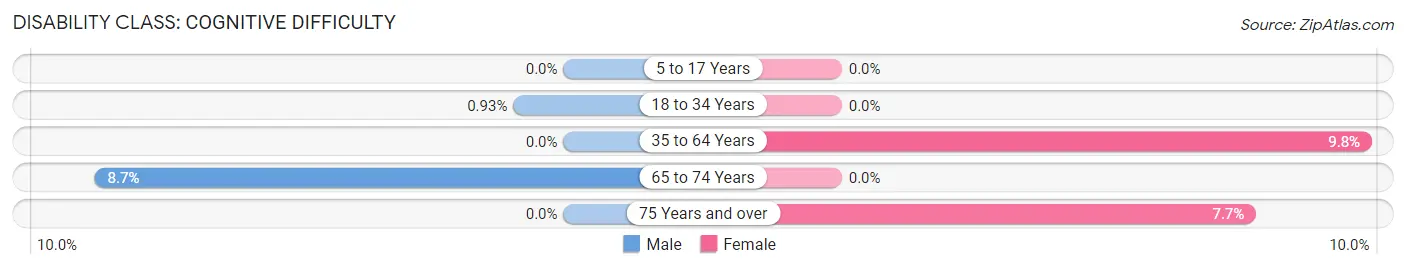
| Age Bracket | Male | Female |
| 5 to 17 Years | 0 (0.0%) | 0 (0.0%) |
| 18 to 34 Years | 1 (0.9%) | 0 (0.0%) |
| 35 to 64 Years | 0 (0.0%) | 6 (9.8%) |
| 65 to 74 Years | 2 (8.7%) | 0 (0.0%) |
| 75 Years and over | 0 (0.0%) | 1 (7.7%) |
Disability Class: Ambulatory Difficulty
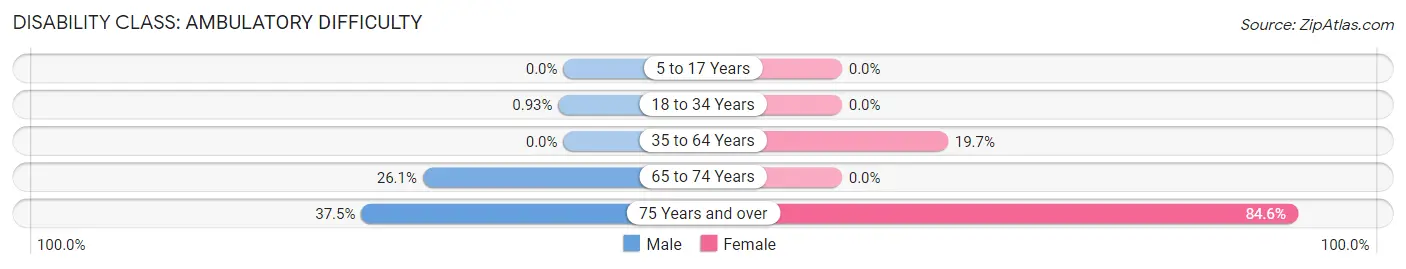
| Age Bracket | Male | Female |
| 5 to 17 Years | 0 (0.0%) | 0 (0.0%) |
| 18 to 34 Years | 1 (0.9%) | 0 (0.0%) |
| 35 to 64 Years | 0 (0.0%) | 12 (19.7%) |
| 65 to 74 Years | 6 (26.1%) | 0 (0.0%) |
| 75 Years and over | 3 (37.5%) | 11 (84.6%) |
Disability Class: Self-Care Difficulty
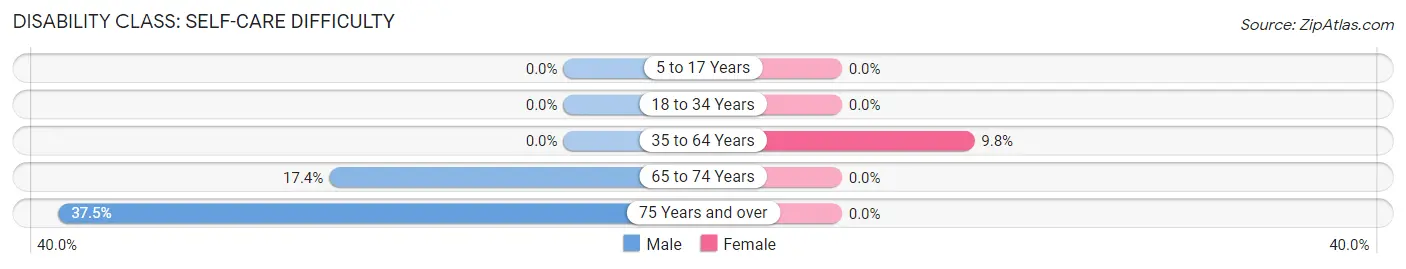
| Age Bracket | Male | Female |
| 5 to 17 Years | 0 (0.0%) | 0 (0.0%) |
| 18 to 34 Years | 0 (0.0%) | 0 (0.0%) |
| 35 to 64 Years | 0 (0.0%) | 6 (9.8%) |
| 65 to 74 Years | 4 (17.4%) | 0 (0.0%) |
| 75 Years and over | 3 (37.5%) | 0 (0.0%) |
Technology Access in Cary
Computing Device Access in Cary
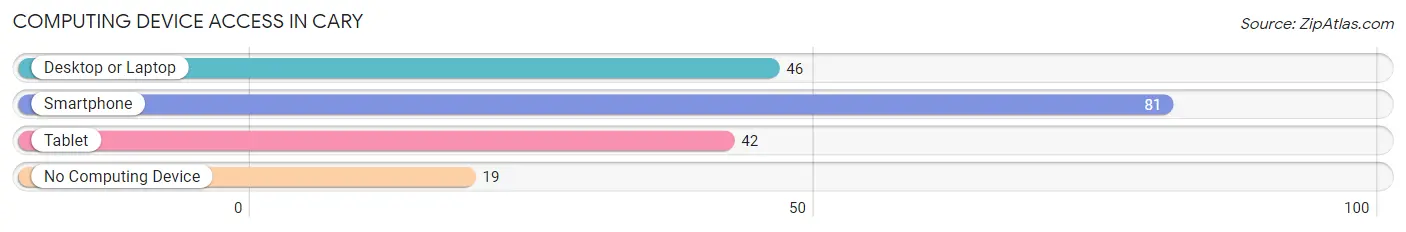
| Device Type | # Households | % Households |
| Desktop or Laptop | 46 | 45.1% |
| Smartphone | 81 | 79.4% |
| Tablet | 42 | 41.2% |
| No Computing Device | 19 | 18.6% |
| Total | 102 | 100.0% |
Internet Access in Cary
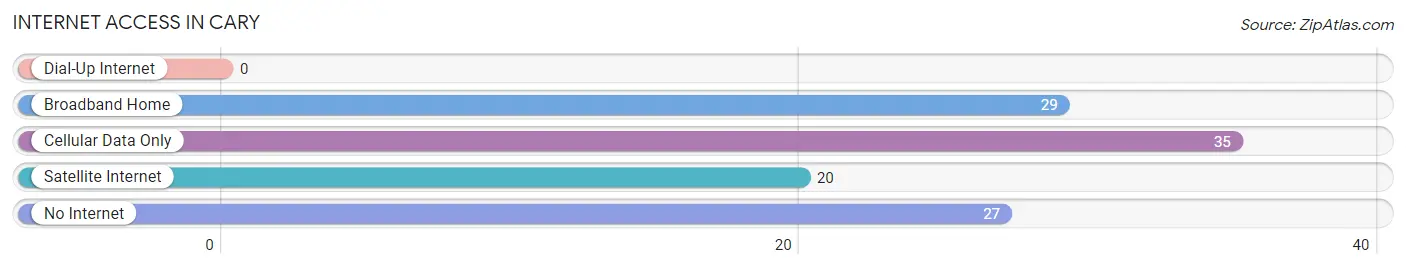
| Internet Type | # Households | % Households |
| Dial-Up Internet | 0 | 0.0% |
| Broadband Home | 29 | 28.4% |
| Cellular Data Only | 35 | 34.3% |
| Satellite Internet | 20 | 19.6% |
| No Internet | 27 | 26.5% |
| Total | 102 | 100.0% |
Cary Summary
Cary is a small town located in Montgomery County, Mississippi. It is situated in the southeastern part of the state, approximately 20 miles south of the state capital, Jackson. The town has a population of approximately 1,000 people and is part of the Jackson Metropolitan Statistical Area.
History
Cary was founded in 1837 by a group of settlers from North Carolina. The town was named after the nearby Cary Creek, which was named after a local Native American chief. The town was originally a farming community, but it soon developed into a small trading center. In 1845, the town was incorporated and a post office was established.
In the late 19th century, Cary began to experience a period of growth. The town was connected to the railroad in 1887, and the population began to increase. The town also became a popular destination for tourists, as it was located near several popular resorts.
In the early 20th century, Cary experienced a period of decline. The railroad was abandoned in the 1920s, and the population began to decline. The town was also hit hard by the Great Depression, and many of the businesses in town closed.
Geography
Cary is located in southeastern Mississippi, approximately 20 miles south of the state capital, Jackson. The town is situated in the Yazoo-Mississippi Delta region, and is surrounded by rolling hills and flatlands. The town is located near several rivers, including the Big Black River, the Yazoo River, and the Pearl River.
The climate in Cary is humid subtropical, with hot, humid summers and mild winters. The average annual temperature is around 70 degrees Fahrenheit, and the average annual precipitation is around 50 inches.
Economy
The economy of Cary is largely based on agriculture. The town is home to several farms, and the surrounding area is known for its production of cotton, soybeans, and corn. The town is also home to several small businesses, including restaurants, retail stores, and service providers.
Demographics
As of the 2010 census, the population of Cary was 1,000. The racial makeup of the town was 79.2% White, 18.2% African American, 0.2% Native American, 0.2% Asian, and 2.2% from other races. The median household income was $30,000, and the median family income was $35,000.
Cary is a small town with a rich history and a diverse population. The town is home to several farms and businesses, and is a popular destination for tourists. The town is also home to a variety of cultural and recreational activities, making it an ideal place to live and visit.
Common Questions
What is Per Capita Income in Cary?
Per Capita income in Cary is $20,535.
What is the Median Family Income in Cary?
Median Family Income in Cary is $53,125.
What is the Median Household income in Cary?
Median Household Income in Cary is $40,000.
What is Income or Wage Gap in Cary?
Income or Wage Gap in Cary is 64.5%.
Women in Cary earn 35.5 cents for every dollar earned by a man.
What is Inequality or Gini Index in Cary?
Inequality or Gini Index in Cary is 0.44.
What is the Total Population of Cary?
Total Population of Cary is 414.
What is the Total Male Population of Cary?
Total Male Population of Cary is 229.
What is the Total Female Population of Cary?
Total Female Population of Cary is 185.
What is the Ratio of Males per 100 Females in Cary?
There are 123.78 Males per 100 Females in Cary.
What is the Ratio of Females per 100 Males in Cary?
There are 80.79 Females per 100 Males in Cary.
What is the Median Population Age in Cary?
Median Population Age in Cary is 26.0 Years.
What is the Average Family Size in Cary
Average Family Size in Cary is 4.9 People.
What is the Average Household Size in Cary
Average Household Size in Cary is 4.1 People.
How Large is the Labor Force in Cary?
There are 203 People in the Labor Forcein in Cary.
What is the Percentage of People in the Labor Force in Cary?
61.9% of People are in the Labor Force in Cary.
What is the Unemployment Rate in Cary?
Unemployment Rate in Cary is 8.4%.