Belzoni, MS Map & Demographics
Belzoni Map
Belzoni Overview
$19,790
PER CAPITA INCOME
$50,125
AVG FAMILY INCOME
$37,528
AVG HOUSEHOLD INCOME
48.3%
WAGE / INCOME GAP [ % ]
51.7¢/ $1
WAGE / INCOME GAP [ $ ]
0.44
INEQUALITY / GINI INDEX
1,947
TOTAL POPULATION
970
MALE POPULATION
977
FEMALE POPULATION
99.28
MALES / 100 FEMALES
100.72
FEMALES / 100 MALES
36.6
MEDIAN AGE
3.5
AVG FAMILY SIZE
2.7
AVG HOUSEHOLD SIZE
649
LABOR FORCE [ PEOPLE ]
48.5%
PERCENT IN LABOR FORCE
13.4%
UNEMPLOYMENT RATE
Belzoni Zip Codes
Belzoni Area Codes
Income in Belzoni
Income Overview in Belzoni
Per Capita Income in Belzoni is $19,790, while median incomes of families and households are $50,125 and $37,528 respectively.
| Characteristic | Number | Measure |
| Per Capita Income | 1,947 | $19,790 |
| Median Family Income | 474 | $50,125 |
| Mean Family Income | 474 | $65,888 |
| Median Household Income | 709 | $37,528 |
| Mean Household Income | 709 | $55,774 |
| Income Deficit | 474 | $0 |
| Wage / Income Gap (%) | 1,947 | 48.34% |
| Wage / Income Gap ($) | 1,947 | 51.66¢ per $1 |
| Gini / Inequality Index | 1,947 | 0.44 |
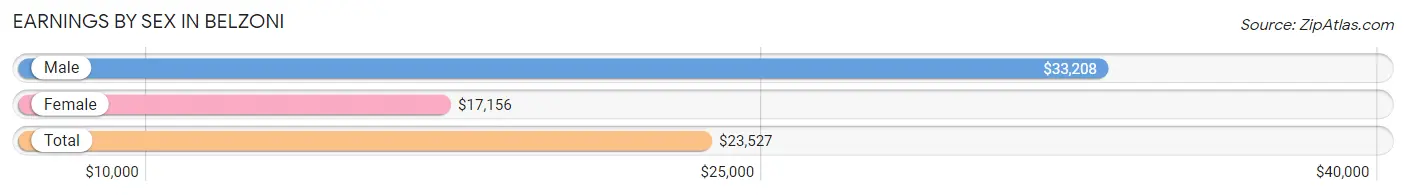
Earnings by Sex in Belzoni
Average Earnings in Belzoni are $23,527, $33,208 for men and $17,156 for women, a difference of 48.3%.
| Sex | Number | Average Earnings |
| Male | 422 (58.4%) | $33,208 |
| Female | 301 (41.6%) | $17,156 |
| Total | 723 (100.0%) | $23,527 |
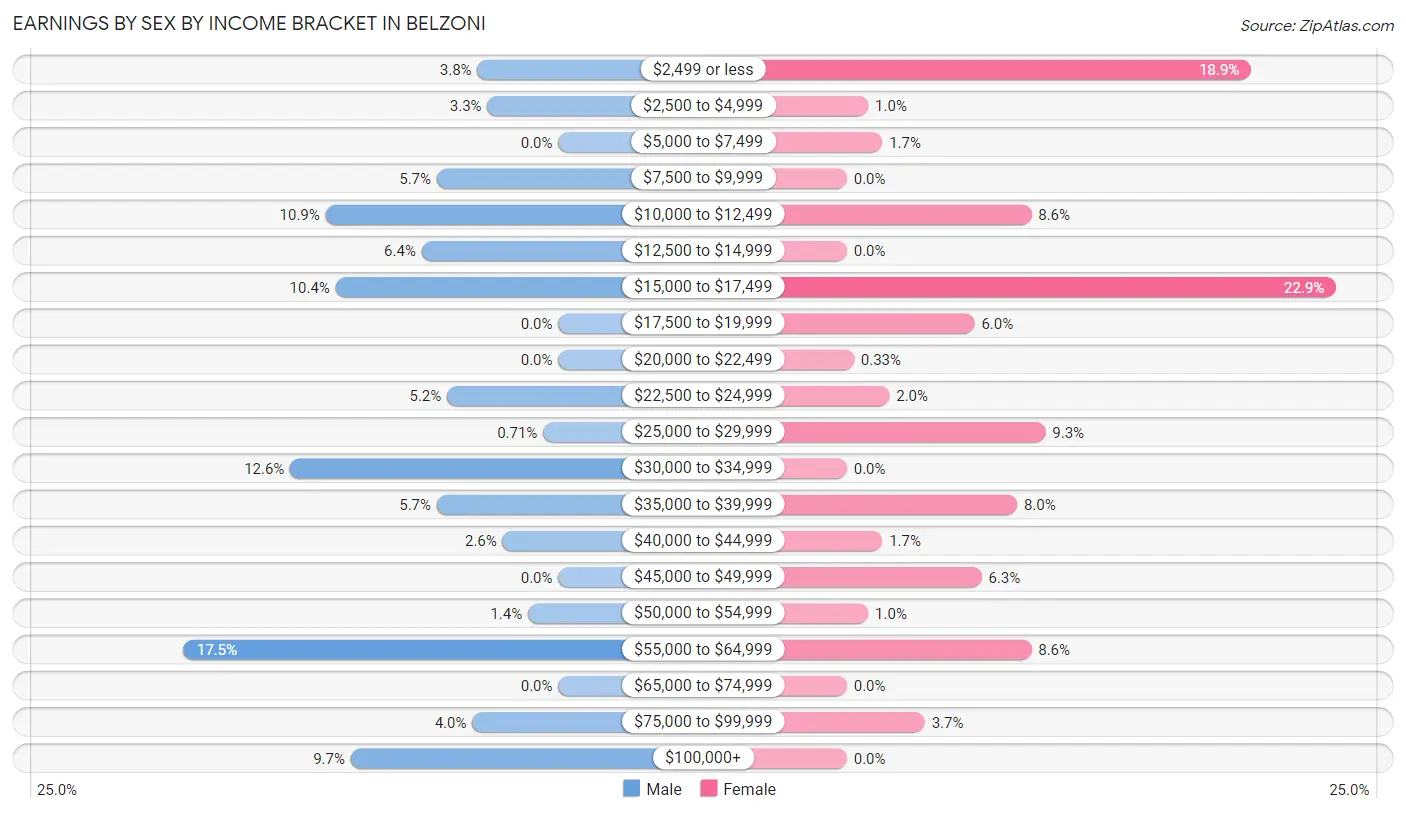
Earnings by Sex by Income Bracket in Belzoni
The most common earnings brackets in Belzoni are $55,000 to $64,999 for men (74 | 17.5%) and $15,000 to $17,499 for women (69 | 22.9%).
| Income | Male | Female |
| $2,499 or less | 16 (3.8%) | 57 (18.9%) |
| $2,500 to $4,999 | 14 (3.3%) | 3 (1.0%) |
| $5,000 to $7,499 | 0 (0.0%) | 5 (1.7%) |
| $7,500 to $9,999 | 24 (5.7%) | 0 (0.0%) |
| $10,000 to $12,499 | 46 (10.9%) | 26 (8.6%) |
| $12,500 to $14,999 | 27 (6.4%) | 0 (0.0%) |
| $15,000 to $17,499 | 44 (10.4%) | 69 (22.9%) |
| $17,500 to $19,999 | 0 (0.0%) | 18 (6.0%) |
| $20,000 to $22,499 | 0 (0.0%) | 1 (0.3%) |
| $22,500 to $24,999 | 22 (5.2%) | 6 (2.0%) |
| $25,000 to $29,999 | 3 (0.7%) | 28 (9.3%) |
| $30,000 to $34,999 | 53 (12.6%) | 0 (0.0%) |
| $35,000 to $39,999 | 24 (5.7%) | 24 (8.0%) |
| $40,000 to $44,999 | 11 (2.6%) | 5 (1.7%) |
| $45,000 to $49,999 | 0 (0.0%) | 19 (6.3%) |
| $50,000 to $54,999 | 6 (1.4%) | 3 (1.0%) |
| $55,000 to $64,999 | 74 (17.5%) | 26 (8.6%) |
| $65,000 to $74,999 | 0 (0.0%) | 0 (0.0%) |
| $75,000 to $99,999 | 17 (4.0%) | 11 (3.6%) |
| $100,000+ | 41 (9.7%) | 0 (0.0%) |
| Total | 422 (100.0%) | 301 (100.0%) |
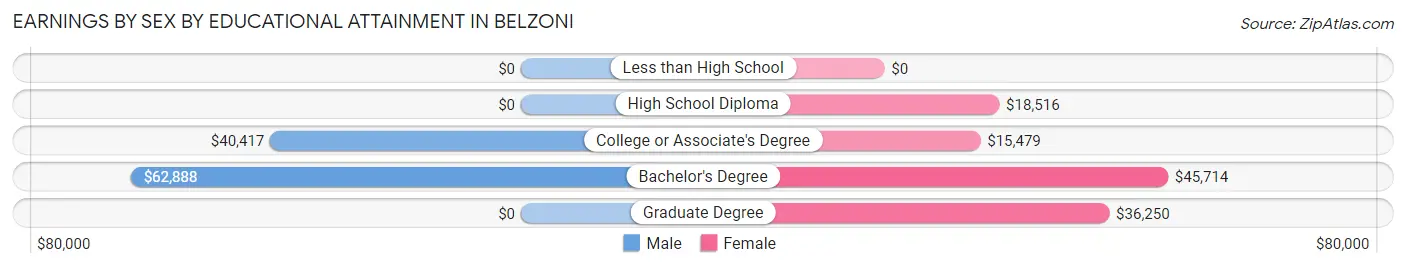
Earnings by Sex by Educational Attainment in Belzoni
Average earnings in Belzoni are $33,915 for men and $17,192 for women, a difference of 49.3%. Men with an educational attainment of bachelor's degree enjoy the highest average annual earnings of $62,888, while those with college or associate's degree education earn the least with $40,417. Women with an educational attainment of bachelor's degree earn the most with the average annual earnings of $45,714, while those with college or associate's degree education have the smallest earnings of $15,479.
| Educational Attainment | Male Income | Female Income |
| Less than High School | - | - |
| High School Diploma | - | - |
| College or Associate's Degree | $40,417 | $15,479 |
| Bachelor's Degree | $62,888 | $45,714 |
| Graduate Degree | - | - |
| Total | $33,915 | $17,192 |
Family Income in Belzoni
Family Income Brackets in Belzoni
According to the Belzoni family income data, there are 127 families falling into the $15,000 to $24,999 income range, which is the most common income bracket and makes up 26.8% of all families. Conversely, the less than $10,000 income bracket is the least frequent group with only 4 families (0.8%) belonging to this category.
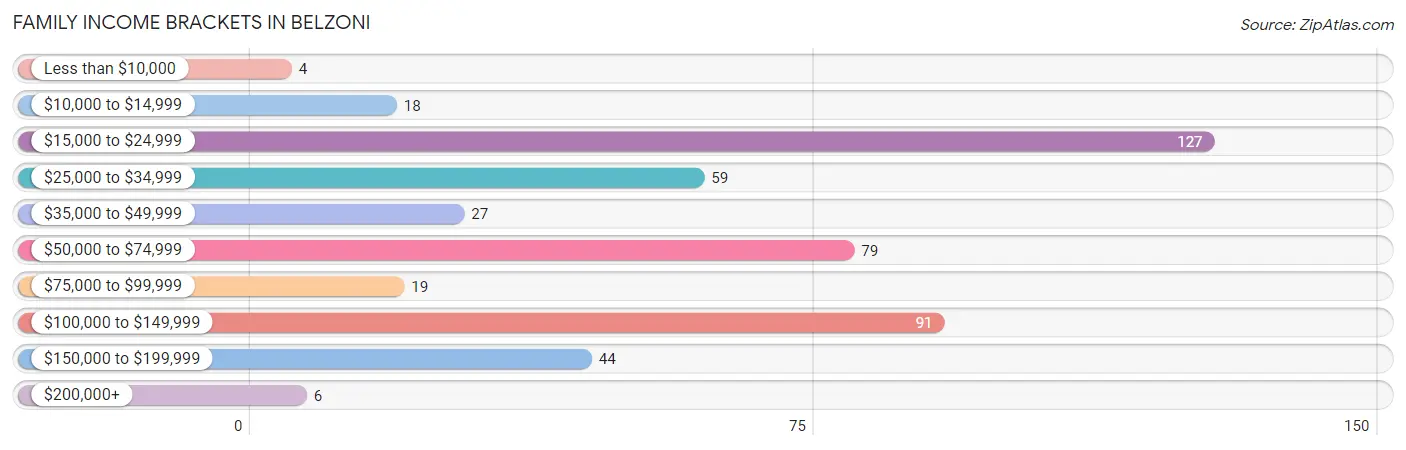
| Income Bracket | # Families | % Families |
| Less than $10,000 | 4 | 0.8% |
| $10,000 to $14,999 | 18 | 3.8% |
| $15,000 to $24,999 | 127 | 26.8% |
| $25,000 to $34,999 | 59 | 12.4% |
| $35,000 to $49,999 | 27 | 5.7% |
| $50,000 to $74,999 | 79 | 16.7% |
| $75,000 to $99,999 | 19 | 4.0% |
| $100,000 to $149,999 | 91 | 19.2% |
| $150,000 to $199,999 | 44 | 9.3% |
| $200,000+ | 6 | 1.3% |
Family Income by Famaliy Size in Belzoni
5-person families (15 | 3.2%) account for the highest median family income in Belzoni with $57,292 per family, while 2-person families (291 | 61.4%) have the highest median income of $26,128 per family member.
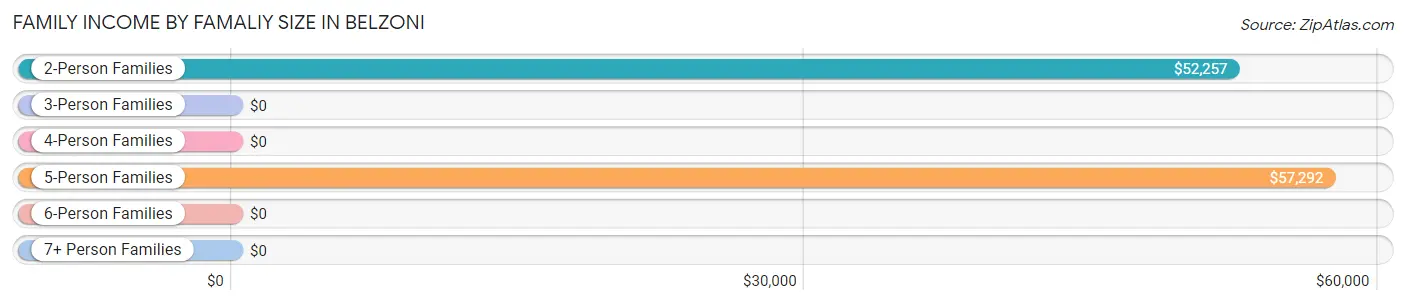
| Income Bracket | # Families | Median Income |
| 2-Person Families | 291 (61.4%) | $52,257 |
| 3-Person Families | 48 (10.1%) | $0 |
| 4-Person Families | 62 (13.1%) | $0 |
| 5-Person Families | 15 (3.2%) | $57,292 |
| 6-Person Families | 40 (8.4%) | $0 |
| 7+ Person Families | 18 (3.8%) | $0 |
| Total | 474 (100.0%) | $50,125 |
Family Income by Number of Earners in Belzoni
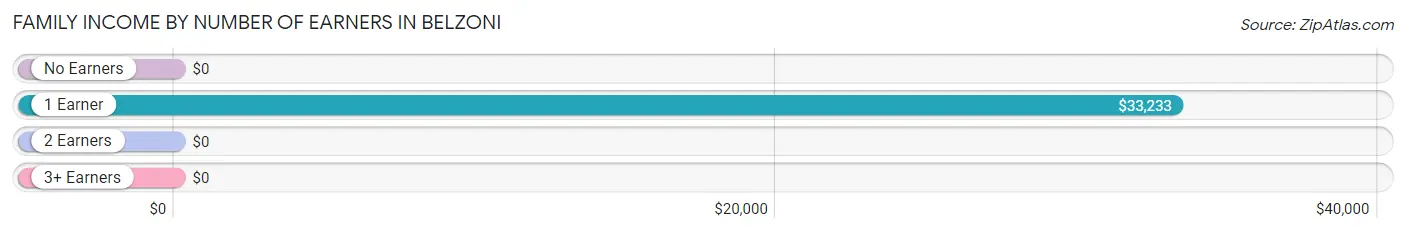
| Number of Earners | # Families | Median Income |
| No Earners | 73 (15.4%) | $0 |
| 1 Earner | 207 (43.7%) | $33,233 |
| 2 Earners | 192 (40.5%) | $0 |
| 3+ Earners | 2 (0.4%) | $0 |
| Total | 474 (100.0%) | $50,125 |
Household Income in Belzoni
Household Income Brackets in Belzoni
With 128 households falling in the category, the $25,000 to $34,999 income range is the most frequent in Belzoni, accounting for 18.0% of all households. In contrast, only 6 households (0.9%) fall into the $200,000+ income bracket, making it the least populous group.
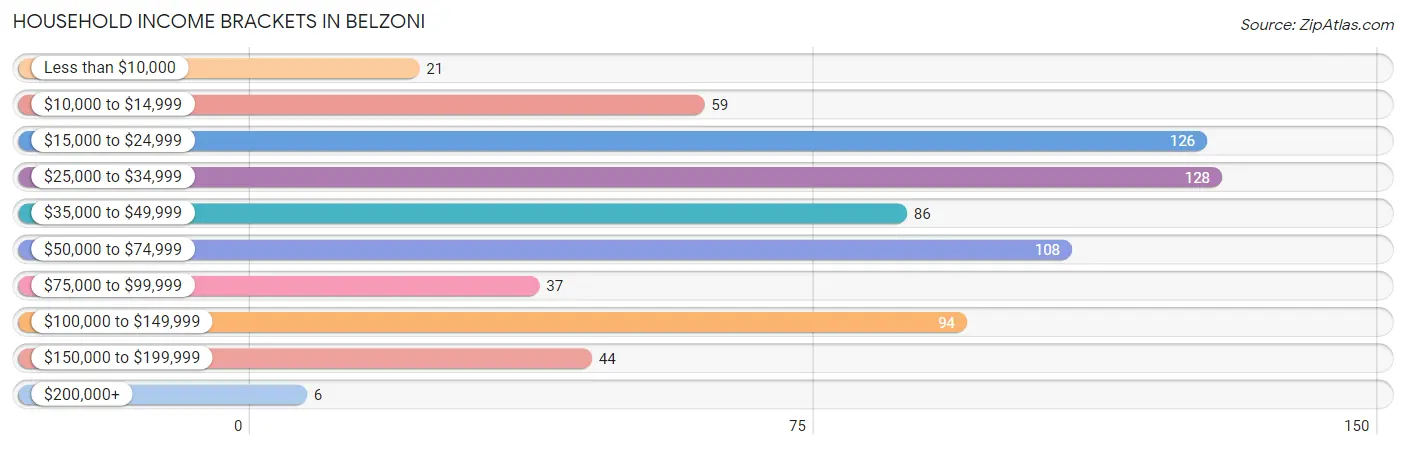
| Income Bracket | # Households | % Households |
| Less than $10,000 | 21 | 3.0% |
| $10,000 to $14,999 | 59 | 8.3% |
| $15,000 to $24,999 | 126 | 17.8% |
| $25,000 to $34,999 | 128 | 18.1% |
| $35,000 to $49,999 | 86 | 12.1% |
| $50,000 to $74,999 | 108 | 15.2% |
| $75,000 to $99,999 | 37 | 5.2% |
| $100,000 to $149,999 | 94 | 13.3% |
| $150,000 to $199,999 | 44 | 6.2% |
| $200,000+ | 6 | 0.8% |
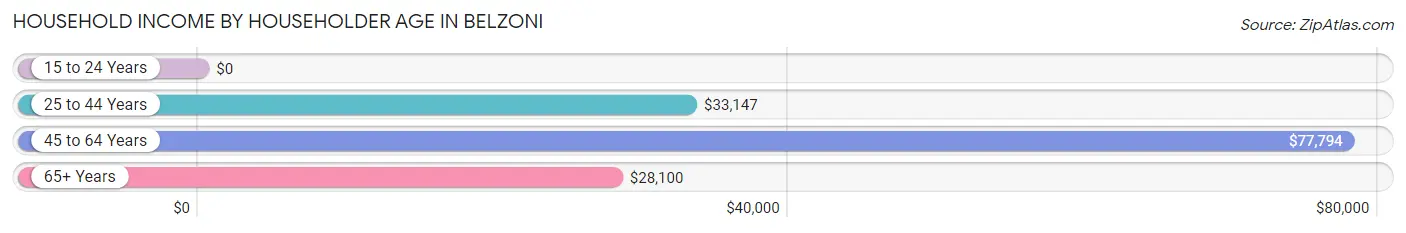
Household Income by Householder Age in Belzoni
The median household income in Belzoni is $37,528, with the highest median household income of $77,794 found in the 45 to 64 years age bracket for the primary householder. A total of 258 households (36.4%) fall into this category. Meanwhile, the 15 to 24 years age bracket for the primary householder has the lowest median household income of $0, with 16 households (2.3%) in this group.
| Income Bracket | # Households | Median Income |
| 15 to 24 Years | 16 (2.3%) | $0 |
| 25 to 44 Years | 215 (30.3%) | $33,147 |
| 45 to 64 Years | 258 (36.4%) | $77,794 |
| 65+ Years | 220 (31.0%) | $28,100 |
| Total | 709 (100.0%) | $37,528 |
Poverty in Belzoni
Income Below Poverty by Sex and Age in Belzoni
With 41.0% poverty level for males and 34.9% for females among the residents of Belzoni, 5 year old males and 16 and 17 year old females are the most vulnerable to poverty, with 60 males (100.0%) and 16 females (100.0%) in their respective age groups living below the poverty level.
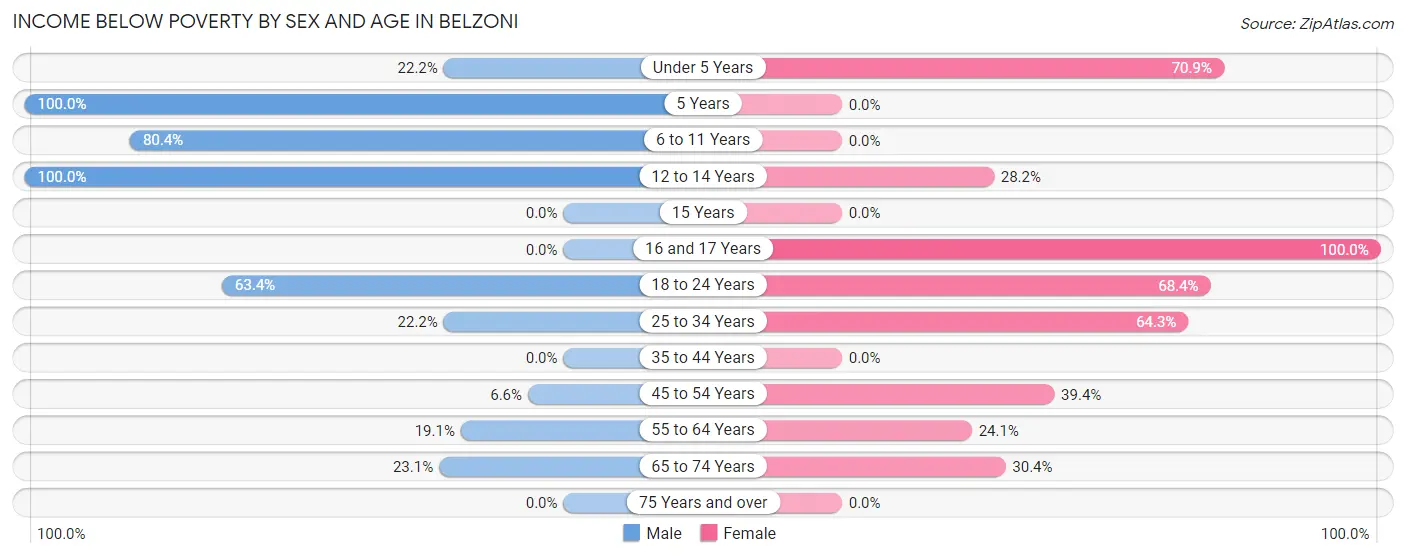
| Age Bracket | Male | Female |
| Under 5 Years | 2 (22.2%) | 112 (70.9%) |
| 5 Years | 60 (100.0%) | 0 (0.0%) |
| 6 to 11 Years | 181 (80.4%) | 0 (0.0%) |
| 12 to 14 Years | 5 (100.0%) | 11 (28.2%) |
| 15 Years | 0 (0.0%) | 0 (0.0%) |
| 16 and 17 Years | 0 (0.0%) | 16 (100.0%) |
| 18 to 24 Years | 64 (63.4%) | 39 (68.4%) |
| 25 to 34 Years | 14 (22.2%) | 54 (64.3%) |
| 35 to 44 Years | 0 (0.0%) | 0 (0.0%) |
| 45 to 54 Years | 6 (6.6%) | 41 (39.4%) |
| 55 to 64 Years | 28 (19.1%) | 34 (24.1%) |
| 65 to 74 Years | 27 (23.1%) | 34 (30.4%) |
| 75 Years and over | 0 (0.0%) | 0 (0.0%) |
| Total | 387 (41.0%) | 341 (34.9%) |
Income Above Poverty by Sex and Age in Belzoni
According to the poverty statistics in Belzoni, males aged 15 years and females aged 6 to 11 years are the age groups that are most secure financially, with 100.0% of males and 100.0% of females in these age groups living above the poverty line.
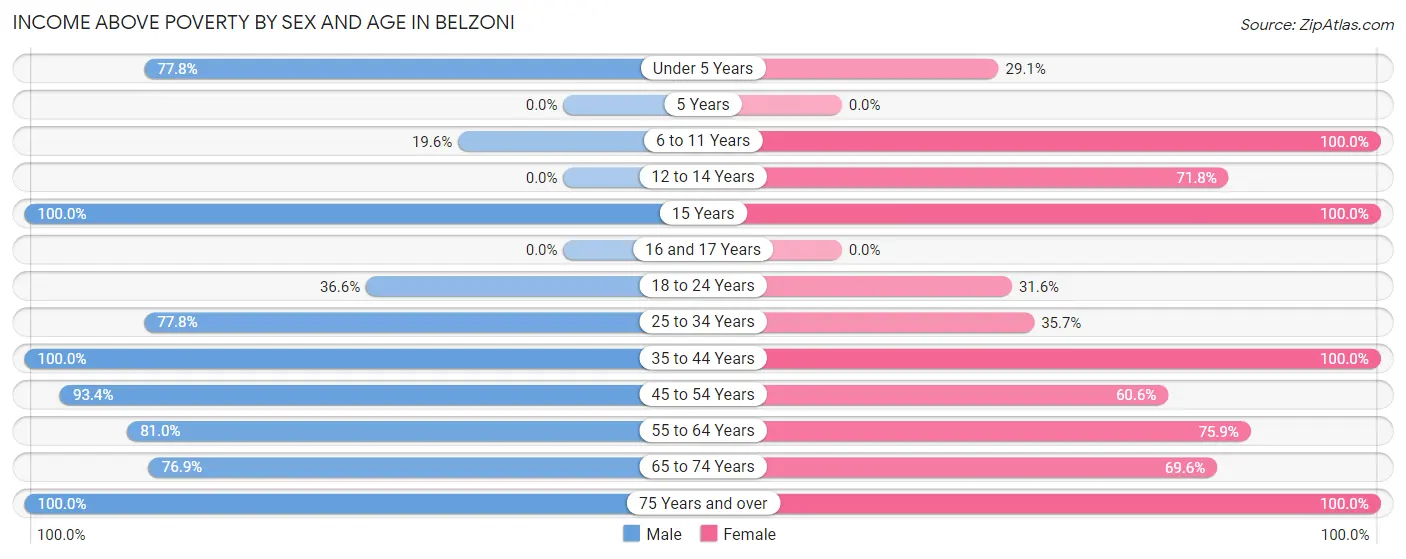
| Age Bracket | Male | Female |
| Under 5 Years | 7 (77.8%) | 46 (29.1%) |
| 5 Years | 0 (0.0%) | 0 (0.0%) |
| 6 to 11 Years | 44 (19.6%) | 87 (100.0%) |
| 12 to 14 Years | 0 (0.0%) | 28 (71.8%) |
| 15 Years | 9 (100.0%) | 16 (100.0%) |
| 16 and 17 Years | 0 (0.0%) | 0 (0.0%) |
| 18 to 24 Years | 37 (36.6%) | 18 (31.6%) |
| 25 to 34 Years | 49 (77.8%) | 30 (35.7%) |
| 35 to 44 Years | 103 (100.0%) | 90 (100.0%) |
| 45 to 54 Years | 85 (93.4%) | 63 (60.6%) |
| 55 to 64 Years | 119 (80.9%) | 107 (75.9%) |
| 65 to 74 Years | 90 (76.9%) | 78 (69.6%) |
| 75 Years and over | 13 (100.0%) | 73 (100.0%) |
| Total | 556 (59.0%) | 636 (65.1%) |
Income Below Poverty Among Married-Couple Families in Belzoni
The poverty statistics for married-couple families in Belzoni show that 8.9% or 21 of the total 236 families live below the poverty line. Families with no children have the highest poverty rate of 12.8%, comprising of 21 families. On the other hand, families with 1 or 2 children have the lowest poverty rate of 0.0%, which includes 0 families.
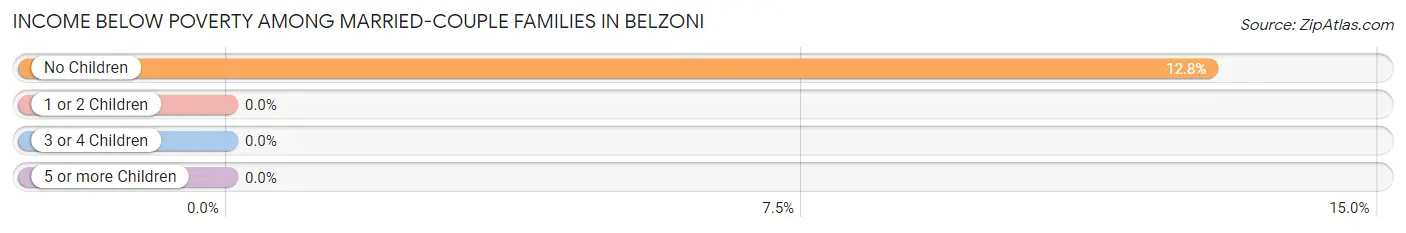
| Children | Above Poverty | Below Poverty |
| No Children | 143 (87.2%) | 21 (12.8%) |
| 1 or 2 Children | 65 (100.0%) | 0 (0.0%) |
| 3 or 4 Children | 7 (100.0%) | 0 (0.0%) |
| 5 or more Children | 0 (0.0%) | 0 (0.0%) |
| Total | 215 (91.1%) | 21 (8.9%) |
Income Below Poverty Among Single-Parent Households in Belzoni
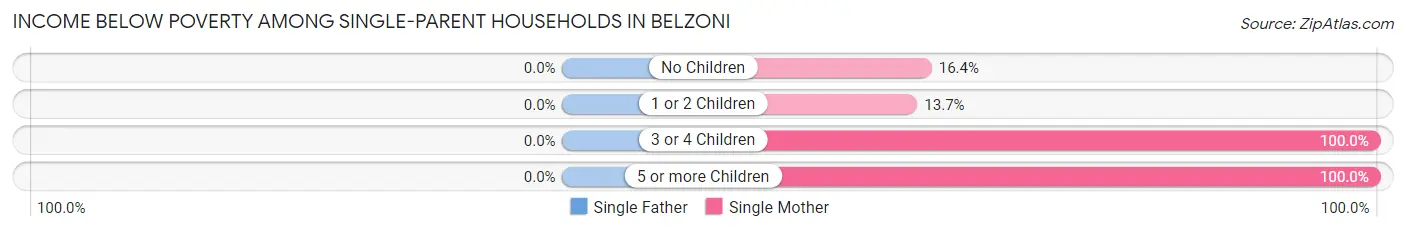
| Children | Single Father | Single Mother |
| No Children | 0 (0.0%) | 22 (16.4%) |
| 1 or 2 Children | 0 (0.0%) | 7 (13.7%) |
| 3 or 4 Children | 0 (0.0%) | 1 (100.0%) |
| 5 or more Children | 0 (0.0%) | 40 (100.0%) |
| Total | 0 (0.0%) | 70 (31.0%) |
Income Below Poverty Among Married-Couple vs Single-Parent Households in Belzoni
The poverty data for Belzoni shows that 21 of the married-couple family households (8.9%) and 70 of the single-parent households (29.4%) are living below the poverty level. Within the married-couple family households, those with no children have the highest poverty rate, with 21 households (12.8%) falling below the poverty line. Among the single-parent households, those with 3 or 4 children have the highest poverty rate, with 1 household (100.0%) living below poverty.
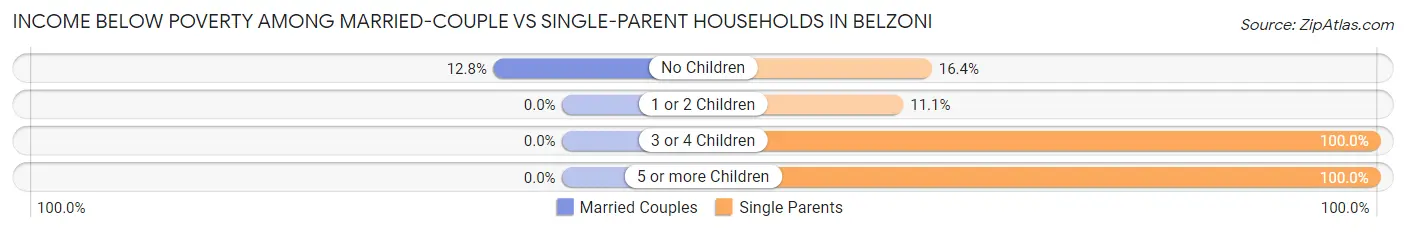
| Children | Married-Couple Families | Single-Parent Households |
| No Children | 21 (12.8%) | 22 (16.4%) |
| 1 or 2 Children | 0 (0.0%) | 7 (11.1%) |
| 3 or 4 Children | 0 (0.0%) | 1 (100.0%) |
| 5 or more Children | 0 (0.0%) | 40 (100.0%) |
| Total | 21 (8.9%) | 70 (29.4%) |
Race in Belzoni
The most populous races in Belzoni are Black / African American (1,645 | 84.5%), White / Caucasian (268 | 13.8%), and Two or more Races (21 | 1.1%).
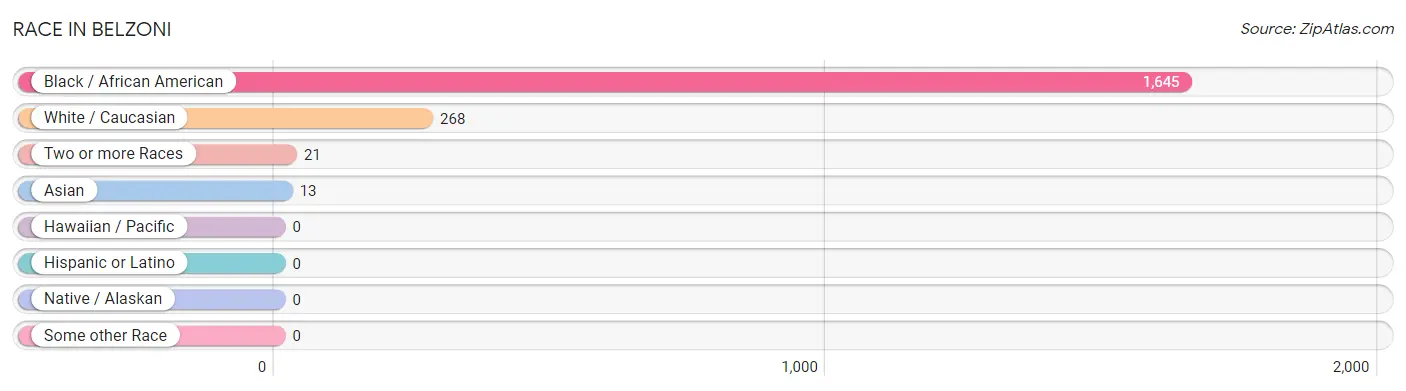
| Race | # Population | % Population |
| Asian | 13 | 0.7% |
| Black / African American | 1,645 | 84.5% |
| Hawaiian / Pacific | 0 | 0.0% |
| Hispanic or Latino | 0 | 0.0% |
| Native / Alaskan | 0 | 0.0% |
| White / Caucasian | 268 | 13.8% |
| Two or more Races | 21 | 1.1% |
| Some other Race | 0 | 0.0% |
| Total | 1,947 | 100.0% |
Ancestry in Belzoni
The most populous ancestries reported in Belzoni are American (76 | 3.9%), English (63 | 3.2%), Irish (49 | 2.5%), German (39 | 2.0%), and Italian (31 | 1.6%), together accounting for 13.3% of all Belzoni residents.
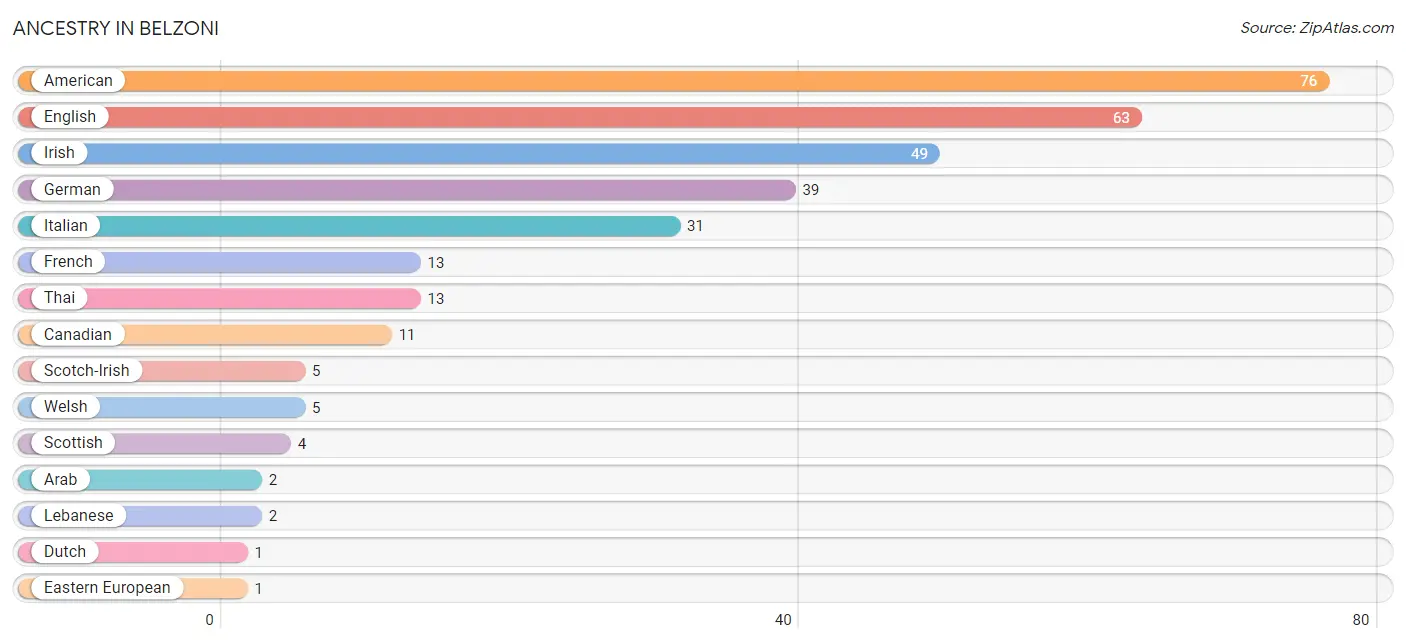
| Ancestry | # Population | % Population |
| American | 76 | 3.9% |
| Arab | 2 | 0.1% |
| Canadian | 11 | 0.6% |
| Dutch | 1 | 0.1% |
| Eastern European | 1 | 0.1% |
| English | 63 | 3.2% |
| French | 13 | 0.7% |
| German | 39 | 2.0% |
| Irish | 49 | 2.5% |
| Italian | 31 | 1.6% |
| Lebanese | 2 | 0.1% |
| Scotch-Irish | 5 | 0.3% |
| Scottish | 4 | 0.2% |
| Thai | 13 | 0.7% |
| Welsh | 5 | 0.3% | View All 15 Rows |
Immigrants in Belzoni
The most numerous immigrant groups reported in Belzoni came from Asia (13 | 0.7%), India (13 | 0.7%), and South Central Asia (13 | 0.7%), together accounting for 2.0% of all Belzoni residents.
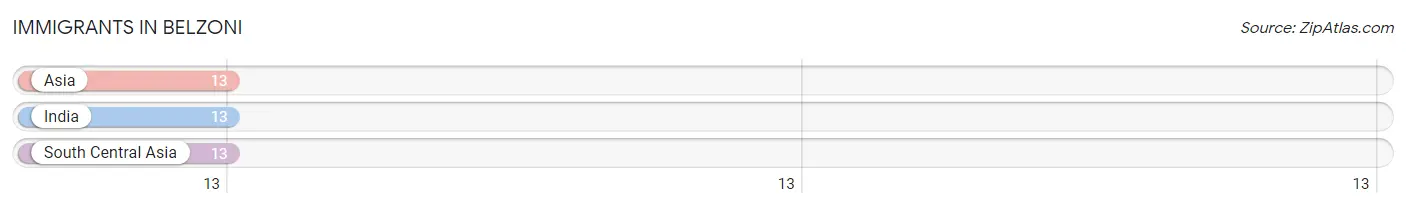
| Immigration Origin | # Population | % Population |
| Asia | 13 | 0.7% |
| India | 13 | 0.7% |
| South Central Asia | 13 | 0.7% | View All 3 Rows |
Sex and Age in Belzoni
Sex and Age in Belzoni
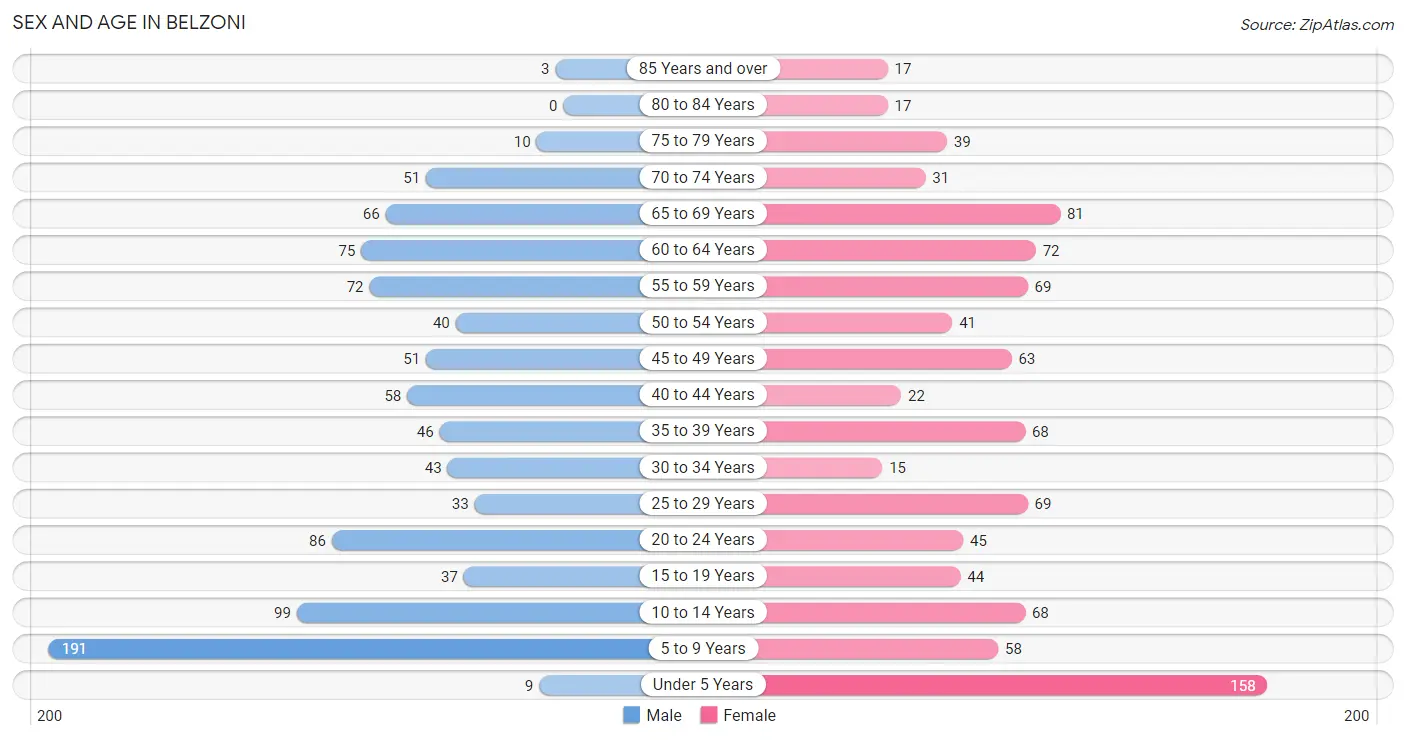
The most populous age groups in Belzoni are 5 to 9 Years (191 | 19.7%) for men and Under 5 Years (158 | 16.2%) for women.
| Age Bracket | Male | Female |
| Under 5 Years | 9 (0.9%) | 158 (16.2%) |
| 5 to 9 Years | 191 (19.7%) | 58 (5.9%) |
| 10 to 14 Years | 99 (10.2%) | 68 (7.0%) |
| 15 to 19 Years | 37 (3.8%) | 44 (4.5%) |
| 20 to 24 Years | 86 (8.9%) | 45 (4.6%) |
| 25 to 29 Years | 33 (3.4%) | 69 (7.1%) |
| 30 to 34 Years | 43 (4.4%) | 15 (1.5%) |
| 35 to 39 Years | 46 (4.7%) | 68 (7.0%) |
| 40 to 44 Years | 58 (6.0%) | 22 (2.2%) |
| 45 to 49 Years | 51 (5.3%) | 63 (6.5%) |
| 50 to 54 Years | 40 (4.1%) | 41 (4.2%) |
| 55 to 59 Years | 72 (7.4%) | 69 (7.1%) |
| 60 to 64 Years | 75 (7.7%) | 72 (7.4%) |
| 65 to 69 Years | 66 (6.8%) | 81 (8.3%) |
| 70 to 74 Years | 51 (5.3%) | 31 (3.2%) |
| 75 to 79 Years | 10 (1.0%) | 39 (4.0%) |
| 80 to 84 Years | 0 (0.0%) | 17 (1.7%) |
| 85 Years and over | 3 (0.3%) | 17 (1.7%) |
| Total | 970 (100.0%) | 977 (100.0%) |
Families and Households in Belzoni
Median Family Size in Belzoni
The median family size in Belzoni is 3.49 persons per family, with single female/mother families (226 | 47.7%) accounting for the largest median family size of 4.53 persons per family. On the other hand, single male/father families (12 | 2.5%) represent the smallest median family size with 2.33 persons per family.
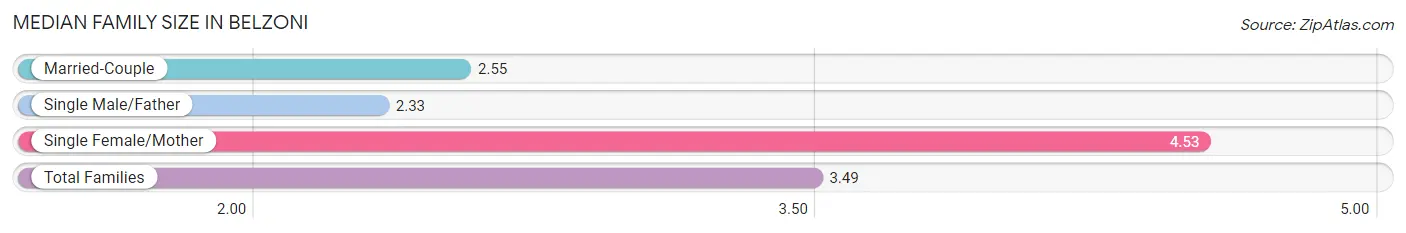
| Family Type | # Families | Family Size |
| Married-Couple | 236 (49.8%) | 2.55 |
| Single Male/Father | 12 (2.5%) | 2.33 |
| Single Female/Mother | 226 (47.7%) | 4.53 |
| Total Families | 474 (100.0%) | 3.49 |
Median Household Size in Belzoni
The median household size in Belzoni is 2.71 persons per household, with single female/mother households (226 | 31.9%) accounting for the largest median household size of 4.61 persons per household. non-family households (235 | 33.2%) represent the smallest median household size with 1.06 persons per household.
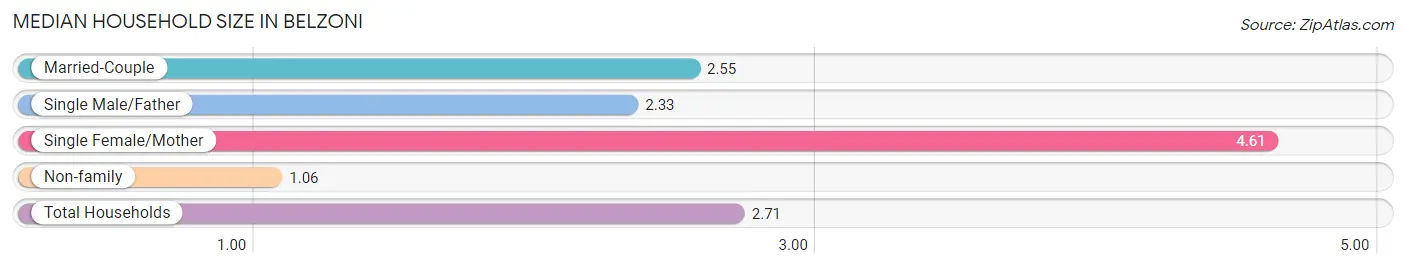
| Household Type | # Households | Household Size |
| Married-Couple | 236 (33.3%) | 2.55 |
| Single Male/Father | 12 (1.7%) | 2.33 |
| Single Female/Mother | 226 (31.9%) | 4.61 |
| Non-family | 235 (33.2%) | 1.06 |
| Total Households | 709 (100.0%) | 2.71 |
Household Size by Marriage Status in Belzoni
Out of a total of 709 households in Belzoni, 474 (66.8%) are family households, while 235 (33.2%) are nonfamily households. The most numerous type of family households are 2-person households, comprising 258, and the most common type of nonfamily households are 1-person households, comprising 226.
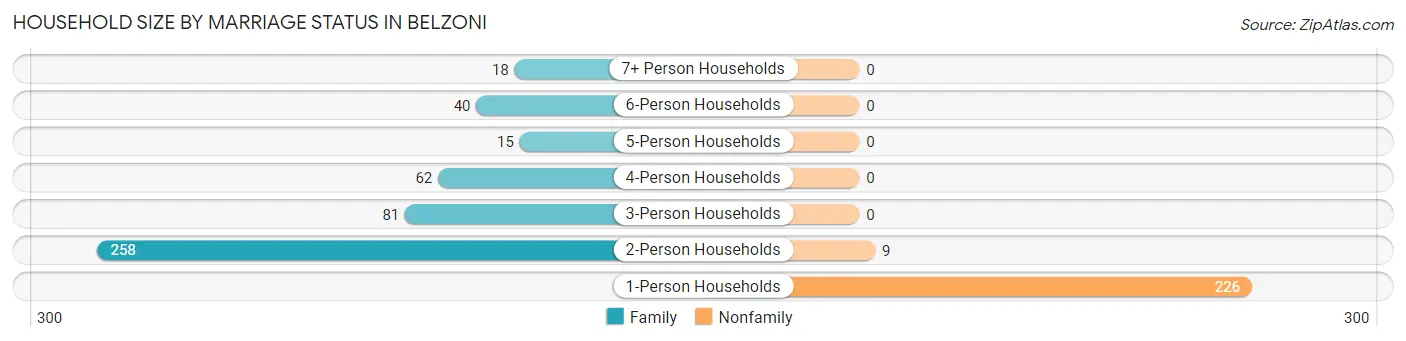
| Household Size | Family Households | Nonfamily Households |
| 1-Person Households | - | 226 (31.9%) |
| 2-Person Households | 258 (36.4%) | 9 (1.3%) |
| 3-Person Households | 81 (11.4%) | 0 (0.0%) |
| 4-Person Households | 62 (8.7%) | 0 (0.0%) |
| 5-Person Households | 15 (2.1%) | 0 (0.0%) |
| 6-Person Households | 40 (5.6%) | 0 (0.0%) |
| 7+ Person Households | 18 (2.5%) | 0 (0.0%) |
| Total | 474 (66.8%) | 235 (33.2%) |
Female Fertility in Belzoni
Fertility by Age in Belzoni
| Age Bracket | Women with Births | Births / 1,000 Women |
| 15 to 19 years | 0 (0.0%) | 0.0 |
| 20 to 34 years | 0 (0.0%) | 0.0 |
| 35 to 50 years | 0 (0.0%) | 0.0 |
| Total | 0 (0.0%) | 0.0 |
Fertility by Age by Marriage Status in Belzoni
| Age Bracket | Married | Unmarried |
| 15 to 19 years | 0 (0.0%) | 0 (0.0%) |
| 20 to 34 years | 0 (0.0%) | 0 (0.0%) |
| 35 to 50 years | 0 (0.0%) | 0 (0.0%) |
| Total | 0 (0.0%) | 0 (0.0%) |
Fertility by Education in Belzoni
| Educational Attainment | Women with Births | Births / 1,000 Women |
| Less than High School | 0 (0.0%) | 0.0 |
| High School Diploma | 0 (0.0%) | 0.0 |
| College or Associate's Degree | 0 (0.0%) | 0.0 |
| Bachelor's Degree | 0 (0.0%) | 0.0 |
| Graduate Degree | 0 (0.0%) | 0.0 |
| Total | 0 (0.0%) | 0.0 |
Fertility by Education by Marriage Status in Belzoni
| Educational Attainment | Married | Unmarried |
| Less than High School | 0 (0.0%) | 0 (0.0%) |
| High School Diploma | 0 (0.0%) | 0 (0.0%) |
| College or Associate's Degree | 0 (0.0%) | 0 (0.0%) |
| Bachelor's Degree | 0 (0.0%) | 0 (0.0%) |
| Graduate Degree | 0 (0.0%) | 0 (0.0%) |
| Total | 0 (0.0%) | 0 (0.0%) |
Employment Characteristics in Belzoni
Employment by Class of Employer in Belzoni
Among the 562 employed individuals in Belzoni, private company employees (213 | 37.9%), state government employees (104 | 18.5%), and local government employees (84 | 14.9%) make up the most common classes of employment.
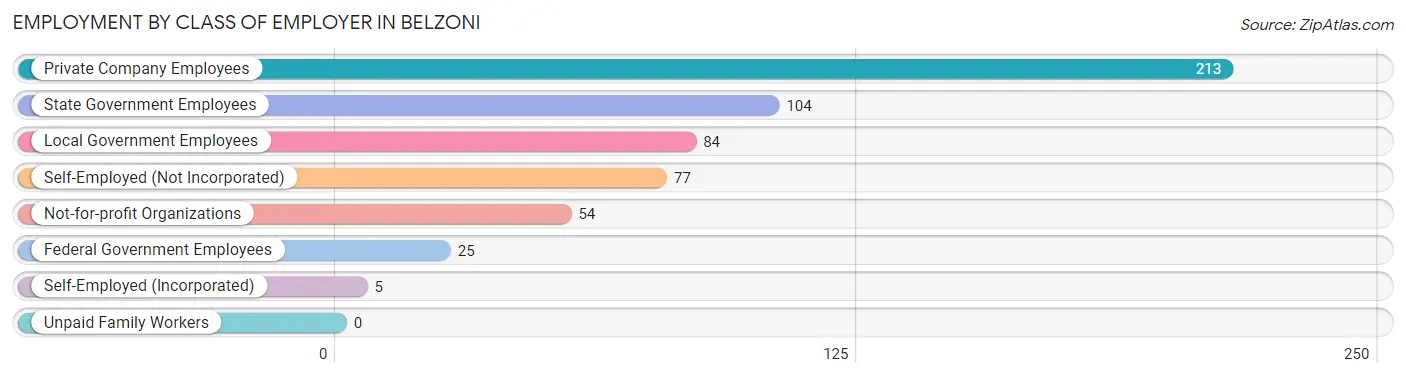
| Employer Class | # Employees | % Employees |
| Private Company Employees | 213 | 37.9% |
| Self-Employed (Incorporated) | 5 | 0.9% |
| Self-Employed (Not Incorporated) | 77 | 13.7% |
| Not-for-profit Organizations | 54 | 9.6% |
| Local Government Employees | 84 | 14.9% |
| State Government Employees | 104 | 18.5% |
| Federal Government Employees | 25 | 4.4% |
| Unpaid Family Workers | 0 | 0.0% |
| Total | 562 | 100.0% |
Employment Status by Age in Belzoni
According to the labor force statistics for Belzoni, out of the total population over 16 years of age (1,339), 48.5% or 649 individuals are in the labor force, with 13.4% or 87 of them unemployed. The age group with the highest labor force participation rate is 25 to 29 years, with 88.2% or 90 individuals in the labor force. Within the labor force, the 35 to 44 years age range has the highest percentage of unemployed individuals, with 33.6% or 42 of them being unemployed.
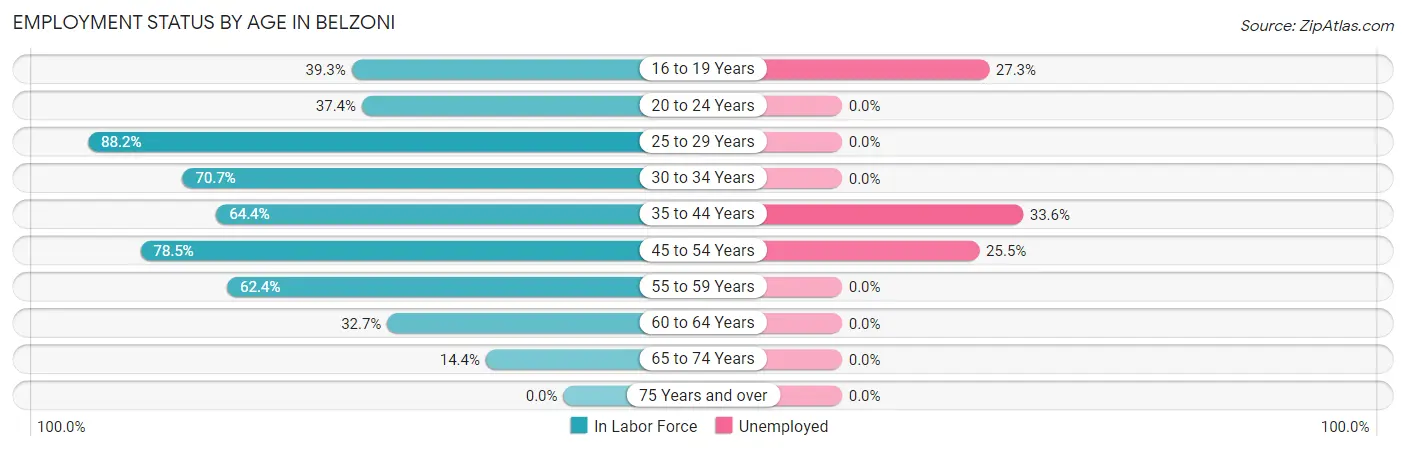
| Age Bracket | In Labor Force | Unemployed |
| 16 to 19 Years | 22 (39.3%) | 6 (27.3%) |
| 20 to 24 Years | 49 (37.4%) | 0 (0.0%) |
| 25 to 29 Years | 90 (88.2%) | 0 (0.0%) |
| 30 to 34 Years | 41 (70.7%) | 0 (0.0%) |
| 35 to 44 Years | 125 (64.4%) | 42 (33.6%) |
| 45 to 54 Years | 153 (78.5%) | 39 (25.5%) |
| 55 to 59 Years | 88 (62.4%) | 0 (0.0%) |
| 60 to 64 Years | 48 (32.7%) | 0 (0.0%) |
| 65 to 74 Years | 33 (14.4%) | 0 (0.0%) |
| 75 Years and over | 0 (0.0%) | 0 (0.0%) |
| Total | 649 (48.5%) | 87 (13.4%) |
Employment Status by Educational Attainment in Belzoni
According to labor force statistics for Belzoni, 65.1% of individuals (545) out of the total population between 25 and 64 years of age (837) are in the labor force, with 14.9% or 81 of them being unemployed. The group with the highest labor force participation rate are those with the educational attainment of bachelor's degree or higher, with 80.7% or 155 individuals in the labor force. Within the labor force, individuals with less than high school education have the highest percentage of unemployment, with 24.2% or 24 of them being unemployed.
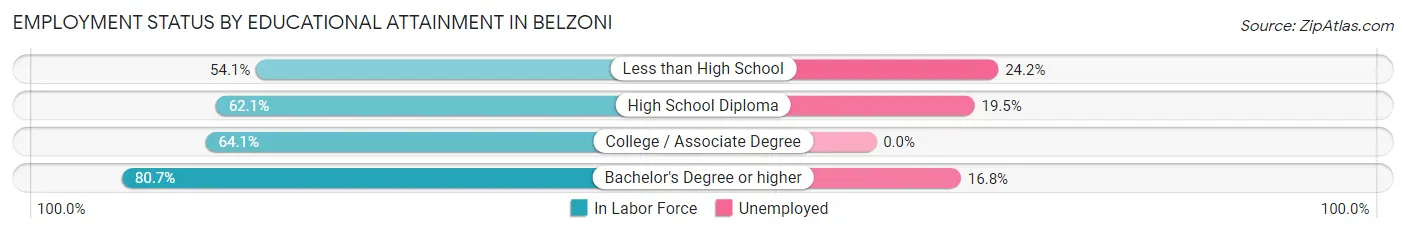
| Educational Attainment | In Labor Force | Unemployed |
| Less than High School | 99 (54.1%) | 44 (24.2%) |
| High School Diploma | 159 (62.1%) | 50 (19.5%) |
| College / Associate Degree | 132 (64.1%) | 0 (0.0%) |
| Bachelor's Degree or higher | 155 (80.7%) | 32 (16.8%) |
| Total | 545 (65.1%) | 125 (14.9%) |
Employment Occupations by Sex in Belzoni
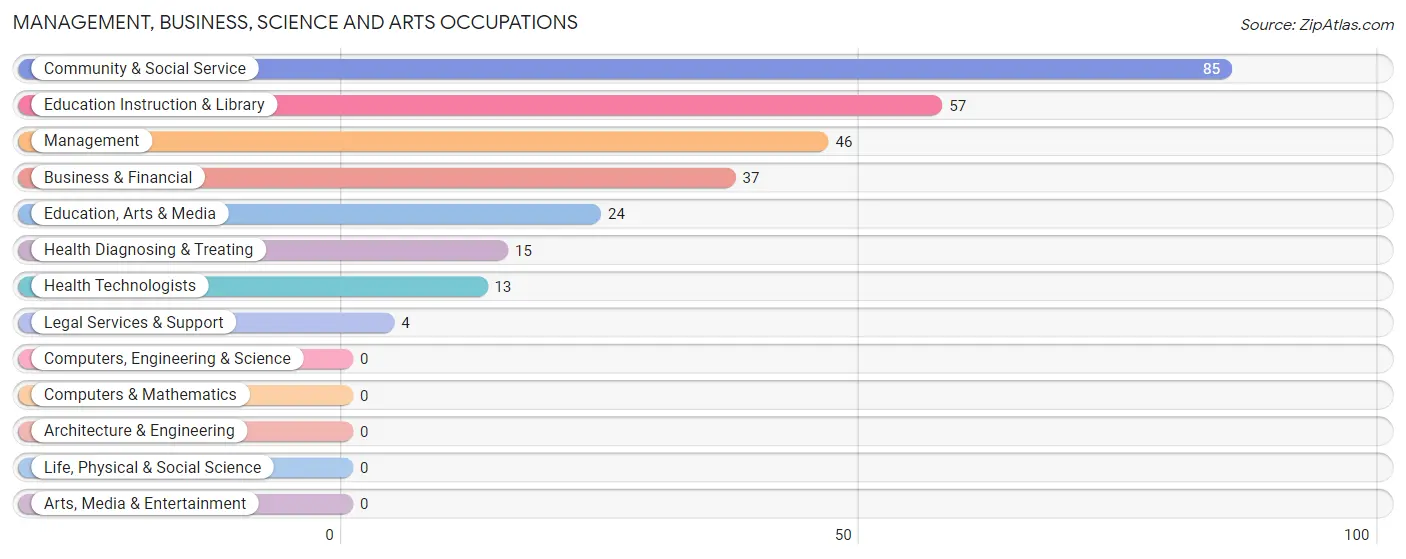
Management, Business, Science and Arts Occupations
The most common Management, Business, Science and Arts occupations in Belzoni are Community & Social Service (85 | 15.1%), Education Instruction & Library (57 | 10.1%), Management (46 | 8.2%), Business & Financial (37 | 6.6%), and Education, Arts & Media (24 | 4.3%).
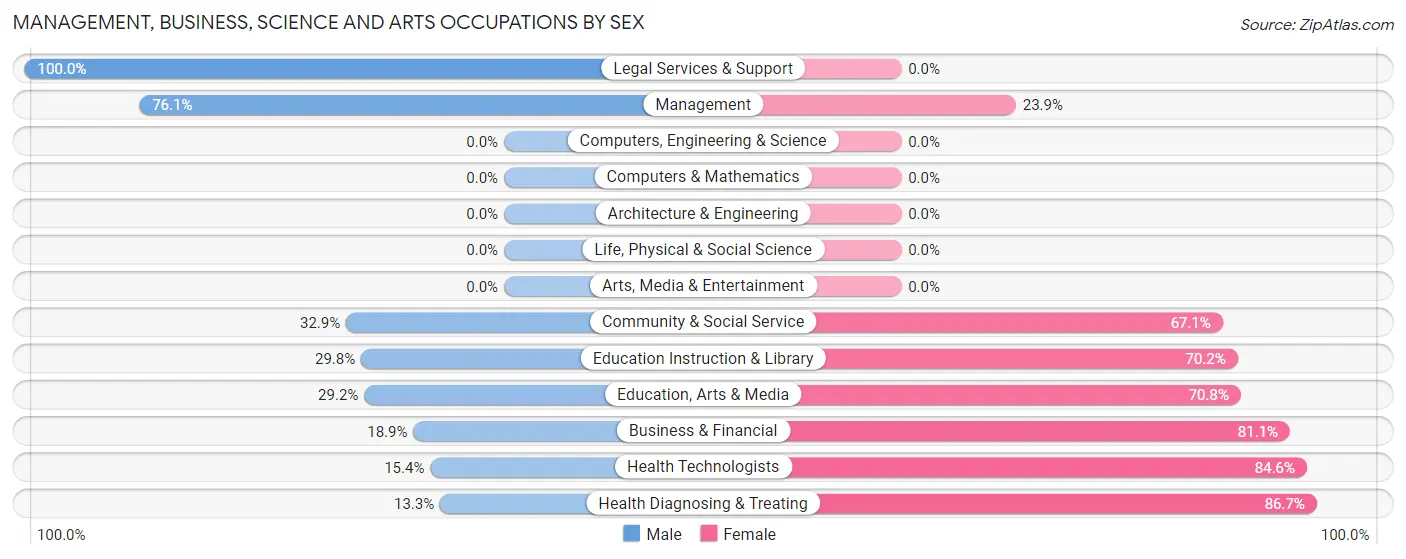
Management, Business, Science and Arts Occupations by Sex
Within the Management, Business, Science and Arts occupations in Belzoni, the most male-oriented occupations are Legal Services & Support (100.0%), Management (76.1%), and Community & Social Service (32.9%), while the most female-oriented occupations are Health Diagnosing & Treating (86.7%), Health Technologists (84.6%), and Business & Financial (81.1%).
| Occupation | Male | Female |
| Management | 35 (76.1%) | 11 (23.9%) |
| Business & Financial | 7 (18.9%) | 30 (81.1%) |
| Computers, Engineering & Science | 0 (0.0%) | 0 (0.0%) |
| Computers & Mathematics | 0 (0.0%) | 0 (0.0%) |
| Architecture & Engineering | 0 (0.0%) | 0 (0.0%) |
| Life, Physical & Social Science | 0 (0.0%) | 0 (0.0%) |
| Community & Social Service | 28 (32.9%) | 57 (67.1%) |
| Education, Arts & Media | 7 (29.2%) | 17 (70.8%) |
| Legal Services & Support | 4 (100.0%) | 0 (0.0%) |
| Education Instruction & Library | 17 (29.8%) | 40 (70.2%) |
| Arts, Media & Entertainment | 0 (0.0%) | 0 (0.0%) |
| Health Diagnosing & Treating | 2 (13.3%) | 13 (86.7%) |
| Health Technologists | 2 (15.4%) | 11 (84.6%) |
| Total (Category) | 72 (39.3%) | 111 (60.7%) |
| Total (Overall) | 333 (59.3%) | 229 (40.7%) |
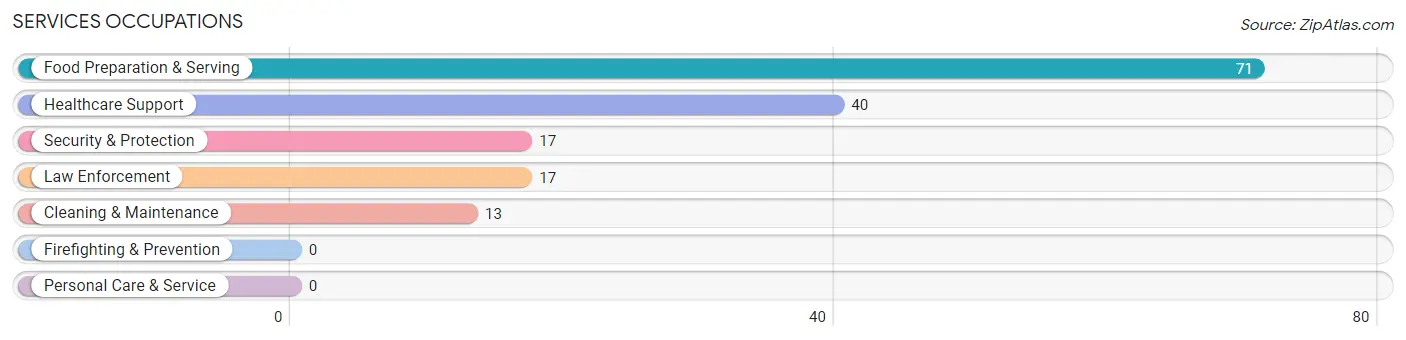
Services Occupations
The most common Services occupations in Belzoni are Food Preparation & Serving (71 | 12.6%), Healthcare Support (40 | 7.1%), Security & Protection (17 | 3.0%), Law Enforcement (17 | 3.0%), and Cleaning & Maintenance (13 | 2.3%).
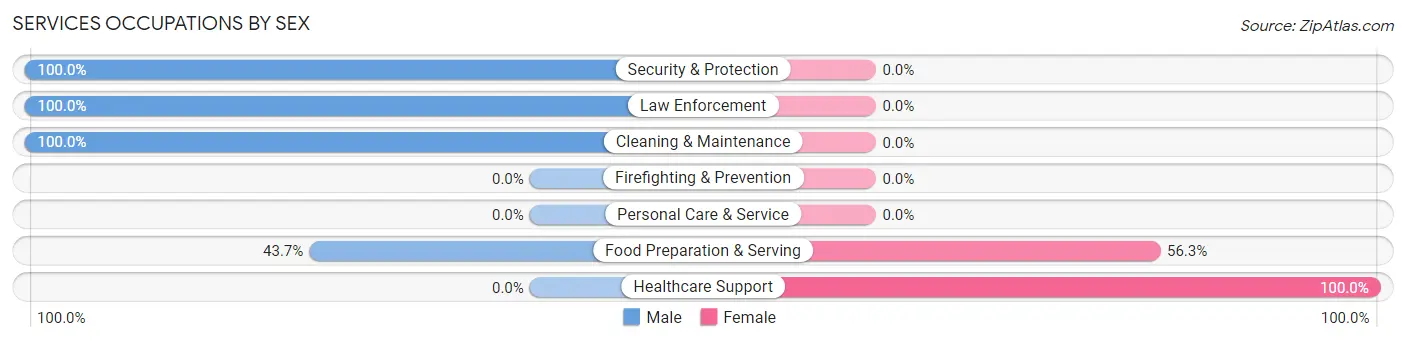
Services Occupations by Sex
Within the Services occupations in Belzoni, the most male-oriented occupations are Security & Protection (100.0%), Law Enforcement (100.0%), and Cleaning & Maintenance (100.0%), while the most female-oriented occupations are Healthcare Support (100.0%), and Food Preparation & Serving (56.3%).
| Occupation | Male | Female |
| Healthcare Support | 0 (0.0%) | 40 (100.0%) |
| Security & Protection | 17 (100.0%) | 0 (0.0%) |
| Firefighting & Prevention | 0 (0.0%) | 0 (0.0%) |
| Law Enforcement | 17 (100.0%) | 0 (0.0%) |
| Food Preparation & Serving | 31 (43.7%) | 40 (56.3%) |
| Cleaning & Maintenance | 13 (100.0%) | 0 (0.0%) |
| Personal Care & Service | 0 (0.0%) | 0 (0.0%) |
| Total (Category) | 61 (43.3%) | 80 (56.7%) |
| Total (Overall) | 333 (59.3%) | 229 (40.7%) |
Sales and Office Occupations
The most common Sales and Office occupations in Belzoni are Sales & Related (46 | 8.2%), and Office & Administration (13 | 2.3%).
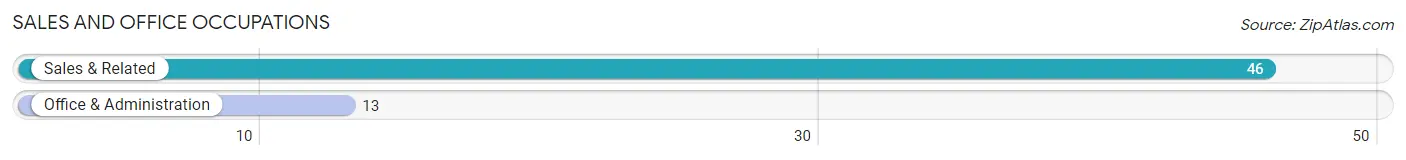
Sales and Office Occupations by Sex
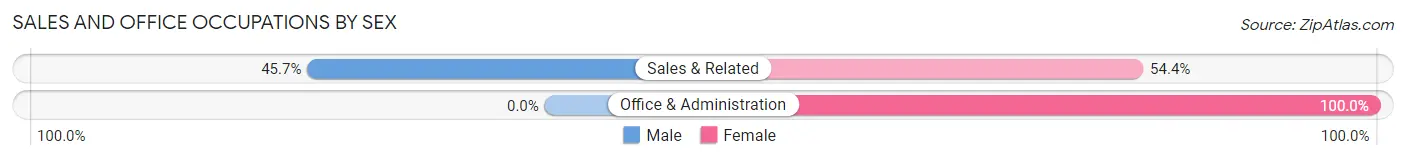
| Occupation | Male | Female |
| Sales & Related | 21 (45.7%) | 25 (54.3%) |
| Office & Administration | 0 (0.0%) | 13 (100.0%) |
| Total (Category) | 21 (35.6%) | 38 (64.4%) |
| Total (Overall) | 333 (59.3%) | 229 (40.7%) |
Natural Resources, Construction and Maintenance Occupations
The most common Natural Resources, Construction and Maintenance occupations in Belzoni are Construction & Extraction (89 | 15.8%), Installation, Maintenance & Repair (56 | 10.0%), and Farming, Fishing & Forestry (1 | 0.2%).
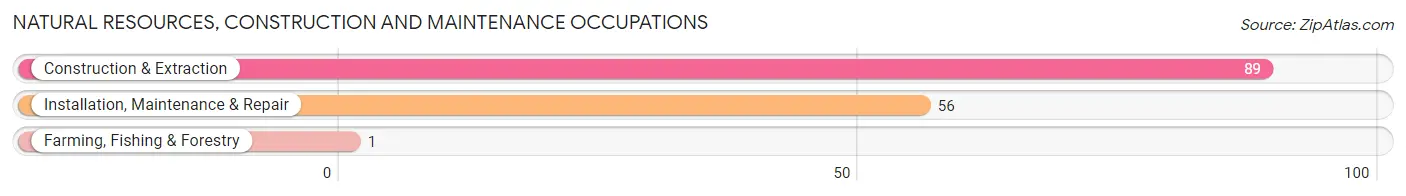
Natural Resources, Construction and Maintenance Occupations by Sex
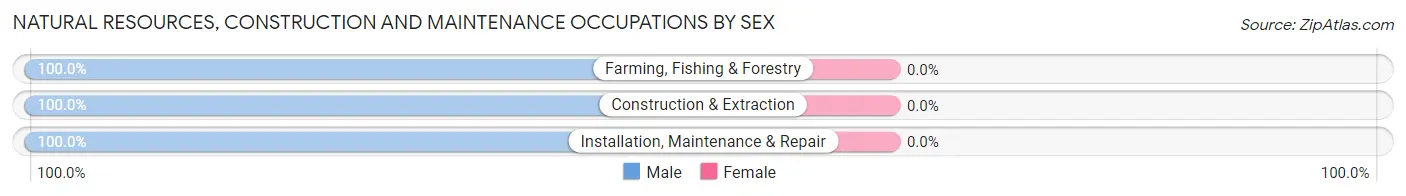
| Occupation | Male | Female |
| Farming, Fishing & Forestry | 1 (100.0%) | 0 (0.0%) |
| Construction & Extraction | 89 (100.0%) | 0 (0.0%) |
| Installation, Maintenance & Repair | 56 (100.0%) | 0 (0.0%) |
| Total (Category) | 146 (100.0%) | 0 (0.0%) |
| Total (Overall) | 333 (59.3%) | 229 (40.7%) |
Production, Transportation and Moving Occupations
The most common Production, Transportation and Moving occupations in Belzoni are Production (13 | 2.3%), Transportation (12 | 2.1%), and Material Moving (8 | 1.4%).
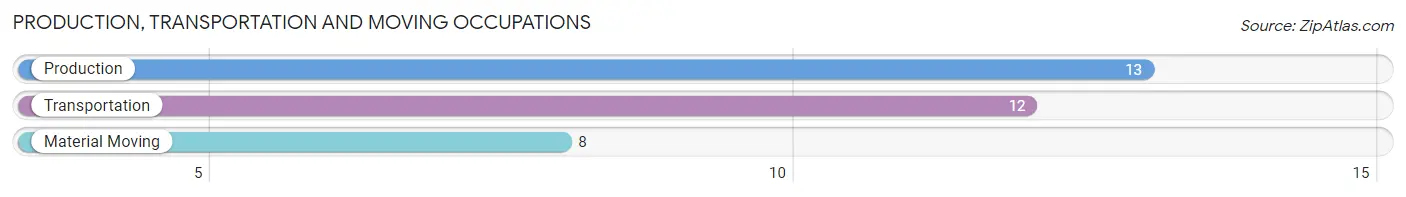
Production, Transportation and Moving Occupations by Sex
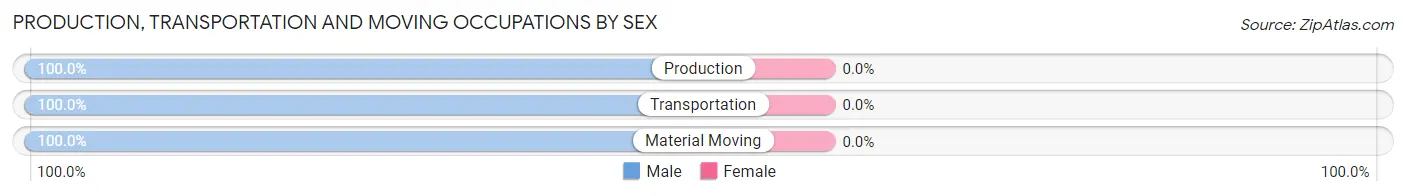
| Occupation | Male | Female |
| Production | 13 (100.0%) | 0 (0.0%) |
| Transportation | 12 (100.0%) | 0 (0.0%) |
| Material Moving | 8 (100.0%) | 0 (0.0%) |
| Total (Category) | 33 (100.0%) | 0 (0.0%) |
| Total (Overall) | 333 (59.3%) | 229 (40.7%) |
Employment Industries by Sex in Belzoni
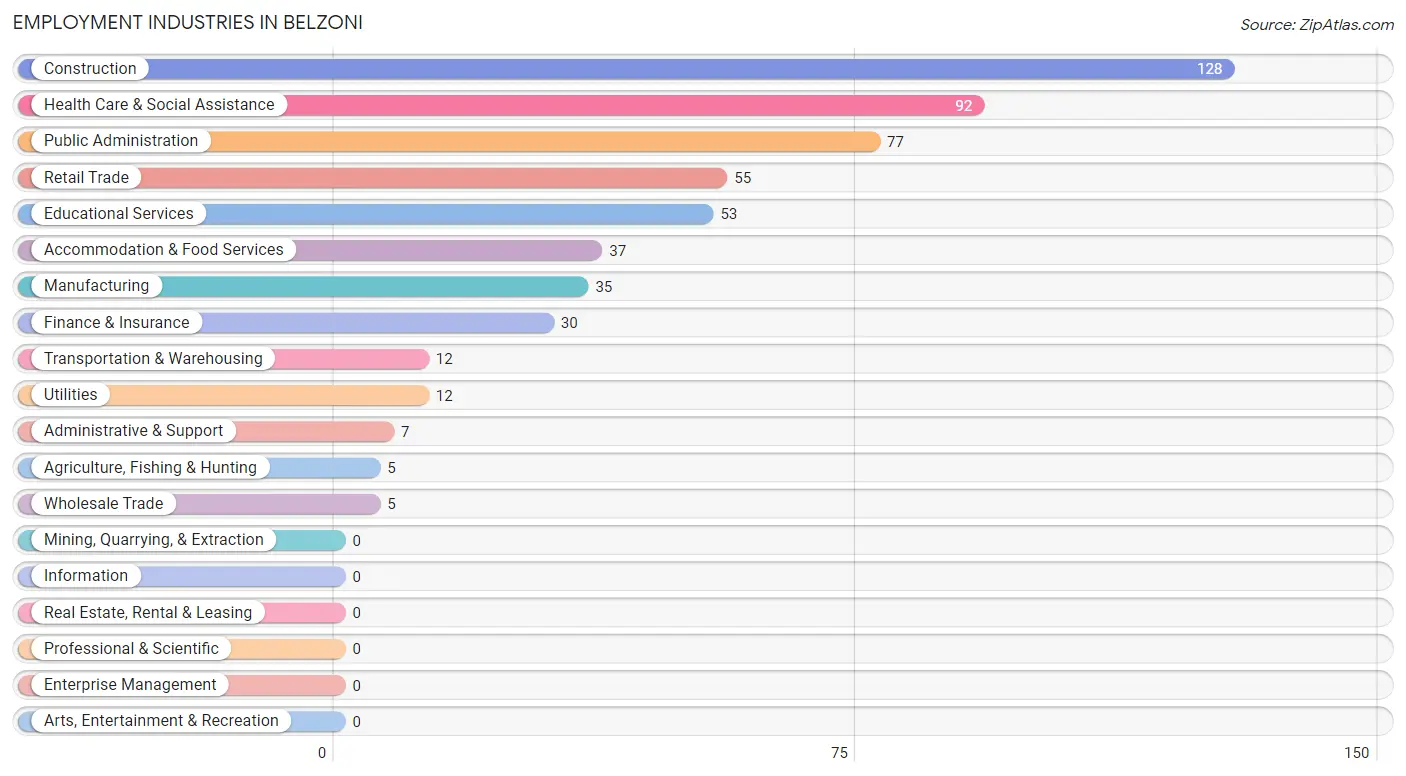
Employment Industries in Belzoni
The major employment industries in Belzoni include Construction (128 | 22.8%), Health Care & Social Assistance (92 | 16.4%), Public Administration (77 | 13.7%), Retail Trade (55 | 9.8%), and Educational Services (53 | 9.4%).
Employment Industries by Sex in Belzoni
The Belzoni industries that see more men than women are Construction (100.0%), Wholesale Trade (100.0%), and Transportation & Warehousing (100.0%), whereas the industries that tend to have a higher number of women are Health Care & Social Assistance (97.8%), Educational Services (94.3%), and Agriculture, Fishing & Hunting (80.0%).
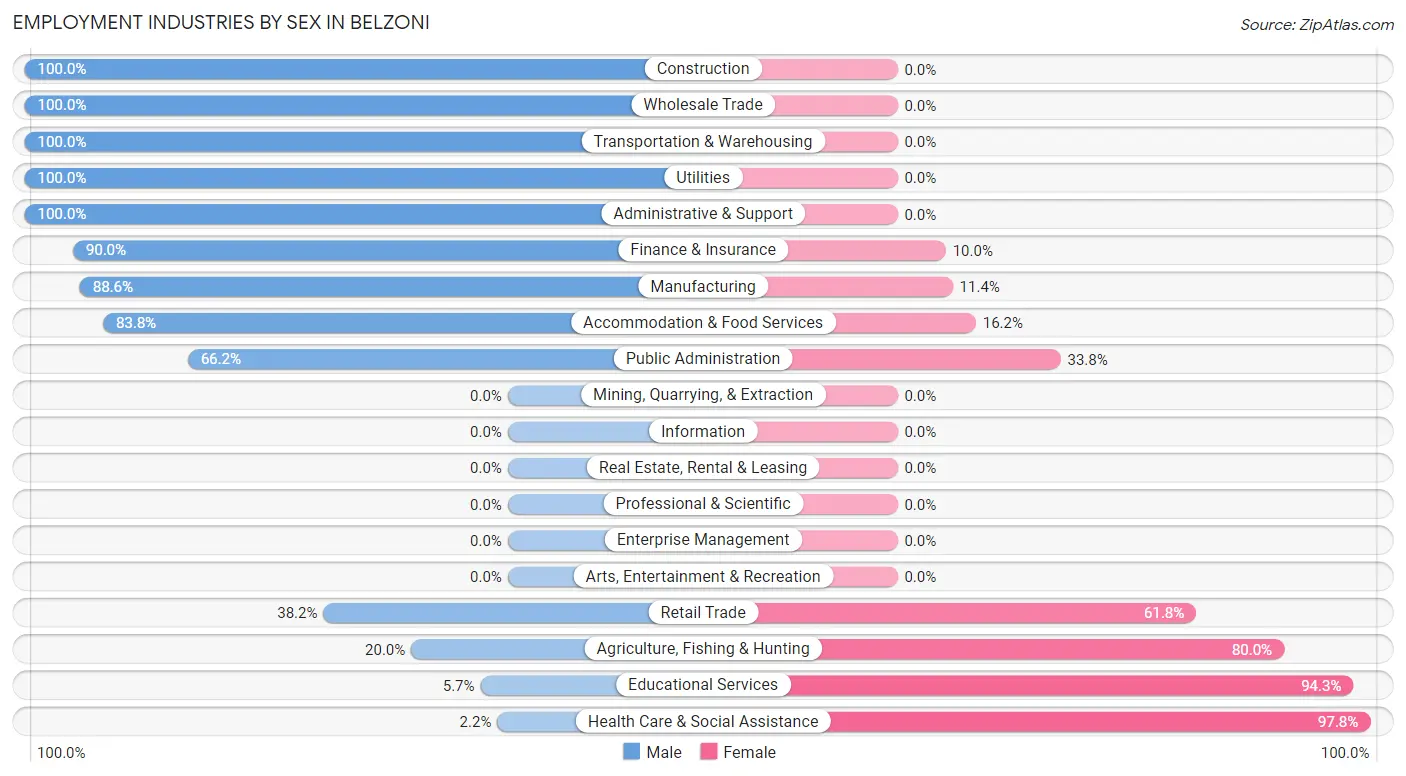
| Industry | Male | Female |
| Agriculture, Fishing & Hunting | 1 (20.0%) | 4 (80.0%) |
| Mining, Quarrying, & Extraction | 0 (0.0%) | 0 (0.0%) |
| Construction | 128 (100.0%) | 0 (0.0%) |
| Manufacturing | 31 (88.6%) | 4 (11.4%) |
| Wholesale Trade | 5 (100.0%) | 0 (0.0%) |
| Retail Trade | 21 (38.2%) | 34 (61.8%) |
| Transportation & Warehousing | 12 (100.0%) | 0 (0.0%) |
| Utilities | 12 (100.0%) | 0 (0.0%) |
| Information | 0 (0.0%) | 0 (0.0%) |
| Finance & Insurance | 27 (90.0%) | 3 (10.0%) |
| Real Estate, Rental & Leasing | 0 (0.0%) | 0 (0.0%) |
| Professional & Scientific | 0 (0.0%) | 0 (0.0%) |
| Enterprise Management | 0 (0.0%) | 0 (0.0%) |
| Administrative & Support | 7 (100.0%) | 0 (0.0%) |
| Educational Services | 3 (5.7%) | 50 (94.3%) |
| Health Care & Social Assistance | 2 (2.2%) | 90 (97.8%) |
| Arts, Entertainment & Recreation | 0 (0.0%) | 0 (0.0%) |
| Accommodation & Food Services | 31 (83.8%) | 6 (16.2%) |
| Public Administration | 51 (66.2%) | 26 (33.8%) |
| Total | 333 (59.3%) | 229 (40.7%) |
Education in Belzoni
School Enrollment in Belzoni
The most common levels of schooling among the 618 students in Belzoni are elementary school (259 | 41.9%), middle school (144 | 23.3%), and college / undergraduate (72 | 11.7%).
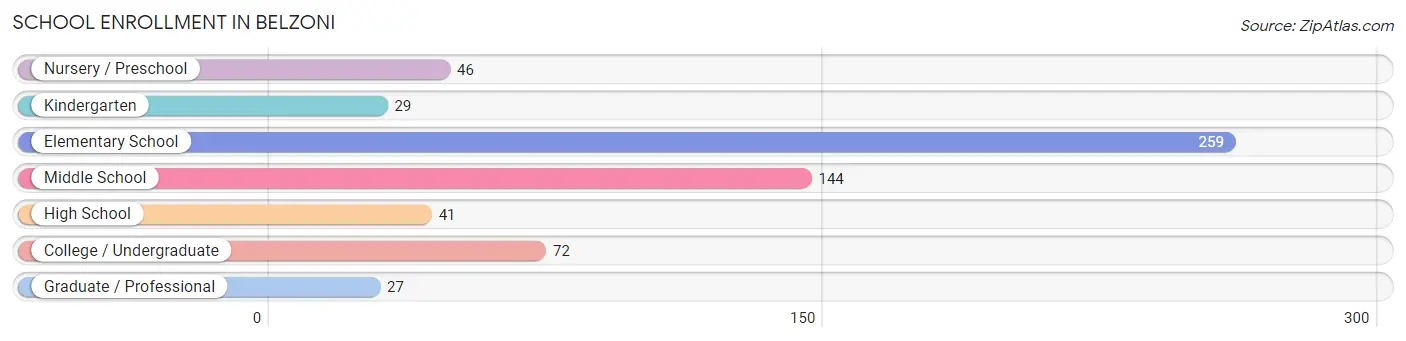
| School Level | # Students | % Students |
| Nursery / Preschool | 46 | 7.4% |
| Kindergarten | 29 | 4.7% |
| Elementary School | 259 | 41.9% |
| Middle School | 144 | 23.3% |
| High School | 41 | 6.6% |
| College / Undergraduate | 72 | 11.7% |
| Graduate / Professional | 27 | 4.4% |
| Total | 618 | 100.0% |
School Enrollment by Age by Funding Source in Belzoni
Out of a total of 618 students who are enrolled in schools in Belzoni, 60 (9.7%) attend a private institution, while the remaining 558 (90.3%) are enrolled in public schools. The age group of 15 to 17 year olds has the highest likelihood of being enrolled in private schools, with 25 (61.0% in the age bracket) enrolled. Conversely, the age group of 3 to 4 year olds has the lowest likelihood of being enrolled in a private school, with 62 (100.0% in the age bracket) attending a public institution.
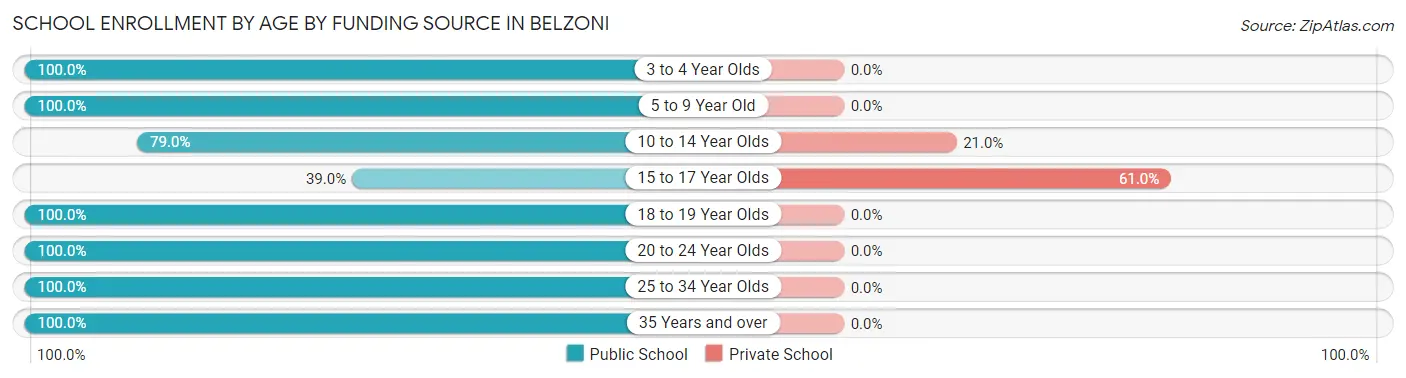
| Age Bracket | Public School | Private School |
| 3 to 4 Year Olds | 62 (100.0%) | 0 (0.0%) |
| 5 to 9 Year Old | 249 (100.0%) | 0 (0.0%) |
| 10 to 14 Year Olds | 132 (79.0%) | 35 (21.0%) |
| 15 to 17 Year Olds | 16 (39.0%) | 25 (61.0%) |
| 18 to 19 Year Olds | 21 (100.0%) | 0 (0.0%) |
| 20 to 24 Year Olds | 8 (100.0%) | 0 (0.0%) |
| 25 to 34 Year Olds | 11 (100.0%) | 0 (0.0%) |
| 35 Years and over | 59 (100.0%) | 0 (0.0%) |
| Total | 558 (90.3%) | 60 (9.7%) |
Educational Attainment by Field of Study in Belzoni
Education (64 | 21.8%), computers & mathematics (45 | 15.4%), bio, nature & agricultural (42 | 14.3%), business (41 | 14.0%), and arts & humanities (29 | 9.9%) are the most common fields of study among 293 individuals in Belzoni who have obtained a bachelor's degree or higher.
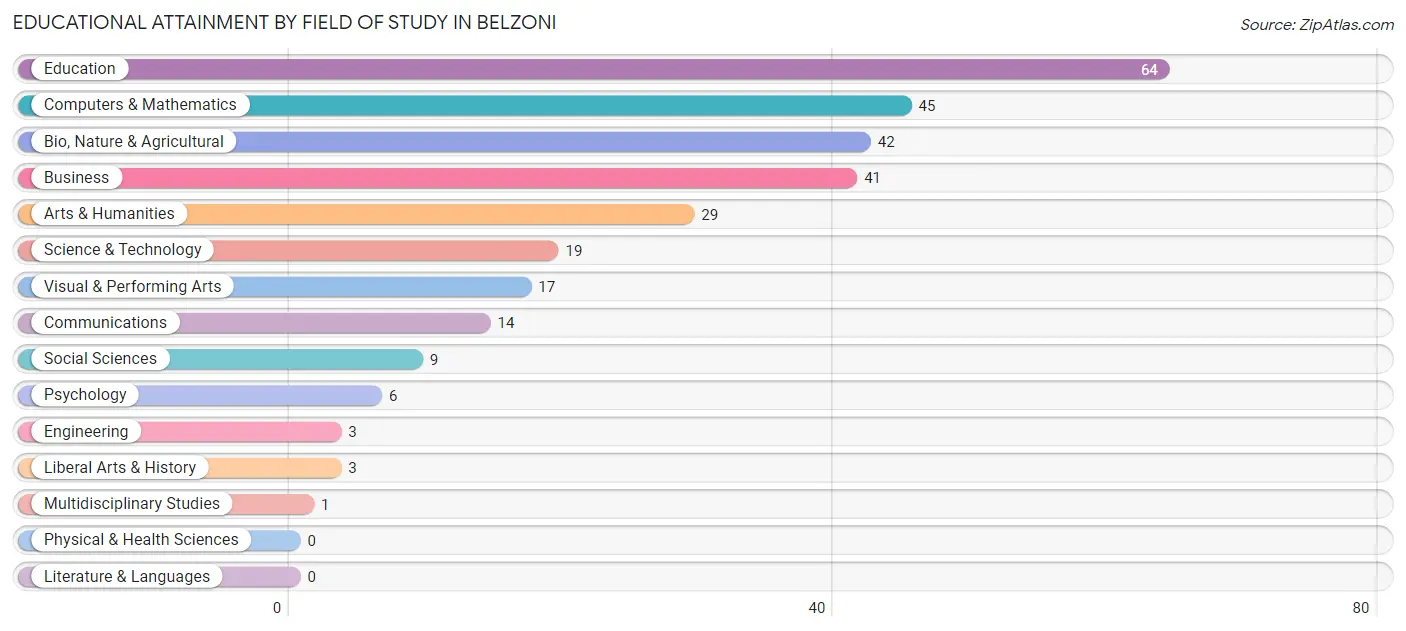
| Field of Study | # Graduates | % Graduates |
| Computers & Mathematics | 45 | 15.4% |
| Bio, Nature & Agricultural | 42 | 14.3% |
| Physical & Health Sciences | 0 | 0.0% |
| Psychology | 6 | 2.1% |
| Social Sciences | 9 | 3.1% |
| Engineering | 3 | 1.0% |
| Multidisciplinary Studies | 1 | 0.3% |
| Science & Technology | 19 | 6.5% |
| Business | 41 | 14.0% |
| Education | 64 | 21.8% |
| Literature & Languages | 0 | 0.0% |
| Liberal Arts & History | 3 | 1.0% |
| Visual & Performing Arts | 17 | 5.8% |
| Communications | 14 | 4.8% |
| Arts & Humanities | 29 | 9.9% |
| Total | 293 | 100.0% |
Transportation & Commute in Belzoni
Vehicle Availability by Sex in Belzoni
The most prevalent vehicle ownership categories in Belzoni are males with 1 vehicle (148, accounting for 44.4%) and females with 1 vehicle (121, making up 64.6%).
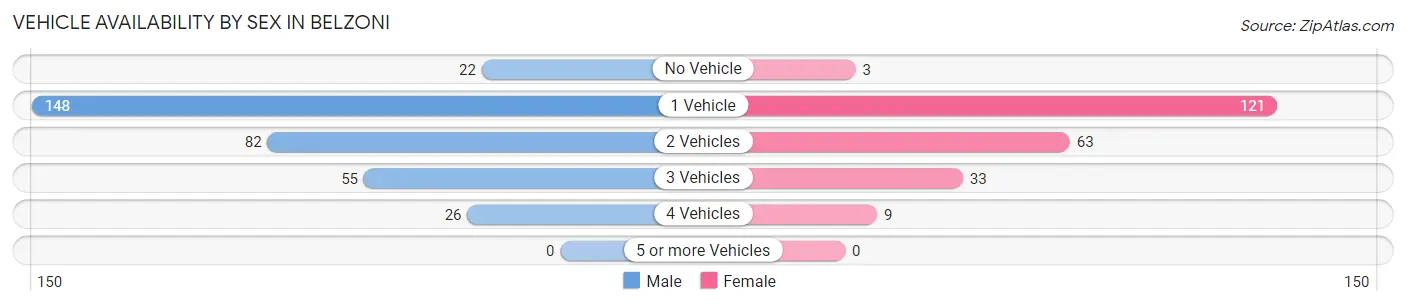
| Vehicles Available | Male | Female |
| No Vehicle | 22 (6.6%) | 3 (1.3%) |
| 1 Vehicle | 148 (44.4%) | 121 (52.8%) |
| 2 Vehicles | 82 (24.6%) | 63 (27.5%) |
| 3 Vehicles | 55 (16.5%) | 33 (14.4%) |
| 4 Vehicles | 26 (7.8%) | 9 (3.9%) |
| 5 or more Vehicles | 0 (0.0%) | 0 (0.0%) |
| Total | 333 (100.0%) | 229 (100.0%) |
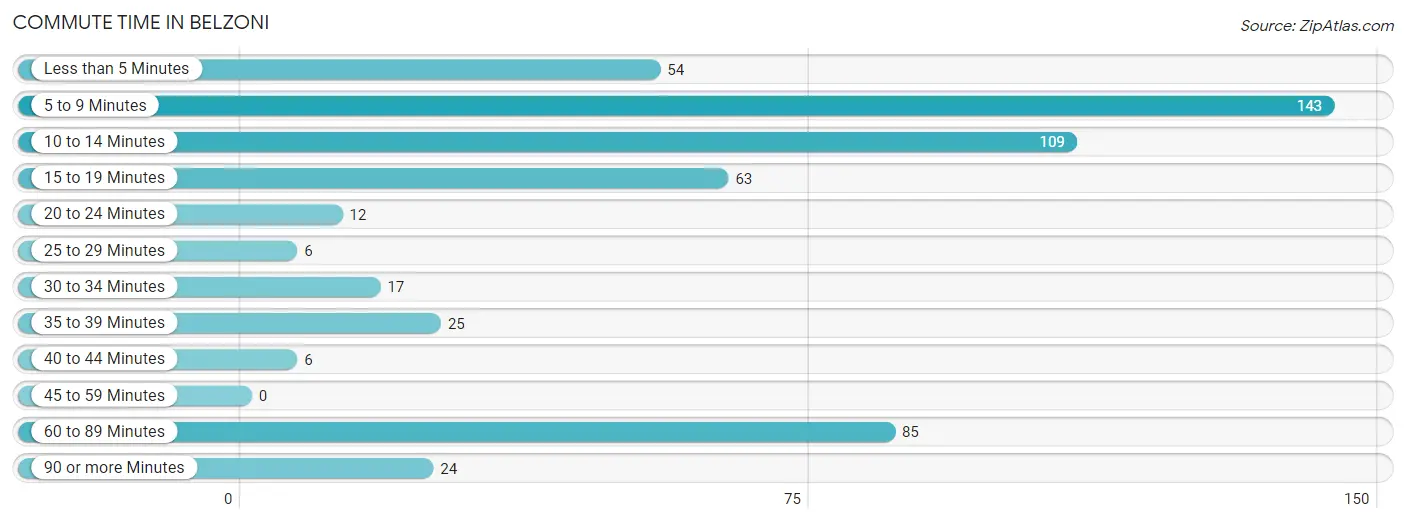
Commute Time in Belzoni
The most frequently occuring commute durations in Belzoni are 5 to 9 minutes (143 commuters, 26.3%), 10 to 14 minutes (109 commuters, 20.0%), and 60 to 89 minutes (85 commuters, 15.6%).
| Commute Time | # Commuters | % Commuters |
| Less than 5 Minutes | 54 | 9.9% |
| 5 to 9 Minutes | 143 | 26.3% |
| 10 to 14 Minutes | 109 | 20.0% |
| 15 to 19 Minutes | 63 | 11.6% |
| 20 to 24 Minutes | 12 | 2.2% |
| 25 to 29 Minutes | 6 | 1.1% |
| 30 to 34 Minutes | 17 | 3.1% |
| 35 to 39 Minutes | 25 | 4.6% |
| 40 to 44 Minutes | 6 | 1.1% |
| 45 to 59 Minutes | 0 | 0.0% |
| 60 to 89 Minutes | 85 | 15.6% |
| 90 or more Minutes | 24 | 4.4% |
Commute Time by Sex in Belzoni
The most common commute times in Belzoni are 10 to 14 minutes (96 commuters, 30.5%) for males and 5 to 9 minutes (64 commuters, 28.0%) for females.
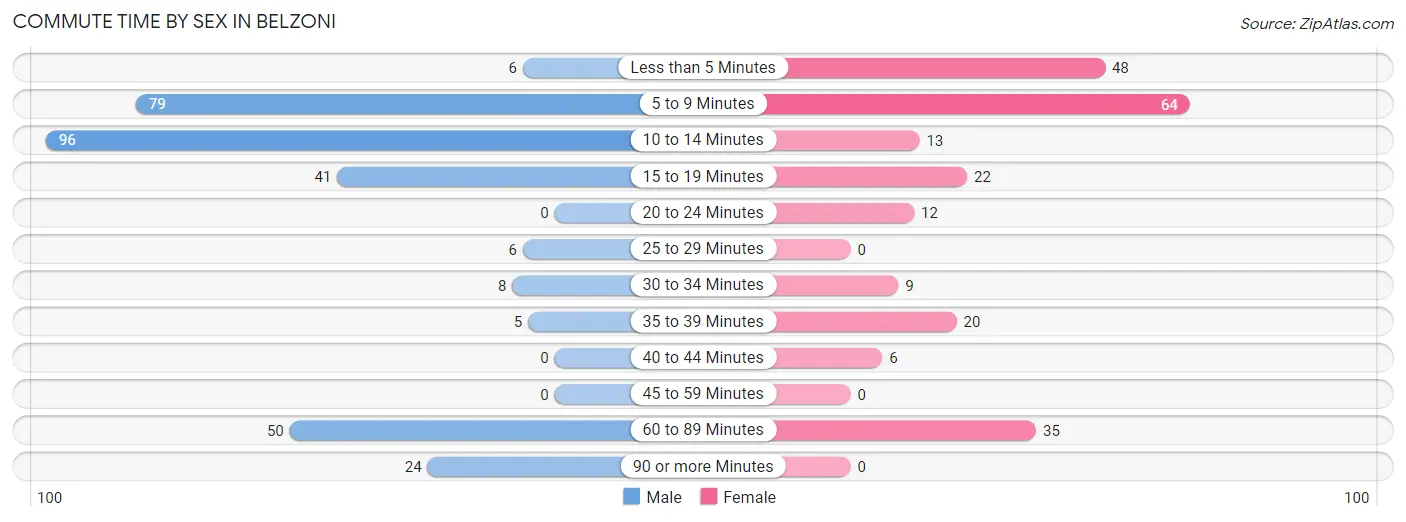
| Commute Time | Male | Female |
| Less than 5 Minutes | 6 (1.9%) | 48 (21.0%) |
| 5 to 9 Minutes | 79 (25.1%) | 64 (28.0%) |
| 10 to 14 Minutes | 96 (30.5%) | 13 (5.7%) |
| 15 to 19 Minutes | 41 (13.0%) | 22 (9.6%) |
| 20 to 24 Minutes | 0 (0.0%) | 12 (5.2%) |
| 25 to 29 Minutes | 6 (1.9%) | 0 (0.0%) |
| 30 to 34 Minutes | 8 (2.5%) | 9 (3.9%) |
| 35 to 39 Minutes | 5 (1.6%) | 20 (8.7%) |
| 40 to 44 Minutes | 0 (0.0%) | 6 (2.6%) |
| 45 to 59 Minutes | 0 (0.0%) | 0 (0.0%) |
| 60 to 89 Minutes | 50 (15.9%) | 35 (15.3%) |
| 90 or more Minutes | 24 (7.6%) | 0 (0.0%) |
Time of Departure to Work by Sex in Belzoni
The most frequent times of departure to work in Belzoni are 4:00 PM to 11:59 PM (71, 22.5%) for males and 8:00 AM to 8:29 AM (49, 21.4%) for females.
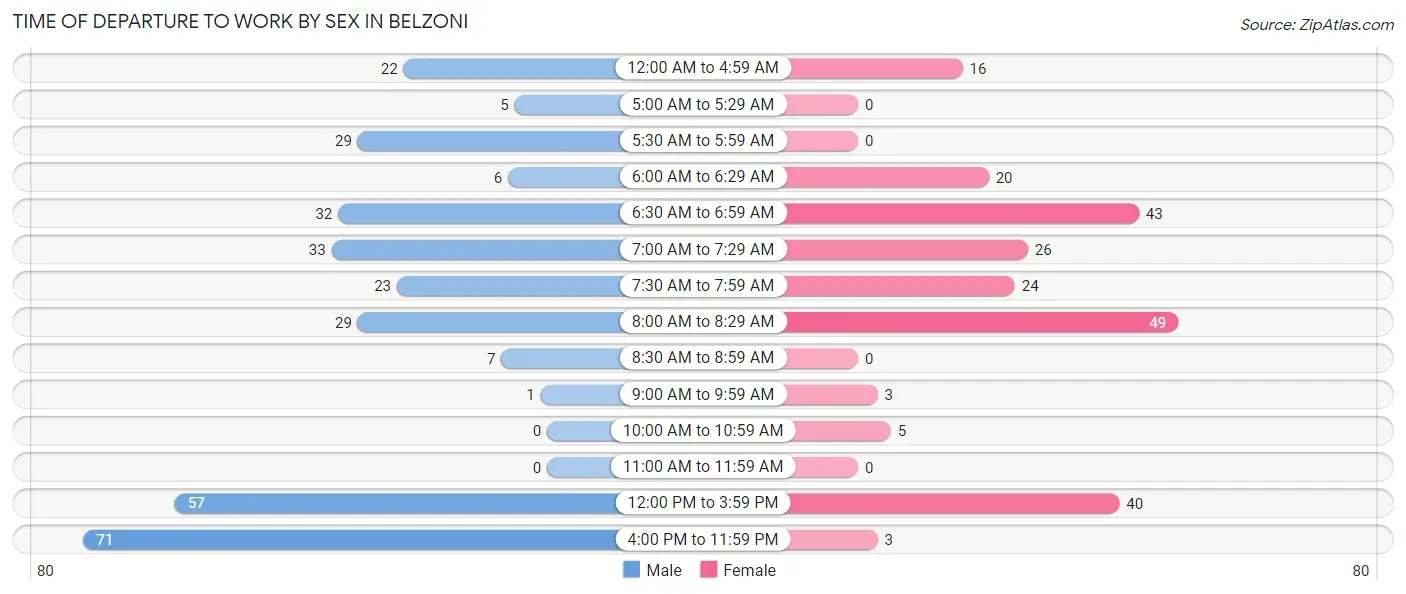
| Time of Departure | Male | Female |
| 12:00 AM to 4:59 AM | 22 (7.0%) | 16 (7.0%) |
| 5:00 AM to 5:29 AM | 5 (1.6%) | 0 (0.0%) |
| 5:30 AM to 5:59 AM | 29 (9.2%) | 0 (0.0%) |
| 6:00 AM to 6:29 AM | 6 (1.9%) | 20 (8.7%) |
| 6:30 AM to 6:59 AM | 32 (10.2%) | 43 (18.8%) |
| 7:00 AM to 7:29 AM | 33 (10.5%) | 26 (11.4%) |
| 7:30 AM to 7:59 AM | 23 (7.3%) | 24 (10.5%) |
| 8:00 AM to 8:29 AM | 29 (9.2%) | 49 (21.4%) |
| 8:30 AM to 8:59 AM | 7 (2.2%) | 0 (0.0%) |
| 9:00 AM to 9:59 AM | 1 (0.3%) | 3 (1.3%) |
| 10:00 AM to 10:59 AM | 0 (0.0%) | 5 (2.2%) |
| 11:00 AM to 11:59 AM | 0 (0.0%) | 0 (0.0%) |
| 12:00 PM to 3:59 PM | 57 (18.1%) | 40 (17.5%) |
| 4:00 PM to 11:59 PM | 71 (22.5%) | 3 (1.3%) |
| Total | 315 (100.0%) | 229 (100.0%) |
Housing Occupancy in Belzoni
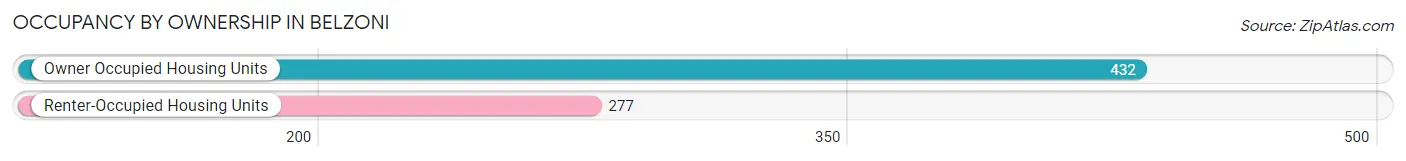
Occupancy by Ownership in Belzoni
Of the total 709 dwellings in Belzoni, owner-occupied units account for 432 (60.9%), while renter-occupied units make up 277 (39.1%).
| Occupancy | # Housing Units | % Housing Units |
| Owner Occupied Housing Units | 432 | 60.9% |
| Renter-Occupied Housing Units | 277 | 39.1% |
| Total Occupied Housing Units | 709 | 100.0% |
Occupancy by Household Size in Belzoni
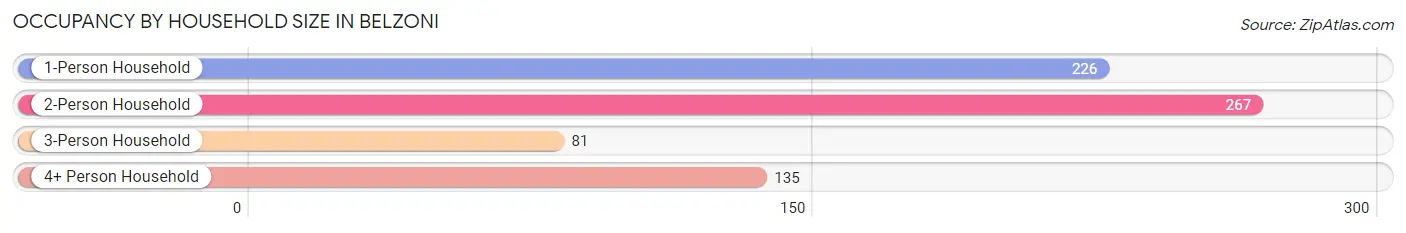
| Household Size | # Housing Units | % Housing Units |
| 1-Person Household | 226 | 31.9% |
| 2-Person Household | 267 | 37.7% |
| 3-Person Household | 81 | 11.4% |
| 4+ Person Household | 135 | 19.0% |
| Total Housing Units | 709 | 100.0% |
Occupancy by Ownership by Household Size in Belzoni
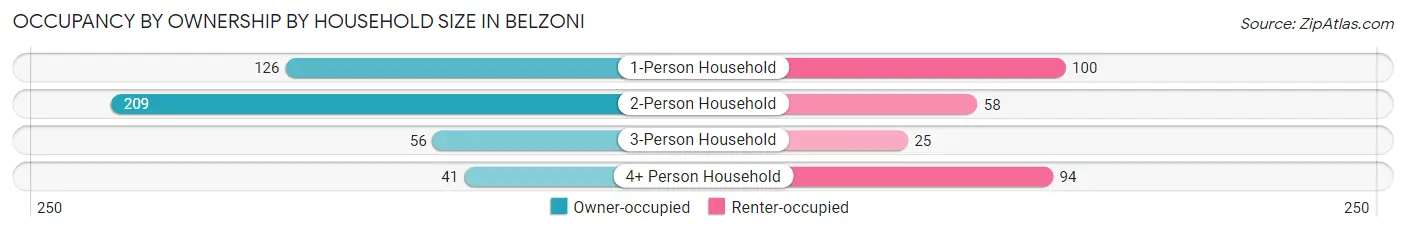
| Household Size | Owner-occupied | Renter-occupied |
| 1-Person Household | 126 (55.7%) | 100 (44.3%) |
| 2-Person Household | 209 (78.3%) | 58 (21.7%) |
| 3-Person Household | 56 (69.1%) | 25 (30.9%) |
| 4+ Person Household | 41 (30.4%) | 94 (69.6%) |
| Total Housing Units | 432 (60.9%) | 277 (39.1%) |
Occupancy by Educational Attainment in Belzoni
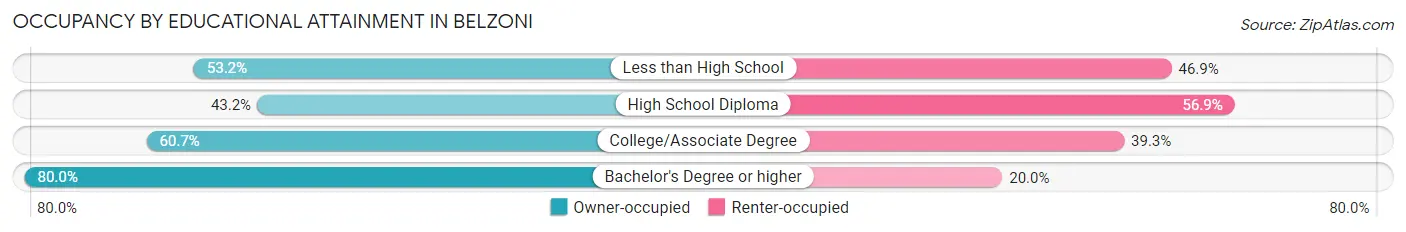
| Household Size | Owner-occupied | Renter-occupied |
| Less than High School | 59 (53.1%) | 52 (46.9%) |
| High School Diploma | 63 (43.1%) | 83 (56.9%) |
| College/Associate Degree | 162 (60.7%) | 105 (39.3%) |
| Bachelor's Degree or higher | 148 (80.0%) | 37 (20.0%) |
Occupancy by Age of Householder in Belzoni
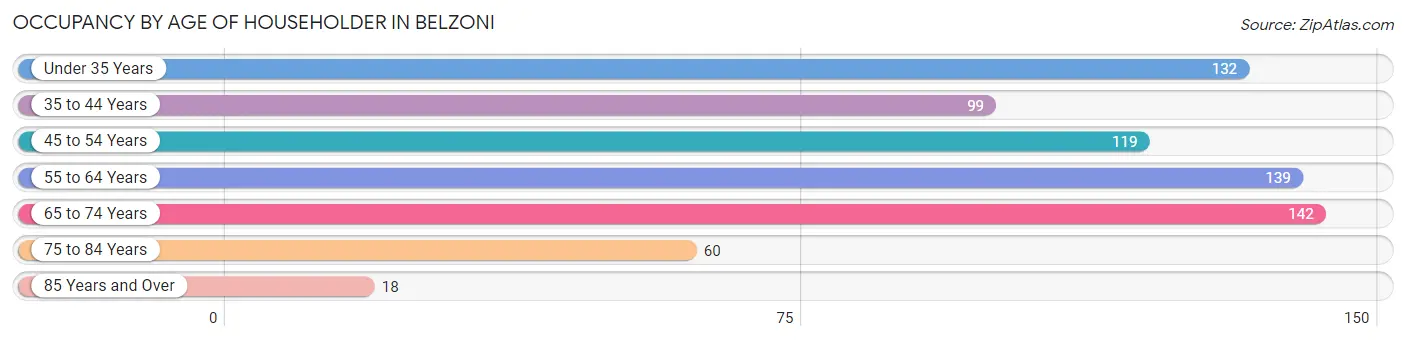
| Age Bracket | # Households | % Households |
| Under 35 Years | 132 | 18.6% |
| 35 to 44 Years | 99 | 14.0% |
| 45 to 54 Years | 119 | 16.8% |
| 55 to 64 Years | 139 | 19.6% |
| 65 to 74 Years | 142 | 20.0% |
| 75 to 84 Years | 60 | 8.5% |
| 85 Years and Over | 18 | 2.5% |
| Total | 709 | 100.0% |
Housing Finances in Belzoni
Median Income by Occupancy in Belzoni
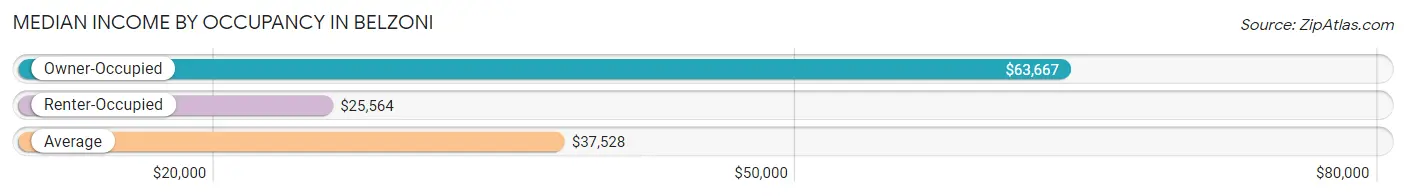
| Occupancy Type | # Households | Median Income |
| Owner-Occupied | 432 (60.9%) | $63,667 |
| Renter-Occupied | 277 (39.1%) | $25,564 |
| Average | 709 (100.0%) | $37,528 |
Occupancy by Householder Income Bracket in Belzoni
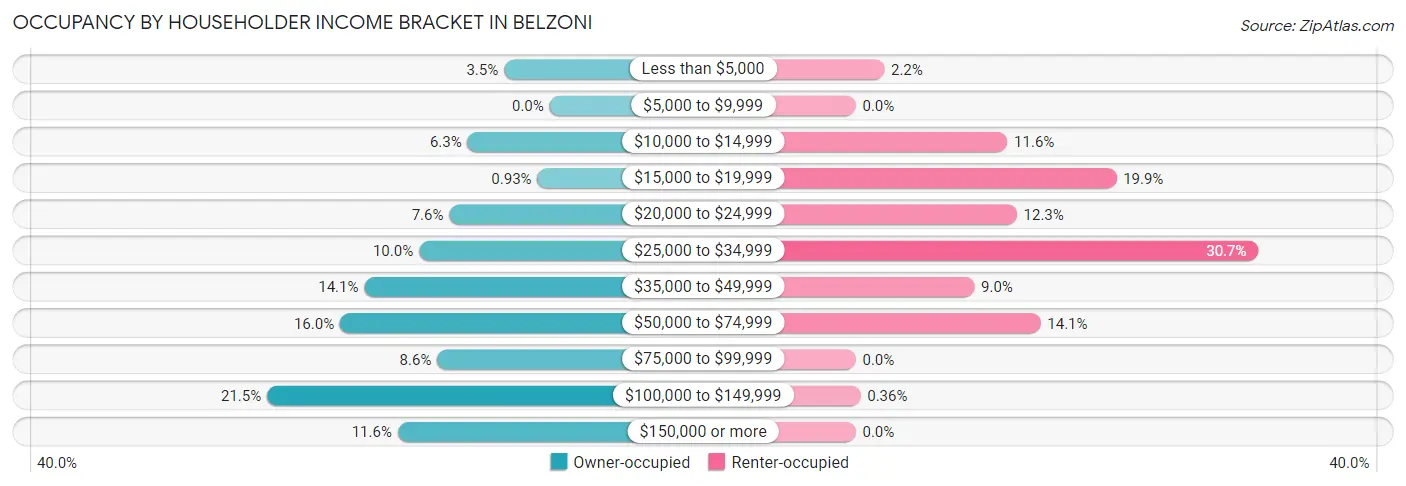
| Income Bracket | Owner-occupied | Renter-occupied |
| Less than $5,000 | 15 (3.5%) | 6 (2.2%) |
| $5,000 to $9,999 | 0 (0.0%) | 0 (0.0%) |
| $10,000 to $14,999 | 27 (6.2%) | 32 (11.6%) |
| $15,000 to $19,999 | 4 (0.9%) | 55 (19.9%) |
| $20,000 to $24,999 | 33 (7.6%) | 34 (12.3%) |
| $25,000 to $34,999 | 43 (10.0%) | 85 (30.7%) |
| $35,000 to $49,999 | 61 (14.1%) | 25 (9.0%) |
| $50,000 to $74,999 | 69 (16.0%) | 39 (14.1%) |
| $75,000 to $99,999 | 37 (8.6%) | 0 (0.0%) |
| $100,000 to $149,999 | 93 (21.5%) | 1 (0.4%) |
| $150,000 or more | 50 (11.6%) | 0 (0.0%) |
| Total | 432 (100.0%) | 277 (100.0%) |
Monthly Housing Cost Tiers in Belzoni
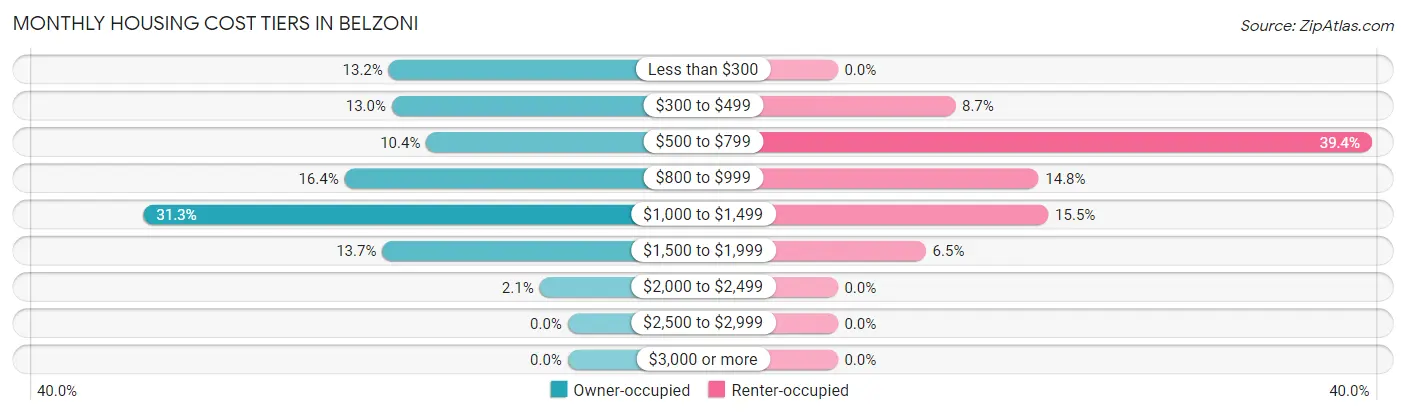
| Monthly Cost | Owner-occupied | Renter-occupied |
| Less than $300 | 57 (13.2%) | 0 (0.0%) |
| $300 to $499 | 56 (13.0%) | 24 (8.7%) |
| $500 to $799 | 45 (10.4%) | 109 (39.4%) |
| $800 to $999 | 71 (16.4%) | 41 (14.8%) |
| $1,000 to $1,499 | 135 (31.2%) | 43 (15.5%) |
| $1,500 to $1,999 | 59 (13.7%) | 18 (6.5%) |
| $2,000 to $2,499 | 9 (2.1%) | 0 (0.0%) |
| $2,500 to $2,999 | 0 (0.0%) | 0 (0.0%) |
| $3,000 or more | 0 (0.0%) | 0 (0.0%) |
| Total | 432 (100.0%) | 277 (100.0%) |
Physical Housing Characteristics in Belzoni
Housing Structures in Belzoni
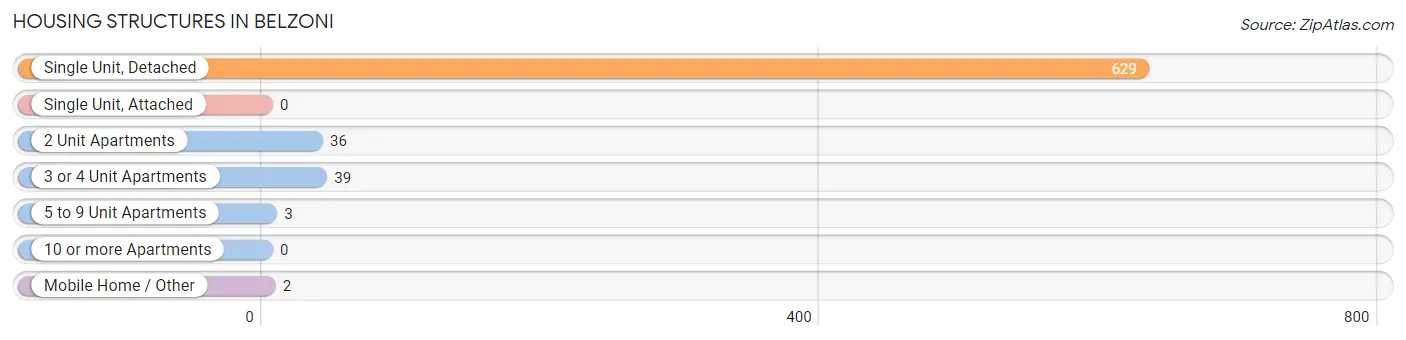
| Structure Type | # Housing Units | % Housing Units |
| Single Unit, Detached | 629 | 88.7% |
| Single Unit, Attached | 0 | 0.0% |
| 2 Unit Apartments | 36 | 5.1% |
| 3 or 4 Unit Apartments | 39 | 5.5% |
| 5 to 9 Unit Apartments | 3 | 0.4% |
| 10 or more Apartments | 0 | 0.0% |
| Mobile Home / Other | 2 | 0.3% |
| Total | 709 | 100.0% |
Housing Structures by Occupancy in Belzoni
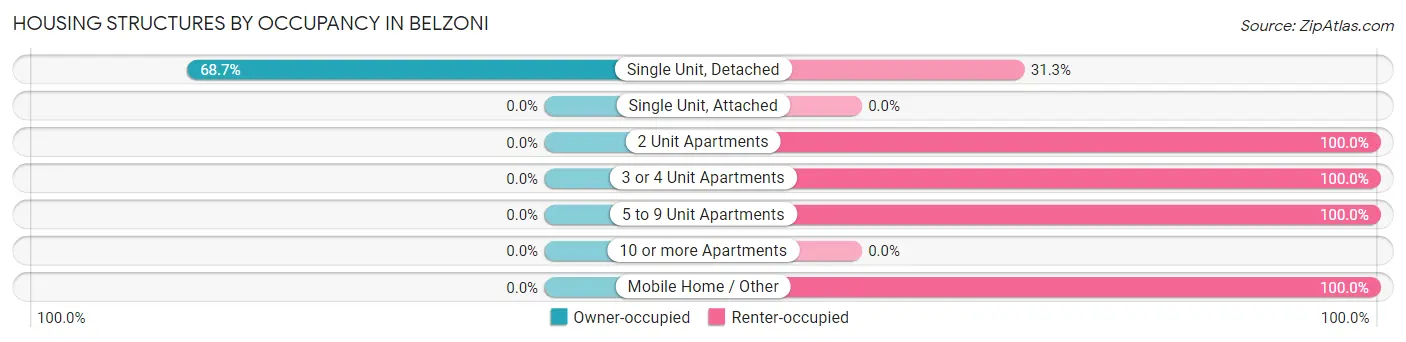
| Structure Type | Owner-occupied | Renter-occupied |
| Single Unit, Detached | 432 (68.7%) | 197 (31.3%) |
| Single Unit, Attached | 0 (0.0%) | 0 (0.0%) |
| 2 Unit Apartments | 0 (0.0%) | 36 (100.0%) |
| 3 or 4 Unit Apartments | 0 (0.0%) | 39 (100.0%) |
| 5 to 9 Unit Apartments | 0 (0.0%) | 3 (100.0%) |
| 10 or more Apartments | 0 (0.0%) | 0 (0.0%) |
| Mobile Home / Other | 0 (0.0%) | 2 (100.0%) |
| Total | 432 (60.9%) | 277 (39.1%) |
Housing Structures by Number of Rooms in Belzoni
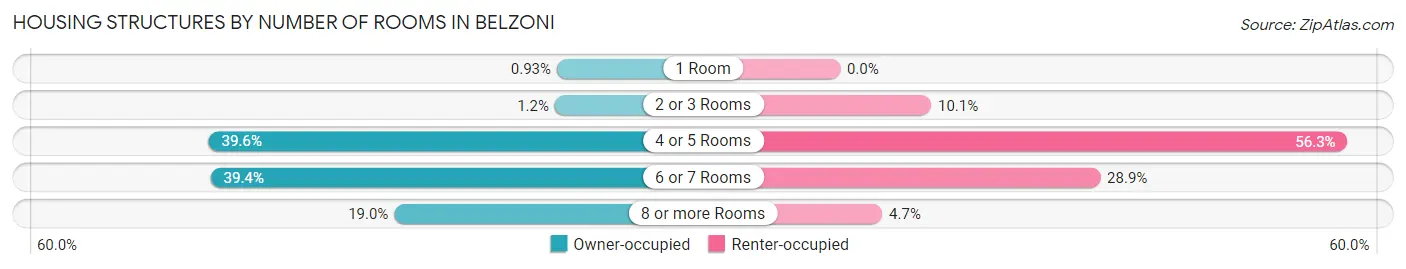
| Number of Rooms | Owner-occupied | Renter-occupied |
| 1 Room | 4 (0.9%) | 0 (0.0%) |
| 2 or 3 Rooms | 5 (1.2%) | 28 (10.1%) |
| 4 or 5 Rooms | 171 (39.6%) | 156 (56.3%) |
| 6 or 7 Rooms | 170 (39.4%) | 80 (28.9%) |
| 8 or more Rooms | 82 (19.0%) | 13 (4.7%) |
| Total | 432 (100.0%) | 277 (100.0%) |
Housing Structure by Heating Type in Belzoni
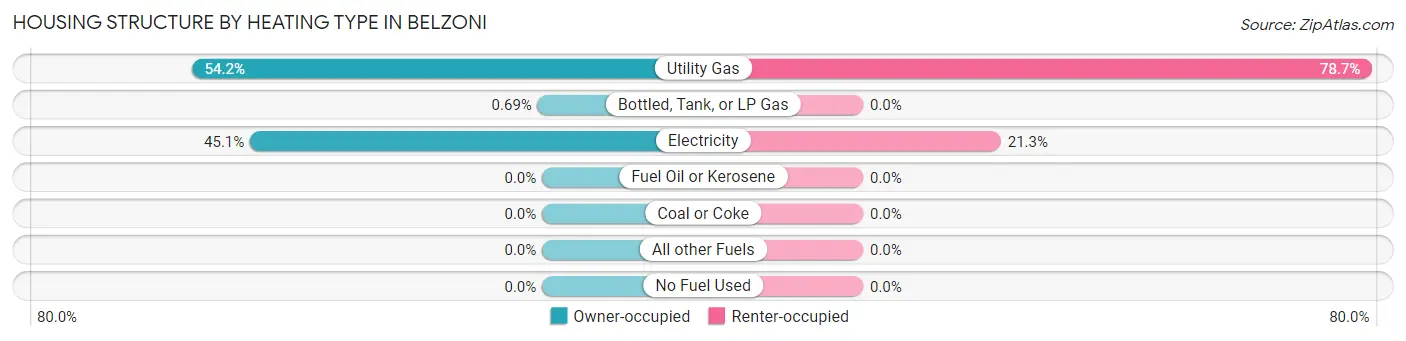
| Heating Type | Owner-occupied | Renter-occupied |
| Utility Gas | 234 (54.2%) | 218 (78.7%) |
| Bottled, Tank, or LP Gas | 3 (0.7%) | 0 (0.0%) |
| Electricity | 195 (45.1%) | 59 (21.3%) |
| Fuel Oil or Kerosene | 0 (0.0%) | 0 (0.0%) |
| Coal or Coke | 0 (0.0%) | 0 (0.0%) |
| All other Fuels | 0 (0.0%) | 0 (0.0%) |
| No Fuel Used | 0 (0.0%) | 0 (0.0%) |
| Total | 432 (100.0%) | 277 (100.0%) |
Household Vehicle Usage in Belzoni
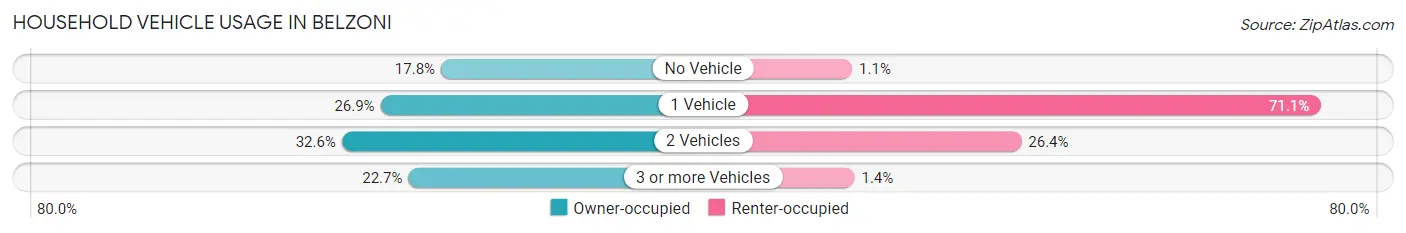
| Vehicles per Household | Owner-occupied | Renter-occupied |
| No Vehicle | 77 (17.8%) | 3 (1.1%) |
| 1 Vehicle | 116 (26.9%) | 197 (71.1%) |
| 2 Vehicles | 141 (32.6%) | 73 (26.4%) |
| 3 or more Vehicles | 98 (22.7%) | 4 (1.4%) |
| Total | 432 (100.0%) | 277 (100.0%) |
Real Estate & Mortgages in Belzoni
Real Estate and Mortgage Overview in Belzoni
| Characteristic | Without Mortgage | With Mortgage |
| Housing Units | 146 | 286 |
| Median Property Value | $80,000 | $81,600 |
| Median Household Income | $40,833 | $48 |
| Monthly Housing Costs | $424 | $0 |
| Real Estate Taxes | $199 | $53 |
Property Value by Mortgage Status in Belzoni
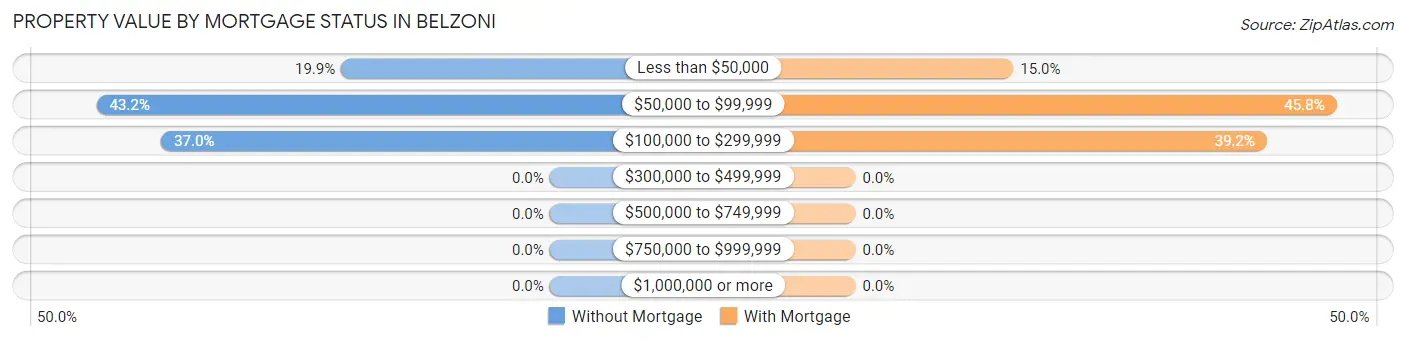
| Property Value | Without Mortgage | With Mortgage |
| Less than $50,000 | 29 (19.9%) | 43 (15.0%) |
| $50,000 to $99,999 | 63 (43.1%) | 131 (45.8%) |
| $100,000 to $299,999 | 54 (37.0%) | 112 (39.2%) |
| $300,000 to $499,999 | 0 (0.0%) | 0 (0.0%) |
| $500,000 to $749,999 | 0 (0.0%) | 0 (0.0%) |
| $750,000 to $999,999 | 0 (0.0%) | 0 (0.0%) |
| $1,000,000 or more | 0 (0.0%) | 0 (0.0%) |
| Total | 146 (100.0%) | 286 (100.0%) |
Household Income by Mortgage Status in Belzoni
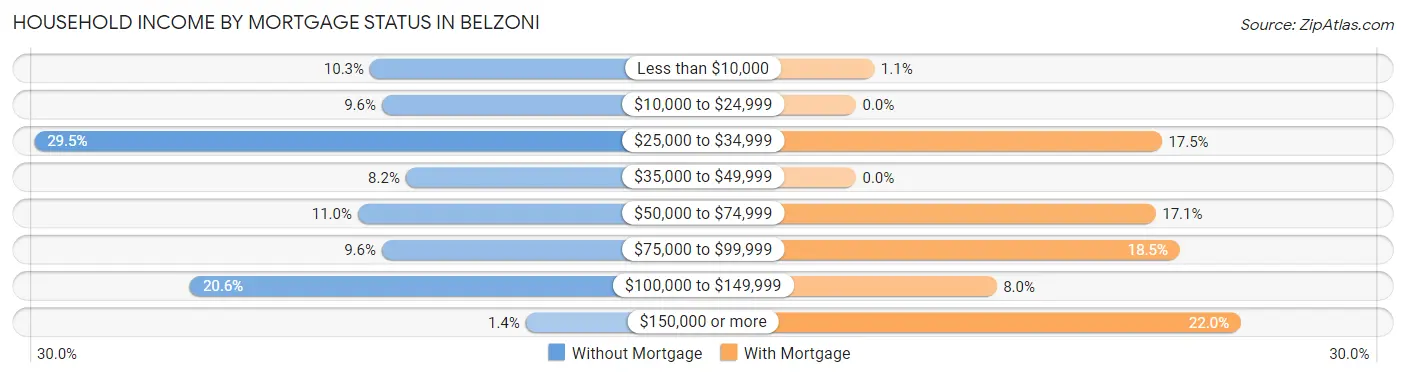
| Household Income | Without Mortgage | With Mortgage |
| Less than $10,000 | 15 (10.3%) | 3 (1.1%) |
| $10,000 to $24,999 | 14 (9.6%) | 0 (0.0%) |
| $25,000 to $34,999 | 43 (29.4%) | 50 (17.5%) |
| $35,000 to $49,999 | 12 (8.2%) | 0 (0.0%) |
| $50,000 to $74,999 | 16 (11.0%) | 49 (17.1%) |
| $75,000 to $99,999 | 14 (9.6%) | 53 (18.5%) |
| $100,000 to $149,999 | 30 (20.5%) | 23 (8.0%) |
| $150,000 or more | 2 (1.4%) | 63 (22.0%) |
| Total | 146 (100.0%) | 286 (100.0%) |
Property Value to Household Income Ratio in Belzoni
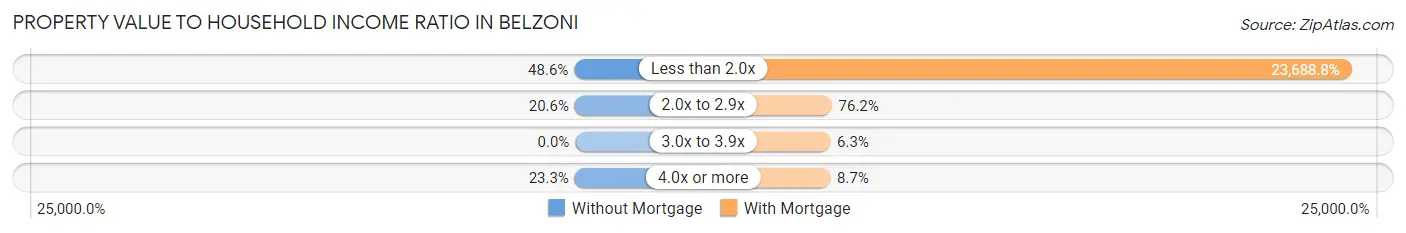
| Value-to-Income Ratio | Without Mortgage | With Mortgage |
| Less than 2.0x | 71 (48.6%) | 67,750 (23,688.8%) |
| 2.0x to 2.9x | 30 (20.5%) | 218 (76.2%) |
| 3.0x to 3.9x | 0 (0.0%) | 18 (6.3%) |
| 4.0x or more | 34 (23.3%) | 25 (8.7%) |
| Total | 146 (100.0%) | 286 (100.0%) |
Real Estate Taxes by Mortgage Status in Belzoni
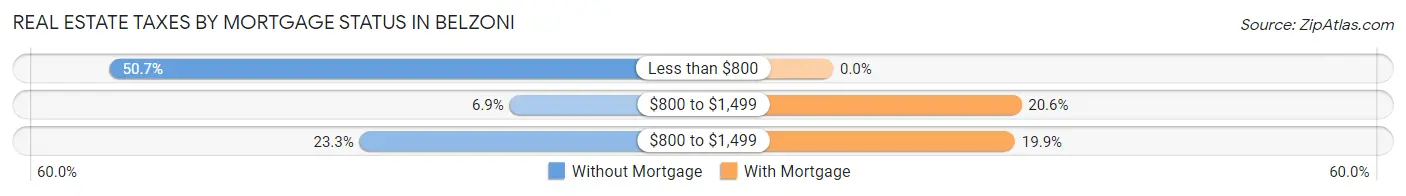
| Property Taxes | Without Mortgage | With Mortgage |
| Less than $800 | 74 (50.7%) | 0 (0.0%) |
| $800 to $1,499 | 10 (6.9%) | 59 (20.6%) |
| $800 to $1,499 | 34 (23.3%) | 57 (19.9%) |
| Total | 146 (100.0%) | 286 (100.0%) |
Health & Disability in Belzoni
Health Insurance Coverage by Age in Belzoni
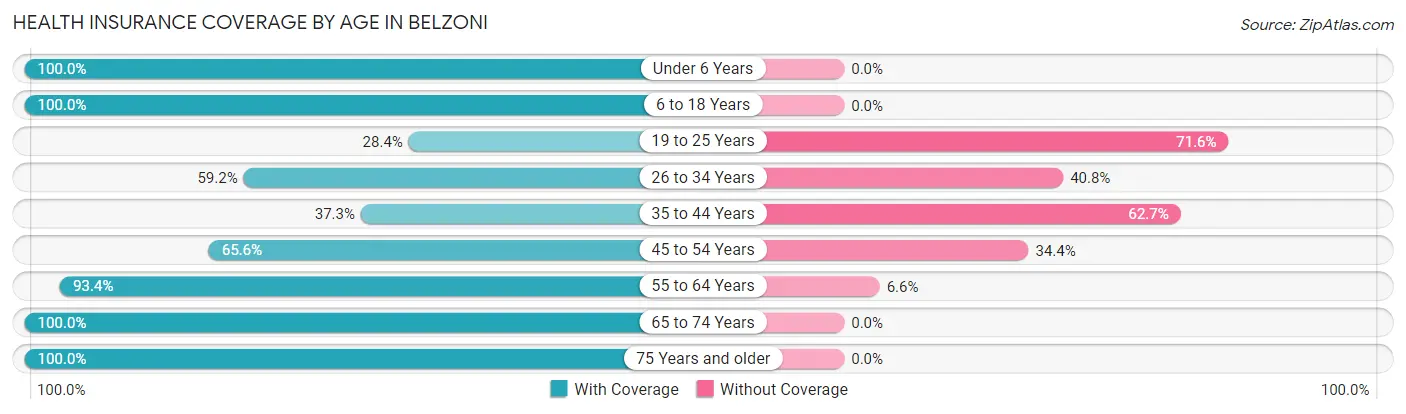
| Age Bracket | With Coverage | Without Coverage |
| Under 6 Years | 227 (100.0%) | 0 (0.0%) |
| 6 to 18 Years | 407 (100.0%) | 0 (0.0%) |
| 19 to 25 Years | 42 (28.4%) | 106 (71.6%) |
| 26 to 34 Years | 87 (59.2%) | 60 (40.8%) |
| 35 to 44 Years | 72 (37.3%) | 121 (62.7%) |
| 45 to 54 Years | 128 (65.6%) | 67 (34.4%) |
| 55 to 64 Years | 269 (93.4%) | 19 (6.6%) |
| 65 to 74 Years | 229 (100.0%) | 0 (0.0%) |
| 75 Years and older | 86 (100.0%) | 0 (0.0%) |
| Total | 1,547 (80.6%) | 373 (19.4%) |
Health Insurance Coverage by Citizenship Status in Belzoni
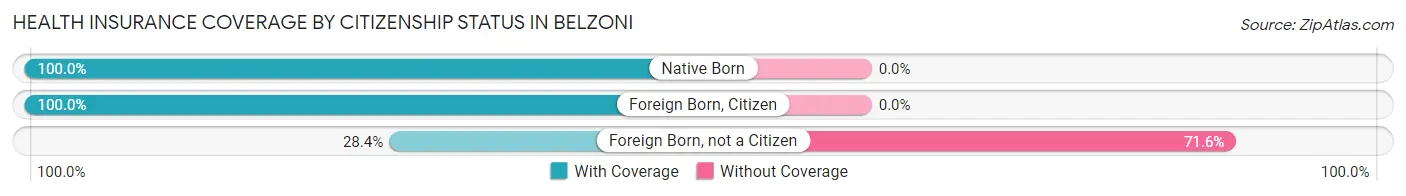
| Citizenship Status | With Coverage | Without Coverage |
| Native Born | 227 (100.0%) | 0 (0.0%) |
| Foreign Born, Citizen | 407 (100.0%) | 0 (0.0%) |
| Foreign Born, not a Citizen | 42 (28.4%) | 106 (71.6%) |
Health Insurance Coverage by Household Income in Belzoni
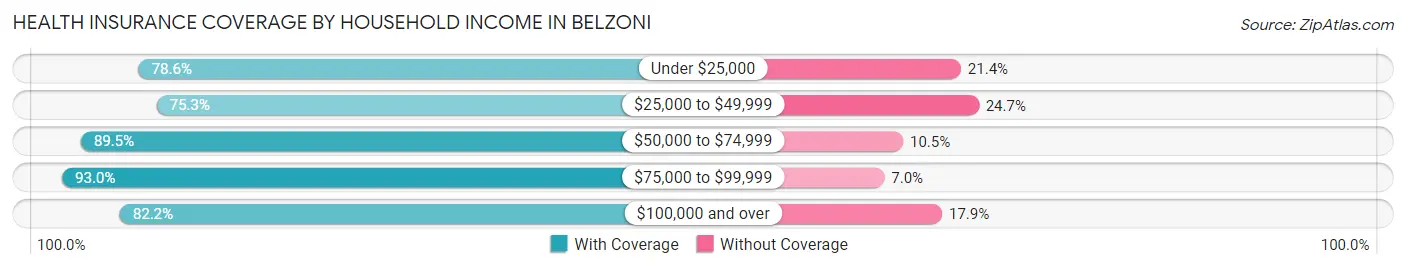
| Household Income | With Coverage | Without Coverage |
| Under $25,000 | 636 (78.6%) | 173 (21.4%) |
| $25,000 to $49,999 | 338 (75.3%) | 111 (24.7%) |
| $50,000 to $74,999 | 263 (89.5%) | 31 (10.5%) |
| $75,000 to $99,999 | 66 (93.0%) | 5 (7.0%) |
| $100,000 and over | 244 (82.2%) | 53 (17.8%) |
Public vs Private Health Insurance Coverage by Age in Belzoni
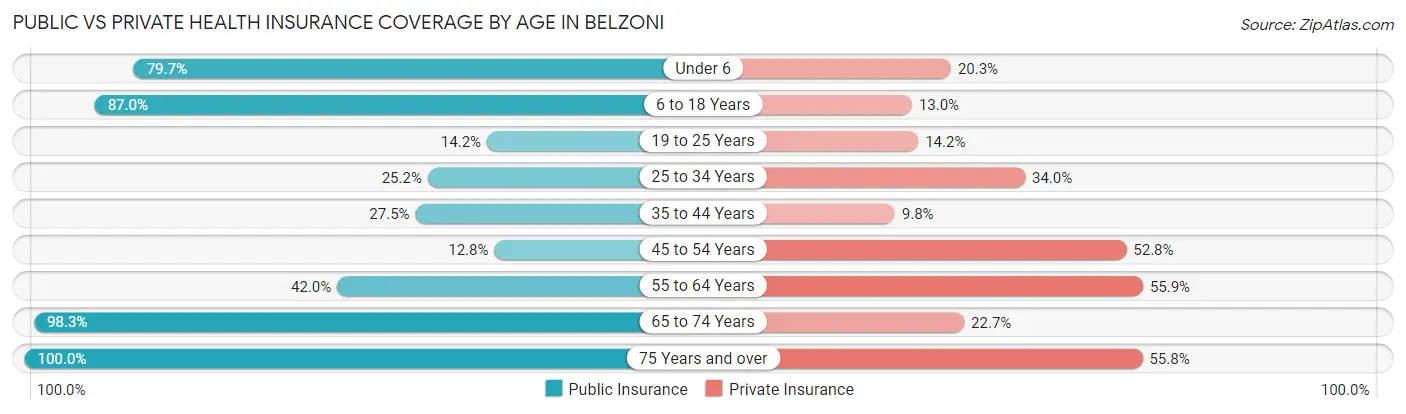
| Age Bracket | Public Insurance | Private Insurance |
| Under 6 | 181 (79.7%) | 46 (20.3%) |
| 6 to 18 Years | 354 (87.0%) | 53 (13.0%) |
| 19 to 25 Years | 21 (14.2%) | 21 (14.2%) |
| 25 to 34 Years | 37 (25.2%) | 50 (34.0%) |
| 35 to 44 Years | 53 (27.5%) | 19 (9.8%) |
| 45 to 54 Years | 25 (12.8%) | 103 (52.8%) |
| 55 to 64 Years | 121 (42.0%) | 161 (55.9%) |
| 65 to 74 Years | 225 (98.3%) | 52 (22.7%) |
| 75 Years and over | 86 (100.0%) | 48 (55.8%) |
| Total | 1,103 (57.5%) | 553 (28.8%) |
Disability Status by Sex by Age in Belzoni
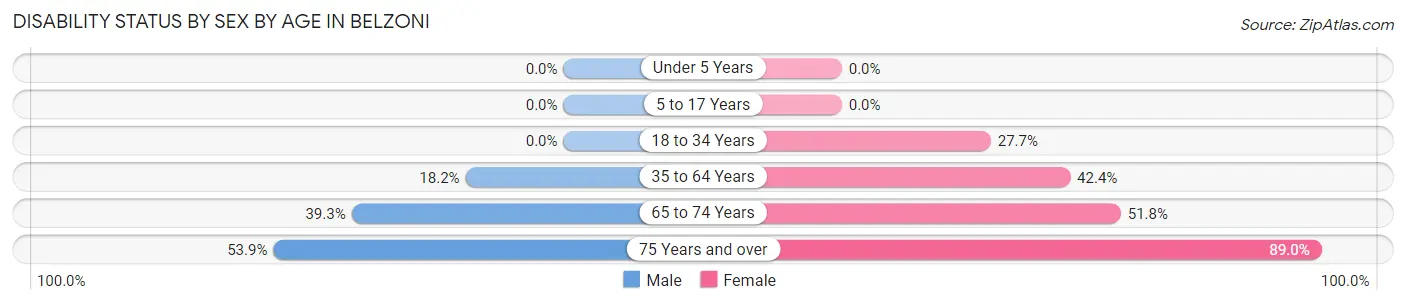
| Age Bracket | Male | Female |
| Under 5 Years | 0 (0.0%) | 0 (0.0%) |
| 5 to 17 Years | 0 (0.0%) | 0 (0.0%) |
| 18 to 34 Years | 0 (0.0%) | 39 (27.7%) |
| 35 to 64 Years | 62 (18.2%) | 142 (42.4%) |
| 65 to 74 Years | 46 (39.3%) | 58 (51.8%) |
| 75 Years and over | 7 (53.8%) | 65 (89.0%) |
Disability Class by Sex by Age in Belzoni
Disability Class: Hearing Difficulty
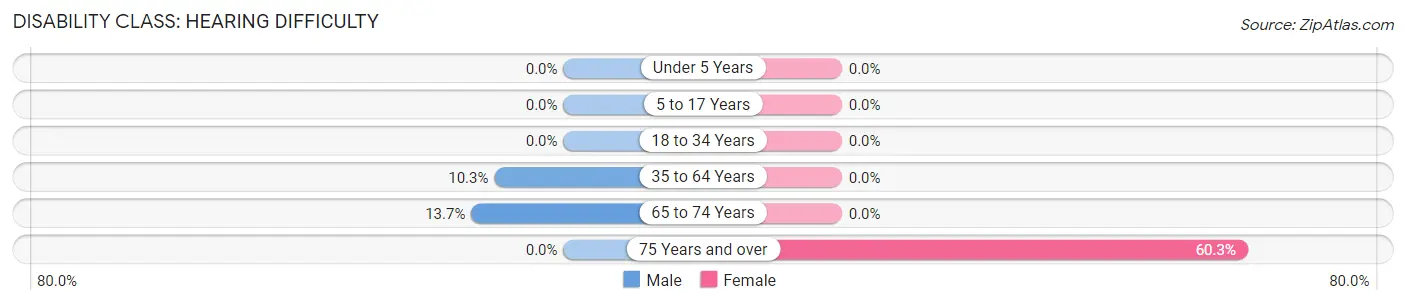
| Age Bracket | Male | Female |
| Under 5 Years | 0 (0.0%) | 0 (0.0%) |
| 5 to 17 Years | 0 (0.0%) | 0 (0.0%) |
| 18 to 34 Years | 0 (0.0%) | 0 (0.0%) |
| 35 to 64 Years | 35 (10.3%) | 0 (0.0%) |
| 65 to 74 Years | 16 (13.7%) | 0 (0.0%) |
| 75 Years and over | 0 (0.0%) | 44 (60.3%) |
Disability Class: Vision Difficulty
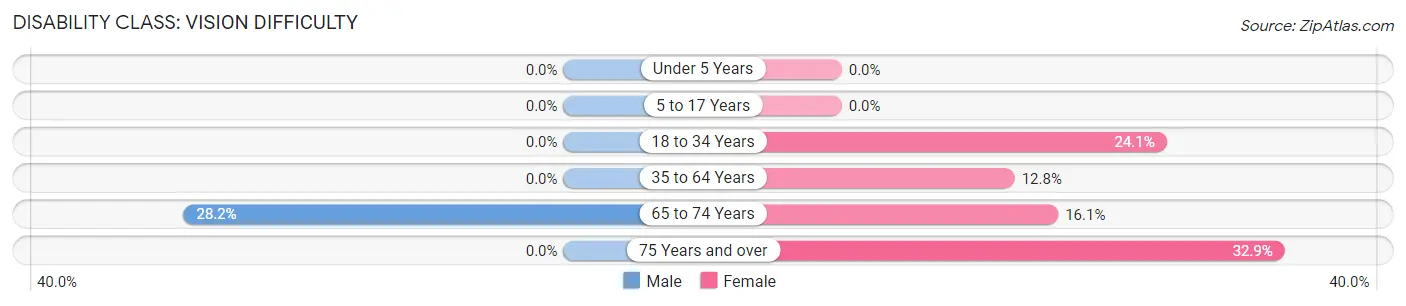
| Age Bracket | Male | Female |
| Under 5 Years | 0 (0.0%) | 0 (0.0%) |
| 5 to 17 Years | 0 (0.0%) | 0 (0.0%) |
| 18 to 34 Years | 0 (0.0%) | 34 (24.1%) |
| 35 to 64 Years | 0 (0.0%) | 43 (12.8%) |
| 65 to 74 Years | 33 (28.2%) | 18 (16.1%) |
| 75 Years and over | 0 (0.0%) | 24 (32.9%) |
Disability Class: Cognitive Difficulty
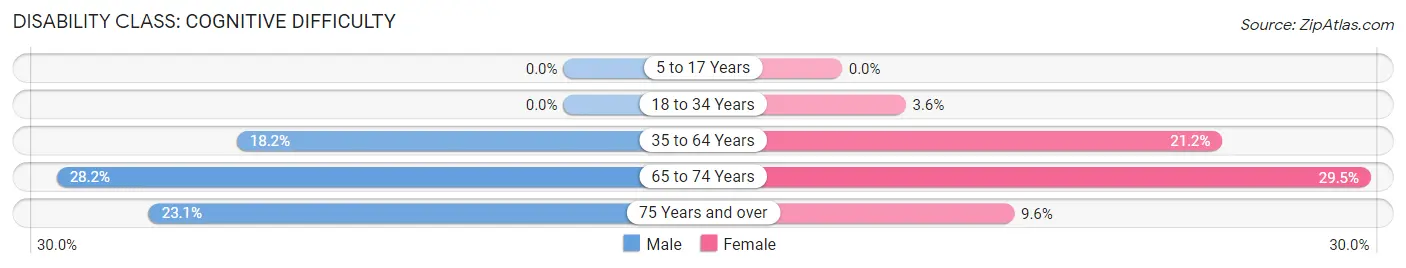
| Age Bracket | Male | Female |
| 5 to 17 Years | 0 (0.0%) | 0 (0.0%) |
| 18 to 34 Years | 0 (0.0%) | 5 (3.5%) |
| 35 to 64 Years | 62 (18.2%) | 71 (21.2%) |
| 65 to 74 Years | 33 (28.2%) | 33 (29.5%) |
| 75 Years and over | 3 (23.1%) | 7 (9.6%) |
Disability Class: Ambulatory Difficulty
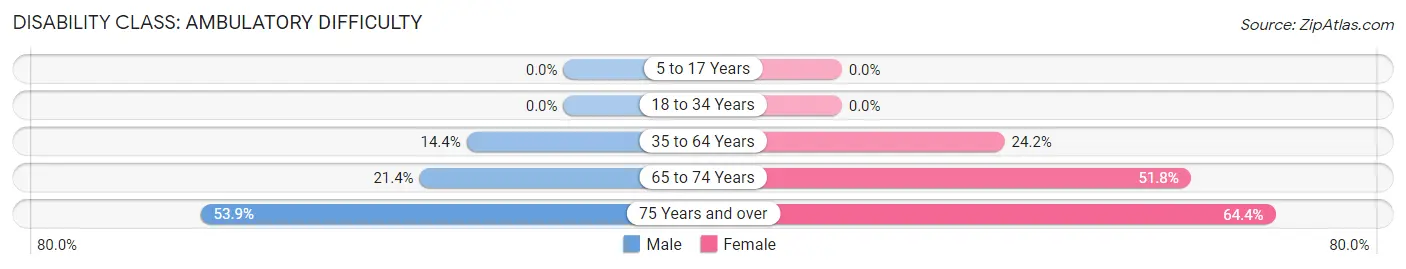
| Age Bracket | Male | Female |
| 5 to 17 Years | 0 (0.0%) | 0 (0.0%) |
| 18 to 34 Years | 0 (0.0%) | 0 (0.0%) |
| 35 to 64 Years | 49 (14.4%) | 81 (24.2%) |
| 65 to 74 Years | 25 (21.4%) | 58 (51.8%) |
| 75 Years and over | 7 (53.8%) | 47 (64.4%) |
Disability Class: Self-Care Difficulty
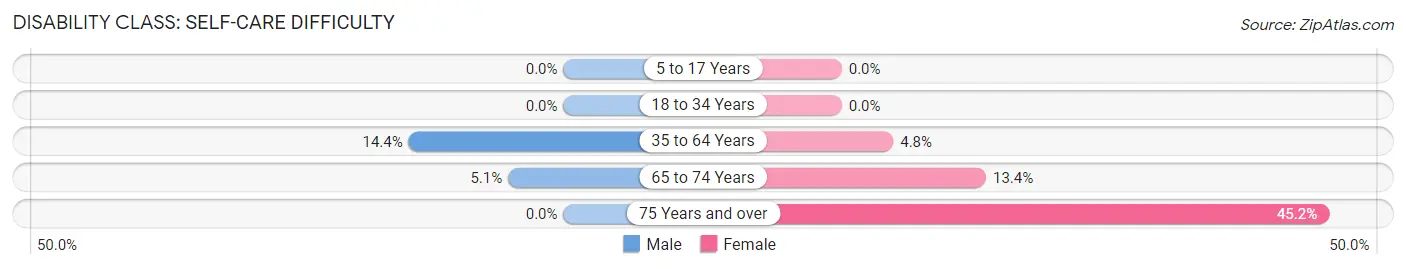
| Age Bracket | Male | Female |
| 5 to 17 Years | 0 (0.0%) | 0 (0.0%) |
| 18 to 34 Years | 0 (0.0%) | 0 (0.0%) |
| 35 to 64 Years | 49 (14.4%) | 16 (4.8%) |
| 65 to 74 Years | 6 (5.1%) | 15 (13.4%) |
| 75 Years and over | 0 (0.0%) | 33 (45.2%) |
Technology Access in Belzoni
Computing Device Access in Belzoni
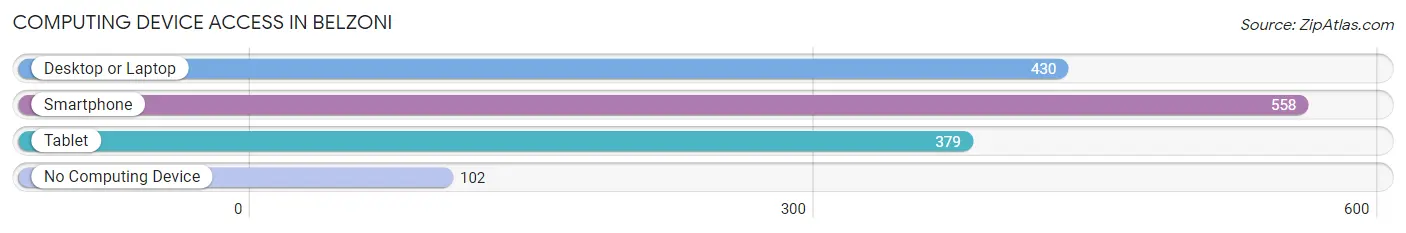
| Device Type | # Households | % Households |
| Desktop or Laptop | 430 | 60.7% |
| Smartphone | 558 | 78.7% |
| Tablet | 379 | 53.5% |
| No Computing Device | 102 | 14.4% |
| Total | 709 | 100.0% |
Internet Access in Belzoni
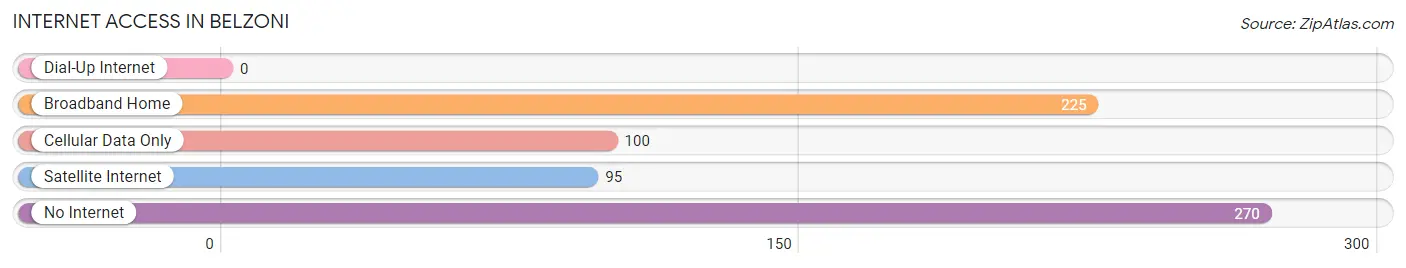
| Internet Type | # Households | % Households |
| Dial-Up Internet | 0 | 0.0% |
| Broadband Home | 225 | 31.7% |
| Cellular Data Only | 100 | 14.1% |
| Satellite Internet | 95 | 13.4% |
| No Internet | 270 | 38.1% |
| Total | 709 | 100.0% |
Belzoni Summary
Belzoni, Mississippi is a small town located in Humphreys County, Mississippi. It is situated on the banks of the Yazoo River, approximately 50 miles northwest of Jackson, the state capital. The town was named after the Italian explorer, Giovanni Battista Belzoni, who explored the area in the early 19th century. Belzoni is a rural community with a population of approximately 2,500 people.
Geography
Belzoni is located in the Mississippi Delta region, which is characterized by flat, fertile land and a humid subtropical climate. The town is situated on the banks of the Yazoo River, which is a major tributary of the Mississippi River. The town is surrounded by agricultural land, with cotton, soybeans, and corn being the primary crops. The town is also home to several small lakes, including Lake Belzoni, which is a popular spot for fishing and boating.
Economy
Belzoni’s economy is largely based on agriculture. The town is home to several cotton gins, as well as a number of other agricultural businesses. The town is also home to several small businesses, including restaurants, convenience stores, and a few small manufacturing plants.
Demographics
As of the 2010 census, Belzoni had a population of 2,521 people. The racial makeup of the town was 57.3% African American, 40.2% White, 0.3% Native American, 0.2% Asian, 0.1% Pacific Islander, and 1.9% from other races. The median household income was $22,917, and the median family income was $27,917.
Education
Belzoni is served by the Humphreys County School District, which operates three elementary schools, one middle school, and one high school. The town is also home to a branch of the Mississippi Delta Community College.
Conclusion
Belzoni, Mississippi is a small rural town located in the Mississippi Delta region. The town is home to a population of approximately 2,500 people, and its economy is largely based on agriculture. The town is served by the Humphreys County School District, and is home to a branch of the Mississippi Delta Community College. Belzoni is a quiet, peaceful town with a rich history and a bright future.
Common Questions
What is Per Capita Income in Belzoni?
Per Capita income in Belzoni is $19,790.
What is the Median Family Income in Belzoni?
Median Family Income in Belzoni is $50,125.
What is the Median Household income in Belzoni?
Median Household Income in Belzoni is $37,528.
What is Income or Wage Gap in Belzoni?
Income or Wage Gap in Belzoni is 48.3%.
Women in Belzoni earn 51.7 cents for every dollar earned by a man.
What is Inequality or Gini Index in Belzoni?
Inequality or Gini Index in Belzoni is 0.44.
What is the Total Population of Belzoni?
Total Population of Belzoni is 1,947.
What is the Total Male Population of Belzoni?
Total Male Population of Belzoni is 970.
What is the Total Female Population of Belzoni?
Total Female Population of Belzoni is 977.
What is the Ratio of Males per 100 Females in Belzoni?
There are 99.28 Males per 100 Females in Belzoni.
What is the Ratio of Females per 100 Males in Belzoni?
There are 100.72 Females per 100 Males in Belzoni.
What is the Median Population Age in Belzoni?
Median Population Age in Belzoni is 36.6 Years.
What is the Average Family Size in Belzoni
Average Family Size in Belzoni is 3.5 People.
What is the Average Household Size in Belzoni
Average Household Size in Belzoni is 2.7 People.
How Large is the Labor Force in Belzoni?
There are 649 People in the Labor Forcein in Belzoni.
What is the Percentage of People in the Labor Force in Belzoni?
48.5% of People are in the Labor Force in Belzoni.
What is the Unemployment Rate in Belzoni?
Unemployment Rate in Belzoni is 13.4%.