Coffeeville, MS Map & Demographics
Coffeeville Map
Coffeeville Overview
$18,123
PER CAPITA INCOME
$37,188
AVG FAMILY INCOME
$30,691
AVG HOUSEHOLD INCOME
2.9%
WAGE / INCOME GAP [ % ]
97.1¢/ $1
WAGE / INCOME GAP [ $ ]
0.44
INEQUALITY / GINI INDEX
984
TOTAL POPULATION
486
MALE POPULATION
498
FEMALE POPULATION
97.59
MALES / 100 FEMALES
102.47
FEMALES / 100 MALES
40.3
MEDIAN AGE
3.4
AVG FAMILY SIZE
2.4
AVG HOUSEHOLD SIZE
332
LABOR FORCE [ PEOPLE ]
43.8%
PERCENT IN LABOR FORCE
3.3%
UNEMPLOYMENT RATE
Coffeeville Zip Codes
Coffeeville Area Codes
Income in Coffeeville
Income Overview in Coffeeville
Per Capita Income in Coffeeville is $18,123, while median incomes of families and households are $37,188 and $30,691 respectively.
| Characteristic | Number | Measure |
| Per Capita Income | 984 | $18,123 |
| Median Family Income | 215 | $37,188 |
| Mean Family Income | 215 | $47,333 |
| Median Household Income | 409 | $30,691 |
| Mean Household Income | 409 | $41,679 |
| Income Deficit | 215 | $0 |
| Wage / Income Gap (%) | 984 | 2.90% |
| Wage / Income Gap ($) | 984 | 97.10¢ per $1 |
| Gini / Inequality Index | 984 | 0.44 |
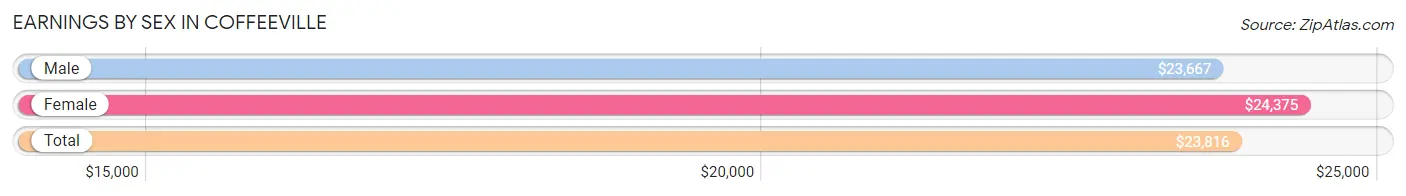
Earnings by Sex in Coffeeville
Average Earnings in Coffeeville are $23,816, $23,667 for men and $24,375 for women, a difference of 2.9%.
| Sex | Number | Average Earnings |
| Male | 154 (45.8%) | $23,667 |
| Female | 182 (54.2%) | $24,375 |
| Total | 336 (100.0%) | $23,816 |
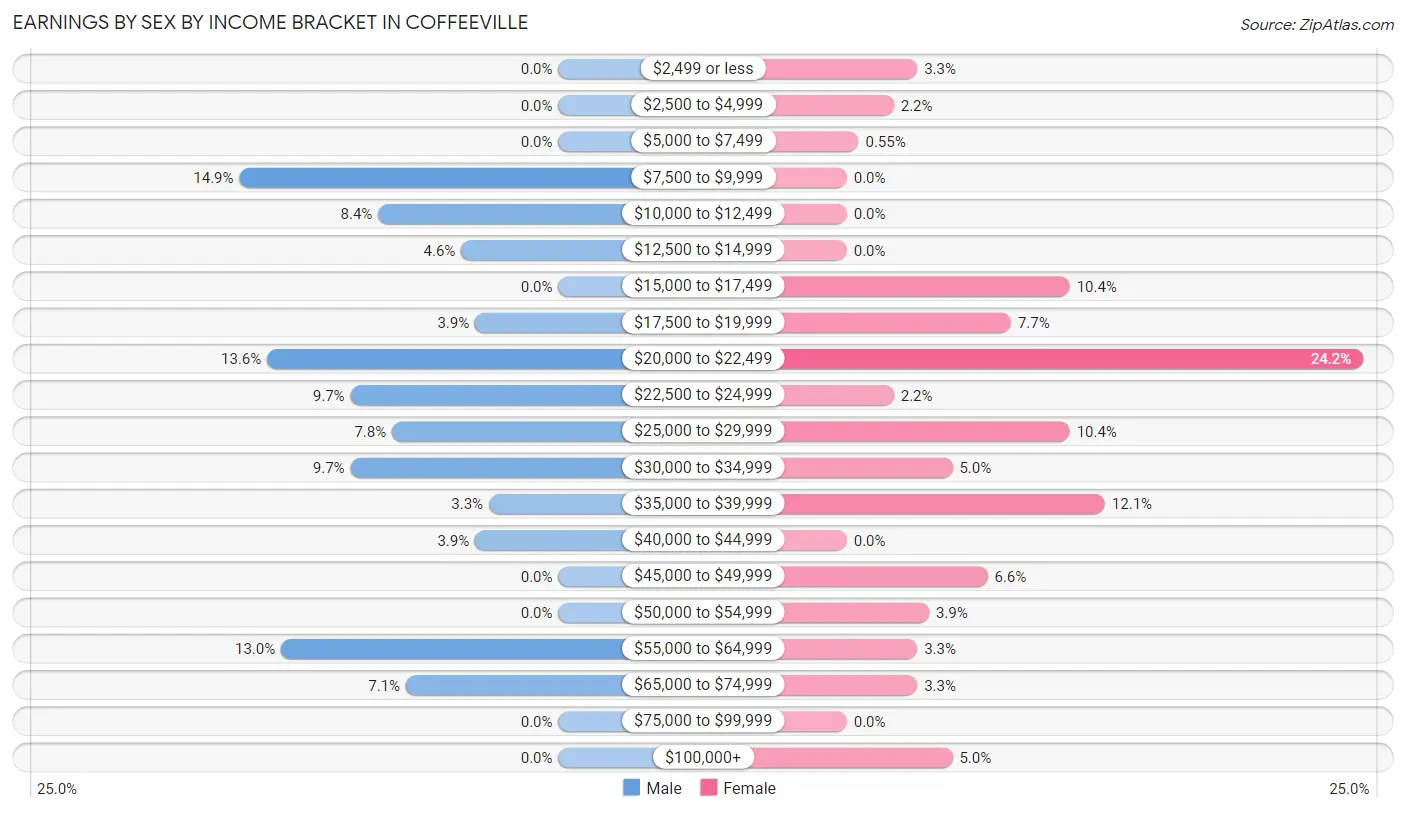
Earnings by Sex by Income Bracket in Coffeeville
The most common earnings brackets in Coffeeville are $7,500 to $9,999 for men (23 | 14.9%) and $20,000 to $22,499 for women (44 | 24.2%).
| Income | Male | Female |
| $2,499 or less | 0 (0.0%) | 6 (3.3%) |
| $2,500 to $4,999 | 0 (0.0%) | 4 (2.2%) |
| $5,000 to $7,499 | 0 (0.0%) | 1 (0.5%) |
| $7,500 to $9,999 | 23 (14.9%) | 0 (0.0%) |
| $10,000 to $12,499 | 13 (8.4%) | 0 (0.0%) |
| $12,500 to $14,999 | 7 (4.5%) | 0 (0.0%) |
| $15,000 to $17,499 | 0 (0.0%) | 19 (10.4%) |
| $17,500 to $19,999 | 6 (3.9%) | 14 (7.7%) |
| $20,000 to $22,499 | 21 (13.6%) | 44 (24.2%) |
| $22,500 to $24,999 | 15 (9.7%) | 4 (2.2%) |
| $25,000 to $29,999 | 12 (7.8%) | 19 (10.4%) |
| $30,000 to $34,999 | 15 (9.7%) | 9 (5.0%) |
| $35,000 to $39,999 | 5 (3.3%) | 22 (12.1%) |
| $40,000 to $44,999 | 6 (3.9%) | 0 (0.0%) |
| $45,000 to $49,999 | 0 (0.0%) | 12 (6.6%) |
| $50,000 to $54,999 | 0 (0.0%) | 7 (3.8%) |
| $55,000 to $64,999 | 20 (13.0%) | 6 (3.3%) |
| $65,000 to $74,999 | 11 (7.1%) | 6 (3.3%) |
| $75,000 to $99,999 | 0 (0.0%) | 0 (0.0%) |
| $100,000+ | 0 (0.0%) | 9 (5.0%) |
| Total | 154 (100.0%) | 182 (100.0%) |
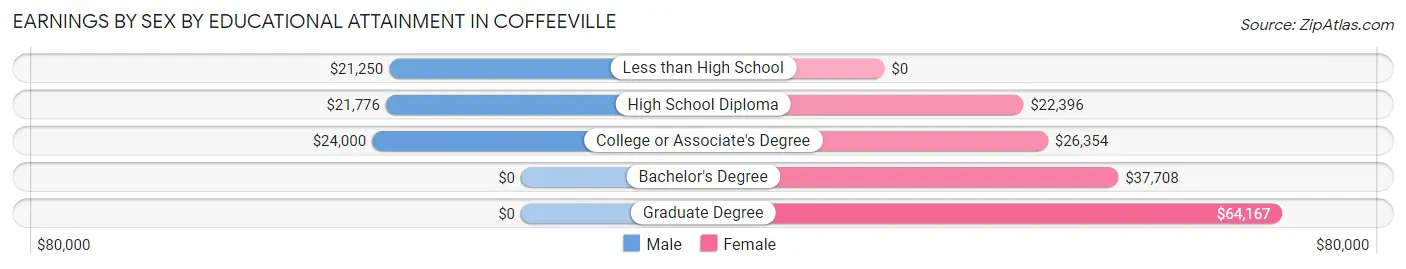
Earnings by Sex by Educational Attainment in Coffeeville
Average earnings in Coffeeville are $23,667 for men and $29,107 for women, a difference of 18.7%. Men with an educational attainment of college or associate's degree enjoy the highest average annual earnings of $24,000, while those with less than high school education earn the least with $21,250. Women with an educational attainment of graduate degree earn the most with the average annual earnings of $64,167, while those with high school diploma education have the smallest earnings of $22,396.
| Educational Attainment | Male Income | Female Income |
| Less than High School | $21,250 | $0 |
| High School Diploma | $21,776 | $22,396 |
| College or Associate's Degree | $24,000 | $26,354 |
| Bachelor's Degree | - | - |
| Graduate Degree | - | - |
| Total | $23,667 | $29,107 |
Family Income in Coffeeville
Family Income Brackets in Coffeeville
According to the Coffeeville family income data, there are 61 families falling into the $25,000 to $34,999 income range, which is the most common income bracket and makes up 28.4% of all families.
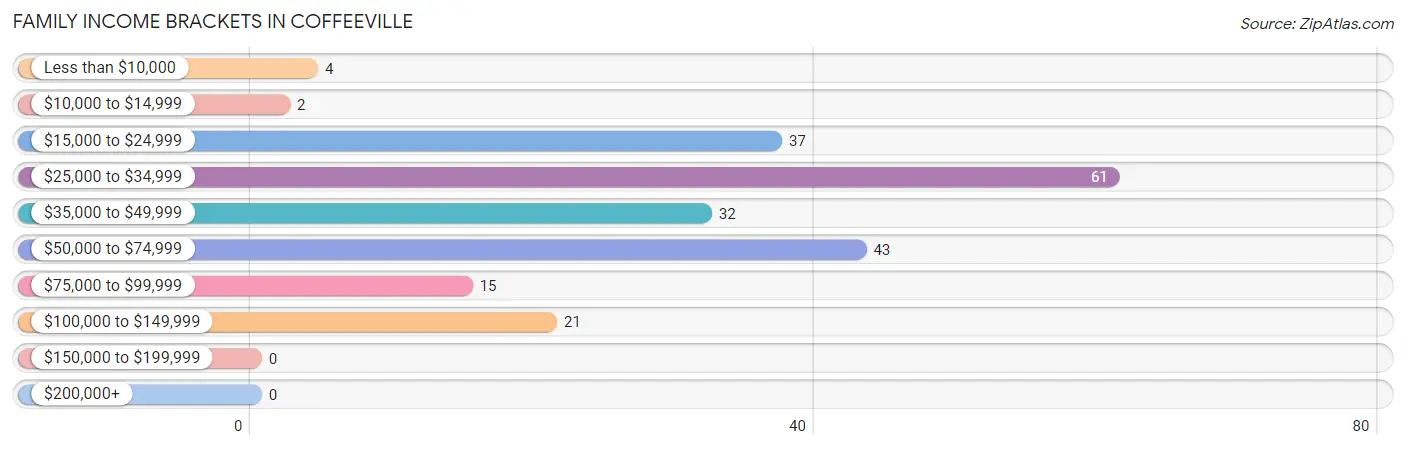
| Income Bracket | # Families | % Families |
| Less than $10,000 | 4 | 1.9% |
| $10,000 to $14,999 | 2 | 0.9% |
| $15,000 to $24,999 | 37 | 17.2% |
| $25,000 to $34,999 | 61 | 28.4% |
| $35,000 to $49,999 | 32 | 14.9% |
| $50,000 to $74,999 | 43 | 20.0% |
| $75,000 to $99,999 | 15 | 7.0% |
| $100,000 to $149,999 | 21 | 9.8% |
| $150,000 to $199,999 | 0 | 0.0% |
| $200,000+ | 0 | 0.0% |
Family Income by Famaliy Size in Coffeeville
4-person families (34 | 15.8%) account for the highest median family income in Coffeeville with $77,500 per family, while 4-person families (34 | 15.8%) have the highest median income of $19,375 per family member.
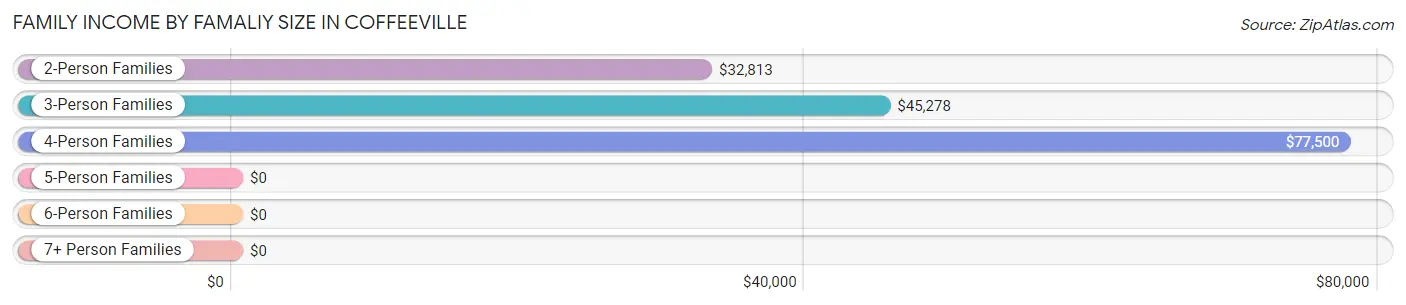
| Income Bracket | # Families | Median Income |
| 2-Person Families | 115 (53.5%) | $32,813 |
| 3-Person Families | 44 (20.5%) | $45,278 |
| 4-Person Families | 34 (15.8%) | $77,500 |
| 5-Person Families | 19 (8.8%) | $0 |
| 6-Person Families | 0 (0.0%) | $0 |
| 7+ Person Families | 3 (1.4%) | $0 |
| Total | 215 (100.0%) | $37,188 |
Family Income by Number of Earners in Coffeeville
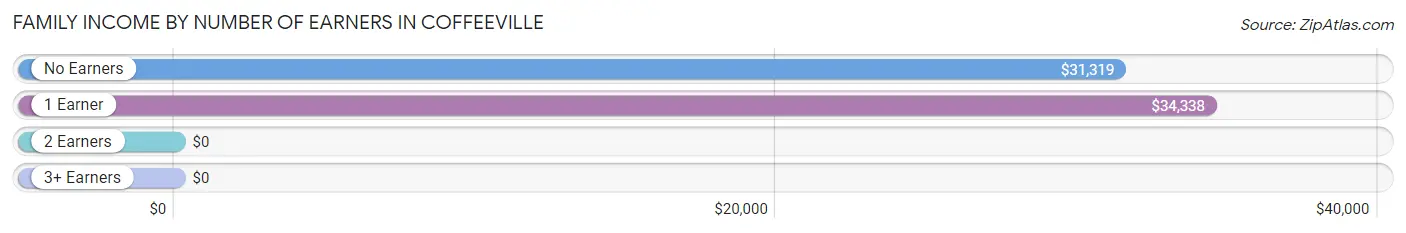
| Number of Earners | # Families | Median Income |
| No Earners | 69 (32.1%) | $31,319 |
| 1 Earner | 113 (52.6%) | $34,338 |
| 2 Earners | 33 (15.3%) | $0 |
| 3+ Earners | 0 (0.0%) | $0 |
| Total | 215 (100.0%) | $37,188 |
Household Income in Coffeeville
Household Income Brackets in Coffeeville
With 92 households falling in the category, the $25,000 to $34,999 income range is the most frequent in Coffeeville, accounting for 22.5% of all households.
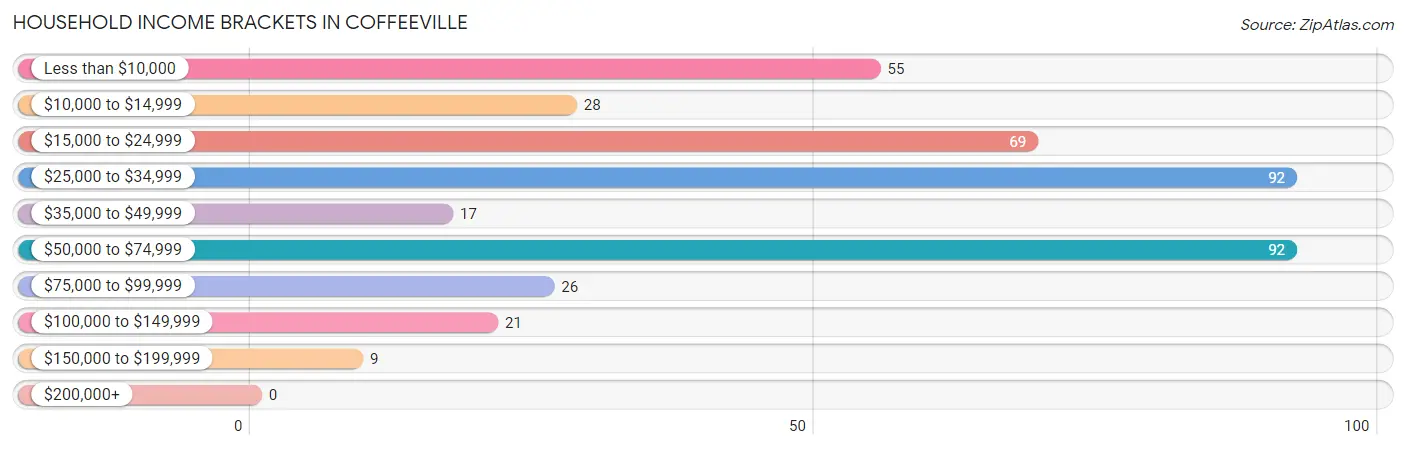
| Income Bracket | # Households | % Households |
| Less than $10,000 | 55 | 13.4% |
| $10,000 to $14,999 | 28 | 6.8% |
| $15,000 to $24,999 | 69 | 16.9% |
| $25,000 to $34,999 | 92 | 22.5% |
| $35,000 to $49,999 | 17 | 4.2% |
| $50,000 to $74,999 | 92 | 22.5% |
| $75,000 to $99,999 | 26 | 6.4% |
| $100,000 to $149,999 | 21 | 5.1% |
| $150,000 to $199,999 | 9 | 2.2% |
| $200,000+ | 0 | 0.0% |
Household Income by Householder Age in Coffeeville
The median household income in Coffeeville is $30,691, with the highest median household income of $31,630 found in the 65+ years age bracket for the primary householder. A total of 98 households (24.0%) fall into this category. Meanwhile, the 15 to 24 years age bracket for the primary householder has the lowest median household income of $0, with 6 households (1.5%) in this group.
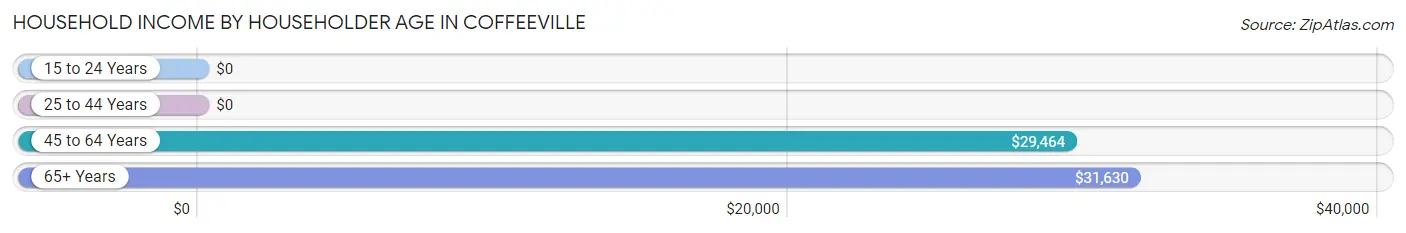
| Income Bracket | # Households | Median Income |
| 15 to 24 Years | 6 (1.5%) | $0 |
| 25 to 44 Years | 108 (26.4%) | $0 |
| 45 to 64 Years | 197 (48.2%) | $29,464 |
| 65+ Years | 98 (24.0%) | $31,630 |
| Total | 409 (100.0%) | $30,691 |
Poverty in Coffeeville
Income Below Poverty by Sex and Age in Coffeeville
With 25.5% poverty level for males and 21.3% for females among the residents of Coffeeville, 5 year old males and under 5 year old females are the most vulnerable to poverty, with 6 males (100.0%) and 4 females (100.0%) in their respective age groups living below the poverty level.
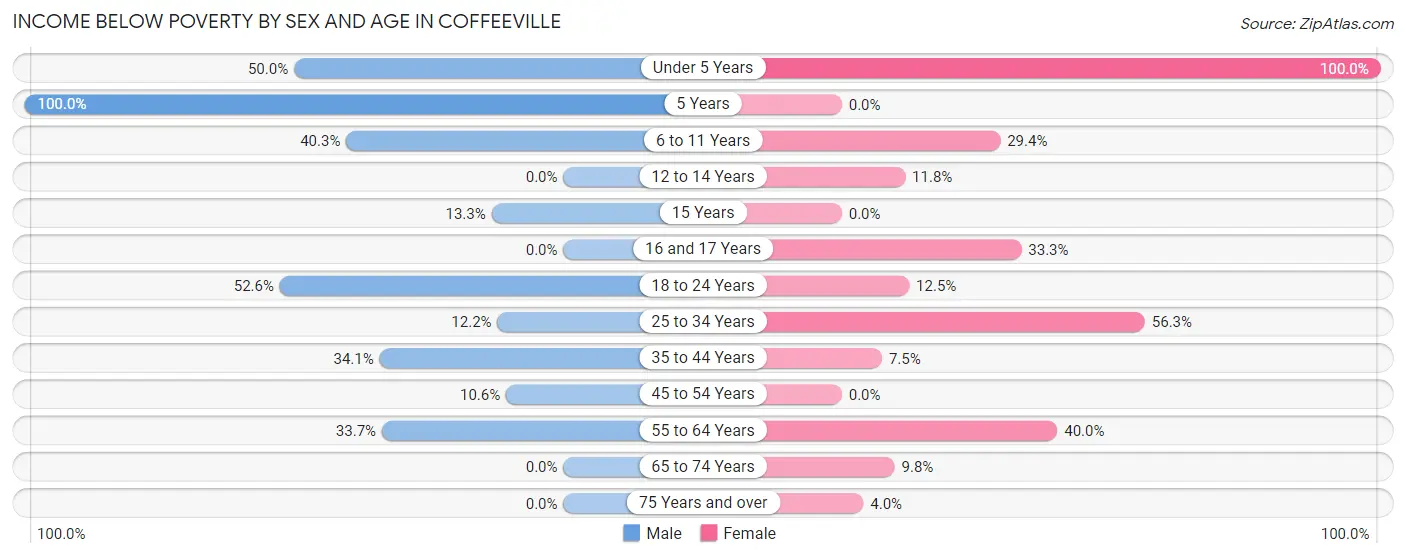
| Age Bracket | Male | Female |
| Under 5 Years | 7 (50.0%) | 4 (100.0%) |
| 5 Years | 6 (100.0%) | 0 (0.0%) |
| 6 to 11 Years | 27 (40.3%) | 10 (29.4%) |
| 12 to 14 Years | 0 (0.0%) | 2 (11.8%) |
| 15 Years | 2 (13.3%) | 0 (0.0%) |
| 16 and 17 Years | 0 (0.0%) | 2 (33.3%) |
| 18 to 24 Years | 10 (52.6%) | 5 (12.5%) |
| 25 to 34 Years | 6 (12.2%) | 36 (56.2%) |
| 35 to 44 Years | 29 (34.1%) | 5 (7.5%) |
| 45 to 54 Years | 5 (10.6%) | 0 (0.0%) |
| 55 to 64 Years | 32 (33.7%) | 36 (40.0%) |
| 65 to 74 Years | 0 (0.0%) | 5 (9.8%) |
| 75 Years and over | 0 (0.0%) | 1 (4.0%) |
| Total | 124 (25.5%) | 106 (21.3%) |
Income Above Poverty by Sex and Age in Coffeeville
According to the poverty statistics in Coffeeville, males aged 12 to 14 years and females aged 15 years are the age groups that are most secure financially, with 100.0% of males and 100.0% of females in these age groups living above the poverty line.
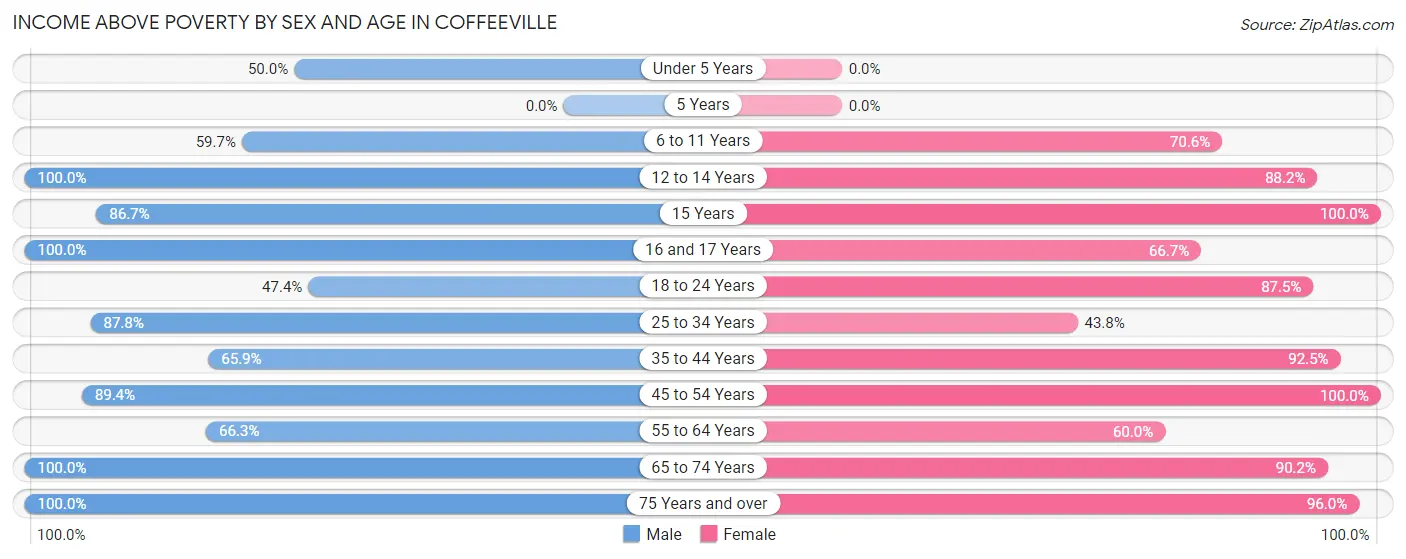
| Age Bracket | Male | Female |
| Under 5 Years | 7 (50.0%) | 0 (0.0%) |
| 5 Years | 0 (0.0%) | 0 (0.0%) |
| 6 to 11 Years | 40 (59.7%) | 24 (70.6%) |
| 12 to 14 Years | 20 (100.0%) | 15 (88.2%) |
| 15 Years | 13 (86.7%) | 49 (100.0%) |
| 16 and 17 Years | 25 (100.0%) | 4 (66.7%) |
| 18 to 24 Years | 9 (47.4%) | 35 (87.5%) |
| 25 to 34 Years | 43 (87.8%) | 28 (43.8%) |
| 35 to 44 Years | 56 (65.9%) | 62 (92.5%) |
| 45 to 54 Years | 42 (89.4%) | 51 (100.0%) |
| 55 to 64 Years | 63 (66.3%) | 54 (60.0%) |
| 65 to 74 Years | 34 (100.0%) | 46 (90.2%) |
| 75 Years and over | 10 (100.0%) | 24 (96.0%) |
| Total | 362 (74.5%) | 392 (78.7%) |
Income Below Poverty Among Married-Couple Families in Coffeeville
The poverty statistics for married-couple families in Coffeeville show that 4.1% or 4 of the total 97 families live below the poverty line. Families with 1 or 2 children have the highest poverty rate of 5.1%, comprising of 2 families. On the other hand, families with no children have the lowest poverty rate of 3.5%, which includes 2 families.
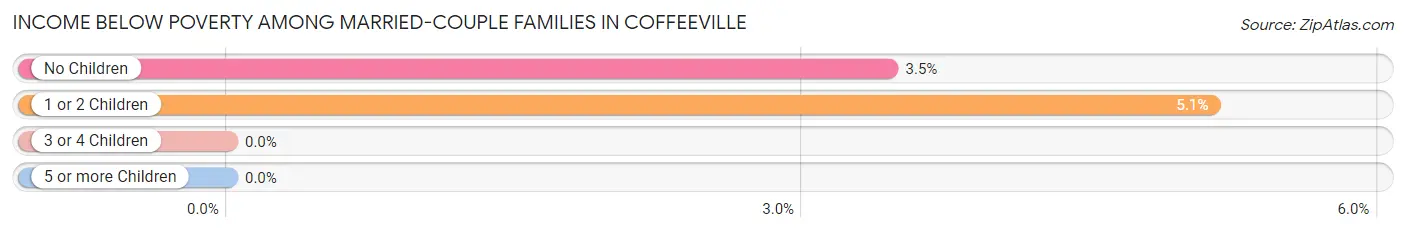
| Children | Above Poverty | Below Poverty |
| No Children | 56 (96.6%) | 2 (3.5%) |
| 1 or 2 Children | 37 (94.9%) | 2 (5.1%) |
| 3 or 4 Children | 0 (0.0%) | 0 (0.0%) |
| 5 or more Children | 0 (0.0%) | 0 (0.0%) |
| Total | 93 (95.9%) | 4 (4.1%) |
Income Below Poverty Among Single-Parent Households in Coffeeville
According to the poverty data in Coffeeville, 58.3% or 7 single-father households and 24.5% or 26 single-mother households are living below the poverty line. Among single-father households, those with no children have the highest poverty rate, with 7 households (100.0%) experiencing poverty. Likewise, among single-mother households, those with 5 or more children have the highest poverty rate, with 3 households (100.0%) falling below the poverty line.
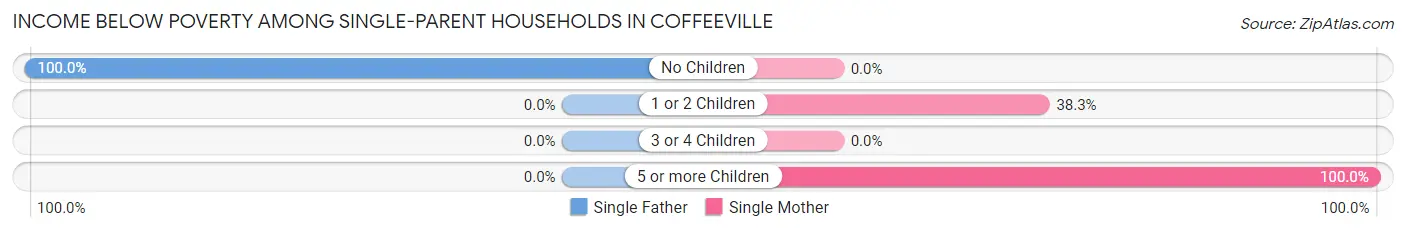
| Children | Single Father | Single Mother |
| No Children | 7 (100.0%) | 0 (0.0%) |
| 1 or 2 Children | 0 (0.0%) | 23 (38.3%) |
| 3 or 4 Children | 0 (0.0%) | 0 (0.0%) |
| 5 or more Children | 0 (0.0%) | 3 (100.0%) |
| Total | 7 (58.3%) | 26 (24.5%) |
Income Below Poverty Among Married-Couple vs Single-Parent Households in Coffeeville
The poverty data for Coffeeville shows that 4 of the married-couple family households (4.1%) and 33 of the single-parent households (28.0%) are living below the poverty level. Within the married-couple family households, those with 1 or 2 children have the highest poverty rate, with 2 households (5.1%) falling below the poverty line. Among the single-parent households, those with 5 or more children have the highest poverty rate, with 3 household (100.0%) living below poverty.
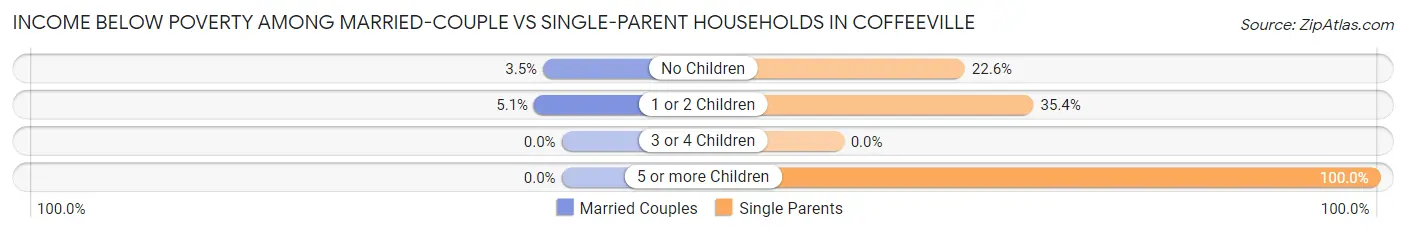
| Children | Married-Couple Families | Single-Parent Households |
| No Children | 2 (3.5%) | 7 (22.6%) |
| 1 or 2 Children | 2 (5.1%) | 23 (35.4%) |
| 3 or 4 Children | 0 (0.0%) | 0 (0.0%) |
| 5 or more Children | 0 (0.0%) | 3 (100.0%) |
| Total | 4 (4.1%) | 33 (28.0%) |
Race in Coffeeville
The most populous races in Coffeeville are Black / African American (605 | 61.5%), White / Caucasian (359 | 36.5%), and Two or more Races (11 | 1.1%).
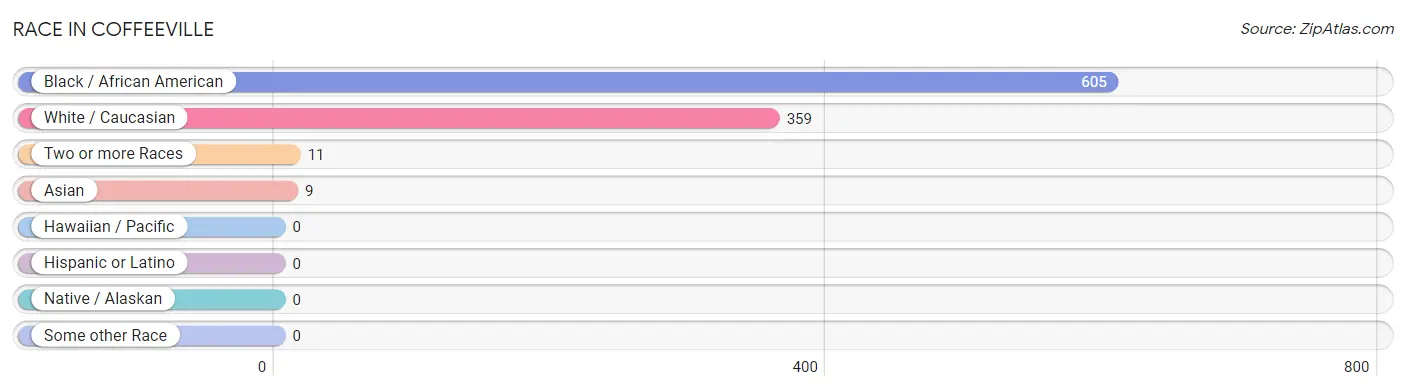
| Race | # Population | % Population |
| Asian | 9 | 0.9% |
| Black / African American | 605 | 61.5% |
| Hawaiian / Pacific | 0 | 0.0% |
| Hispanic or Latino | 0 | 0.0% |
| Native / Alaskan | 0 | 0.0% |
| White / Caucasian | 359 | 36.5% |
| Two or more Races | 11 | 1.1% |
| Some other Race | 0 | 0.0% |
| Total | 984 | 100.0% |
Ancestry in Coffeeville
The most populous ancestries reported in Coffeeville are English (78 | 7.9%), Irish (67 | 6.8%), American (16 | 1.6%), Sri Lankan (9 | 0.9%), and German (6 | 0.6%), together accounting for 17.9% of all Coffeeville residents.
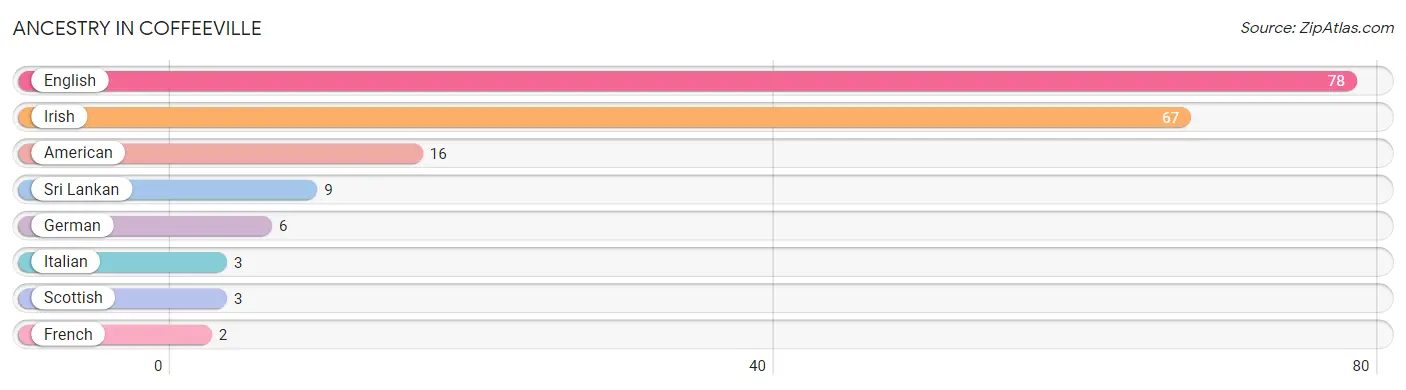
| Ancestry | # Population | % Population |
| American | 16 | 1.6% |
| English | 78 | 7.9% |
| French | 2 | 0.2% |
| German | 6 | 0.6% |
| Irish | 67 | 6.8% |
| Italian | 3 | 0.3% |
| Scottish | 3 | 0.3% |
| Sri Lankan | 9 | 0.9% | View All 8 Rows |
Immigrants in Coffeeville
The most numerous immigrant groups reported in Coffeeville came from Asia (9 | 0.9%), South Eastern Asia (9 | 0.9%), and Vietnam (9 | 0.9%), together accounting for 2.7% of all Coffeeville residents.
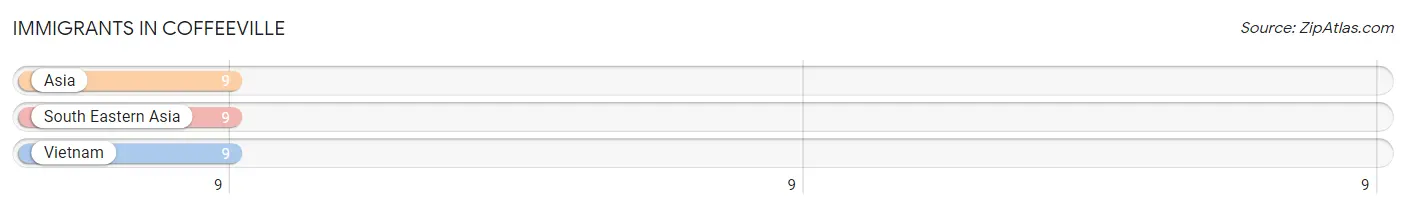
| Immigration Origin | # Population | % Population |
| Asia | 9 | 0.9% |
| South Eastern Asia | 9 | 0.9% |
| Vietnam | 9 | 0.9% | View All 3 Rows |
Sex and Age in Coffeeville
Sex and Age in Coffeeville
The most populous age groups in Coffeeville are 10 to 14 Years (65 | 13.4%) for men and 15 to 19 Years (89 | 17.9%) for women.
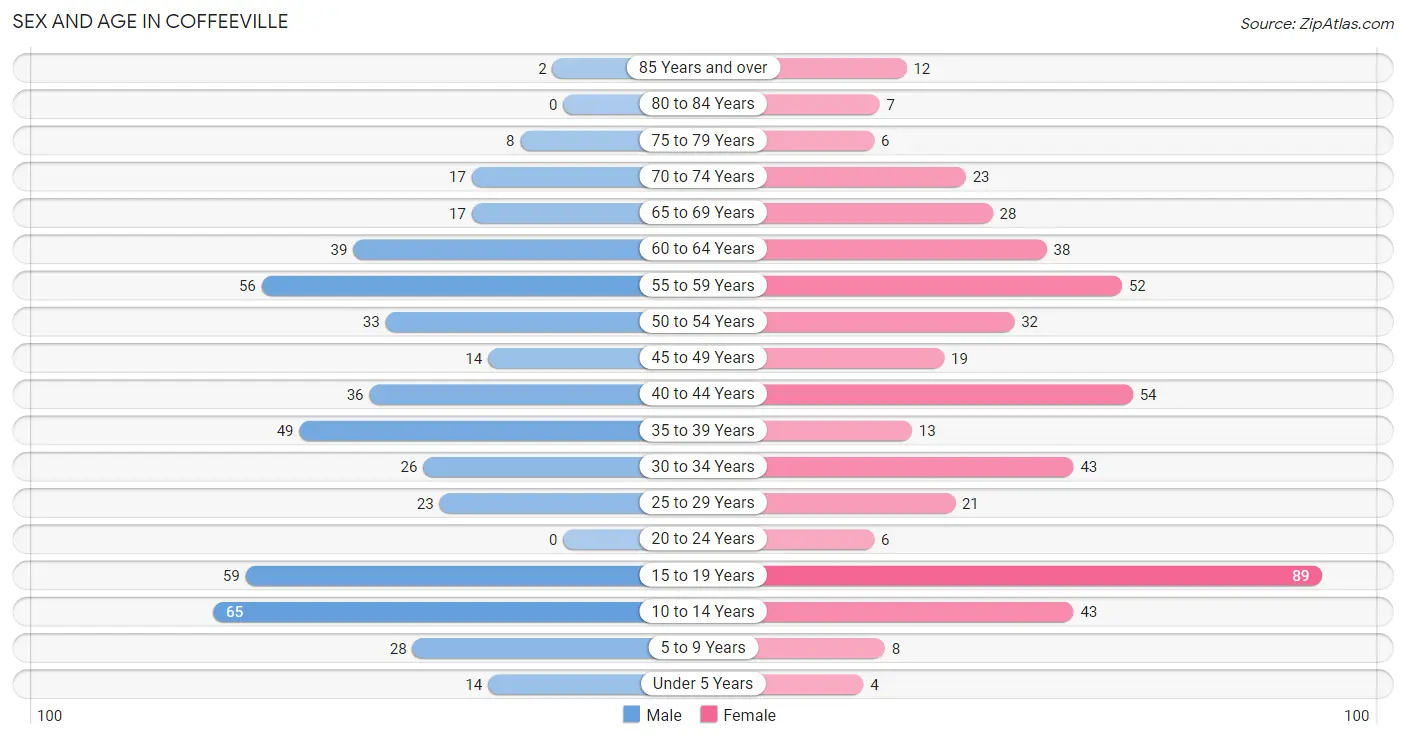
| Age Bracket | Male | Female |
| Under 5 Years | 14 (2.9%) | 4 (0.8%) |
| 5 to 9 Years | 28 (5.8%) | 8 (1.6%) |
| 10 to 14 Years | 65 (13.4%) | 43 (8.6%) |
| 15 to 19 Years | 59 (12.1%) | 89 (17.9%) |
| 20 to 24 Years | 0 (0.0%) | 6 (1.2%) |
| 25 to 29 Years | 23 (4.7%) | 21 (4.2%) |
| 30 to 34 Years | 26 (5.3%) | 43 (8.6%) |
| 35 to 39 Years | 49 (10.1%) | 13 (2.6%) |
| 40 to 44 Years | 36 (7.4%) | 54 (10.8%) |
| 45 to 49 Years | 14 (2.9%) | 19 (3.8%) |
| 50 to 54 Years | 33 (6.8%) | 32 (6.4%) |
| 55 to 59 Years | 56 (11.5%) | 52 (10.4%) |
| 60 to 64 Years | 39 (8.0%) | 38 (7.6%) |
| 65 to 69 Years | 17 (3.5%) | 28 (5.6%) |
| 70 to 74 Years | 17 (3.5%) | 23 (4.6%) |
| 75 to 79 Years | 8 (1.7%) | 6 (1.2%) |
| 80 to 84 Years | 0 (0.0%) | 7 (1.4%) |
| 85 Years and over | 2 (0.4%) | 12 (2.4%) |
| Total | 486 (100.0%) | 498 (100.0%) |
Families and Households in Coffeeville
Median Family Size in Coffeeville
The median family size in Coffeeville is 3.42 persons per family, with single female/mother families (106 | 49.3%) accounting for the largest median family size of 3.96 persons per family. On the other hand, single male/father families (12 | 5.6%) represent the smallest median family size with 2.25 persons per family.
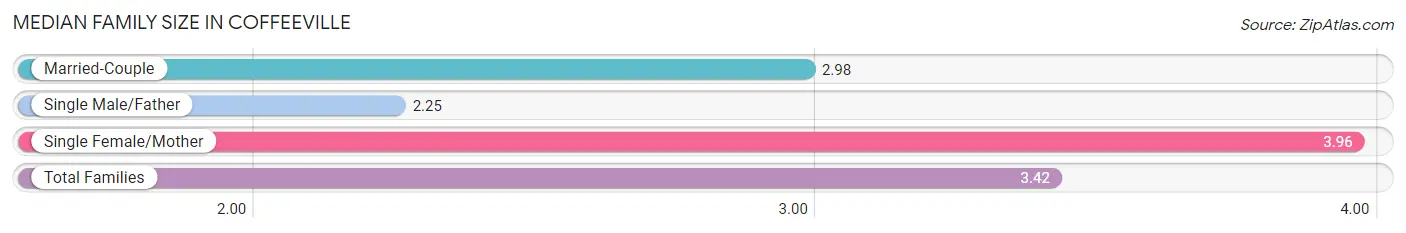
| Family Type | # Families | Family Size |
| Married-Couple | 97 (45.1%) | 2.98 |
| Single Male/Father | 12 (5.6%) | 2.25 |
| Single Female/Mother | 106 (49.3%) | 3.96 |
| Total Families | 215 (100.0%) | 3.42 |
Median Household Size in Coffeeville
The median household size in Coffeeville is 2.41 persons per household, with single female/mother households (106 | 25.9%) accounting for the largest median household size of 4.16 persons per household. non-family households (194 | 47.4%) represent the smallest median household size with 1.13 persons per household.
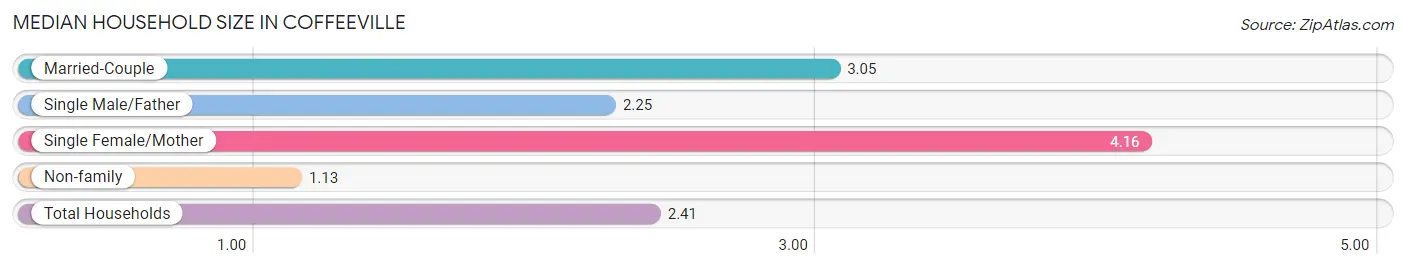
| Household Type | # Households | Household Size |
| Married-Couple | 97 (23.7%) | 3.05 |
| Single Male/Father | 12 (2.9%) | 2.25 |
| Single Female/Mother | 106 (25.9%) | 4.16 |
| Non-family | 194 (47.4%) | 1.13 |
| Total Households | 409 (100.0%) | 2.41 |
Household Size by Marriage Status in Coffeeville
Out of a total of 409 households in Coffeeville, 215 (52.6%) are family households, while 194 (47.4%) are nonfamily households. The most numerous type of family households are 2-person households, comprising 115, and the most common type of nonfamily households are 1-person households, comprising 174.
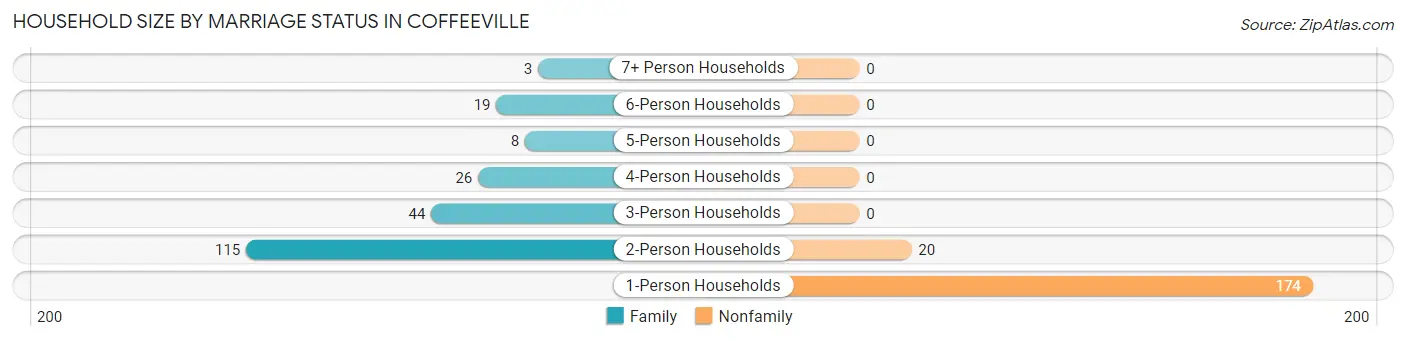
| Household Size | Family Households | Nonfamily Households |
| 1-Person Households | - | 174 (42.5%) |
| 2-Person Households | 115 (28.1%) | 20 (4.9%) |
| 3-Person Households | 44 (10.8%) | 0 (0.0%) |
| 4-Person Households | 26 (6.4%) | 0 (0.0%) |
| 5-Person Households | 8 (2.0%) | 0 (0.0%) |
| 6-Person Households | 19 (4.6%) | 0 (0.0%) |
| 7+ Person Households | 3 (0.7%) | 0 (0.0%) |
| Total | 215 (52.6%) | 194 (47.4%) |
Female Fertility in Coffeeville
Fertility by Age in Coffeeville
Average fertility rate in Coffeeville is 12.0 births per 1,000 women. Women in the age bracket of 35 to 50 years have the highest fertility rate with 31.0 births per 1,000 women. Women in the age bracket of 35 to 50 years acount for 100.0% of all women with births.
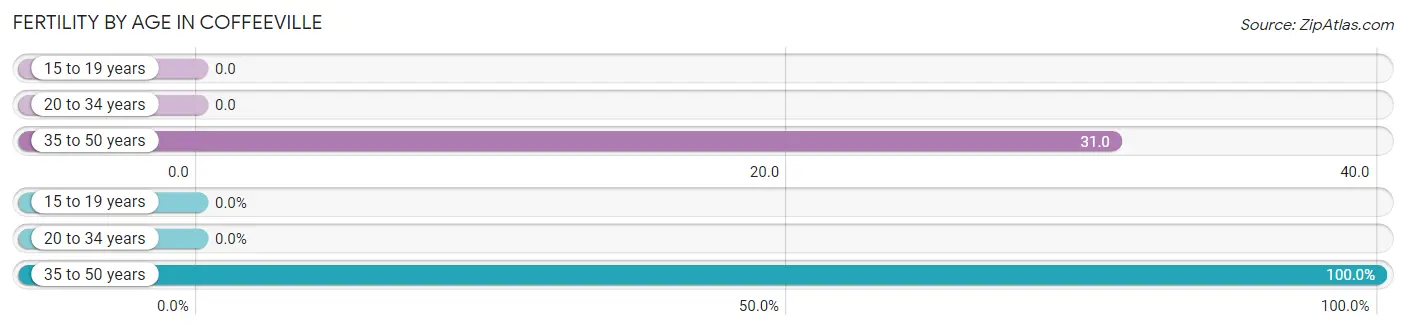
| Age Bracket | Women with Births | Births / 1,000 Women |
| 15 to 19 years | 0 (0.0%) | 0.0 |
| 20 to 34 years | 0 (0.0%) | 0.0 |
| 35 to 50 years | 3 (100.0%) | 31.0 |
| Total | 3 (100.0%) | 12.0 |
Fertility by Age by Marriage Status in Coffeeville
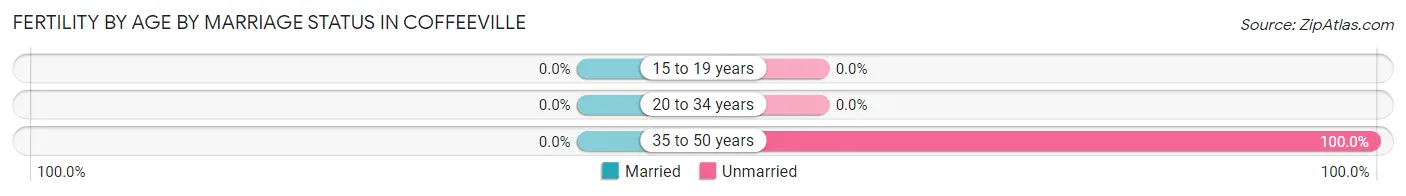
| Age Bracket | Married | Unmarried |
| 15 to 19 years | 0 (0.0%) | 0 (0.0%) |
| 20 to 34 years | 0 (0.0%) | 0 (0.0%) |
| 35 to 50 years | 0 (0.0%) | 3 (100.0%) |
| Total | 0 (0.0%) | 3 (100.0%) |
Fertility by Education in Coffeeville
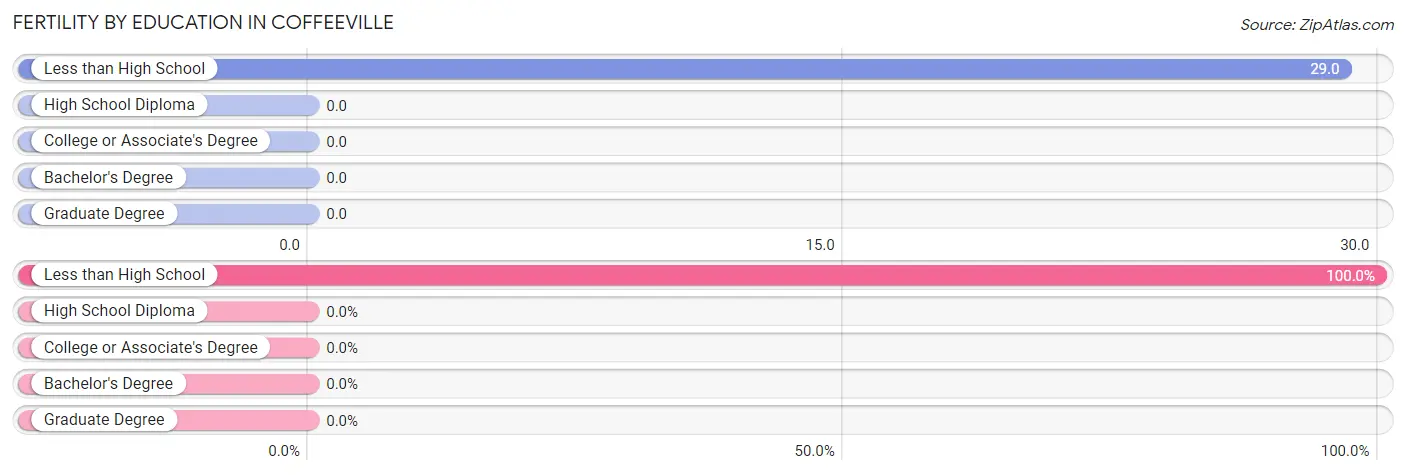
| Educational Attainment | Women with Births | Births / 1,000 Women |
| Less than High School | 3 (100.0%) | 29.0 |
| High School Diploma | 0 (0.0%) | 0.0 |
| College or Associate's Degree | 0 (0.0%) | 0.0 |
| Bachelor's Degree | 0 (0.0%) | 0.0 |
| Graduate Degree | 0 (0.0%) | 0.0 |
| Total | 3 (100.0%) | 12.0 |
Fertility by Education by Marriage Status in Coffeeville
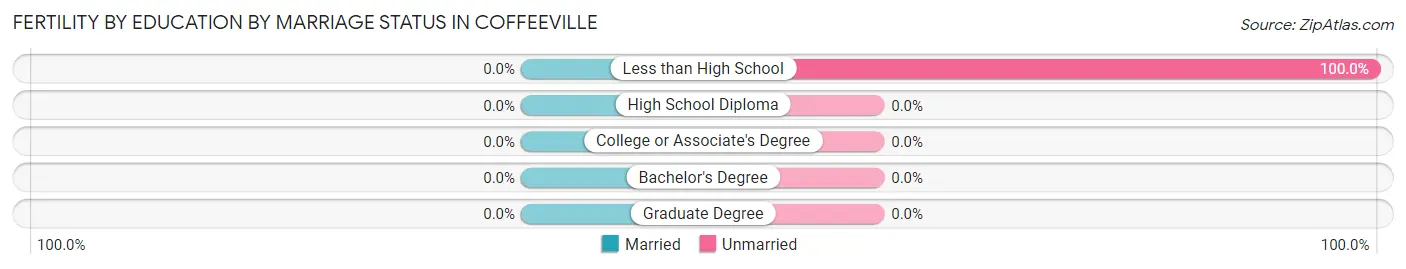
| Educational Attainment | Married | Unmarried |
| Less than High School | 0 (0.0%) | 3 (100.0%) |
| High School Diploma | 0 (0.0%) | 0 (0.0%) |
| College or Associate's Degree | 0 (0.0%) | 0 (0.0%) |
| Bachelor's Degree | 0 (0.0%) | 0 (0.0%) |
| Graduate Degree | 0 (0.0%) | 0 (0.0%) |
| Total | 0 (0.0%) | 3 (100.0%) |
Employment Characteristics in Coffeeville
Employment by Class of Employer in Coffeeville
Among the 321 employed individuals in Coffeeville, private company employees (212 | 66.0%), state government employees (49 | 15.3%), and self-employed (not incorporated) (33 | 10.3%) make up the most common classes of employment.
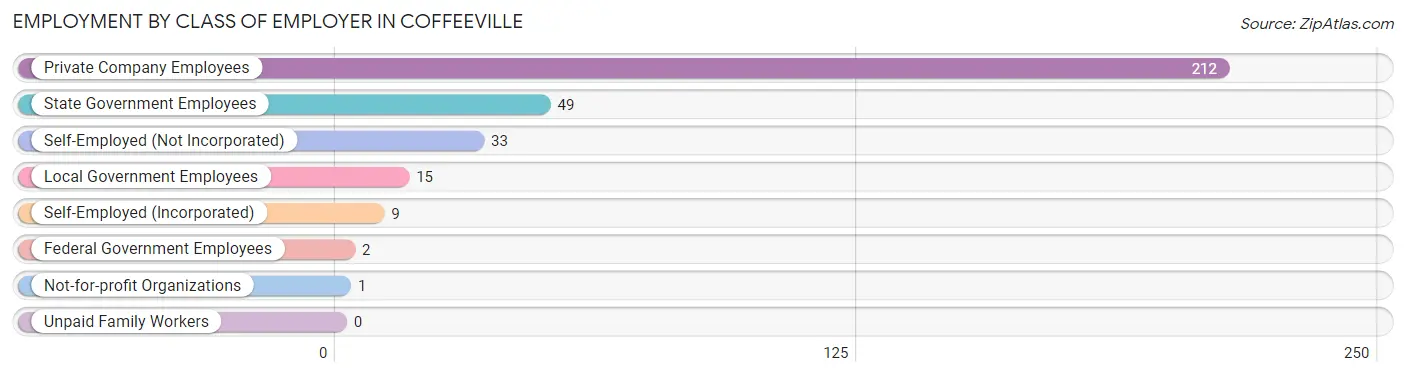
| Employer Class | # Employees | % Employees |
| Private Company Employees | 212 | 66.0% |
| Self-Employed (Incorporated) | 9 | 2.8% |
| Self-Employed (Not Incorporated) | 33 | 10.3% |
| Not-for-profit Organizations | 1 | 0.3% |
| Local Government Employees | 15 | 4.7% |
| State Government Employees | 49 | 15.3% |
| Federal Government Employees | 2 | 0.6% |
| Unpaid Family Workers | 0 | 0.0% |
| Total | 321 | 100.0% |
Employment Status by Age in Coffeeville
According to the labor force statistics for Coffeeville, out of the total population over 16 years of age (758), 43.8% or 332 individuals are in the labor force, with 3.3% or 11 of them unemployed. The age group with the highest labor force participation rate is 20 to 24 years, with 100.0% or 6 individuals in the labor force. Within the labor force, the 20 to 24 years age range has the highest percentage of unemployed individuals, with 33.3% or 2 of them being unemployed.
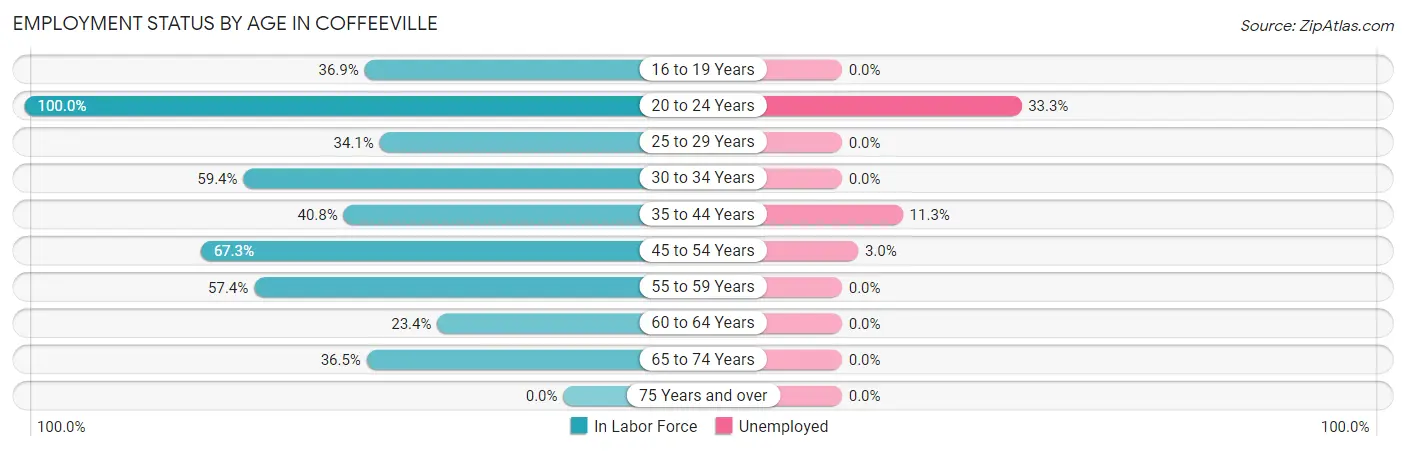
| Age Bracket | In Labor Force | Unemployed |
| 16 to 19 Years | 31 (36.9%) | 0 (0.0%) |
| 20 to 24 Years | 6 (100.0%) | 2 (33.3%) |
| 25 to 29 Years | 15 (34.1%) | 0 (0.0%) |
| 30 to 34 Years | 41 (59.4%) | 0 (0.0%) |
| 35 to 44 Years | 62 (40.8%) | 7 (11.3%) |
| 45 to 54 Years | 66 (67.3%) | 2 (3.0%) |
| 55 to 59 Years | 62 (57.4%) | 0 (0.0%) |
| 60 to 64 Years | 18 (23.4%) | 0 (0.0%) |
| 65 to 74 Years | 31 (36.5%) | 0 (0.0%) |
| 75 Years and over | 0 (0.0%) | 0 (0.0%) |
| Total | 332 (43.8%) | 11 (3.3%) |
Employment Status by Educational Attainment in Coffeeville
According to labor force statistics for Coffeeville, 48.2% of individuals (264) out of the total population between 25 and 64 years of age (548) are in the labor force, with 3.4% or 9 of them being unemployed. The group with the highest labor force participation rate are those with the educational attainment of bachelor's degree or higher, with 79.5% or 35 individuals in the labor force. Within the labor force, individuals with college / associate degree education have the highest percentage of unemployment, with 11.1% or 7 of them being unemployed.
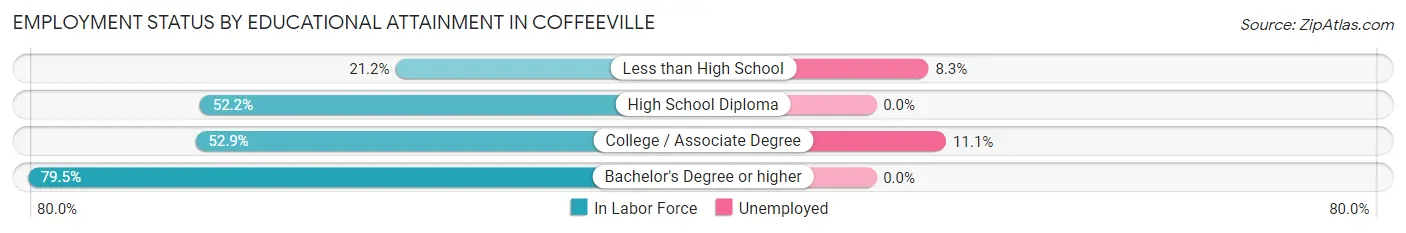
| Educational Attainment | In Labor Force | Unemployed |
| Less than High School | 24 (21.2%) | 9 (8.3%) |
| High School Diploma | 142 (52.2%) | 0 (0.0%) |
| College / Associate Degree | 63 (52.9%) | 13 (11.1%) |
| Bachelor's Degree or higher | 35 (79.5%) | 0 (0.0%) |
| Total | 264 (48.2%) | 19 (3.4%) |
Employment Occupations by Sex in Coffeeville
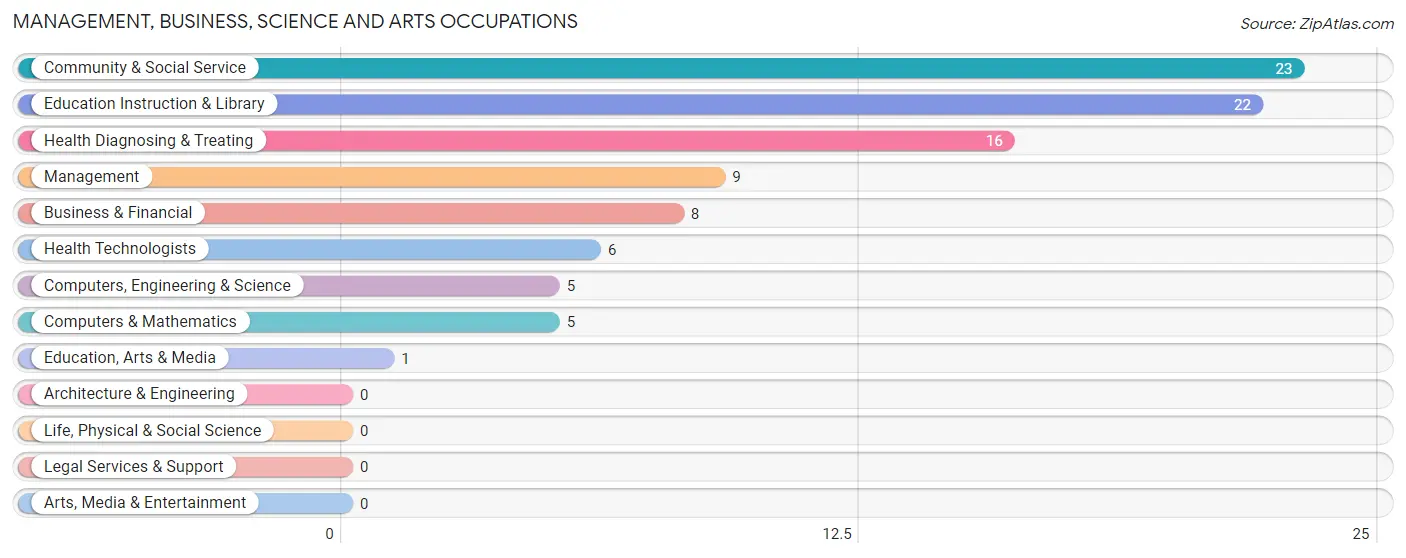
Management, Business, Science and Arts Occupations
The most common Management, Business, Science and Arts occupations in Coffeeville are Community & Social Service (23 | 7.2%), Education Instruction & Library (22 | 6.9%), Health Diagnosing & Treating (16 | 5.0%), Management (9 | 2.8%), and Business & Financial (8 | 2.5%).
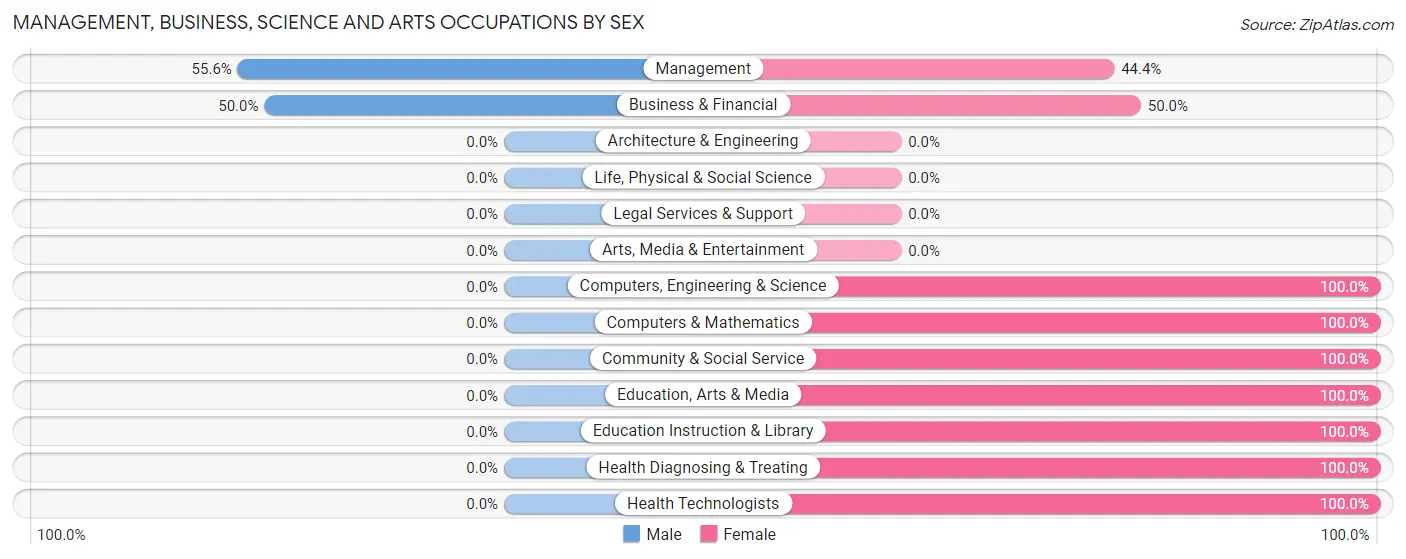
Management, Business, Science and Arts Occupations by Sex
Within the Management, Business, Science and Arts occupations in Coffeeville, the most male-oriented occupations are Management (55.6%), and Business & Financial (50.0%), while the most female-oriented occupations are Computers, Engineering & Science (100.0%), Computers & Mathematics (100.0%), and Community & Social Service (100.0%).
| Occupation | Male | Female |
| Management | 5 (55.6%) | 4 (44.4%) |
| Business & Financial | 4 (50.0%) | 4 (50.0%) |
| Computers, Engineering & Science | 0 (0.0%) | 5 (100.0%) |
| Computers & Mathematics | 0 (0.0%) | 5 (100.0%) |
| Architecture & Engineering | 0 (0.0%) | 0 (0.0%) |
| Life, Physical & Social Science | 0 (0.0%) | 0 (0.0%) |
| Community & Social Service | 0 (0.0%) | 23 (100.0%) |
| Education, Arts & Media | 0 (0.0%) | 1 (100.0%) |
| Legal Services & Support | 0 (0.0%) | 0 (0.0%) |
| Education Instruction & Library | 0 (0.0%) | 22 (100.0%) |
| Arts, Media & Entertainment | 0 (0.0%) | 0 (0.0%) |
| Health Diagnosing & Treating | 0 (0.0%) | 16 (100.0%) |
| Health Technologists | 0 (0.0%) | 6 (100.0%) |
| Total (Category) | 9 (14.7%) | 52 (85.3%) |
| Total (Overall) | 139 (43.3%) | 182 (56.7%) |
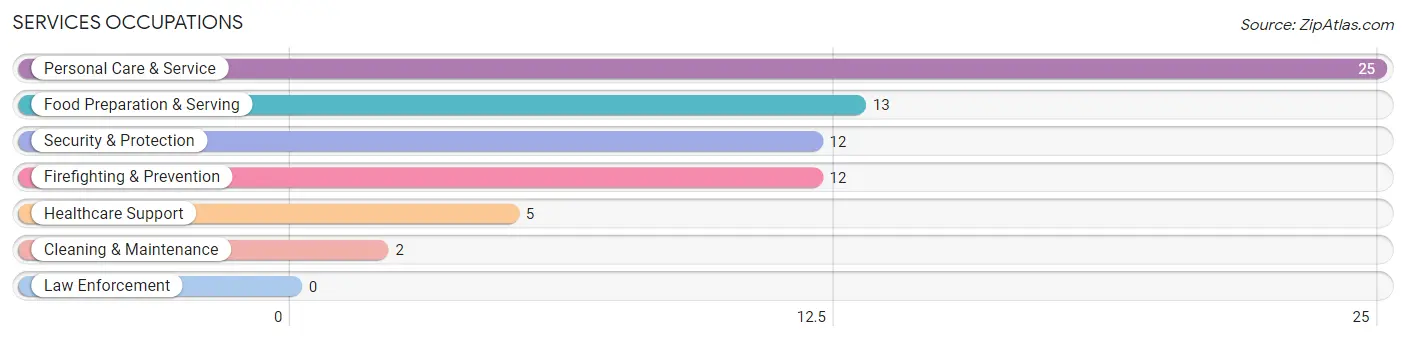
Services Occupations
The most common Services occupations in Coffeeville are Personal Care & Service (25 | 7.8%), Food Preparation & Serving (13 | 4.1%), Security & Protection (12 | 3.7%), Firefighting & Prevention (12 | 3.7%), and Healthcare Support (5 | 1.6%).
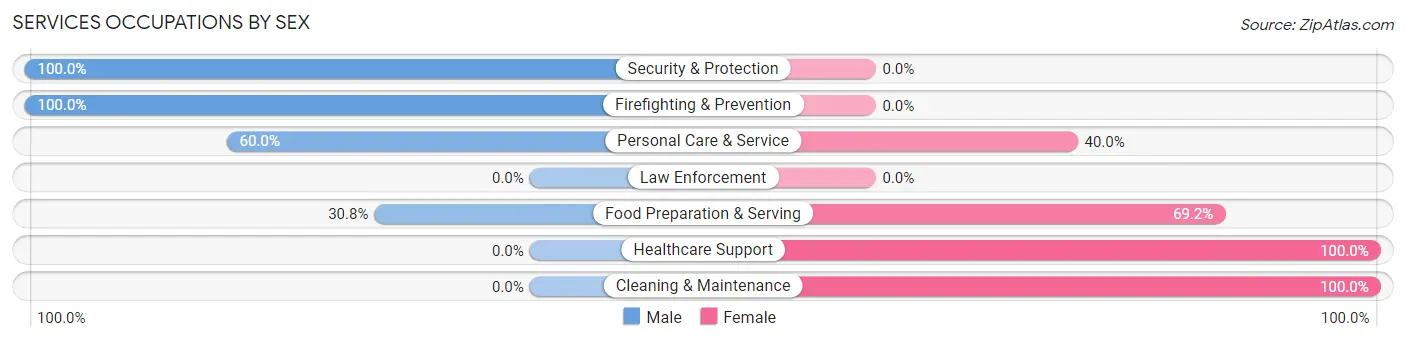
Services Occupations by Sex
Within the Services occupations in Coffeeville, the most male-oriented occupations are Security & Protection (100.0%), Firefighting & Prevention (100.0%), and Personal Care & Service (60.0%), while the most female-oriented occupations are Healthcare Support (100.0%), Cleaning & Maintenance (100.0%), and Food Preparation & Serving (69.2%).
| Occupation | Male | Female |
| Healthcare Support | 0 (0.0%) | 5 (100.0%) |
| Security & Protection | 12 (100.0%) | 0 (0.0%) |
| Firefighting & Prevention | 12 (100.0%) | 0 (0.0%) |
| Law Enforcement | 0 (0.0%) | 0 (0.0%) |
| Food Preparation & Serving | 4 (30.8%) | 9 (69.2%) |
| Cleaning & Maintenance | 0 (0.0%) | 2 (100.0%) |
| Personal Care & Service | 15 (60.0%) | 10 (40.0%) |
| Total (Category) | 31 (54.4%) | 26 (45.6%) |
| Total (Overall) | 139 (43.3%) | 182 (56.7%) |
Sales and Office Occupations
The most common Sales and Office occupations in Coffeeville are Office & Administration (25 | 7.8%), and Sales & Related (12 | 3.7%).
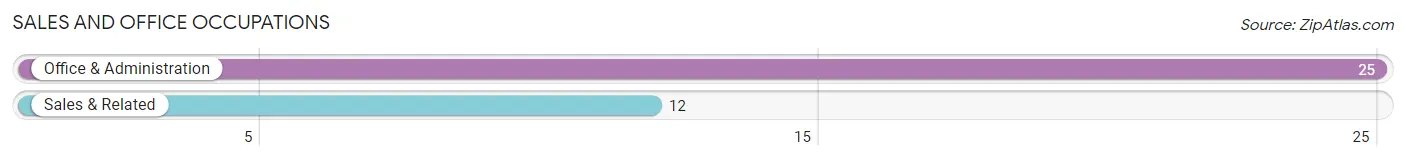
Sales and Office Occupations by Sex
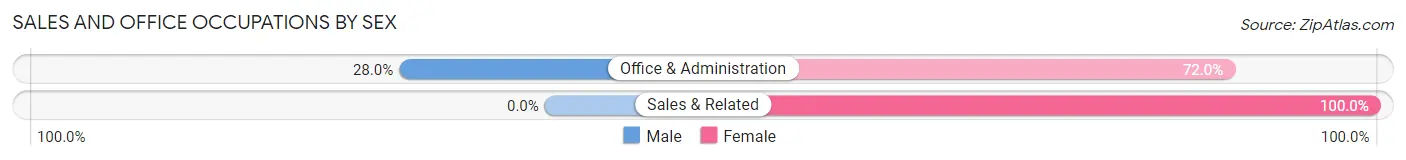
| Occupation | Male | Female |
| Sales & Related | 0 (0.0%) | 12 (100.0%) |
| Office & Administration | 7 (28.0%) | 18 (72.0%) |
| Total (Category) | 7 (18.9%) | 30 (81.1%) |
| Total (Overall) | 139 (43.3%) | 182 (56.7%) |
Natural Resources, Construction and Maintenance Occupations
The most common Natural Resources, Construction and Maintenance occupations in Coffeeville are Construction & Extraction (13 | 4.1%), and Installation, Maintenance & Repair (13 | 4.1%).
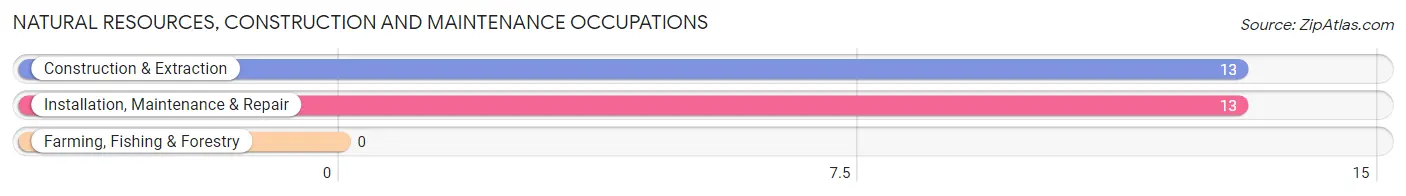
Natural Resources, Construction and Maintenance Occupations by Sex
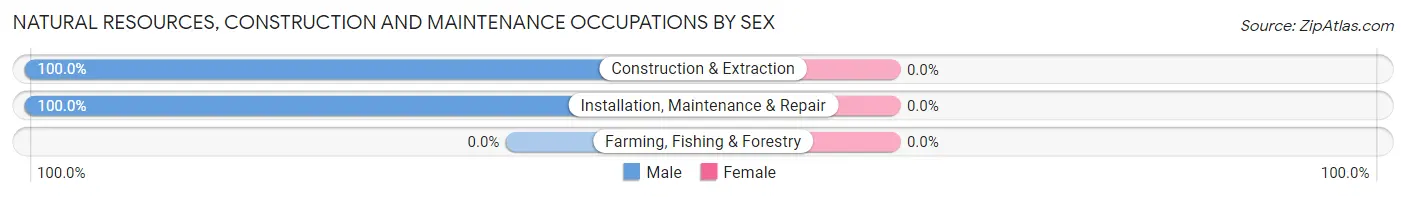
| Occupation | Male | Female |
| Farming, Fishing & Forestry | 0 (0.0%) | 0 (0.0%) |
| Construction & Extraction | 13 (100.0%) | 0 (0.0%) |
| Installation, Maintenance & Repair | 13 (100.0%) | 0 (0.0%) |
| Total (Category) | 26 (100.0%) | 0 (0.0%) |
| Total (Overall) | 139 (43.3%) | 182 (56.7%) |
Production, Transportation and Moving Occupations
The most common Production, Transportation and Moving occupations in Coffeeville are Production (108 | 33.6%), and Transportation (32 | 10.0%).
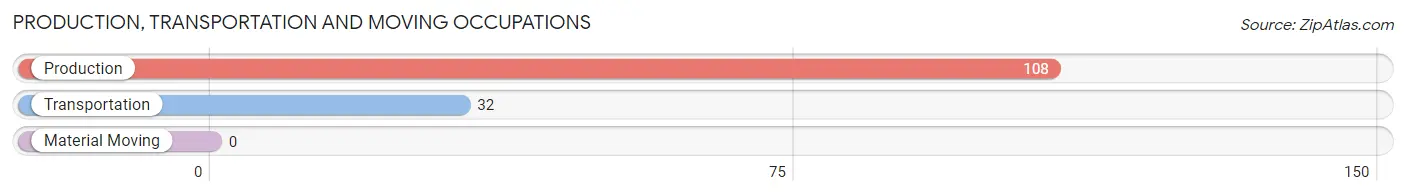
Production, Transportation and Moving Occupations by Sex
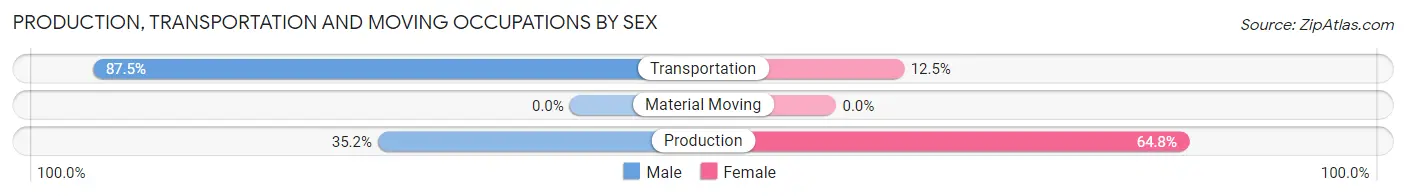
| Occupation | Male | Female |
| Production | 38 (35.2%) | 70 (64.8%) |
| Transportation | 28 (87.5%) | 4 (12.5%) |
| Material Moving | 0 (0.0%) | 0 (0.0%) |
| Total (Category) | 66 (47.1%) | 74 (52.9%) |
| Total (Overall) | 139 (43.3%) | 182 (56.7%) |
Employment Industries by Sex in Coffeeville
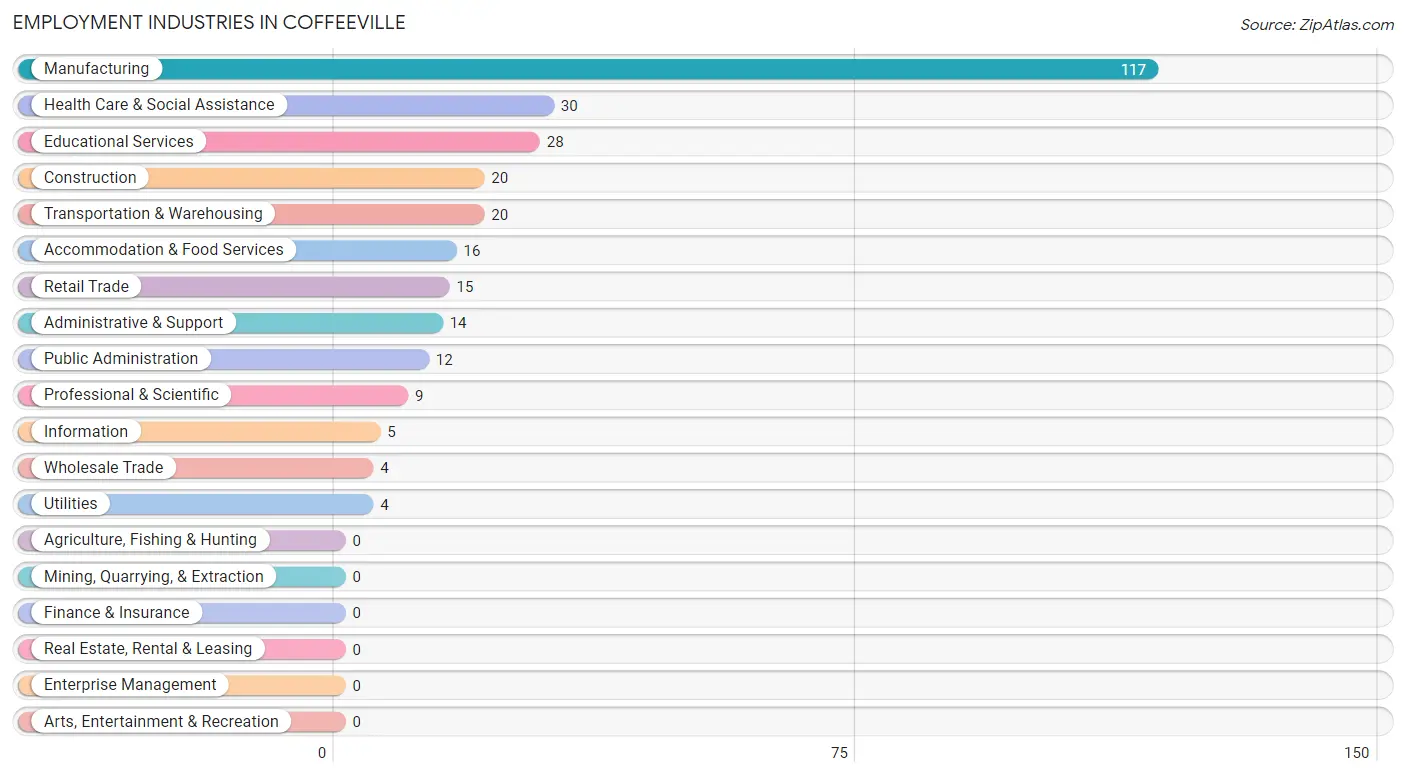
Employment Industries in Coffeeville
The major employment industries in Coffeeville include Manufacturing (117 | 36.4%), Health Care & Social Assistance (30 | 9.3%), Educational Services (28 | 8.7%), Construction (20 | 6.2%), and Transportation & Warehousing (20 | 6.2%).
Employment Industries by Sex in Coffeeville
The Coffeeville industries that see more men than women are Construction (100.0%), Transportation & Warehousing (100.0%), and Information (100.0%), whereas the industries that tend to have a higher number of women are Wholesale Trade (100.0%), Retail Trade (100.0%), and Utilities (100.0%).
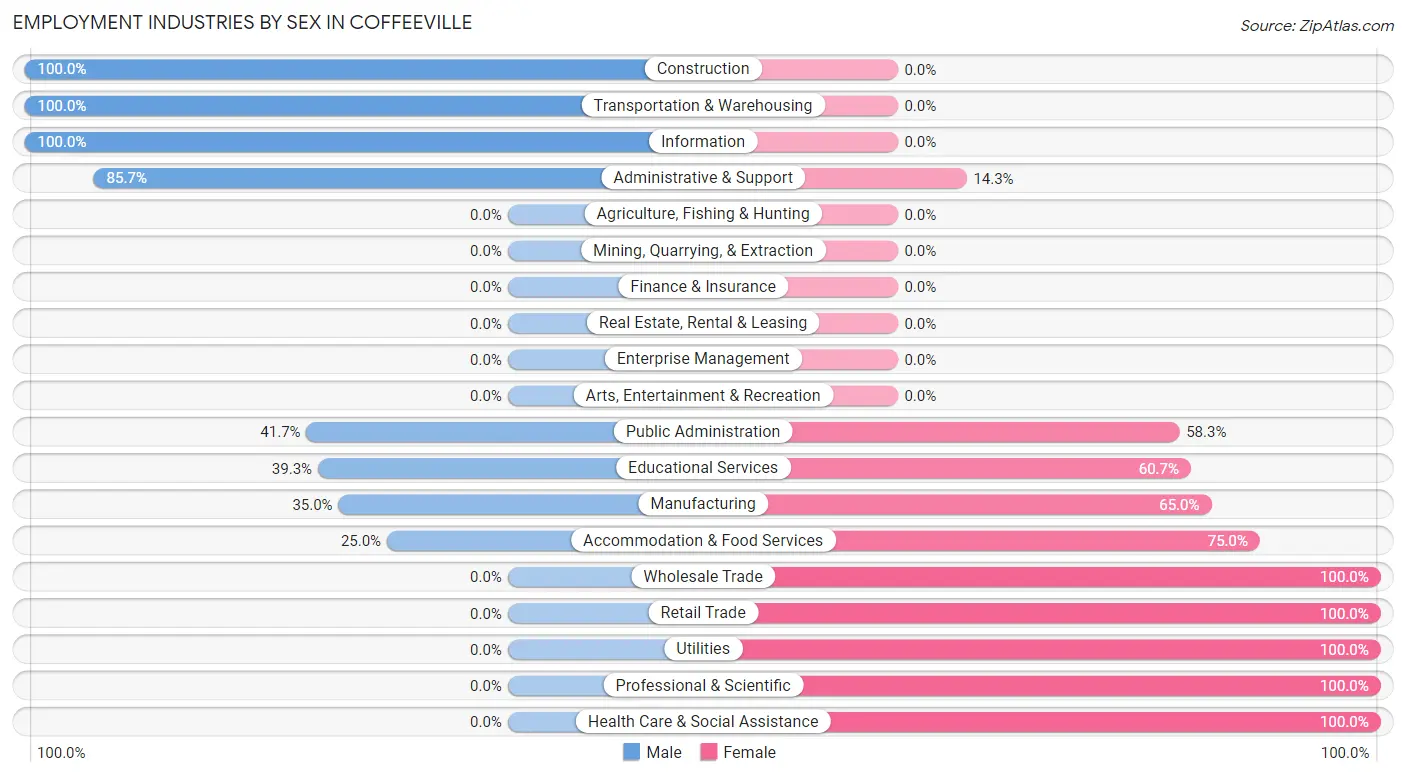
| Industry | Male | Female |
| Agriculture, Fishing & Hunting | 0 (0.0%) | 0 (0.0%) |
| Mining, Quarrying, & Extraction | 0 (0.0%) | 0 (0.0%) |
| Construction | 20 (100.0%) | 0 (0.0%) |
| Manufacturing | 41 (35.0%) | 76 (65.0%) |
| Wholesale Trade | 0 (0.0%) | 4 (100.0%) |
| Retail Trade | 0 (0.0%) | 15 (100.0%) |
| Transportation & Warehousing | 20 (100.0%) | 0 (0.0%) |
| Utilities | 0 (0.0%) | 4 (100.0%) |
| Information | 5 (100.0%) | 0 (0.0%) |
| Finance & Insurance | 0 (0.0%) | 0 (0.0%) |
| Real Estate, Rental & Leasing | 0 (0.0%) | 0 (0.0%) |
| Professional & Scientific | 0 (0.0%) | 9 (100.0%) |
| Enterprise Management | 0 (0.0%) | 0 (0.0%) |
| Administrative & Support | 12 (85.7%) | 2 (14.3%) |
| Educational Services | 11 (39.3%) | 17 (60.7%) |
| Health Care & Social Assistance | 0 (0.0%) | 30 (100.0%) |
| Arts, Entertainment & Recreation | 0 (0.0%) | 0 (0.0%) |
| Accommodation & Food Services | 4 (25.0%) | 12 (75.0%) |
| Public Administration | 5 (41.7%) | 7 (58.3%) |
| Total | 139 (43.3%) | 182 (56.7%) |
Education in Coffeeville
School Enrollment in Coffeeville
The most common levels of schooling among the 278 students in Coffeeville are middle school (124 | 44.6%), high school (74 | 26.6%), and elementary school (52 | 18.7%).
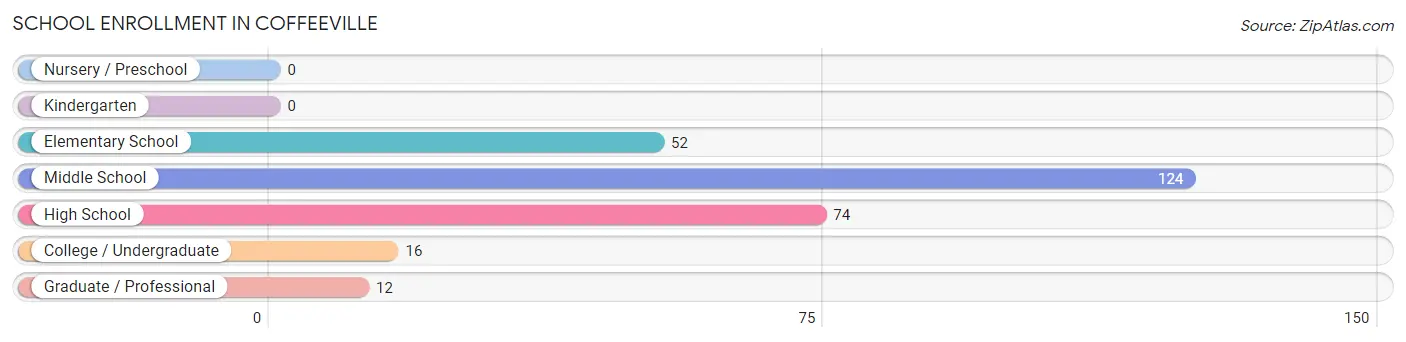
| School Level | # Students | % Students |
| Nursery / Preschool | 0 | 0.0% |
| Kindergarten | 0 | 0.0% |
| Elementary School | 52 | 18.7% |
| Middle School | 124 | 44.6% |
| High School | 74 | 26.6% |
| College / Undergraduate | 16 | 5.8% |
| Graduate / Professional | 12 | 4.3% |
| Total | 278 | 100.0% |
School Enrollment by Age by Funding Source in Coffeeville
Out of a total of 278 students who are enrolled in schools in Coffeeville, 31 (11.2%) attend a private institution, while the remaining 247 (88.8%) are enrolled in public schools. The age group of 10 to 14 year olds has the highest likelihood of being enrolled in private schools, with 25 (23.2% in the age bracket) enrolled. Conversely, the age group of 5 to 9 year old has the lowest likelihood of being enrolled in a private school, with 30 (100.0% in the age bracket) attending a public institution.
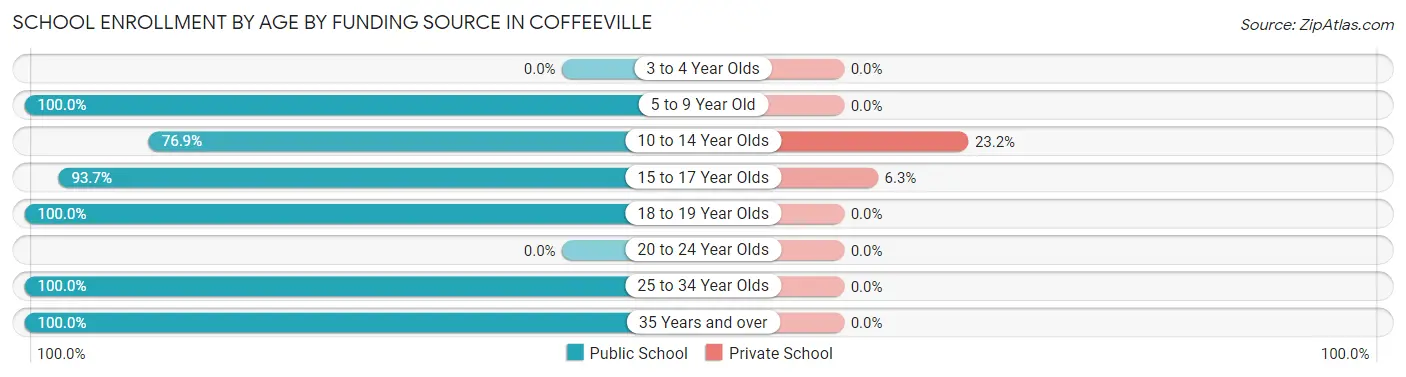
| Age Bracket | Public School | Private School |
| 3 to 4 Year Olds | 0 (0.0%) | 0 (0.0%) |
| 5 to 9 Year Old | 30 (100.0%) | 0 (0.0%) |
| 10 to 14 Year Olds | 83 (76.8%) | 25 (23.2%) |
| 15 to 17 Year Olds | 89 (93.7%) | 6 (6.3%) |
| 18 to 19 Year Olds | 22 (100.0%) | 0 (0.0%) |
| 20 to 24 Year Olds | 0 (0.0%) | 0 (0.0%) |
| 25 to 34 Year Olds | 16 (100.0%) | 0 (0.0%) |
| 35 Years and over | 7 (100.0%) | 0 (0.0%) |
| Total | 247 (88.8%) | 31 (11.2%) |
Educational Attainment by Field of Study in Coffeeville
Education (16 | 25.0%), science & technology (15 | 23.4%), psychology (7 | 10.9%), business (6 | 9.4%), and bio, nature & agricultural (5 | 7.8%) are the most common fields of study among 64 individuals in Coffeeville who have obtained a bachelor's degree or higher.
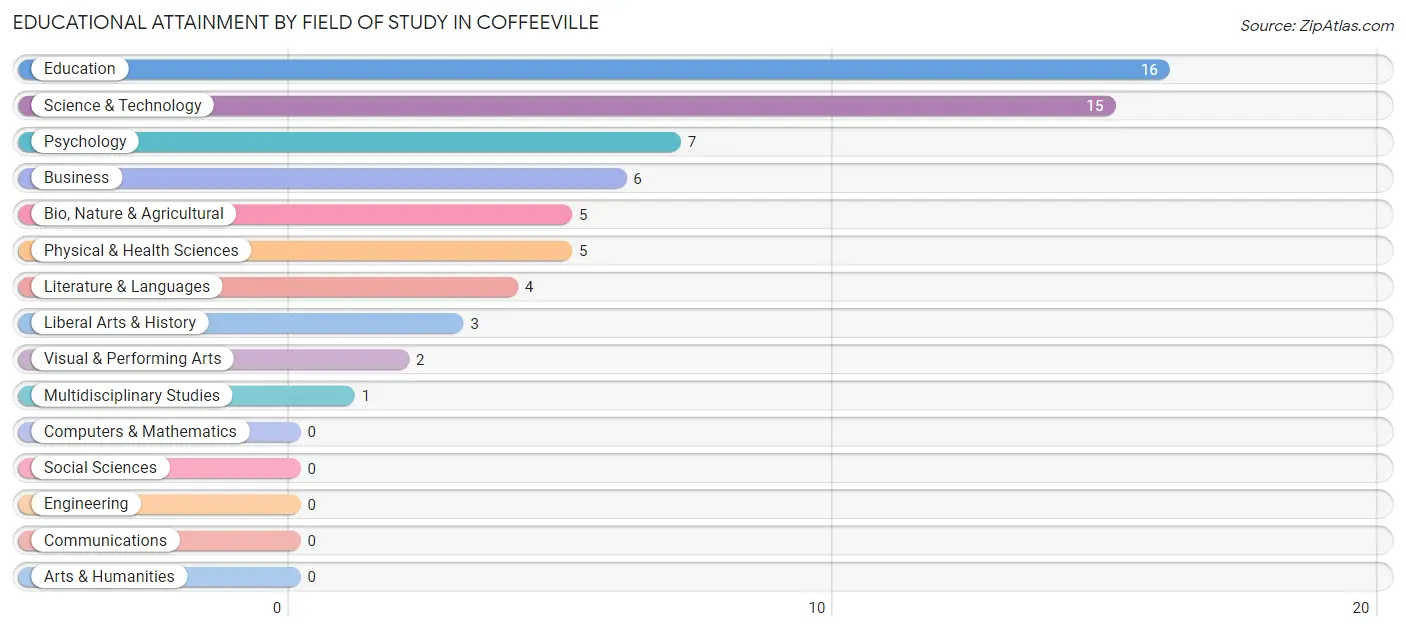
| Field of Study | # Graduates | % Graduates |
| Computers & Mathematics | 0 | 0.0% |
| Bio, Nature & Agricultural | 5 | 7.8% |
| Physical & Health Sciences | 5 | 7.8% |
| Psychology | 7 | 10.9% |
| Social Sciences | 0 | 0.0% |
| Engineering | 0 | 0.0% |
| Multidisciplinary Studies | 1 | 1.6% |
| Science & Technology | 15 | 23.4% |
| Business | 6 | 9.4% |
| Education | 16 | 25.0% |
| Literature & Languages | 4 | 6.2% |
| Liberal Arts & History | 3 | 4.7% |
| Visual & Performing Arts | 2 | 3.1% |
| Communications | 0 | 0.0% |
| Arts & Humanities | 0 | 0.0% |
| Total | 64 | 100.0% |
Transportation & Commute in Coffeeville
Vehicle Availability by Sex in Coffeeville
The most prevalent vehicle ownership categories in Coffeeville are males with 3 vehicles (44, accounting for 31.7%) and females with 3 vehicles (51, making up 24.2%).
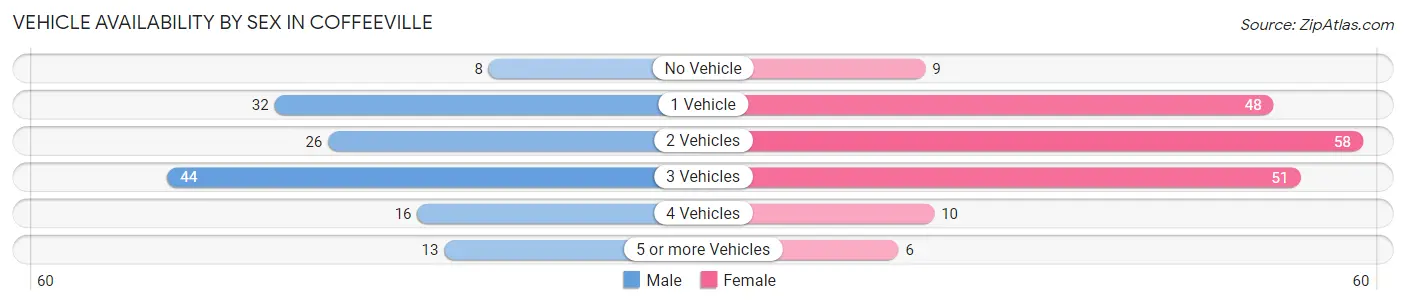
| Vehicles Available | Male | Female |
| No Vehicle | 8 (5.8%) | 9 (5.0%) |
| 1 Vehicle | 32 (23.0%) | 48 (26.4%) |
| 2 Vehicles | 26 (18.7%) | 58 (31.9%) |
| 3 Vehicles | 44 (31.7%) | 51 (28.0%) |
| 4 Vehicles | 16 (11.5%) | 10 (5.5%) |
| 5 or more Vehicles | 13 (9.3%) | 6 (3.3%) |
| Total | 139 (100.0%) | 182 (100.0%) |
Commute Time in Coffeeville
The most frequently occuring commute durations in Coffeeville are 15 to 19 minutes (91 commuters, 28.3%), 30 to 34 minutes (63 commuters, 19.6%), and 5 to 9 minutes (41 commuters, 12.8%).
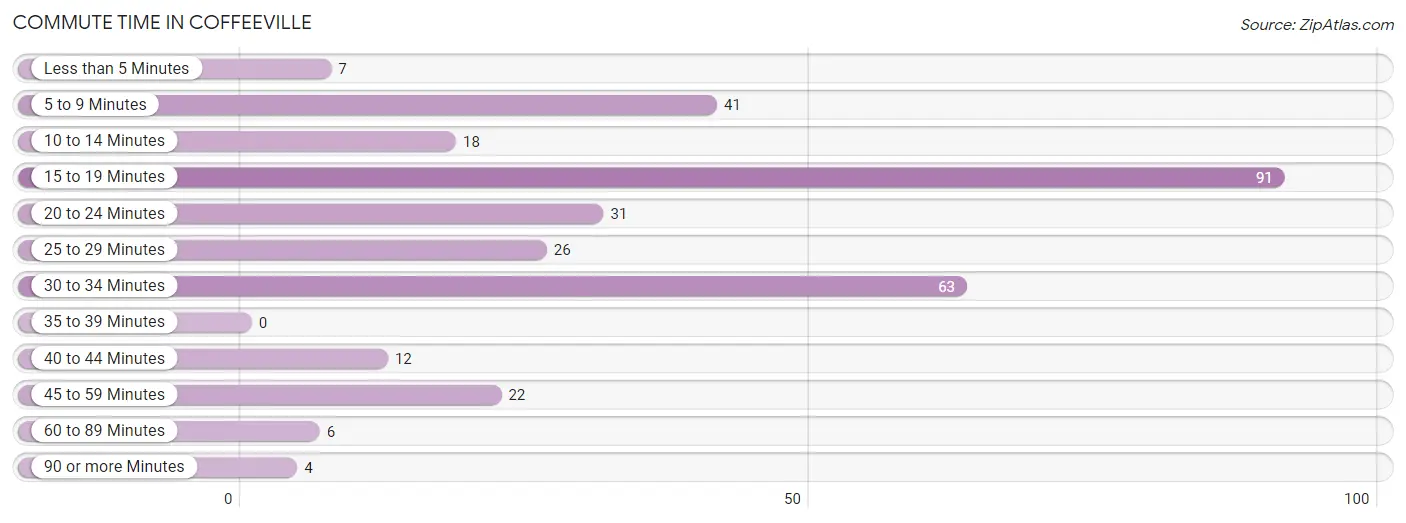
| Commute Time | # Commuters | % Commuters |
| Less than 5 Minutes | 7 | 2.2% |
| 5 to 9 Minutes | 41 | 12.8% |
| 10 to 14 Minutes | 18 | 5.6% |
| 15 to 19 Minutes | 91 | 28.3% |
| 20 to 24 Minutes | 31 | 9.7% |
| 25 to 29 Minutes | 26 | 8.1% |
| 30 to 34 Minutes | 63 | 19.6% |
| 35 to 39 Minutes | 0 | 0.0% |
| 40 to 44 Minutes | 12 | 3.7% |
| 45 to 59 Minutes | 22 | 6.9% |
| 60 to 89 Minutes | 6 | 1.9% |
| 90 or more Minutes | 4 | 1.3% |
Commute Time by Sex in Coffeeville
The most common commute times in Coffeeville are 30 to 34 minutes (44 commuters, 31.7%) for males and 15 to 19 minutes (58 commuters, 31.9%) for females.
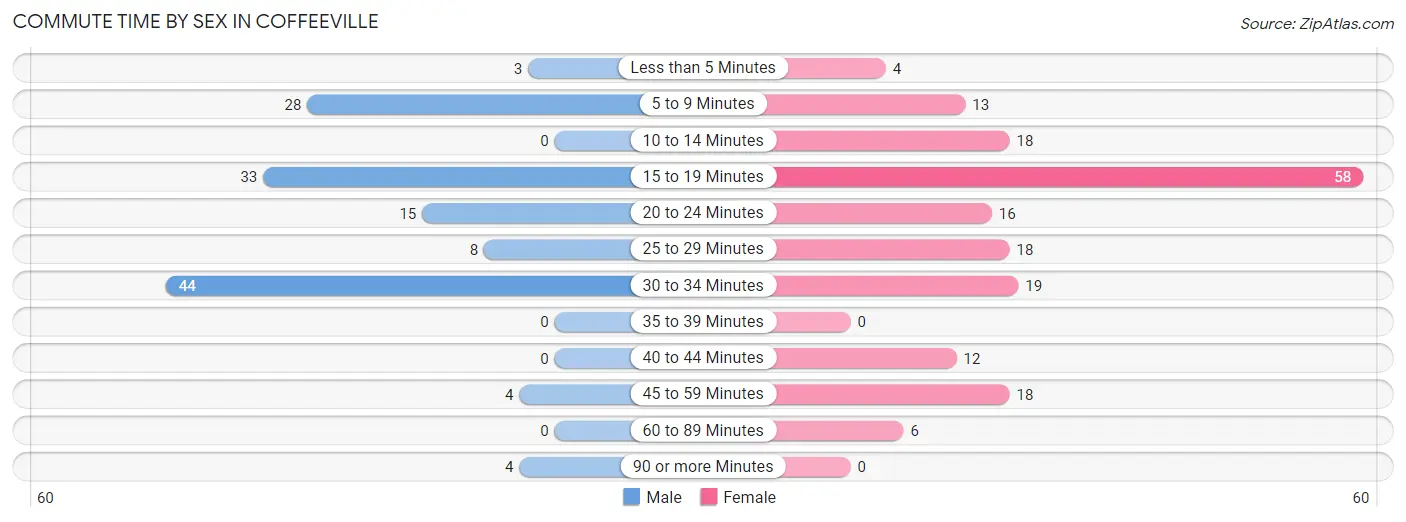
| Commute Time | Male | Female |
| Less than 5 Minutes | 3 (2.2%) | 4 (2.2%) |
| 5 to 9 Minutes | 28 (20.1%) | 13 (7.1%) |
| 10 to 14 Minutes | 0 (0.0%) | 18 (9.9%) |
| 15 to 19 Minutes | 33 (23.7%) | 58 (31.9%) |
| 20 to 24 Minutes | 15 (10.8%) | 16 (8.8%) |
| 25 to 29 Minutes | 8 (5.8%) | 18 (9.9%) |
| 30 to 34 Minutes | 44 (31.7%) | 19 (10.4%) |
| 35 to 39 Minutes | 0 (0.0%) | 0 (0.0%) |
| 40 to 44 Minutes | 0 (0.0%) | 12 (6.6%) |
| 45 to 59 Minutes | 4 (2.9%) | 18 (9.9%) |
| 60 to 89 Minutes | 0 (0.0%) | 6 (3.3%) |
| 90 or more Minutes | 4 (2.9%) | 0 (0.0%) |
Time of Departure to Work by Sex in Coffeeville
The most frequent times of departure to work in Coffeeville are 6:30 AM to 6:59 AM (28, 20.1%) for males and 5:30 AM to 5:59 AM (49, 26.9%) for females.
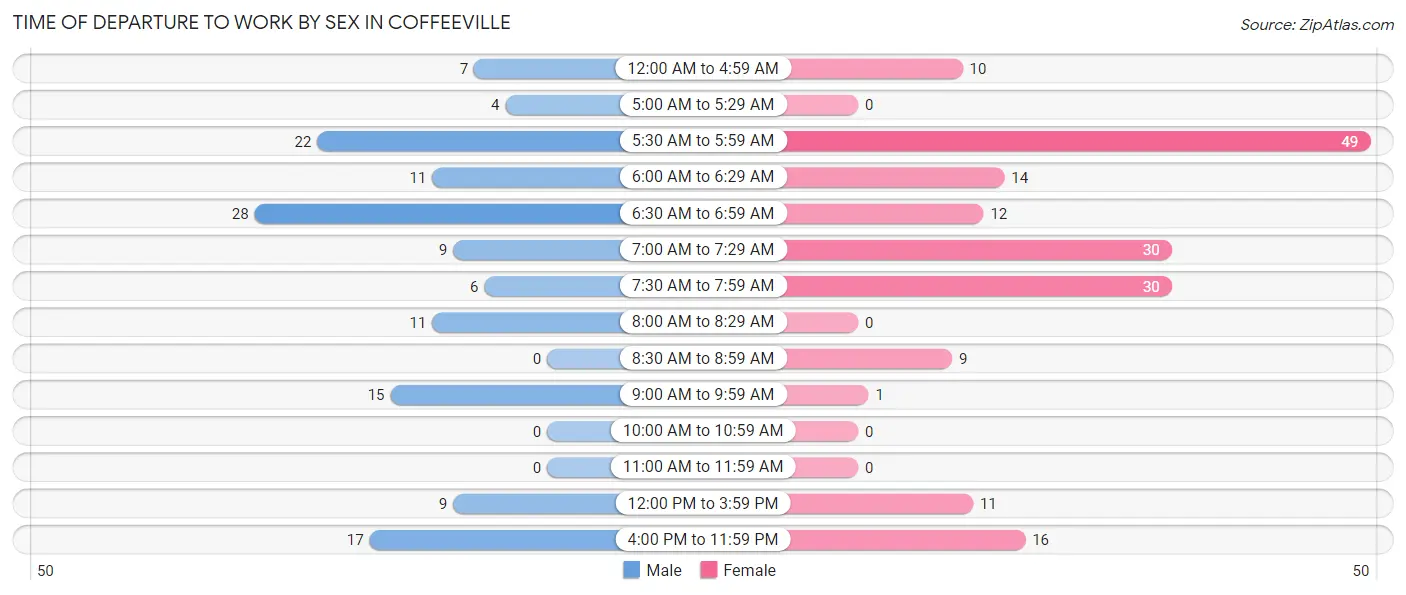
| Time of Departure | Male | Female |
| 12:00 AM to 4:59 AM | 7 (5.0%) | 10 (5.5%) |
| 5:00 AM to 5:29 AM | 4 (2.9%) | 0 (0.0%) |
| 5:30 AM to 5:59 AM | 22 (15.8%) | 49 (26.9%) |
| 6:00 AM to 6:29 AM | 11 (7.9%) | 14 (7.7%) |
| 6:30 AM to 6:59 AM | 28 (20.1%) | 12 (6.6%) |
| 7:00 AM to 7:29 AM | 9 (6.5%) | 30 (16.5%) |
| 7:30 AM to 7:59 AM | 6 (4.3%) | 30 (16.5%) |
| 8:00 AM to 8:29 AM | 11 (7.9%) | 0 (0.0%) |
| 8:30 AM to 8:59 AM | 0 (0.0%) | 9 (5.0%) |
| 9:00 AM to 9:59 AM | 15 (10.8%) | 1 (0.5%) |
| 10:00 AM to 10:59 AM | 0 (0.0%) | 0 (0.0%) |
| 11:00 AM to 11:59 AM | 0 (0.0%) | 0 (0.0%) |
| 12:00 PM to 3:59 PM | 9 (6.5%) | 11 (6.0%) |
| 4:00 PM to 11:59 PM | 17 (12.2%) | 16 (8.8%) |
| Total | 139 (100.0%) | 182 (100.0%) |
Housing Occupancy in Coffeeville
Occupancy by Ownership in Coffeeville
Of the total 409 dwellings in Coffeeville, owner-occupied units account for 308 (75.3%), while renter-occupied units make up 101 (24.7%).
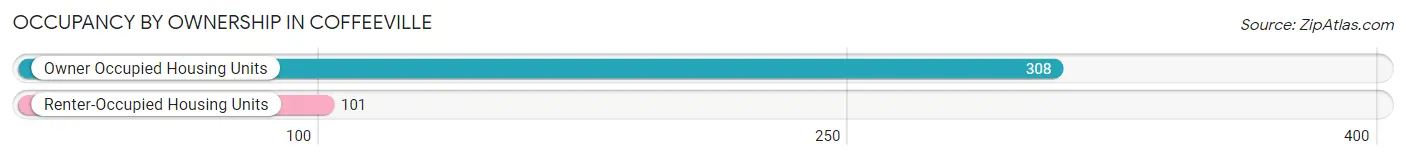
| Occupancy | # Housing Units | % Housing Units |
| Owner Occupied Housing Units | 308 | 75.3% |
| Renter-Occupied Housing Units | 101 | 24.7% |
| Total Occupied Housing Units | 409 | 100.0% |
Occupancy by Household Size in Coffeeville
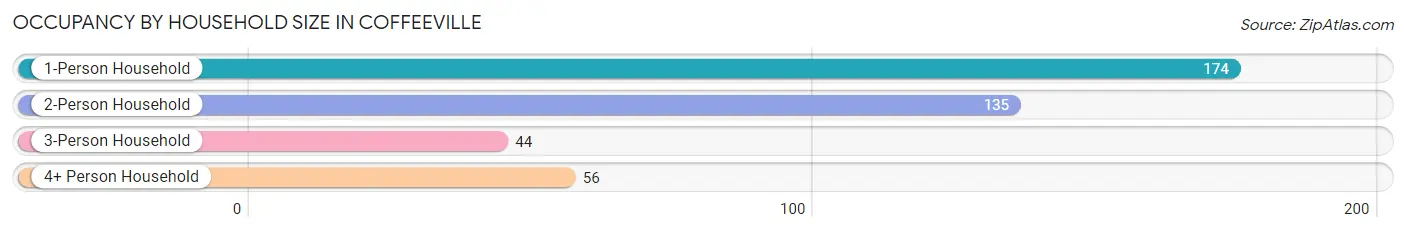
| Household Size | # Housing Units | % Housing Units |
| 1-Person Household | 174 | 42.5% |
| 2-Person Household | 135 | 33.0% |
| 3-Person Household | 44 | 10.8% |
| 4+ Person Household | 56 | 13.7% |
| Total Housing Units | 409 | 100.0% |
Occupancy by Ownership by Household Size in Coffeeville
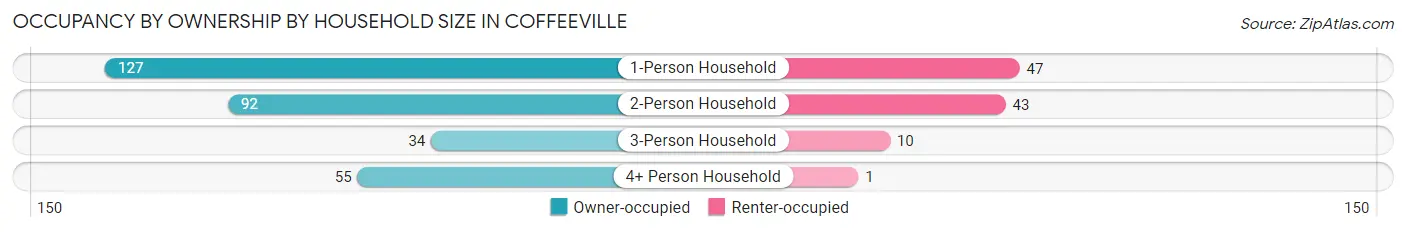
| Household Size | Owner-occupied | Renter-occupied |
| 1-Person Household | 127 (73.0%) | 47 (27.0%) |
| 2-Person Household | 92 (68.1%) | 43 (31.9%) |
| 3-Person Household | 34 (77.3%) | 10 (22.7%) |
| 4+ Person Household | 55 (98.2%) | 1 (1.8%) |
| Total Housing Units | 308 (75.3%) | 101 (24.7%) |
Occupancy by Educational Attainment in Coffeeville
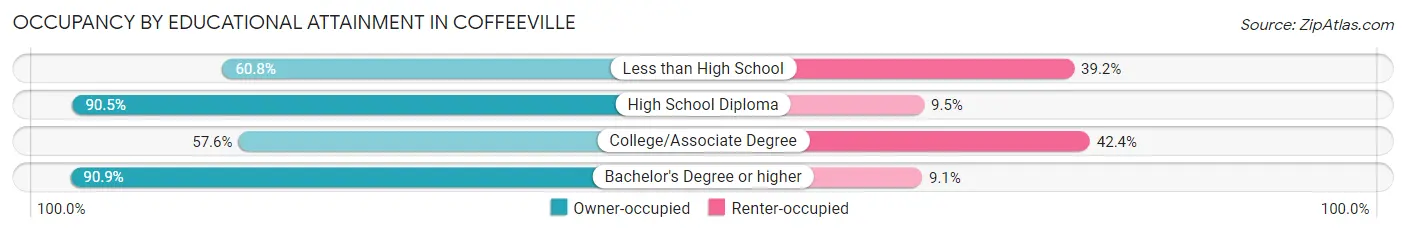
| Household Size | Owner-occupied | Renter-occupied |
| Less than High School | 48 (60.8%) | 31 (39.2%) |
| High School Diploma | 162 (90.5%) | 17 (9.5%) |
| College/Associate Degree | 68 (57.6%) | 50 (42.4%) |
| Bachelor's Degree or higher | 30 (90.9%) | 3 (9.1%) |
Occupancy by Age of Householder in Coffeeville
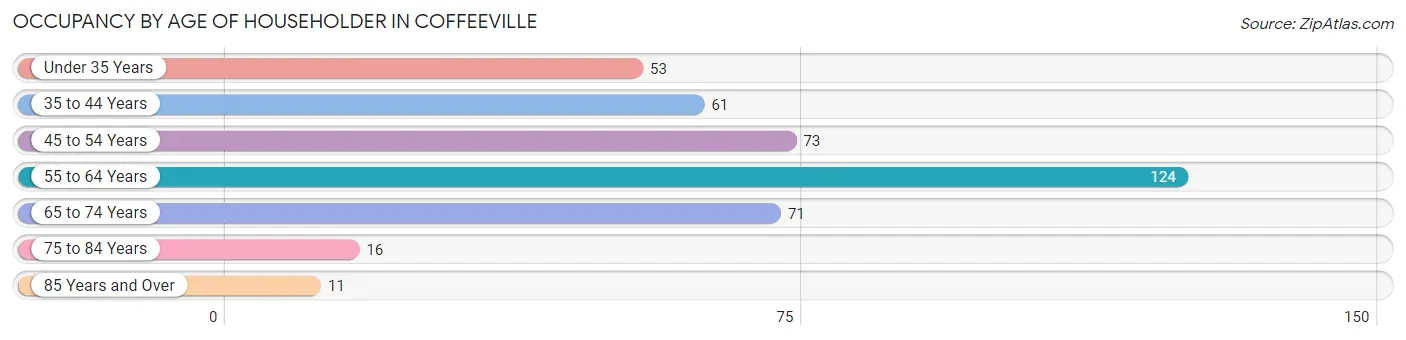
| Age Bracket | # Households | % Households |
| Under 35 Years | 53 | 13.0% |
| 35 to 44 Years | 61 | 14.9% |
| 45 to 54 Years | 73 | 17.8% |
| 55 to 64 Years | 124 | 30.3% |
| 65 to 74 Years | 71 | 17.4% |
| 75 to 84 Years | 16 | 3.9% |
| 85 Years and Over | 11 | 2.7% |
| Total | 409 | 100.0% |
Housing Finances in Coffeeville
Median Income by Occupancy in Coffeeville
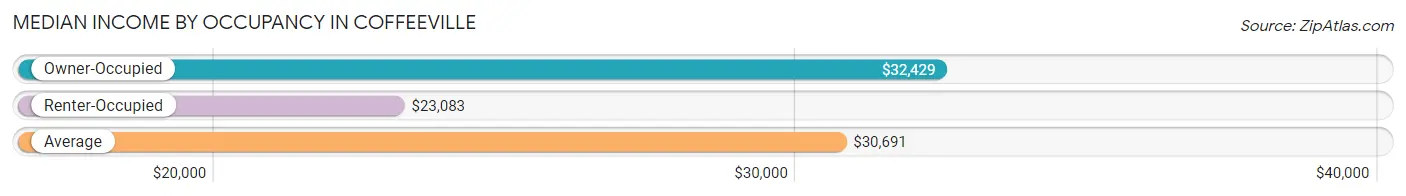
| Occupancy Type | # Households | Median Income |
| Owner-Occupied | 308 (75.3%) | $32,429 |
| Renter-Occupied | 101 (24.7%) | $23,083 |
| Average | 409 (100.0%) | $30,691 |
Occupancy by Householder Income Bracket in Coffeeville
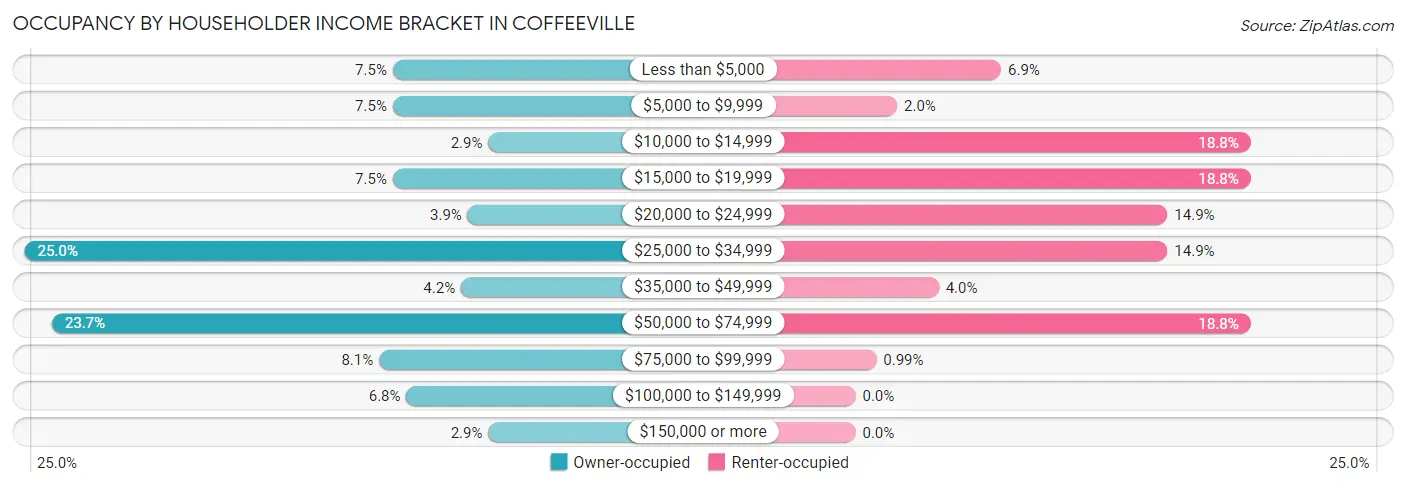
| Income Bracket | Owner-occupied | Renter-occupied |
| Less than $5,000 | 23 (7.5%) | 7 (6.9%) |
| $5,000 to $9,999 | 23 (7.5%) | 2 (2.0%) |
| $10,000 to $14,999 | 9 (2.9%) | 19 (18.8%) |
| $15,000 to $19,999 | 23 (7.5%) | 19 (18.8%) |
| $20,000 to $24,999 | 12 (3.9%) | 15 (14.8%) |
| $25,000 to $34,999 | 77 (25.0%) | 15 (14.8%) |
| $35,000 to $49,999 | 13 (4.2%) | 4 (4.0%) |
| $50,000 to $74,999 | 73 (23.7%) | 19 (18.8%) |
| $75,000 to $99,999 | 25 (8.1%) | 1 (1.0%) |
| $100,000 to $149,999 | 21 (6.8%) | 0 (0.0%) |
| $150,000 or more | 9 (2.9%) | 0 (0.0%) |
| Total | 308 (100.0%) | 101 (100.0%) |
Monthly Housing Cost Tiers in Coffeeville
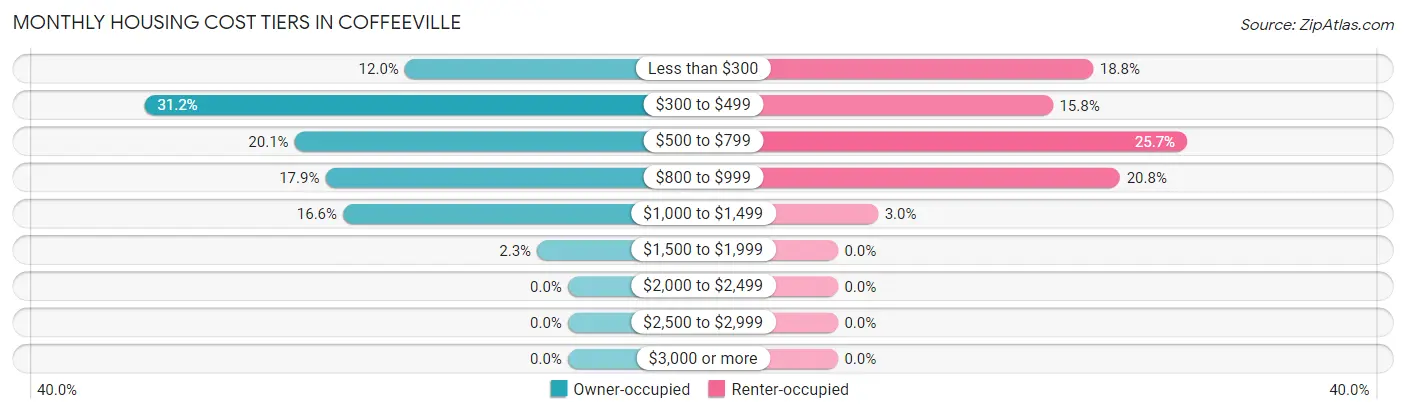
| Monthly Cost | Owner-occupied | Renter-occupied |
| Less than $300 | 37 (12.0%) | 19 (18.8%) |
| $300 to $499 | 96 (31.2%) | 16 (15.8%) |
| $500 to $799 | 62 (20.1%) | 26 (25.7%) |
| $800 to $999 | 55 (17.9%) | 21 (20.8%) |
| $1,000 to $1,499 | 51 (16.6%) | 3 (3.0%) |
| $1,500 to $1,999 | 7 (2.3%) | 0 (0.0%) |
| $2,000 to $2,499 | 0 (0.0%) | 0 (0.0%) |
| $2,500 to $2,999 | 0 (0.0%) | 0 (0.0%) |
| $3,000 or more | 0 (0.0%) | 0 (0.0%) |
| Total | 308 (100.0%) | 101 (100.0%) |
Physical Housing Characteristics in Coffeeville
Housing Structures in Coffeeville
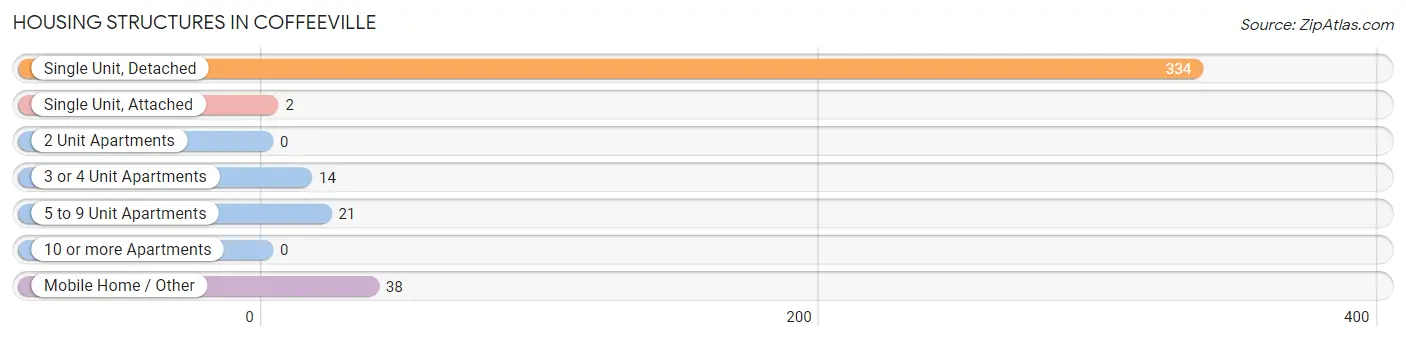
| Structure Type | # Housing Units | % Housing Units |
| Single Unit, Detached | 334 | 81.7% |
| Single Unit, Attached | 2 | 0.5% |
| 2 Unit Apartments | 0 | 0.0% |
| 3 or 4 Unit Apartments | 14 | 3.4% |
| 5 to 9 Unit Apartments | 21 | 5.1% |
| 10 or more Apartments | 0 | 0.0% |
| Mobile Home / Other | 38 | 9.3% |
| Total | 409 | 100.0% |
Housing Structures by Occupancy in Coffeeville
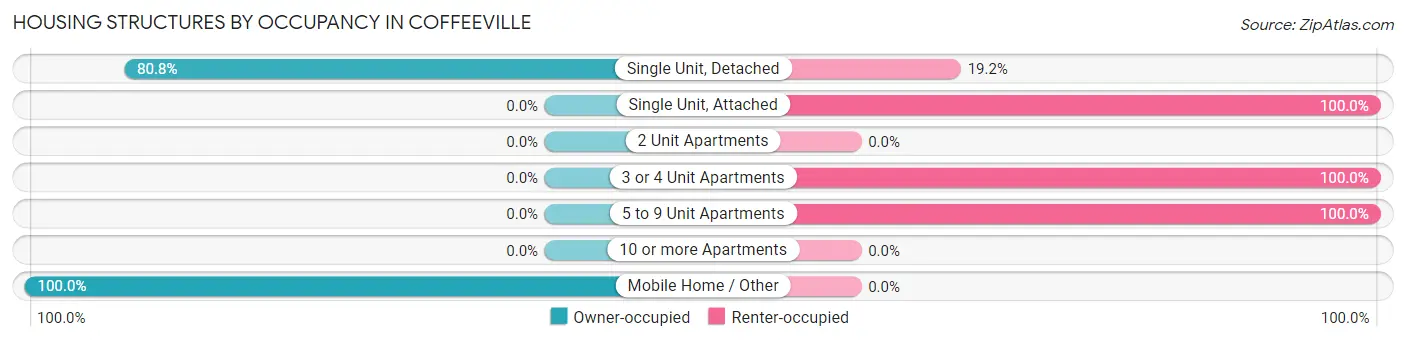
| Structure Type | Owner-occupied | Renter-occupied |
| Single Unit, Detached | 270 (80.8%) | 64 (19.2%) |
| Single Unit, Attached | 0 (0.0%) | 2 (100.0%) |
| 2 Unit Apartments | 0 (0.0%) | 0 (0.0%) |
| 3 or 4 Unit Apartments | 0 (0.0%) | 14 (100.0%) |
| 5 to 9 Unit Apartments | 0 (0.0%) | 21 (100.0%) |
| 10 or more Apartments | 0 (0.0%) | 0 (0.0%) |
| Mobile Home / Other | 38 (100.0%) | 0 (0.0%) |
| Total | 308 (75.3%) | 101 (24.7%) |
Housing Structures by Number of Rooms in Coffeeville
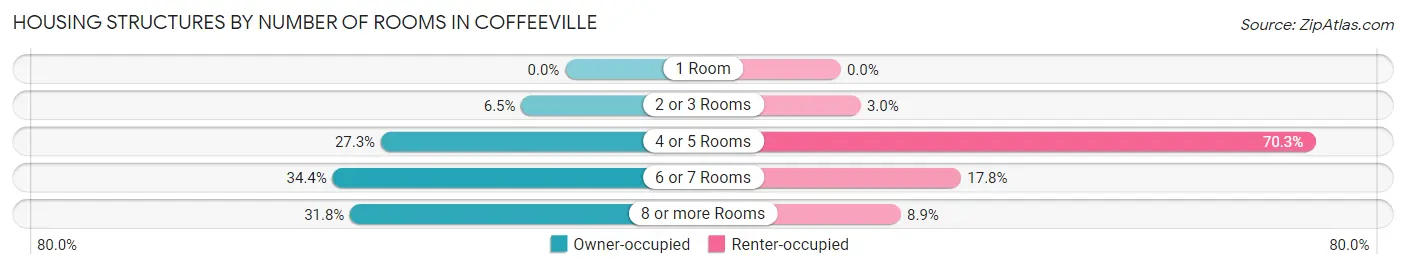
| Number of Rooms | Owner-occupied | Renter-occupied |
| 1 Room | 0 (0.0%) | 0 (0.0%) |
| 2 or 3 Rooms | 20 (6.5%) | 3 (3.0%) |
| 4 or 5 Rooms | 84 (27.3%) | 71 (70.3%) |
| 6 or 7 Rooms | 106 (34.4%) | 18 (17.8%) |
| 8 or more Rooms | 98 (31.8%) | 9 (8.9%) |
| Total | 308 (100.0%) | 101 (100.0%) |
Housing Structure by Heating Type in Coffeeville
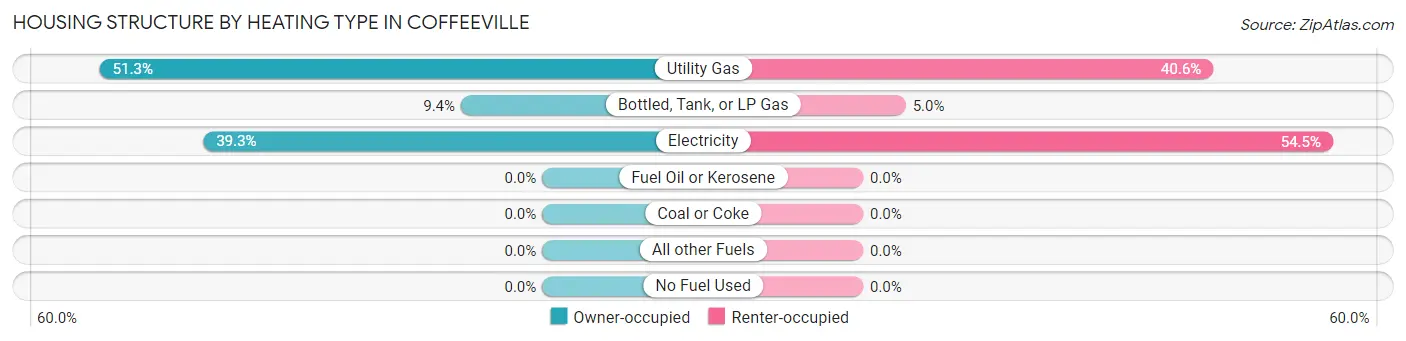
| Heating Type | Owner-occupied | Renter-occupied |
| Utility Gas | 158 (51.3%) | 41 (40.6%) |
| Bottled, Tank, or LP Gas | 29 (9.4%) | 5 (5.0%) |
| Electricity | 121 (39.3%) | 55 (54.5%) |
| Fuel Oil or Kerosene | 0 (0.0%) | 0 (0.0%) |
| Coal or Coke | 0 (0.0%) | 0 (0.0%) |
| All other Fuels | 0 (0.0%) | 0 (0.0%) |
| No Fuel Used | 0 (0.0%) | 0 (0.0%) |
| Total | 308 (100.0%) | 101 (100.0%) |
Household Vehicle Usage in Coffeeville
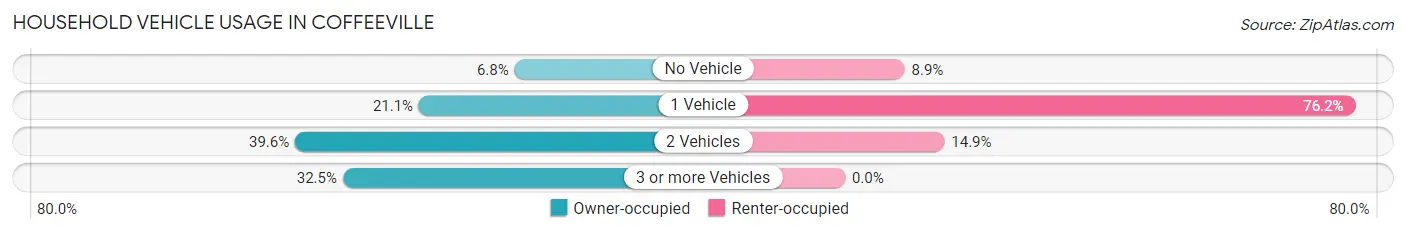
| Vehicles per Household | Owner-occupied | Renter-occupied |
| No Vehicle | 21 (6.8%) | 9 (8.9%) |
| 1 Vehicle | 65 (21.1%) | 77 (76.2%) |
| 2 Vehicles | 122 (39.6%) | 15 (14.8%) |
| 3 or more Vehicles | 100 (32.5%) | 0 (0.0%) |
| Total | 308 (100.0%) | 101 (100.0%) |
Real Estate & Mortgages in Coffeeville
Real Estate and Mortgage Overview in Coffeeville
| Characteristic | Without Mortgage | With Mortgage |
| Housing Units | 141 | 167 |
| Median Property Value | $93,300 | $84,000 |
| Median Household Income | $45,139 | $0 |
| Monthly Housing Costs | $399 | $0 |
| Real Estate Taxes | $563 | $71 |
Property Value by Mortgage Status in Coffeeville
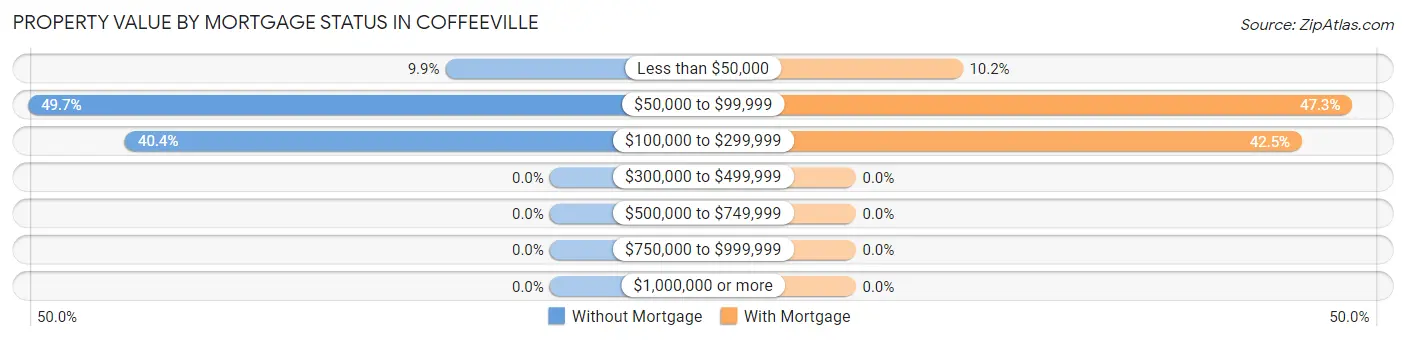
| Property Value | Without Mortgage | With Mortgage |
| Less than $50,000 | 14 (9.9%) | 17 (10.2%) |
| $50,000 to $99,999 | 70 (49.6%) | 79 (47.3%) |
| $100,000 to $299,999 | 57 (40.4%) | 71 (42.5%) |
| $300,000 to $499,999 | 0 (0.0%) | 0 (0.0%) |
| $500,000 to $749,999 | 0 (0.0%) | 0 (0.0%) |
| $750,000 to $999,999 | 0 (0.0%) | 0 (0.0%) |
| $1,000,000 or more | 0 (0.0%) | 0 (0.0%) |
| Total | 141 (100.0%) | 167 (100.0%) |
Household Income by Mortgage Status in Coffeeville
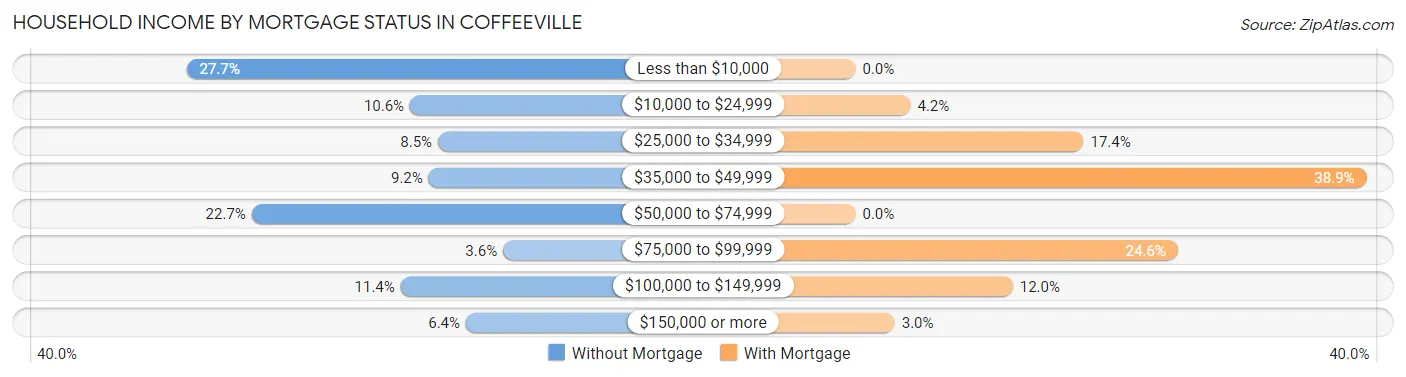
| Household Income | Without Mortgage | With Mortgage |
| Less than $10,000 | 39 (27.7%) | 0 (0.0%) |
| $10,000 to $24,999 | 15 (10.6%) | 7 (4.2%) |
| $25,000 to $34,999 | 12 (8.5%) | 29 (17.4%) |
| $35,000 to $49,999 | 13 (9.2%) | 65 (38.9%) |
| $50,000 to $74,999 | 32 (22.7%) | 0 (0.0%) |
| $75,000 to $99,999 | 5 (3.5%) | 41 (24.5%) |
| $100,000 to $149,999 | 16 (11.4%) | 20 (12.0%) |
| $150,000 or more | 9 (6.4%) | 5 (3.0%) |
| Total | 141 (100.0%) | 167 (100.0%) |
Property Value to Household Income Ratio in Coffeeville
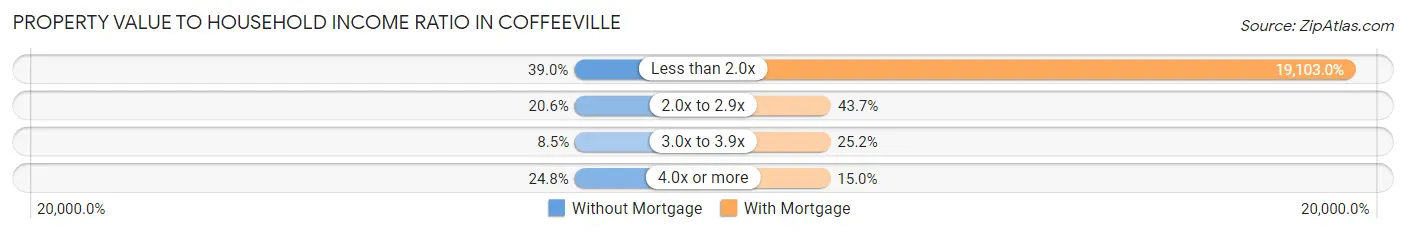
| Value-to-Income Ratio | Without Mortgage | With Mortgage |
| Less than 2.0x | 55 (39.0%) | 31,902 (19,103.0%) |
| 2.0x to 2.9x | 29 (20.6%) | 73 (43.7%) |
| 3.0x to 3.9x | 12 (8.5%) | 42 (25.2%) |
| 4.0x or more | 35 (24.8%) | 25 (15.0%) |
| Total | 141 (100.0%) | 167 (100.0%) |
Real Estate Taxes by Mortgage Status in Coffeeville
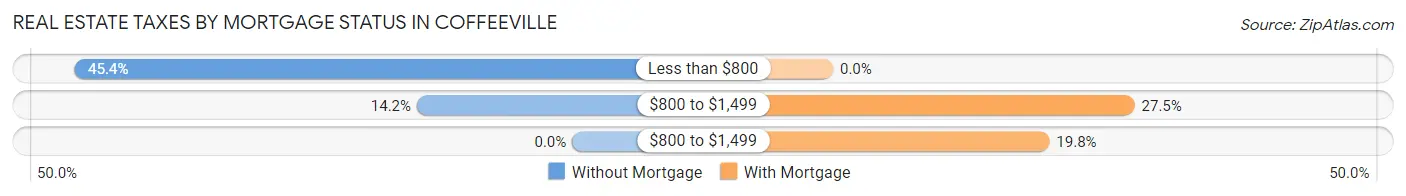
| Property Taxes | Without Mortgage | With Mortgage |
| Less than $800 | 64 (45.4%) | 0 (0.0%) |
| $800 to $1,499 | 20 (14.2%) | 46 (27.5%) |
| $800 to $1,499 | 0 (0.0%) | 33 (19.8%) |
| Total | 141 (100.0%) | 167 (100.0%) |
Health & Disability in Coffeeville
Health Insurance Coverage by Age in Coffeeville
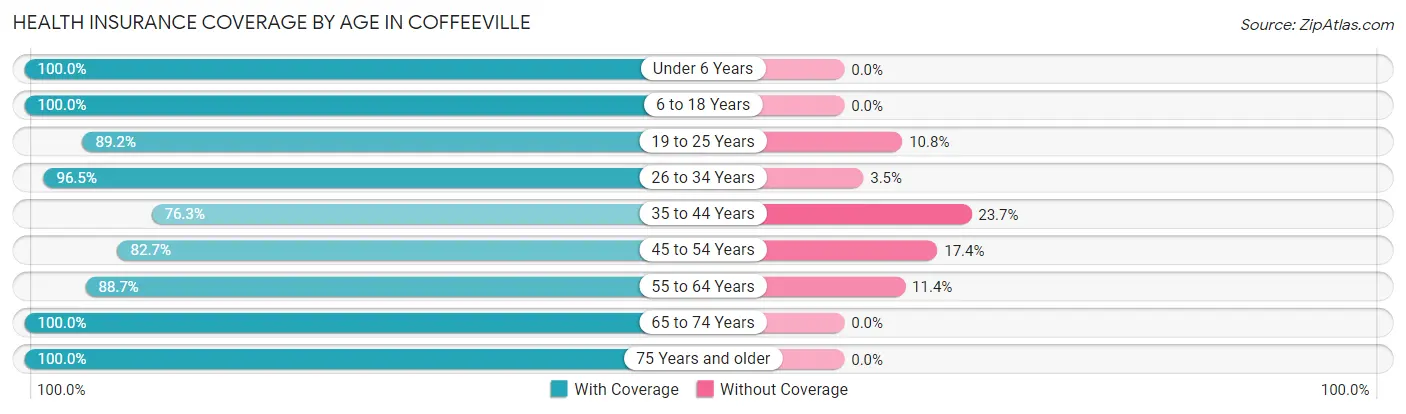
| Age Bracket | With Coverage | Without Coverage |
| Under 6 Years | 24 (100.0%) | 0 (0.0%) |
| 6 to 18 Years | 255 (100.0%) | 0 (0.0%) |
| 19 to 25 Years | 33 (89.2%) | 4 (10.8%) |
| 26 to 34 Years | 109 (96.5%) | 4 (3.5%) |
| 35 to 44 Years | 116 (76.3%) | 36 (23.7%) |
| 45 to 54 Years | 81 (82.7%) | 17 (17.3%) |
| 55 to 64 Years | 164 (88.6%) | 21 (11.4%) |
| 65 to 74 Years | 85 (100.0%) | 0 (0.0%) |
| 75 Years and older | 35 (100.0%) | 0 (0.0%) |
| Total | 902 (91.7%) | 82 (8.3%) |
Health Insurance Coverage by Citizenship Status in Coffeeville
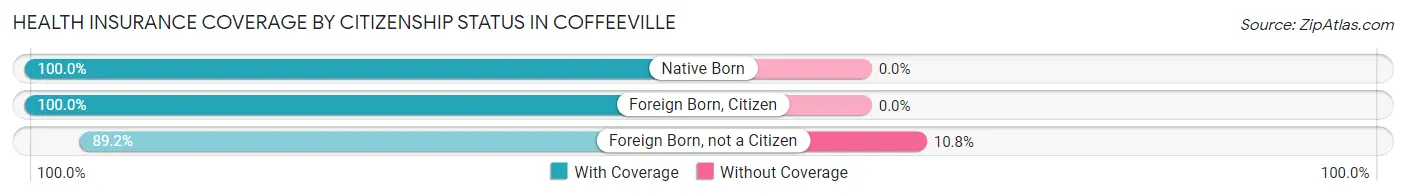
| Citizenship Status | With Coverage | Without Coverage |
| Native Born | 24 (100.0%) | 0 (0.0%) |
| Foreign Born, Citizen | 255 (100.0%) | 0 (0.0%) |
| Foreign Born, not a Citizen | 33 (89.2%) | 4 (10.8%) |
Health Insurance Coverage by Household Income in Coffeeville
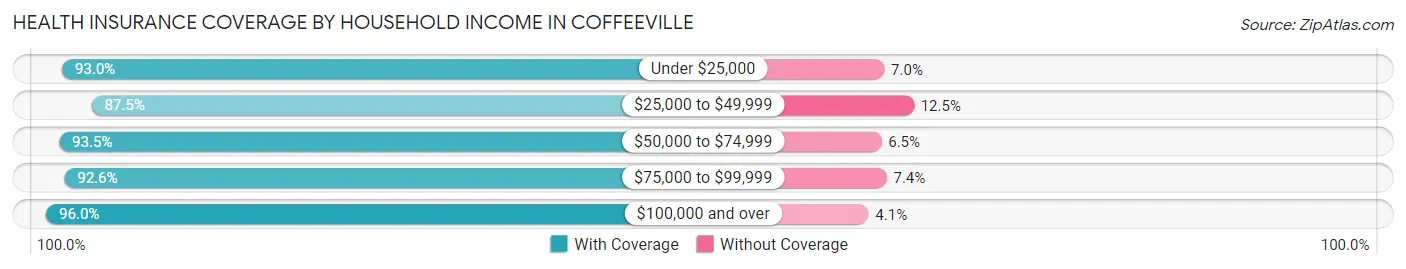
| Household Income | With Coverage | Without Coverage |
| Under $25,000 | 186 (93.0%) | 14 (7.0%) |
| $25,000 to $49,999 | 258 (87.5%) | 37 (12.5%) |
| $50,000 to $74,999 | 275 (93.5%) | 19 (6.5%) |
| $75,000 to $99,999 | 112 (92.6%) | 9 (7.4%) |
| $100,000 and over | 71 (96.0%) | 3 (4.1%) |
Public vs Private Health Insurance Coverage by Age in Coffeeville
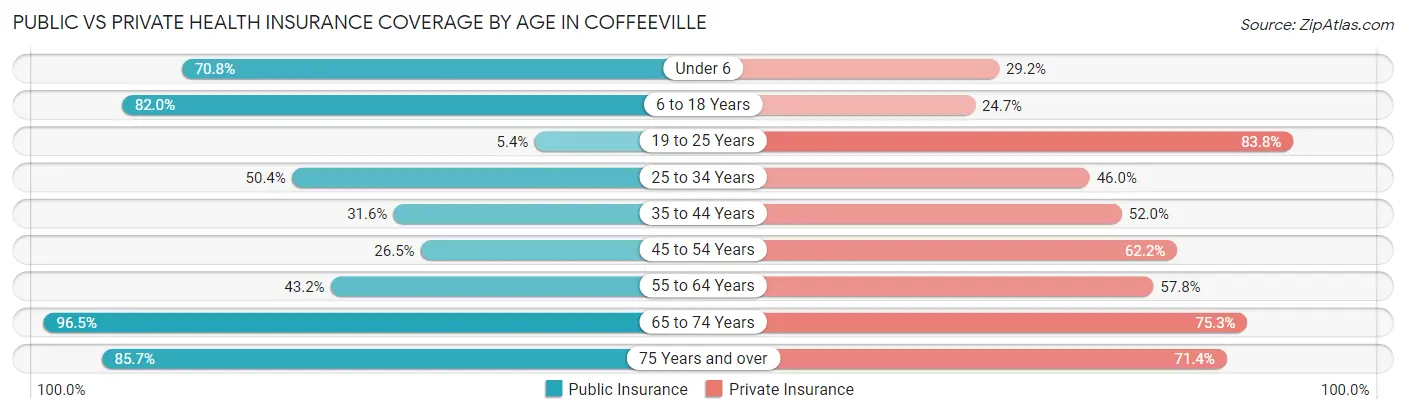
| Age Bracket | Public Insurance | Private Insurance |
| Under 6 | 17 (70.8%) | 7 (29.2%) |
| 6 to 18 Years | 209 (82.0%) | 63 (24.7%) |
| 19 to 25 Years | 2 (5.4%) | 31 (83.8%) |
| 25 to 34 Years | 57 (50.4%) | 52 (46.0%) |
| 35 to 44 Years | 48 (31.6%) | 79 (52.0%) |
| 45 to 54 Years | 26 (26.5%) | 61 (62.2%) |
| 55 to 64 Years | 80 (43.2%) | 107 (57.8%) |
| 65 to 74 Years | 82 (96.5%) | 64 (75.3%) |
| 75 Years and over | 30 (85.7%) | 25 (71.4%) |
| Total | 551 (56.0%) | 489 (49.7%) |
Disability Status by Sex by Age in Coffeeville
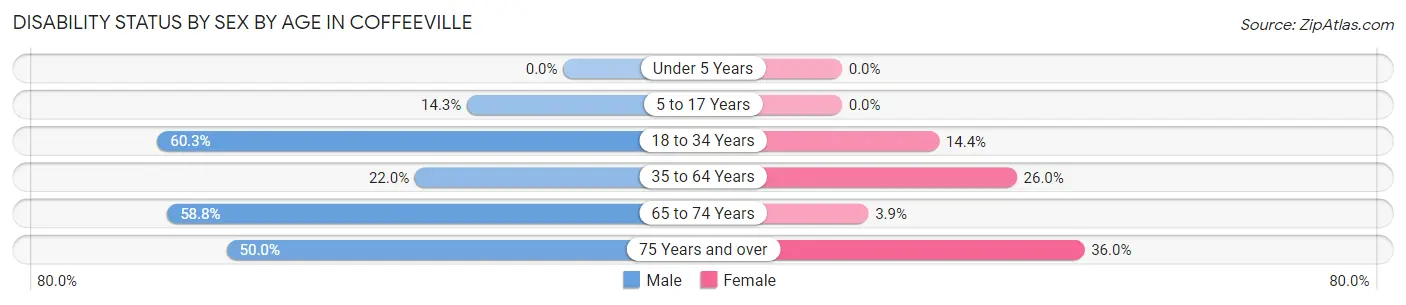
| Age Bracket | Male | Female |
| Under 5 Years | 0 (0.0%) | 0 (0.0%) |
| 5 to 17 Years | 19 (14.3%) | 0 (0.0%) |
| 18 to 34 Years | 41 (60.3%) | 15 (14.4%) |
| 35 to 64 Years | 50 (22.0%) | 54 (26.0%) |
| 65 to 74 Years | 20 (58.8%) | 2 (3.9%) |
| 75 Years and over | 5 (50.0%) | 9 (36.0%) |
Disability Class by Sex by Age in Coffeeville
Disability Class: Hearing Difficulty
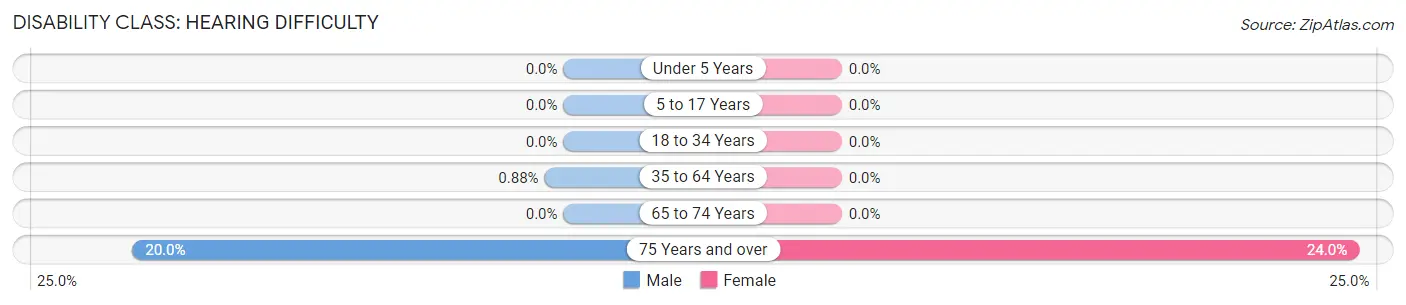
| Age Bracket | Male | Female |
| Under 5 Years | 0 (0.0%) | 0 (0.0%) |
| 5 to 17 Years | 0 (0.0%) | 0 (0.0%) |
| 18 to 34 Years | 0 (0.0%) | 0 (0.0%) |
| 35 to 64 Years | 2 (0.9%) | 0 (0.0%) |
| 65 to 74 Years | 0 (0.0%) | 0 (0.0%) |
| 75 Years and over | 2 (20.0%) | 6 (24.0%) |
Disability Class: Vision Difficulty
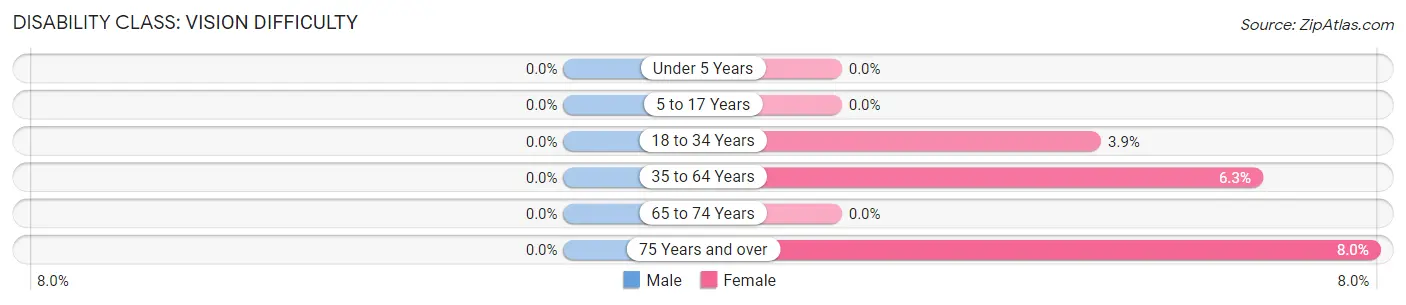
| Age Bracket | Male | Female |
| Under 5 Years | 0 (0.0%) | 0 (0.0%) |
| 5 to 17 Years | 0 (0.0%) | 0 (0.0%) |
| 18 to 34 Years | 0 (0.0%) | 4 (3.8%) |
| 35 to 64 Years | 0 (0.0%) | 13 (6.2%) |
| 65 to 74 Years | 0 (0.0%) | 0 (0.0%) |
| 75 Years and over | 0 (0.0%) | 2 (8.0%) |
Disability Class: Cognitive Difficulty
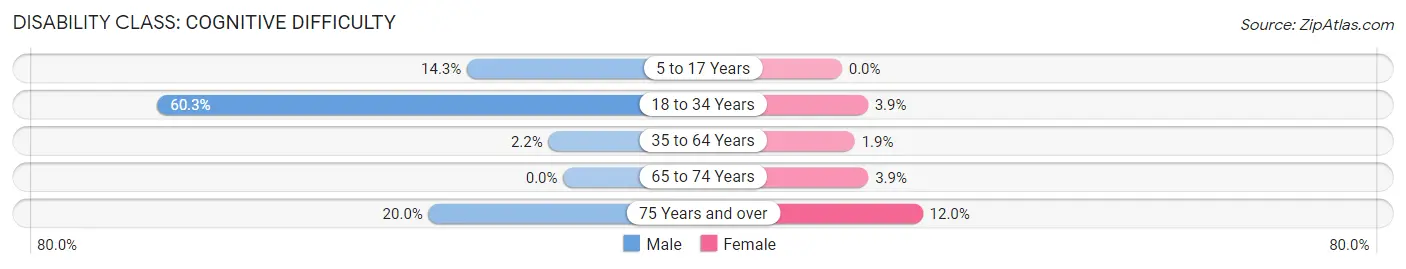
| Age Bracket | Male | Female |
| 5 to 17 Years | 19 (14.3%) | 0 (0.0%) |
| 18 to 34 Years | 41 (60.3%) | 4 (3.8%) |
| 35 to 64 Years | 5 (2.2%) | 4 (1.9%) |
| 65 to 74 Years | 0 (0.0%) | 2 (3.9%) |
| 75 Years and over | 2 (20.0%) | 3 (12.0%) |
Disability Class: Ambulatory Difficulty
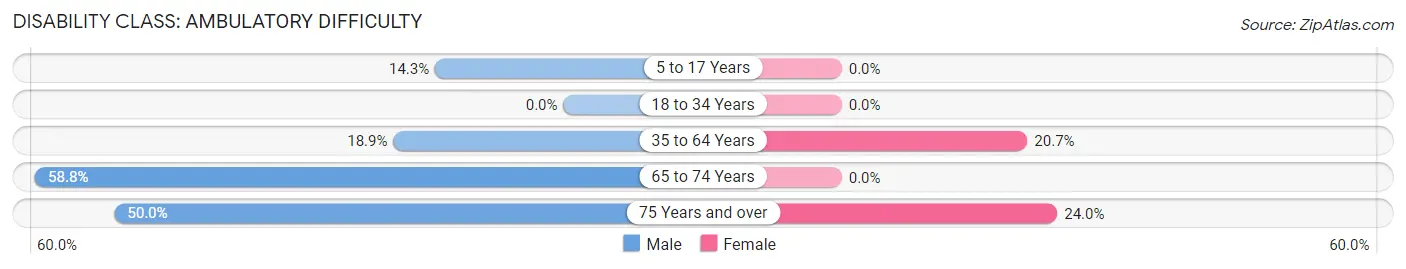
| Age Bracket | Male | Female |
| 5 to 17 Years | 19 (14.3%) | 0 (0.0%) |
| 18 to 34 Years | 0 (0.0%) | 0 (0.0%) |
| 35 to 64 Years | 43 (18.9%) | 43 (20.7%) |
| 65 to 74 Years | 20 (58.8%) | 0 (0.0%) |
| 75 Years and over | 5 (50.0%) | 6 (24.0%) |
Disability Class: Self-Care Difficulty
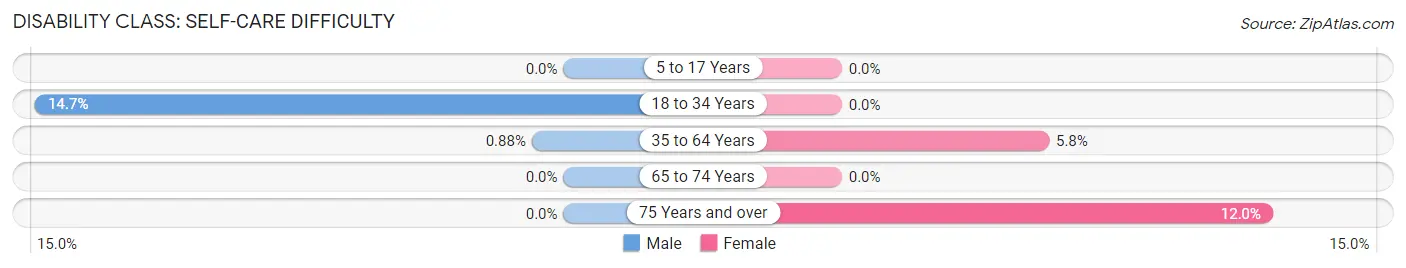
| Age Bracket | Male | Female |
| 5 to 17 Years | 0 (0.0%) | 0 (0.0%) |
| 18 to 34 Years | 10 (14.7%) | 0 (0.0%) |
| 35 to 64 Years | 2 (0.9%) | 12 (5.8%) |
| 65 to 74 Years | 0 (0.0%) | 0 (0.0%) |
| 75 Years and over | 0 (0.0%) | 3 (12.0%) |
Technology Access in Coffeeville
Computing Device Access in Coffeeville
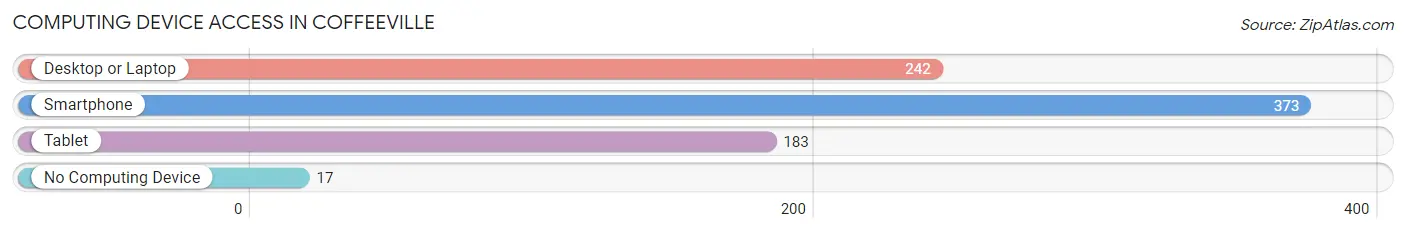
| Device Type | # Households | % Households |
| Desktop or Laptop | 242 | 59.2% |
| Smartphone | 373 | 91.2% |
| Tablet | 183 | 44.7% |
| No Computing Device | 17 | 4.2% |
| Total | 409 | 100.0% |
Internet Access in Coffeeville
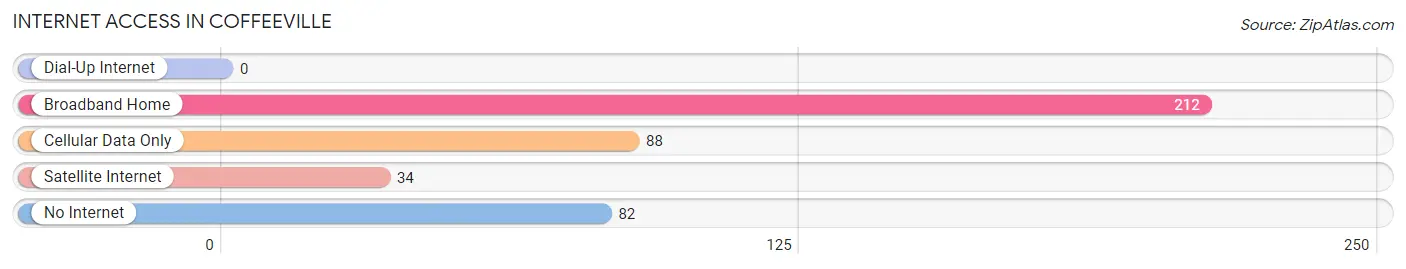
| Internet Type | # Households | % Households |
| Dial-Up Internet | 0 | 0.0% |
| Broadband Home | 212 | 51.8% |
| Cellular Data Only | 88 | 21.5% |
| Satellite Internet | 34 | 8.3% |
| No Internet | 82 | 20.1% |
| Total | 409 | 100.0% |
Coffeeville Summary
Coffeeville, Mississippi is a small town located in Yalobusha County, Mississippi. It is situated on the banks of the Yalobusha River, approximately 30 miles south of Oxford and 40 miles north of Grenada. The town was founded in 1837 and named after the nearby Coffeeville Plantation. As of the 2010 census, the population of Coffeeville was 1,100.
Geography
Coffeeville is located at 33°45'N 89°45'W. It is situated on the banks of the Yalobusha River, approximately 30 miles south of Oxford and 40 miles north of Grenada. The town is located in the hills of the Mississippi Delta, and is surrounded by rolling hills and farmland. The town is located in the Yazoo-Mississippi Delta region, which is known for its rich soil and agricultural production.
The climate in Coffeeville is humid subtropical, with hot, humid summers and mild winters. The average annual temperature is 64°F, with an average high of 87°F in the summer and an average low of 41°F in the winter. The average annual precipitation is 51 inches.
Economy
Coffeeville’s economy is largely based on agriculture. The town is home to several farms, which produce cotton, soybeans, corn, and other crops. The town is also home to several small businesses, including a grocery store, a hardware store, and a few restaurants.
The town is also home to a few manufacturing companies, including a furniture factory and a woodworking plant. The town is also home to a few small businesses, such as a barber shop, a beauty salon, and a few auto repair shops.
Demographics
As of the 2010 census, the population of Coffeeville was 1,100. The racial makeup of the town was 79.2% White, 19.2% African American, 0.2% Native American, 0.2% Asian, and 1.2% from other races. The median household income was $25,000, and the median family income was $30,000.
The town is home to a few churches, including the First Baptist Church, the Church of God, and the Church of Christ. The town is also home to a few schools, including Coffeeville Elementary School, Coffeeville High School, and Coffeeville Middle School.
Conclusion
Coffeeville, Mississippi is a small town located in Yalobusha County, Mississippi. It is situated on the banks of the Yalobusha River, approximately 30 miles south of Oxford and 40 miles north of Grenada. The town was founded in 1837 and named after the nearby Coffeeville Plantation. As of the 2010 census, the population of Coffeeville was 1,100. The town’s economy is largely based on agriculture, and it is home to several small businesses. The racial makeup of the town is 79.2% White, 19.2% African American, 0.2% Native American, 0.2% Asian, and 1.2% from other races. The median household income was $25,000, and the median family income was $30,000. Coffeeville is home to a few churches and schools, and is a peaceful, rural community.
Common Questions
What is Per Capita Income in Coffeeville?
Per Capita income in Coffeeville is $18,123.
What is the Median Family Income in Coffeeville?
Median Family Income in Coffeeville is $37,188.
What is the Median Household income in Coffeeville?
Median Household Income in Coffeeville is $30,691.
What is Income or Wage Gap in Coffeeville?
Income or Wage Gap in Coffeeville is 2.9%.
Women in Coffeeville earn 97.1 cents for every dollar earned by a man.
What is Inequality or Gini Index in Coffeeville?
Inequality or Gini Index in Coffeeville is 0.44.
What is the Total Population of Coffeeville?
Total Population of Coffeeville is 984.
What is the Total Male Population of Coffeeville?
Total Male Population of Coffeeville is 486.
What is the Total Female Population of Coffeeville?
Total Female Population of Coffeeville is 498.
What is the Ratio of Males per 100 Females in Coffeeville?
There are 97.59 Males per 100 Females in Coffeeville.
What is the Ratio of Females per 100 Males in Coffeeville?
There are 102.47 Females per 100 Males in Coffeeville.
What is the Median Population Age in Coffeeville?
Median Population Age in Coffeeville is 40.3 Years.
What is the Average Family Size in Coffeeville
Average Family Size in Coffeeville is 3.4 People.
What is the Average Household Size in Coffeeville
Average Household Size in Coffeeville is 2.4 People.
How Large is the Labor Force in Coffeeville?
There are 332 People in the Labor Forcein in Coffeeville.
What is the Percentage of People in the Labor Force in Coffeeville?
43.8% of People are in the Labor Force in Coffeeville.
What is the Unemployment Rate in Coffeeville?
Unemployment Rate in Coffeeville is 3.3%.