Friars Point, MS Map & Demographics
Friars Point Map
Friars Point Overview
$13,313
PER CAPITA INCOME
$23,839
AVG FAMILY INCOME
$25,156
AVG HOUSEHOLD INCOME
40.0%
WAGE / INCOME GAP [ % ]
60.0¢/ $1
WAGE / INCOME GAP [ $ ]
0.42
INEQUALITY / GINI INDEX
1,083
TOTAL POPULATION
413
MALE POPULATION
670
FEMALE POPULATION
61.64
MALES / 100 FEMALES
162.23
FEMALES / 100 MALES
30.6
MEDIAN AGE
3.0
AVG FAMILY SIZE
2.5
AVG HOUSEHOLD SIZE
429
LABOR FORCE [ PEOPLE ]
60.3%
PERCENT IN LABOR FORCE
10.5%
UNEMPLOYMENT RATE
Friars Point Zip Codes
Friars Point Area Codes
Income in Friars Point
Income Overview in Friars Point
Per Capita Income in Friars Point is $13,313, while median incomes of families and households are $23,839 and $25,156 respectively.
| Characteristic | Number | Measure |
| Per Capita Income | 1,083 | $13,313 |
| Median Family Income | 309 | $23,839 |
| Mean Family Income | 309 | $32,891 |
| Median Household Income | 431 | $25,156 |
| Mean Household Income | 431 | $34,024 |
| Income Deficit | 309 | $0 |
| Wage / Income Gap (%) | 1,083 | 39.96% |
| Wage / Income Gap ($) | 1,083 | 60.04¢ per $1 |
| Gini / Inequality Index | 1,083 | 0.42 |
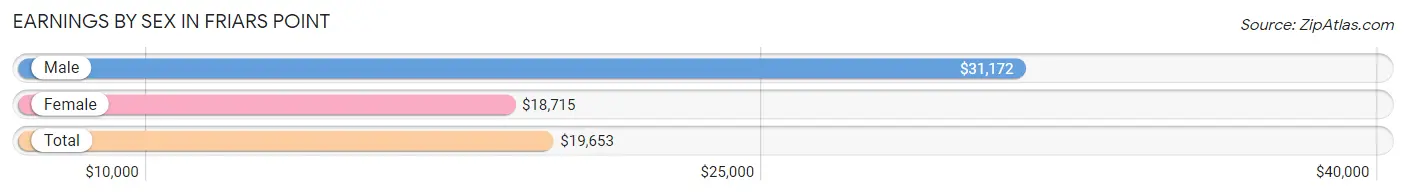
Earnings by Sex in Friars Point
Average Earnings in Friars Point are $19,653, $31,172 for men and $18,715 for women, a difference of 40.0%.
| Sex | Number | Average Earnings |
| Male | 101 (22.4%) | $31,172 |
| Female | 351 (77.6%) | $18,715 |
| Total | 452 (100.0%) | $19,653 |
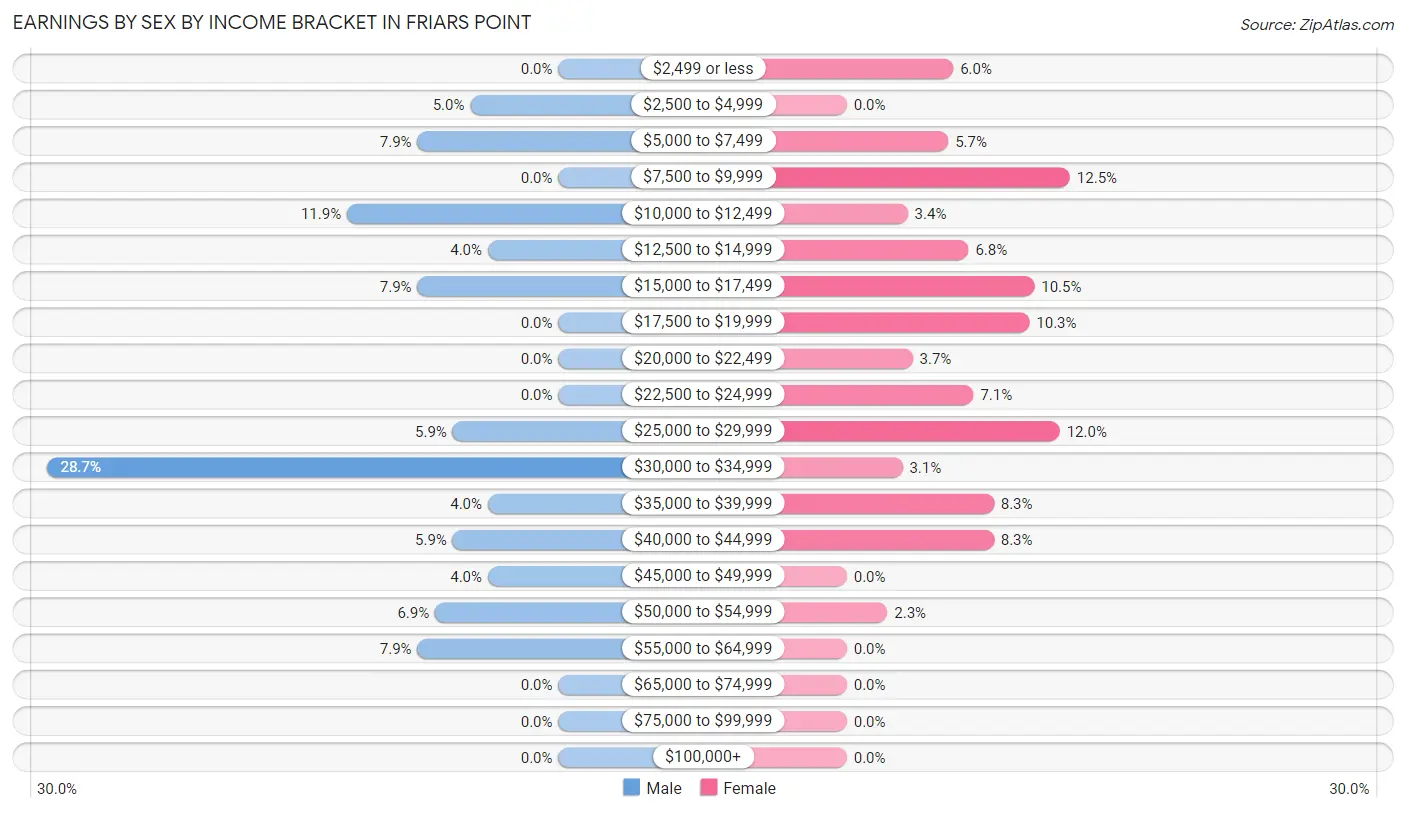
Earnings by Sex by Income Bracket in Friars Point
The most common earnings brackets in Friars Point are $30,000 to $34,999 for men (29 | 28.7%) and $7,500 to $9,999 for women (44 | 12.5%).
| Income | Male | Female |
| $2,499 or less | 0 (0.0%) | 21 (6.0%) |
| $2,500 to $4,999 | 5 (5.0%) | 0 (0.0%) |
| $5,000 to $7,499 | 8 (7.9%) | 20 (5.7%) |
| $7,500 to $9,999 | 0 (0.0%) | 44 (12.5%) |
| $10,000 to $12,499 | 12 (11.9%) | 12 (3.4%) |
| $12,500 to $14,999 | 4 (4.0%) | 24 (6.8%) |
| $15,000 to $17,499 | 8 (7.9%) | 37 (10.5%) |
| $17,500 to $19,999 | 0 (0.0%) | 36 (10.3%) |
| $20,000 to $22,499 | 0 (0.0%) | 13 (3.7%) |
| $22,500 to $24,999 | 0 (0.0%) | 25 (7.1%) |
| $25,000 to $29,999 | 6 (5.9%) | 42 (12.0%) |
| $30,000 to $34,999 | 29 (28.7%) | 11 (3.1%) |
| $35,000 to $39,999 | 4 (4.0%) | 29 (8.3%) |
| $40,000 to $44,999 | 6 (5.9%) | 29 (8.3%) |
| $45,000 to $49,999 | 4 (4.0%) | 0 (0.0%) |
| $50,000 to $54,999 | 7 (6.9%) | 8 (2.3%) |
| $55,000 to $64,999 | 8 (7.9%) | 0 (0.0%) |
| $65,000 to $74,999 | 0 (0.0%) | 0 (0.0%) |
| $75,000 to $99,999 | 0 (0.0%) | 0 (0.0%) |
| $100,000+ | 0 (0.0%) | 0 (0.0%) |
| Total | 101 (100.0%) | 351 (100.0%) |
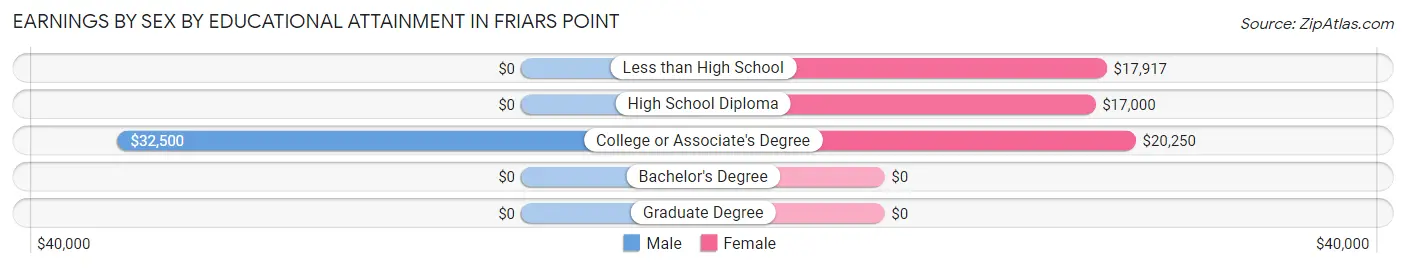
Earnings by Sex by Educational Attainment in Friars Point
Average earnings in Friars Point are $31,172 for men and $19,201 for women, a difference of 38.4%. Men with an educational attainment of college or associate's degree enjoy the highest average annual earnings of $32,500, while those with college or associate's degree education earn the least with $32,500. Women with an educational attainment of college or associate's degree earn the most with the average annual earnings of $20,250, while those with high school diploma education have the smallest earnings of $17,000.
| Educational Attainment | Male Income | Female Income |
| Less than High School | - | - |
| High School Diploma | - | - |
| College or Associate's Degree | $32,500 | $20,250 |
| Bachelor's Degree | - | - |
| Graduate Degree | - | - |
| Total | $31,172 | $19,201 |
Family Income in Friars Point
Family Income Brackets in Friars Point
According to the Friars Point family income data, there are 60 families falling into the $15,000 to $24,999 income range, which is the most common income bracket and makes up 19.4% of all families.
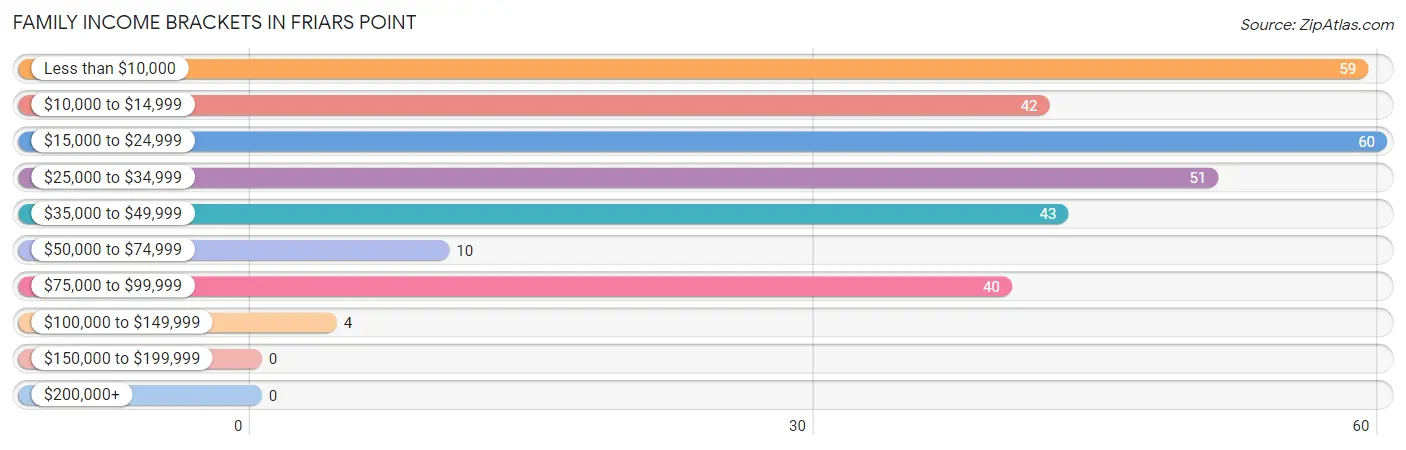
| Income Bracket | # Families | % Families |
| Less than $10,000 | 59 | 19.1% |
| $10,000 to $14,999 | 42 | 13.6% |
| $15,000 to $24,999 | 60 | 19.4% |
| $25,000 to $34,999 | 51 | 16.5% |
| $35,000 to $49,999 | 43 | 13.9% |
| $50,000 to $74,999 | 10 | 3.2% |
| $75,000 to $99,999 | 40 | 12.9% |
| $100,000 to $149,999 | 4 | 1.3% |
| $150,000 to $199,999 | 0 | 0.0% |
| $200,000+ | 0 | 0.0% |
Family Income by Famaliy Size in Friars Point
5-person families (26 | 8.4%) account for the highest median family income in Friars Point with $40,469 per family, while 3-person families (85 | 27.5%) have the highest median income of $11,198 per family member.
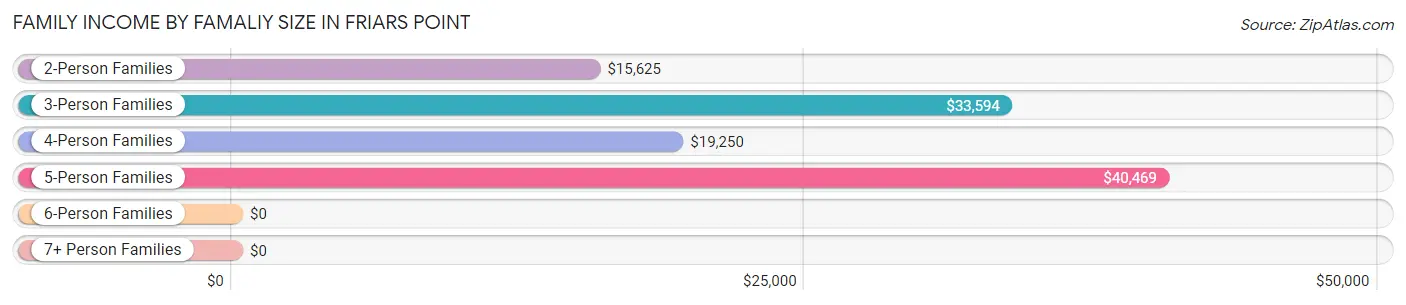
| Income Bracket | # Families | Median Income |
| 2-Person Families | 147 (47.6%) | $15,625 |
| 3-Person Families | 85 (27.5%) | $33,594 |
| 4-Person Families | 51 (16.5%) | $19,250 |
| 5-Person Families | 26 (8.4%) | $40,469 |
| 6-Person Families | 0 (0.0%) | $0 |
| 7+ Person Families | 0 (0.0%) | $0 |
| Total | 309 (100.0%) | $23,839 |
Family Income by Number of Earners in Friars Point
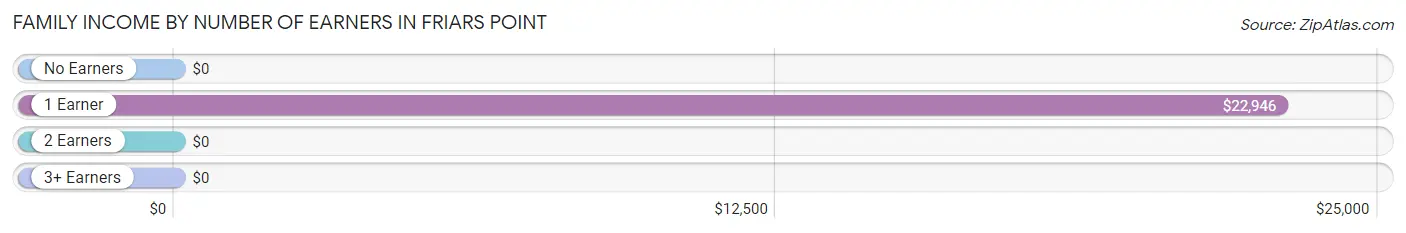
| Number of Earners | # Families | Median Income |
| No Earners | 23 (7.4%) | $0 |
| 1 Earner | 233 (75.4%) | $22,946 |
| 2 Earners | 53 (17.2%) | $0 |
| 3+ Earners | 0 (0.0%) | $0 |
| Total | 309 (100.0%) | $23,839 |
Household Income in Friars Point
Household Income Brackets in Friars Point
With 79 households falling in the category, the $15,000 to $24,999 income range is the most frequent in Friars Point, accounting for 18.3% of all households.
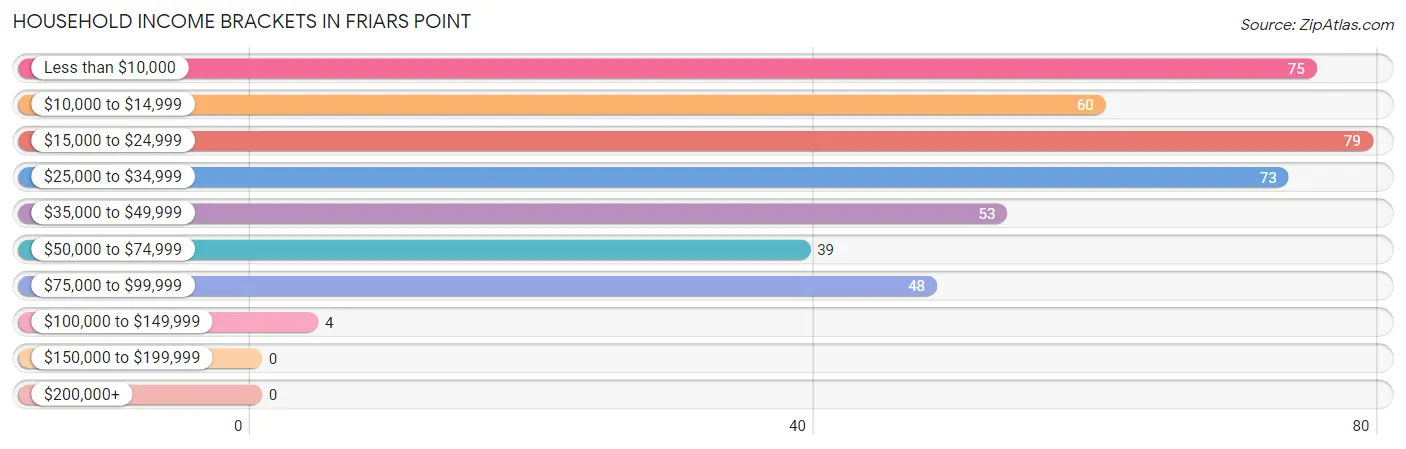
| Income Bracket | # Households | % Households |
| Less than $10,000 | 75 | 17.4% |
| $10,000 to $14,999 | 60 | 13.9% |
| $15,000 to $24,999 | 79 | 18.3% |
| $25,000 to $34,999 | 73 | 16.9% |
| $35,000 to $49,999 | 53 | 12.3% |
| $50,000 to $74,999 | 39 | 9.0% |
| $75,000 to $99,999 | 48 | 11.1% |
| $100,000 to $149,999 | 4 | 0.9% |
| $150,000 to $199,999 | 0 | 0.0% |
| $200,000+ | 0 | 0.0% |
Household Income by Householder Age in Friars Point
The median household income in Friars Point is $25,156, with the highest median household income of $38,542 found in the 45 to 64 years age bracket for the primary householder. A total of 155 households (36.0%) fall into this category. Meanwhile, the 15 to 24 years age bracket for the primary householder has the lowest median household income of $0, with 6 households (1.4%) in this group.
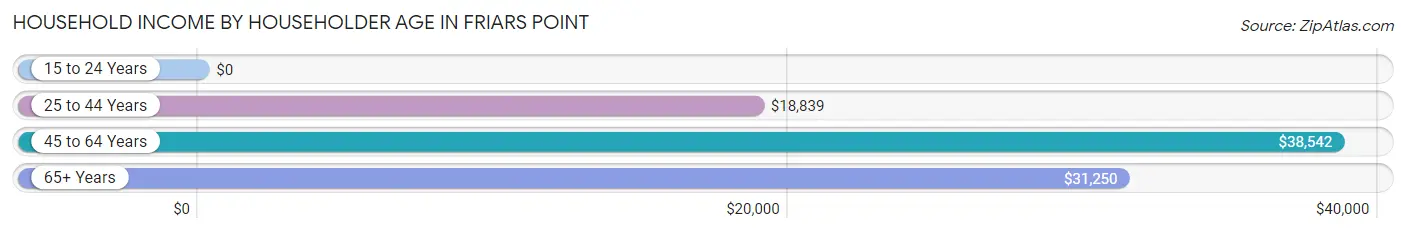
| Income Bracket | # Households | Median Income |
| 15 to 24 Years | 6 (1.4%) | $0 |
| 25 to 44 Years | 184 (42.7%) | $18,839 |
| 45 to 64 Years | 155 (36.0%) | $38,542 |
| 65+ Years | 86 (20.0%) | $31,250 |
| Total | 431 (100.0%) | $25,156 |
Poverty in Friars Point
Income Below Poverty by Sex and Age in Friars Point
With 51.1% poverty level for males and 53.4% for females among the residents of Friars Point, 5 year old males and 15 year old females are the most vulnerable to poverty, with 16 males (100.0%) and 22 females (100.0%) in their respective age groups living below the poverty level.
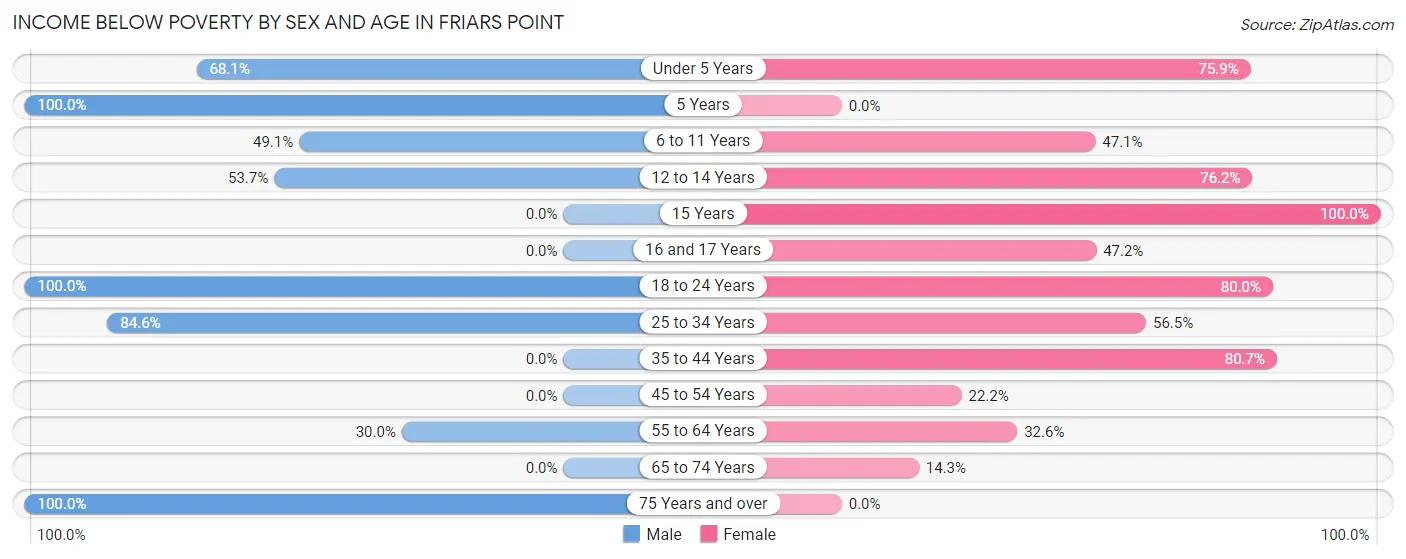
| Age Bracket | Male | Female |
| Under 5 Years | 32 (68.1%) | 66 (75.9%) |
| 5 Years | 16 (100.0%) | 0 (0.0%) |
| 6 to 11 Years | 26 (49.1%) | 32 (47.1%) |
| 12 to 14 Years | 29 (53.7%) | 16 (76.2%) |
| 15 Years | 0 (0.0%) | 22 (100.0%) |
| 16 and 17 Years | 0 (0.0%) | 17 (47.2%) |
| 18 to 24 Years | 54 (100.0%) | 24 (80.0%) |
| 25 to 34 Years | 22 (84.6%) | 48 (56.5%) |
| 35 to 44 Years | 0 (0.0%) | 88 (80.7%) |
| 45 to 54 Years | 0 (0.0%) | 26 (22.2%) |
| 55 to 64 Years | 12 (30.0%) | 14 (32.6%) |
| 65 to 74 Years | 0 (0.0%) | 5 (14.3%) |
| 75 Years and over | 20 (100.0%) | 0 (0.0%) |
| Total | 211 (51.1%) | 358 (53.4%) |
Income Above Poverty by Sex and Age in Friars Point
According to the poverty statistics in Friars Point, males aged 35 to 44 years and females aged 5 years are the age groups that are most secure financially, with 100.0% of males and 100.0% of females in these age groups living above the poverty line.
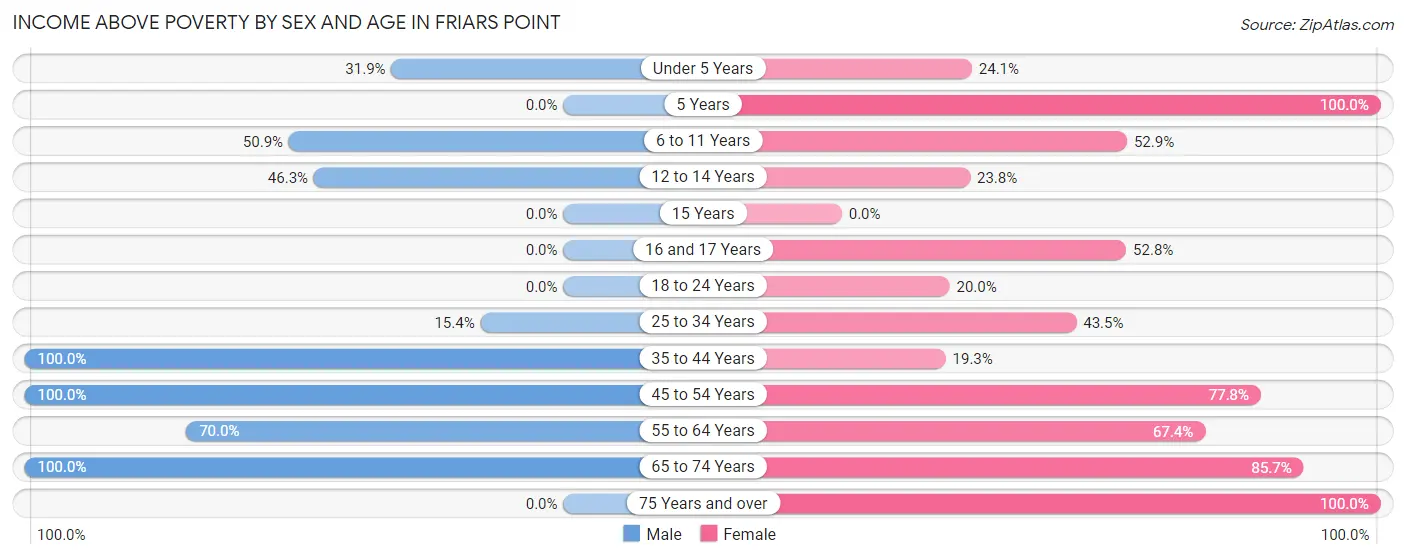
| Age Bracket | Male | Female |
| Under 5 Years | 15 (31.9%) | 21 (24.1%) |
| 5 Years | 0 (0.0%) | 3 (100.0%) |
| 6 to 11 Years | 27 (50.9%) | 36 (52.9%) |
| 12 to 14 Years | 25 (46.3%) | 5 (23.8%) |
| 15 Years | 0 (0.0%) | 0 (0.0%) |
| 16 and 17 Years | 0 (0.0%) | 19 (52.8%) |
| 18 to 24 Years | 0 (0.0%) | 6 (20.0%) |
| 25 to 34 Years | 4 (15.4%) | 37 (43.5%) |
| 35 to 44 Years | 20 (100.0%) | 21 (19.3%) |
| 45 to 54 Years | 41 (100.0%) | 91 (77.8%) |
| 55 to 64 Years | 28 (70.0%) | 29 (67.4%) |
| 65 to 74 Years | 42 (100.0%) | 30 (85.7%) |
| 75 Years and over | 0 (0.0%) | 14 (100.0%) |
| Total | 202 (48.9%) | 312 (46.6%) |
Income Below Poverty Among Married-Couple Families in Friars Point
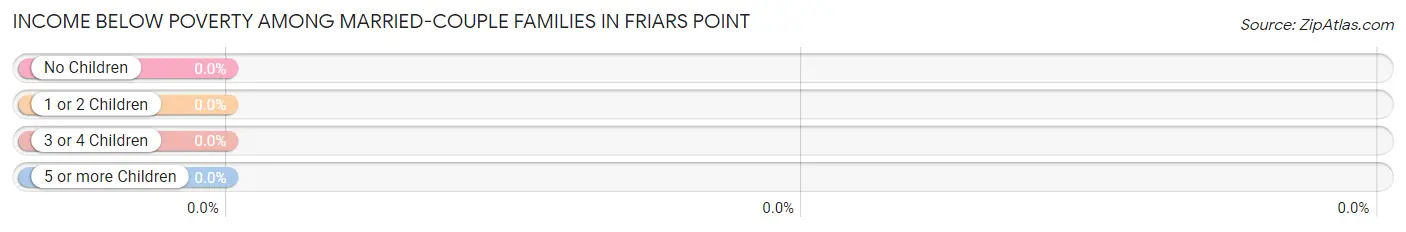
| Children | Above Poverty | Below Poverty |
| No Children | 40 (100.0%) | 0 (0.0%) |
| 1 or 2 Children | 20 (100.0%) | 0 (0.0%) |
| 3 or 4 Children | 0 (0.0%) | 0 (0.0%) |
| 5 or more Children | 0 (0.0%) | 0 (0.0%) |
| Total | 60 (100.0%) | 0 (0.0%) |
Income Below Poverty Among Single-Parent Households in Friars Point
According to the poverty data in Friars Point, 57.9% or 11 single-father households and 68.3% or 157 single-mother households are living below the poverty line. Among single-father households, those with no children have the highest poverty rate, with 11 households (57.9%) experiencing poverty. Likewise, among single-mother households, those with 3 or 4 children have the highest poverty rate, with 37 households (69.8%) falling below the poverty line.
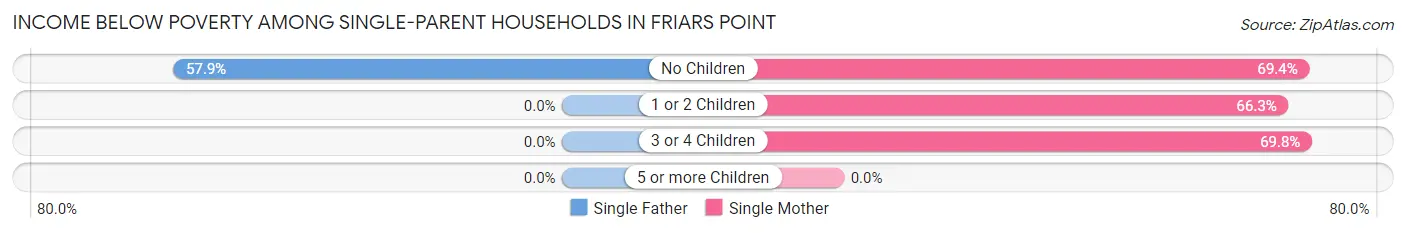
| Children | Single Father | Single Mother |
| No Children | 11 (57.9%) | 59 (69.4%) |
| 1 or 2 Children | 0 (0.0%) | 61 (66.3%) |
| 3 or 4 Children | 0 (0.0%) | 37 (69.8%) |
| 5 or more Children | 0 (0.0%) | 0 (0.0%) |
| Total | 11 (57.9%) | 157 (68.3%) |
Income Below Poverty Among Married-Couple vs Single-Parent Households in Friars Point
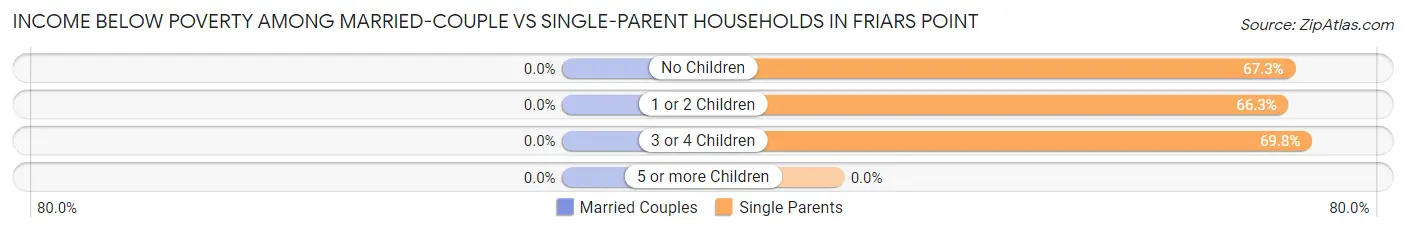
| Children | Married-Couple Families | Single-Parent Households |
| No Children | 0 (0.0%) | 70 (67.3%) |
| 1 or 2 Children | 0 (0.0%) | 61 (66.3%) |
| 3 or 4 Children | 0 (0.0%) | 37 (69.8%) |
| 5 or more Children | 0 (0.0%) | 0 (0.0%) |
| Total | 0 (0.0%) | 168 (67.5%) |
Race in Friars Point
The most populous races in Friars Point are Black / African American (1,069 | 98.7%), and White / Caucasian (14 | 1.3%).
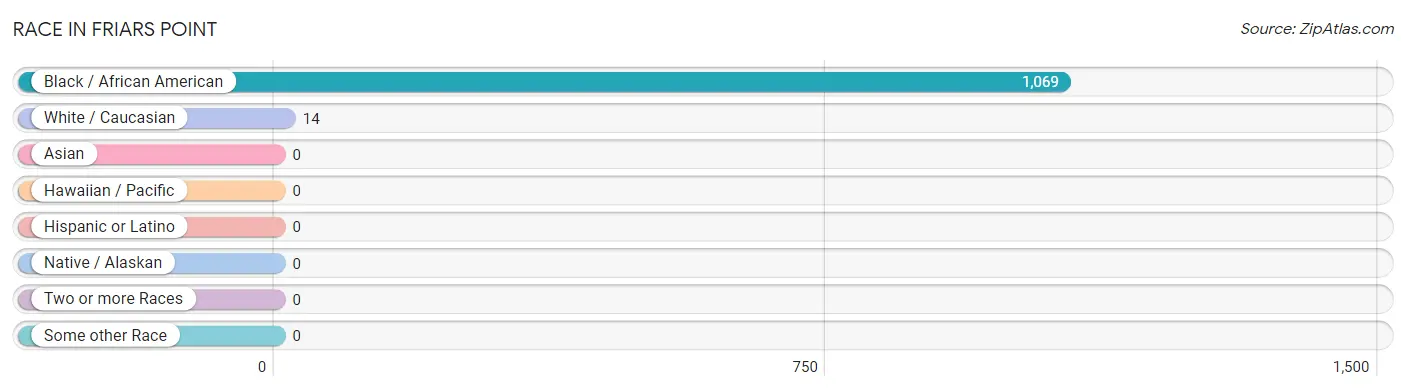
| Race | # Population | % Population |
| Asian | 0 | 0.0% |
| Black / African American | 1,069 | 98.7% |
| Hawaiian / Pacific | 0 | 0.0% |
| Hispanic or Latino | 0 | 0.0% |
| Native / Alaskan | 0 | 0.0% |
| White / Caucasian | 14 | 1.3% |
| Two or more Races | 0 | 0.0% |
| Some other Race | 0 | 0.0% |
| Total | 1,083 | 100.0% |
Ancestry in Friars Point
The most populous ancestries reported in Friars Point are English (5 | 0.5%), Irish (5 | 0.5%), Italian (5 | 0.5%), French (4 | 0.4%), and Scotch-Irish (4 | 0.4%), together accounting for 2.1% of all Friars Point residents.
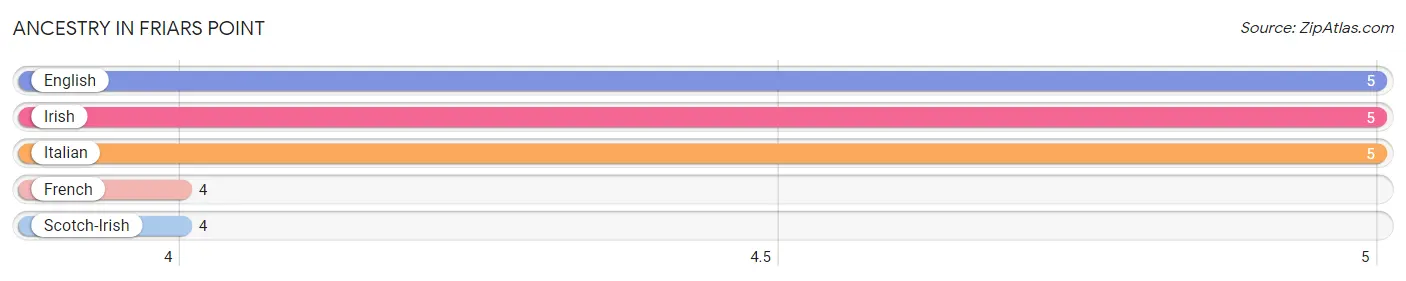
| Ancestry | # Population | % Population |
| English | 5 | 0.5% |
| French | 4 | 0.4% |
| Irish | 5 | 0.5% |
| Italian | 5 | 0.5% |
| Scotch-Irish | 4 | 0.4% | View All 5 Rows |
Immigrants in Friars Point

| Immigration Origin | # Population | % Population | View All 0 Rows |
Sex and Age in Friars Point
Sex and Age in Friars Point
The most populous age groups in Friars Point are 10 to 14 Years (64 | 15.5%) for men and Under 5 Years (87 | 13.0%) for women.
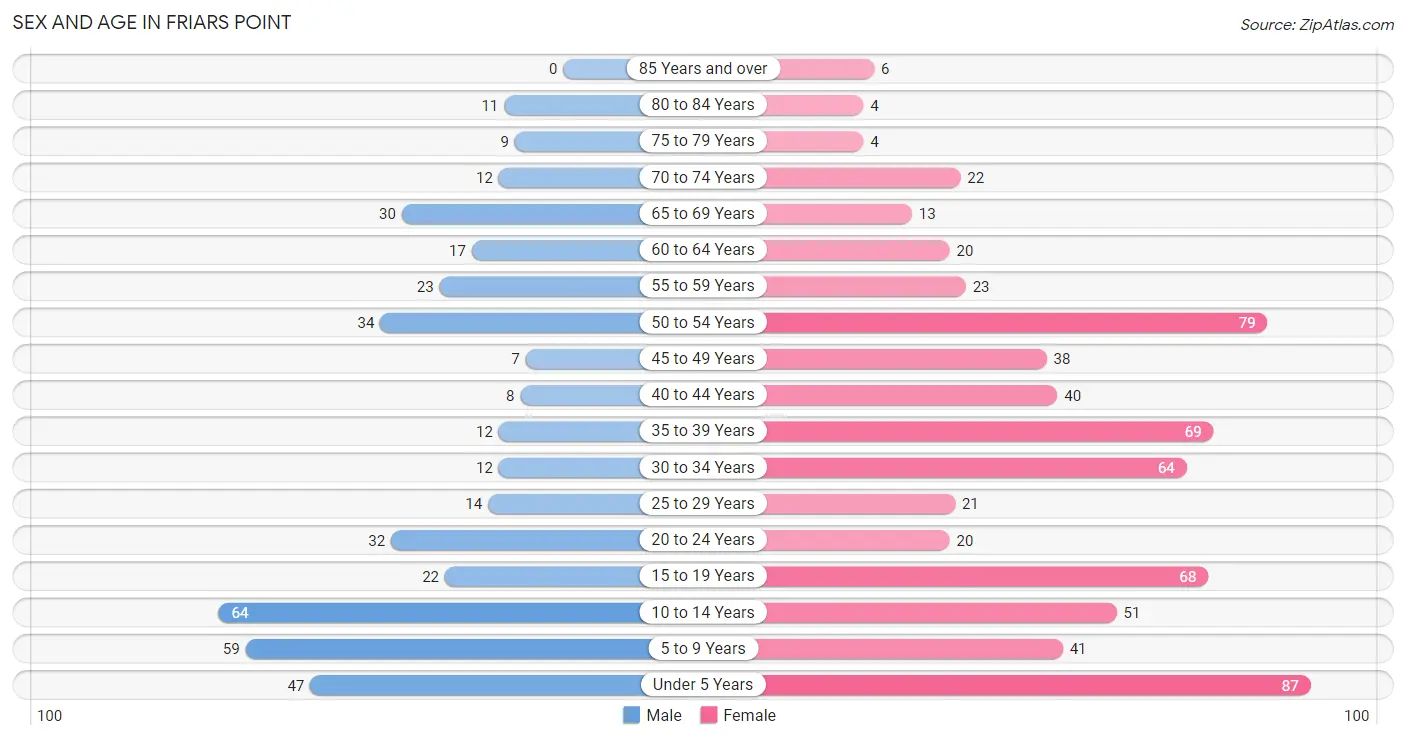
| Age Bracket | Male | Female |
| Under 5 Years | 47 (11.4%) | 87 (13.0%) |
| 5 to 9 Years | 59 (14.3%) | 41 (6.1%) |
| 10 to 14 Years | 64 (15.5%) | 51 (7.6%) |
| 15 to 19 Years | 22 (5.3%) | 68 (10.2%) |
| 20 to 24 Years | 32 (7.7%) | 20 (3.0%) |
| 25 to 29 Years | 14 (3.4%) | 21 (3.1%) |
| 30 to 34 Years | 12 (2.9%) | 64 (9.6%) |
| 35 to 39 Years | 12 (2.9%) | 69 (10.3%) |
| 40 to 44 Years | 8 (1.9%) | 40 (6.0%) |
| 45 to 49 Years | 7 (1.7%) | 38 (5.7%) |
| 50 to 54 Years | 34 (8.2%) | 79 (11.8%) |
| 55 to 59 Years | 23 (5.6%) | 23 (3.4%) |
| 60 to 64 Years | 17 (4.1%) | 20 (3.0%) |
| 65 to 69 Years | 30 (7.3%) | 13 (1.9%) |
| 70 to 74 Years | 12 (2.9%) | 22 (3.3%) |
| 75 to 79 Years | 9 (2.2%) | 4 (0.6%) |
| 80 to 84 Years | 11 (2.7%) | 4 (0.6%) |
| 85 Years and over | 0 (0.0%) | 6 (0.9%) |
| Total | 413 (100.0%) | 670 (100.0%) |
Families and Households in Friars Point
Median Family Size in Friars Point
The median family size in Friars Point is 3.01 persons per family, with single female/mother families (230 | 74.4%) accounting for the largest median family size of 3.2 persons per family. On the other hand, single male/father families (19 | 6.1%) represent the smallest median family size with 2.26 persons per family.
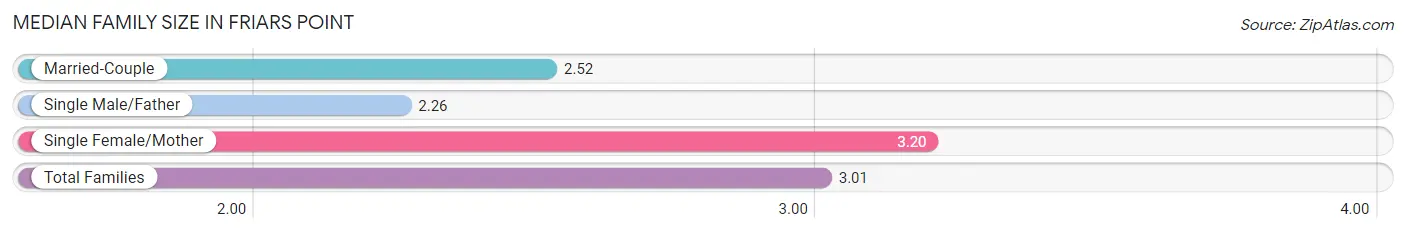
| Family Type | # Families | Family Size |
| Married-Couple | 60 (19.4%) | 2.52 |
| Single Male/Father | 19 (6.1%) | 2.26 |
| Single Female/Mother | 230 (74.4%) | 3.20 |
| Total Families | 309 (100.0%) | 3.01 |
Median Household Size in Friars Point
The median household size in Friars Point is 2.51 persons per household, with single female/mother households (230 | 53.4%) accounting for the largest median household size of 3.24 persons per household. non-family households (122 | 28.3%) represent the smallest median household size with 1.17 persons per household.
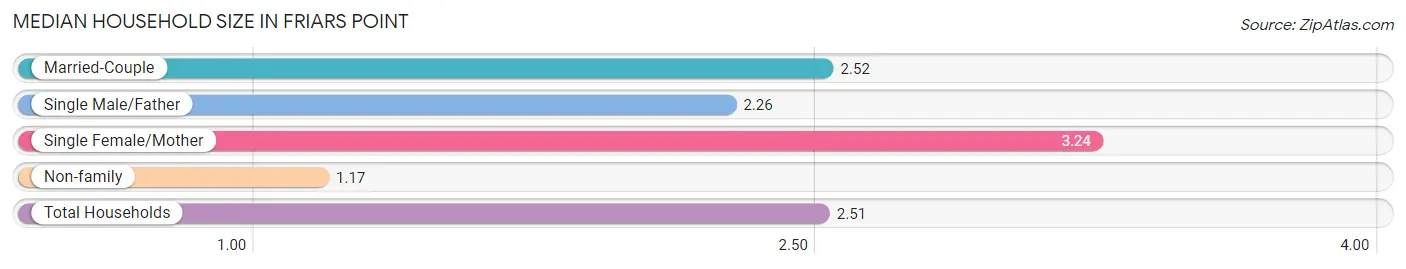
| Household Type | # Households | Household Size |
| Married-Couple | 60 (13.9%) | 2.52 |
| Single Male/Father | 19 (4.4%) | 2.26 |
| Single Female/Mother | 230 (53.4%) | 3.24 |
| Non-family | 122 (28.3%) | 1.17 |
| Total Households | 431 (100.0%) | 2.51 |
Household Size by Marriage Status in Friars Point
Out of a total of 431 households in Friars Point, 309 (71.7%) are family households, while 122 (28.3%) are nonfamily households. The most numerous type of family households are 2-person households, comprising 147, and the most common type of nonfamily households are 1-person households, comprising 90.
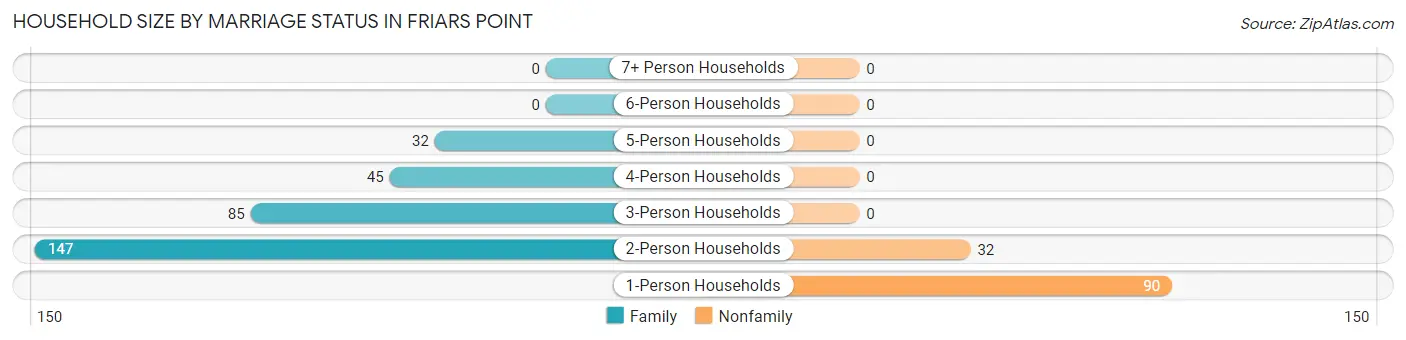
| Household Size | Family Households | Nonfamily Households |
| 1-Person Households | - | 90 (20.9%) |
| 2-Person Households | 147 (34.1%) | 32 (7.4%) |
| 3-Person Households | 85 (19.7%) | 0 (0.0%) |
| 4-Person Households | 45 (10.4%) | 0 (0.0%) |
| 5-Person Households | 32 (7.4%) | 0 (0.0%) |
| 6-Person Households | 0 (0.0%) | 0 (0.0%) |
| 7+ Person Households | 0 (0.0%) | 0 (0.0%) |
| Total | 309 (71.7%) | 122 (28.3%) |
Female Fertility in Friars Point
Fertility by Age in Friars Point
Average fertility rate in Friars Point is 50.0 births per 1,000 women. Women in the age bracket of 20 to 34 years have the highest fertility rate with 86.0 births per 1,000 women. Women in the age bracket of 20 to 34 years acount for 52.9% of all women with births.
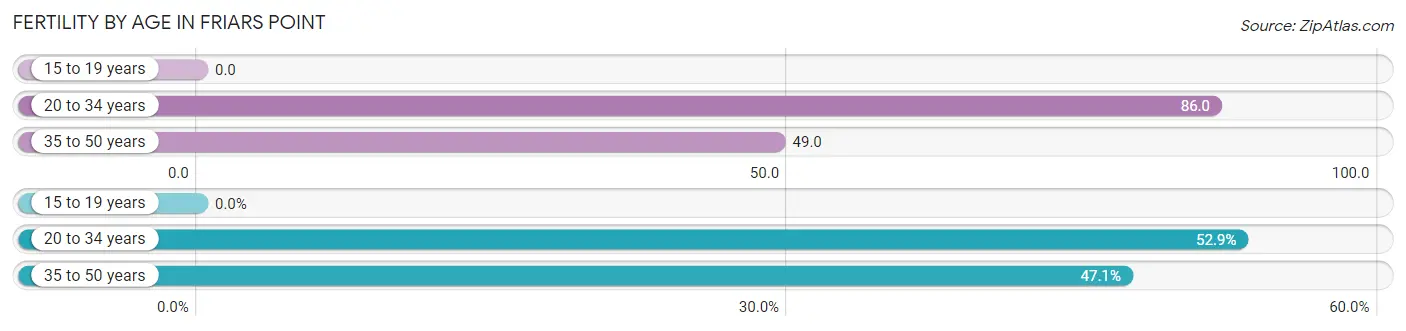
| Age Bracket | Women with Births | Births / 1,000 Women |
| 15 to 19 years | 0 (0.0%) | 0.0 |
| 20 to 34 years | 9 (52.9%) | 86.0 |
| 35 to 50 years | 8 (47.1%) | 49.0 |
| Total | 17 (100.0%) | 50.0 |
Fertility by Age by Marriage Status in Friars Point
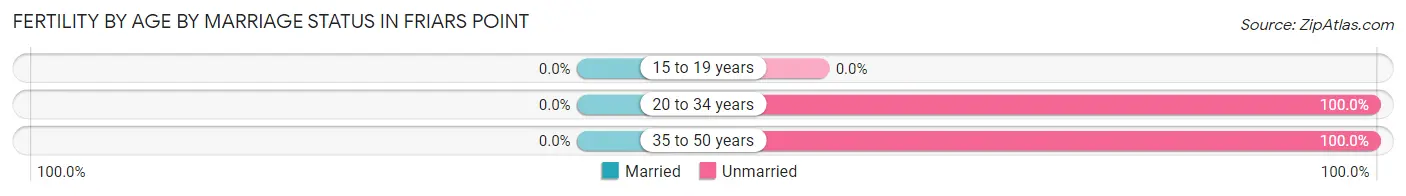
| Age Bracket | Married | Unmarried |
| 15 to 19 years | 0 (0.0%) | 0 (0.0%) |
| 20 to 34 years | 0 (0.0%) | 9 (100.0%) |
| 35 to 50 years | 0 (0.0%) | 8 (100.0%) |
| Total | 0 (0.0%) | 17 (100.0%) |
Fertility by Education in Friars Point
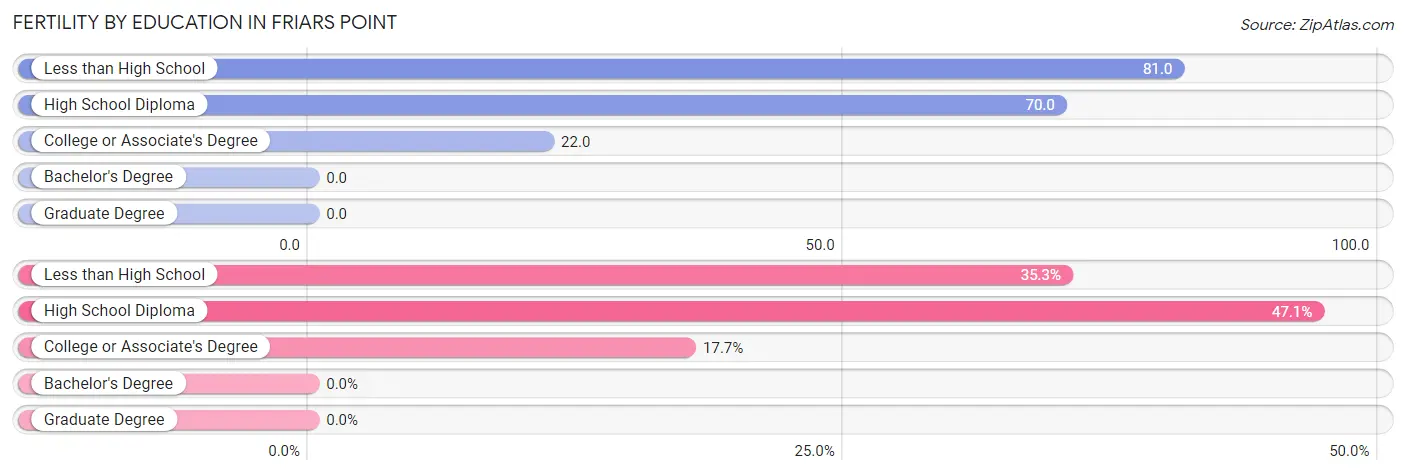
| Educational Attainment | Women with Births | Births / 1,000 Women |
| Less than High School | 6 (35.3%) | 81.0 |
| High School Diploma | 8 (47.1%) | 70.0 |
| College or Associate's Degree | 3 (17.6%) | 22.0 |
| Bachelor's Degree | 0 (0.0%) | 0.0 |
| Graduate Degree | 0 (0.0%) | 0.0 |
| Total | 17 (100.0%) | 50.0 |
Fertility by Education by Marriage Status in Friars Point
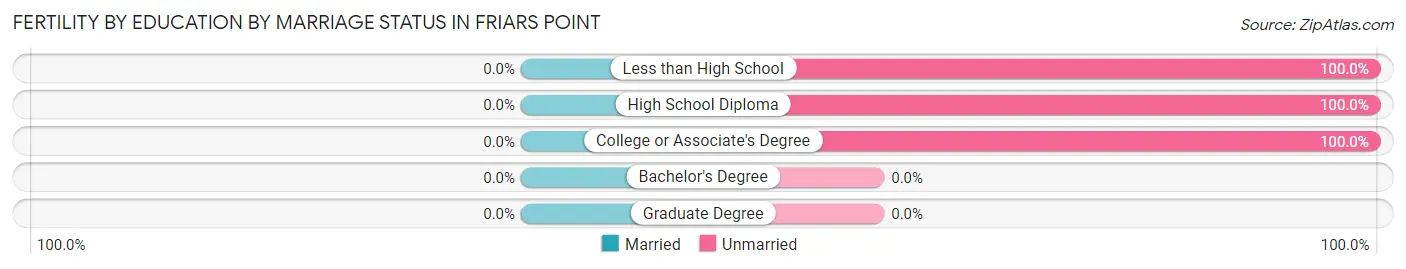
| Educational Attainment | Married | Unmarried |
| Less than High School | 0 (0.0%) | 6 (100.0%) |
| High School Diploma | 0 (0.0%) | 8 (100.0%) |
| College or Associate's Degree | 0 (0.0%) | 3 (100.0%) |
| Bachelor's Degree | 0 (0.0%) | 0 (0.0%) |
| Graduate Degree | 0 (0.0%) | 0 (0.0%) |
| Total | 0 (0.0%) | 17 (100.0%) |
Employment Characteristics in Friars Point
Employment by Class of Employer in Friars Point
Among the 357 employed individuals in Friars Point, private company employees (237 | 66.4%), state government employees (56 | 15.7%), and local government employees (52 | 14.6%) make up the most common classes of employment.
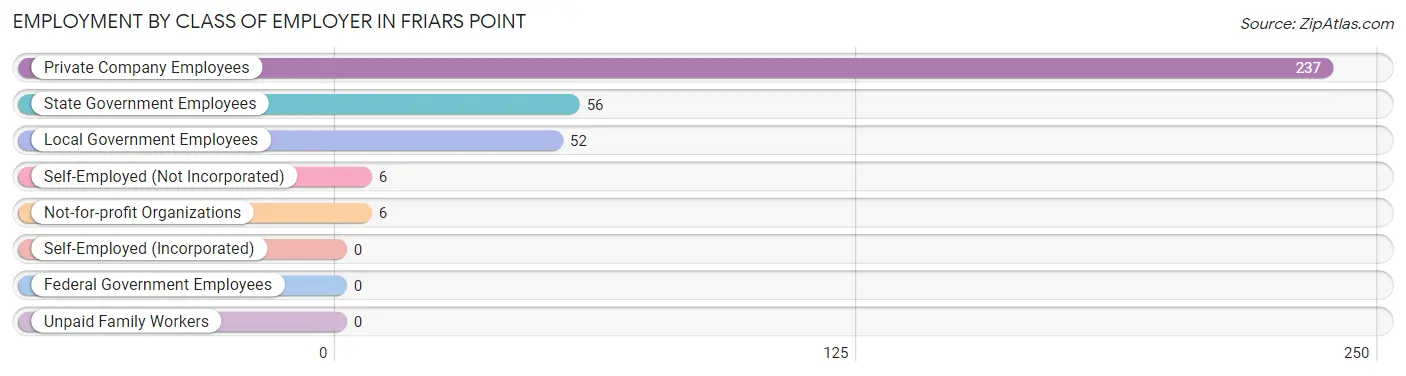
| Employer Class | # Employees | % Employees |
| Private Company Employees | 237 | 66.4% |
| Self-Employed (Incorporated) | 0 | 0.0% |
| Self-Employed (Not Incorporated) | 6 | 1.7% |
| Not-for-profit Organizations | 6 | 1.7% |
| Local Government Employees | 52 | 14.6% |
| State Government Employees | 56 | 15.7% |
| Federal Government Employees | 0 | 0.0% |
| Unpaid Family Workers | 0 | 0.0% |
| Total | 357 | 100.0% |
Employment Status by Age in Friars Point
According to the labor force statistics for Friars Point, out of the total population over 16 years of age (712), 60.3% or 429 individuals are in the labor force, with 10.5% or 45 of them unemployed. The age group with the highest labor force participation rate is 25 to 29 years, with 100.0% or 35 individuals in the labor force. Within the labor force, the 20 to 24 years age range has the highest percentage of unemployed individuals, with 44.0% or 11 of them being unemployed.
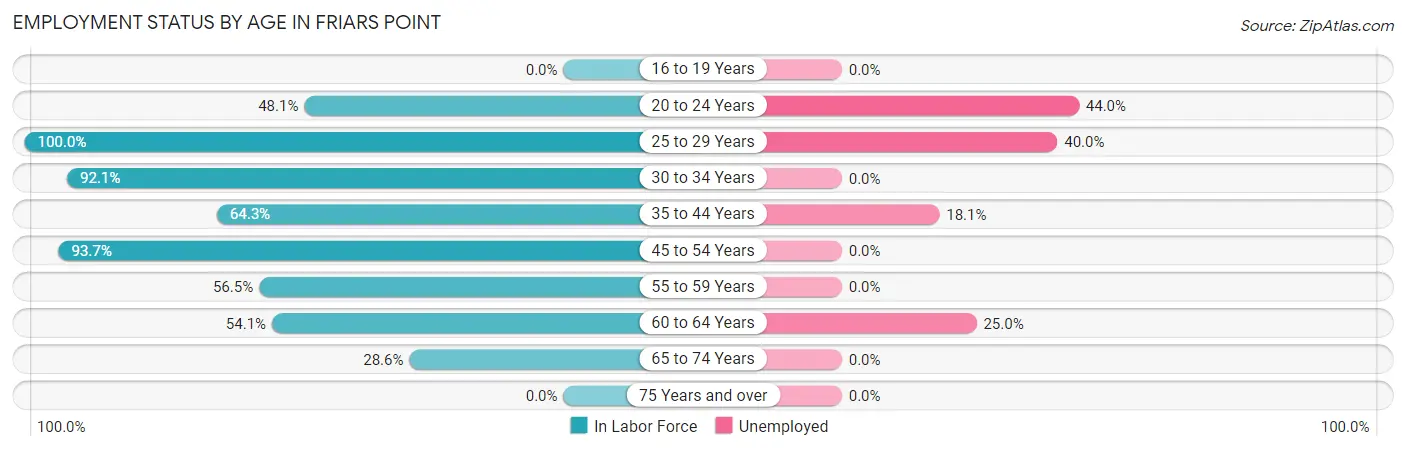
| Age Bracket | In Labor Force | Unemployed |
| 16 to 19 Years | 0 (0.0%) | 0 (0.0%) |
| 20 to 24 Years | 25 (48.1%) | 11 (44.0%) |
| 25 to 29 Years | 35 (100.0%) | 14 (40.0%) |
| 30 to 34 Years | 70 (92.1%) | 0 (0.0%) |
| 35 to 44 Years | 83 (64.3%) | 15 (18.1%) |
| 45 to 54 Years | 148 (93.7%) | 0 (0.0%) |
| 55 to 59 Years | 26 (56.5%) | 0 (0.0%) |
| 60 to 64 Years | 20 (54.1%) | 5 (25.0%) |
| 65 to 74 Years | 22 (28.6%) | 0 (0.0%) |
| 75 Years and over | 0 (0.0%) | 0 (0.0%) |
| Total | 429 (60.3%) | 45 (10.5%) |
Employment Status by Educational Attainment in Friars Point
According to labor force statistics for Friars Point, 79.4% of individuals (382) out of the total population between 25 and 64 years of age (481) are in the labor force, with 8.9% or 34 of them being unemployed. The group with the highest labor force participation rate are those with the educational attainment of bachelor's degree or higher, with 100.0% or 27 individuals in the labor force. Within the labor force, individuals with less than high school education have the highest percentage of unemployment, with 33.3% or 10 of them being unemployed.
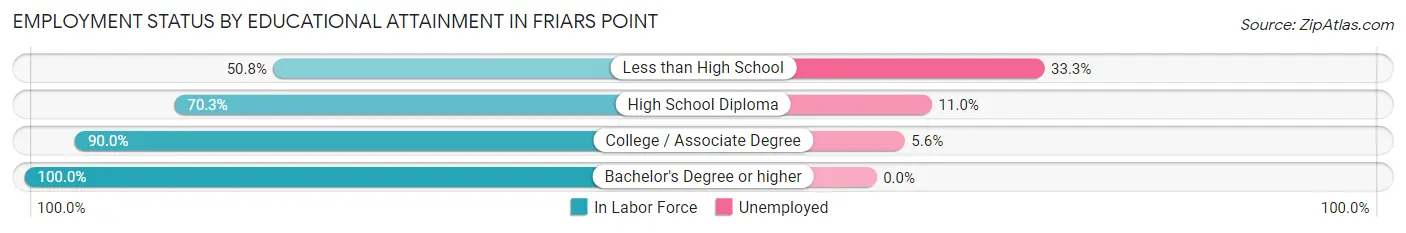
| Educational Attainment | In Labor Force | Unemployed |
| Less than High School | 30 (50.8%) | 20 (33.3%) |
| High School Diploma | 109 (70.3%) | 17 (11.0%) |
| College / Associate Degree | 216 (90.0%) | 13 (5.6%) |
| Bachelor's Degree or higher | 27 (100.0%) | 0 (0.0%) |
| Total | 382 (79.4%) | 43 (8.9%) |
Employment Occupations by Sex in Friars Point
Management, Business, Science and Arts Occupations
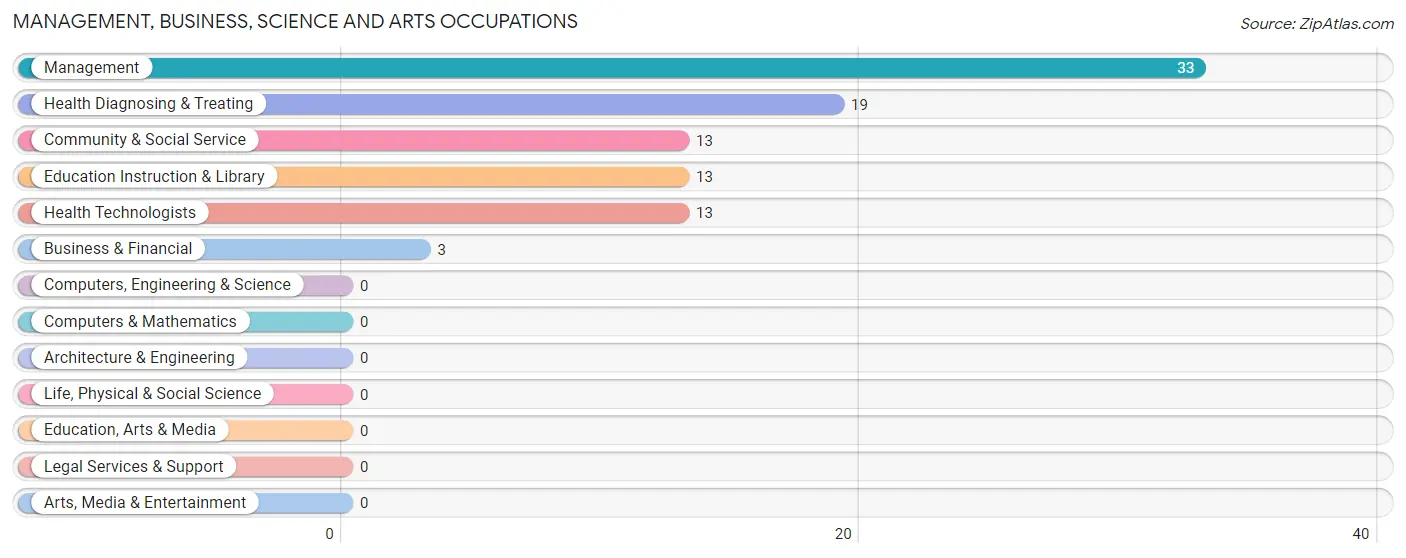
The most common Management, Business, Science and Arts occupations in Friars Point are Management (33 | 8.6%), Health Diagnosing & Treating (19 | 5.0%), Community & Social Service (13 | 3.4%), Education Instruction & Library (13 | 3.4%), and Health Technologists (13 | 3.4%).
Management, Business, Science and Arts Occupations by Sex
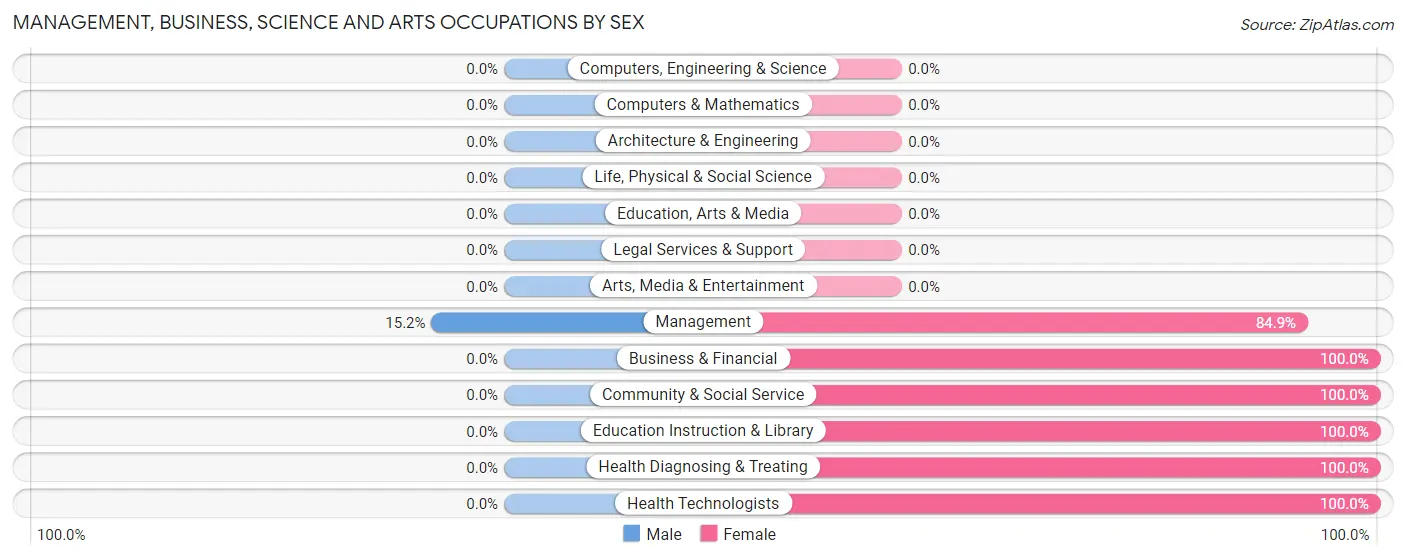
| Occupation | Male | Female |
| Management | 5 (15.1%) | 28 (84.9%) |
| Business & Financial | 0 (0.0%) | 3 (100.0%) |
| Computers, Engineering & Science | 0 (0.0%) | 0 (0.0%) |
| Computers & Mathematics | 0 (0.0%) | 0 (0.0%) |
| Architecture & Engineering | 0 (0.0%) | 0 (0.0%) |
| Life, Physical & Social Science | 0 (0.0%) | 0 (0.0%) |
| Community & Social Service | 0 (0.0%) | 13 (100.0%) |
| Education, Arts & Media | 0 (0.0%) | 0 (0.0%) |
| Legal Services & Support | 0 (0.0%) | 0 (0.0%) |
| Education Instruction & Library | 0 (0.0%) | 13 (100.0%) |
| Arts, Media & Entertainment | 0 (0.0%) | 0 (0.0%) |
| Health Diagnosing & Treating | 0 (0.0%) | 19 (100.0%) |
| Health Technologists | 0 (0.0%) | 13 (100.0%) |
| Total (Category) | 5 (7.3%) | 63 (92.6%) |
| Total (Overall) | 91 (23.7%) | 293 (76.3%) |
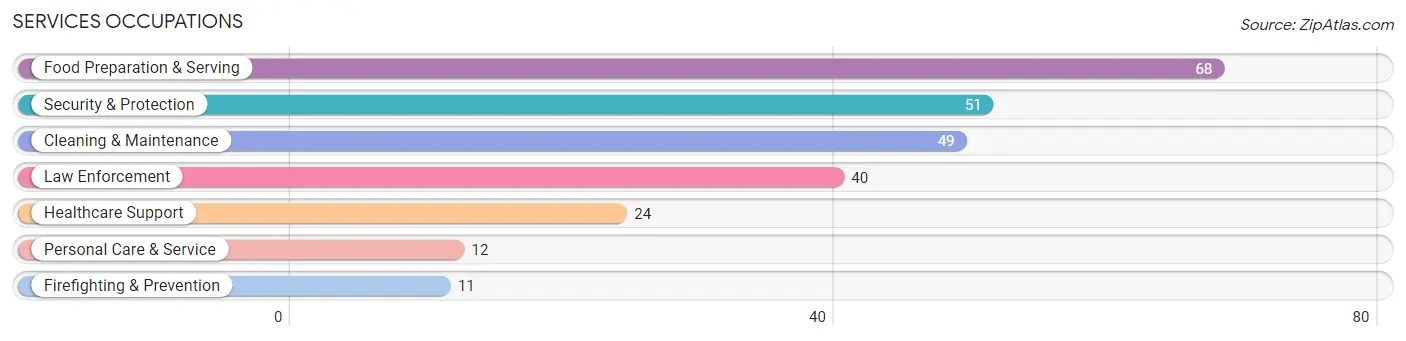
Services Occupations
The most common Services occupations in Friars Point are Food Preparation & Serving (68 | 17.7%), Security & Protection (51 | 13.3%), Cleaning & Maintenance (49 | 12.8%), Law Enforcement (40 | 10.4%), and Healthcare Support (24 | 6.2%).
Services Occupations by Sex
Within the Services occupations in Friars Point, the most male-oriented occupations are Law Enforcement (35.0%), Security & Protection (27.5%), and Cleaning & Maintenance (24.5%), while the most female-oriented occupations are Healthcare Support (100.0%), Firefighting & Prevention (100.0%), and Personal Care & Service (100.0%).
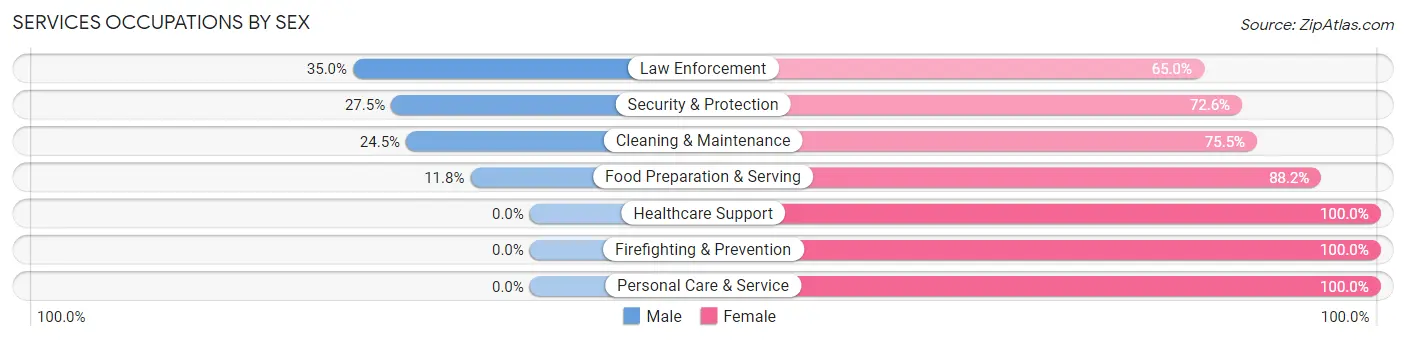
| Occupation | Male | Female |
| Healthcare Support | 0 (0.0%) | 24 (100.0%) |
| Security & Protection | 14 (27.5%) | 37 (72.6%) |
| Firefighting & Prevention | 0 (0.0%) | 11 (100.0%) |
| Law Enforcement | 14 (35.0%) | 26 (65.0%) |
| Food Preparation & Serving | 8 (11.8%) | 60 (88.2%) |
| Cleaning & Maintenance | 12 (24.5%) | 37 (75.5%) |
| Personal Care & Service | 0 (0.0%) | 12 (100.0%) |
| Total (Category) | 34 (16.7%) | 170 (83.3%) |
| Total (Overall) | 91 (23.7%) | 293 (76.3%) |
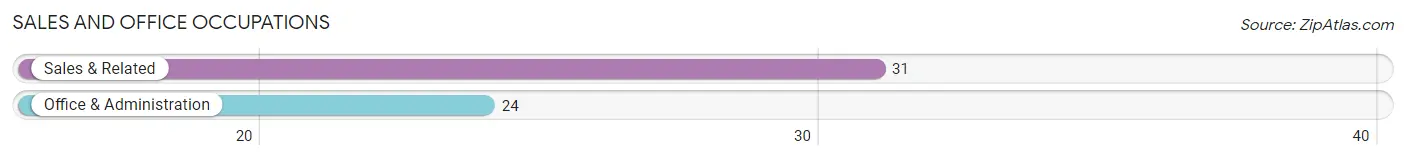
Sales and Office Occupations
The most common Sales and Office occupations in Friars Point are Sales & Related (31 | 8.1%), and Office & Administration (24 | 6.2%).
Sales and Office Occupations by Sex

| Occupation | Male | Female |
| Sales & Related | 6 (19.4%) | 25 (80.6%) |
| Office & Administration | 7 (29.2%) | 17 (70.8%) |
| Total (Category) | 13 (23.6%) | 42 (76.4%) |
| Total (Overall) | 91 (23.7%) | 293 (76.3%) |
Natural Resources, Construction and Maintenance Occupations
The most common Natural Resources, Construction and Maintenance occupations in Friars Point are Construction & Extraction (4 | 1.0%), and Installation, Maintenance & Repair (4 | 1.0%).
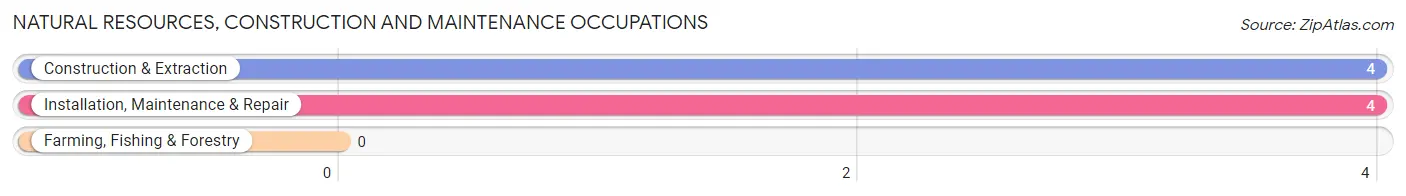
Natural Resources, Construction and Maintenance Occupations by Sex

| Occupation | Male | Female |
| Farming, Fishing & Forestry | 0 (0.0%) | 0 (0.0%) |
| Construction & Extraction | 4 (100.0%) | 0 (0.0%) |
| Installation, Maintenance & Repair | 4 (100.0%) | 0 (0.0%) |
| Total (Category) | 8 (100.0%) | 0 (0.0%) |
| Total (Overall) | 91 (23.7%) | 293 (76.3%) |
Production, Transportation and Moving Occupations
The most common Production, Transportation and Moving occupations in Friars Point are Material Moving (19 | 5.0%), Transportation (18 | 4.7%), and Production (12 | 3.1%).
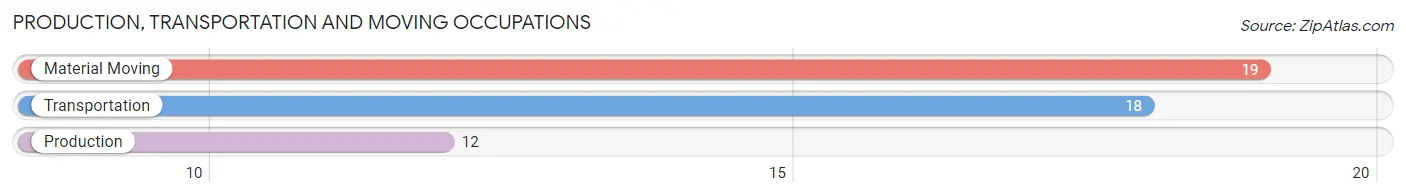
Production, Transportation and Moving Occupations by Sex
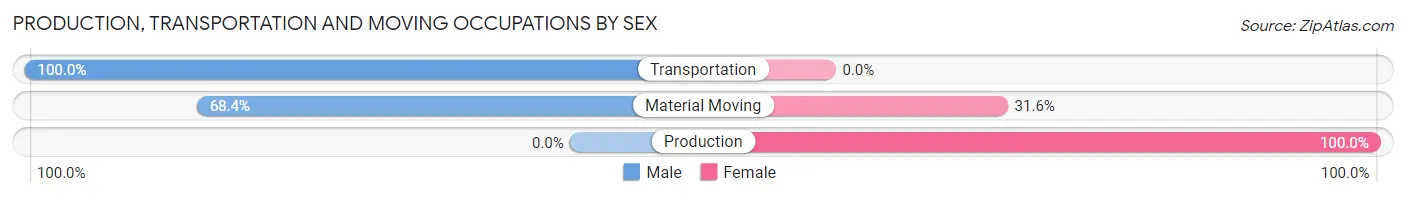
| Occupation | Male | Female |
| Production | 0 (0.0%) | 12 (100.0%) |
| Transportation | 18 (100.0%) | 0 (0.0%) |
| Material Moving | 13 (68.4%) | 6 (31.6%) |
| Total (Category) | 31 (63.3%) | 18 (36.7%) |
| Total (Overall) | 91 (23.7%) | 293 (76.3%) |
Employment Industries by Sex in Friars Point
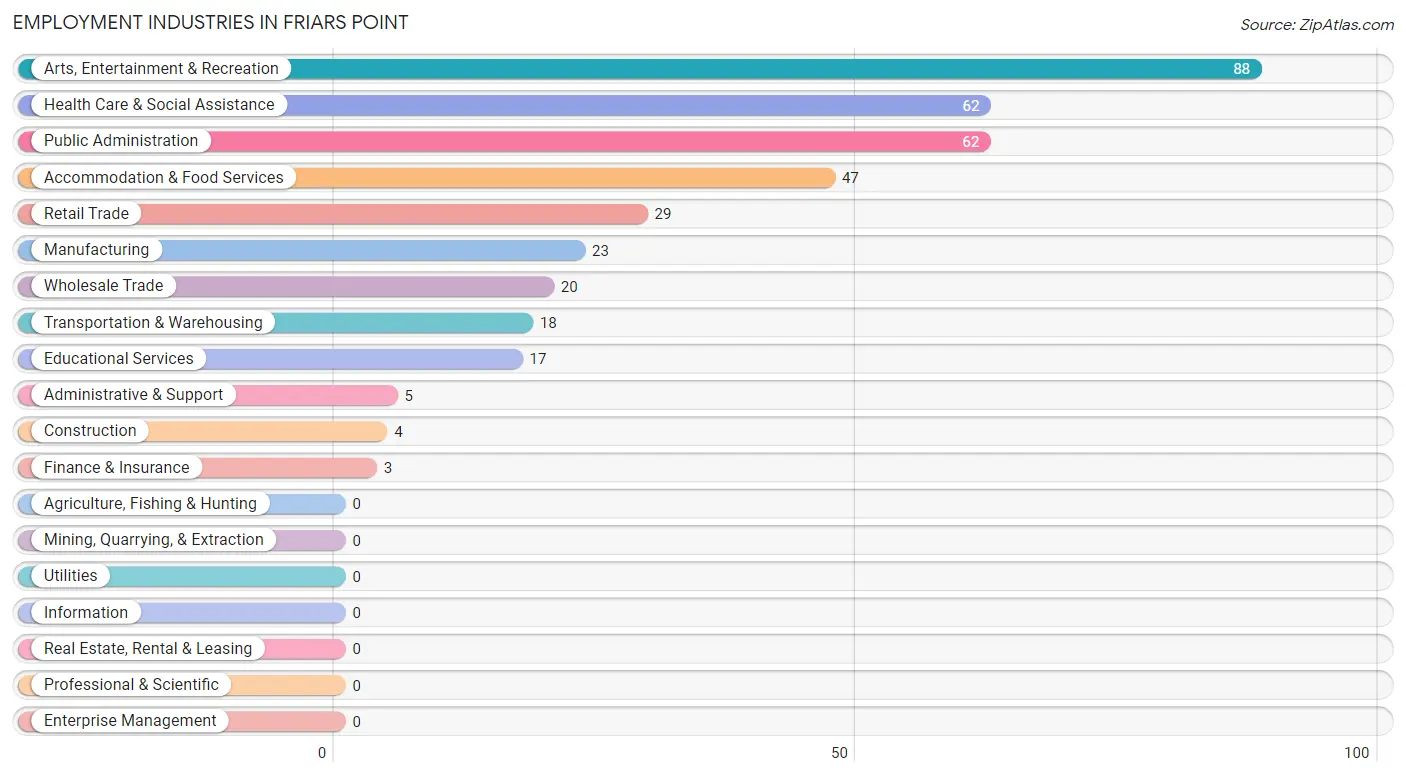
Employment Industries in Friars Point
The major employment industries in Friars Point include Arts, Entertainment & Recreation (88 | 22.9%), Health Care & Social Assistance (62 | 16.2%), Public Administration (62 | 16.2%), Accommodation & Food Services (47 | 12.2%), and Retail Trade (29 | 7.5%).
Employment Industries by Sex in Friars Point
The Friars Point industries that see more men than women are Construction (100.0%), Wholesale Trade (100.0%), and Transportation & Warehousing (100.0%), whereas the industries that tend to have a higher number of women are Manufacturing (100.0%), Retail Trade (100.0%), and Finance & Insurance (100.0%).
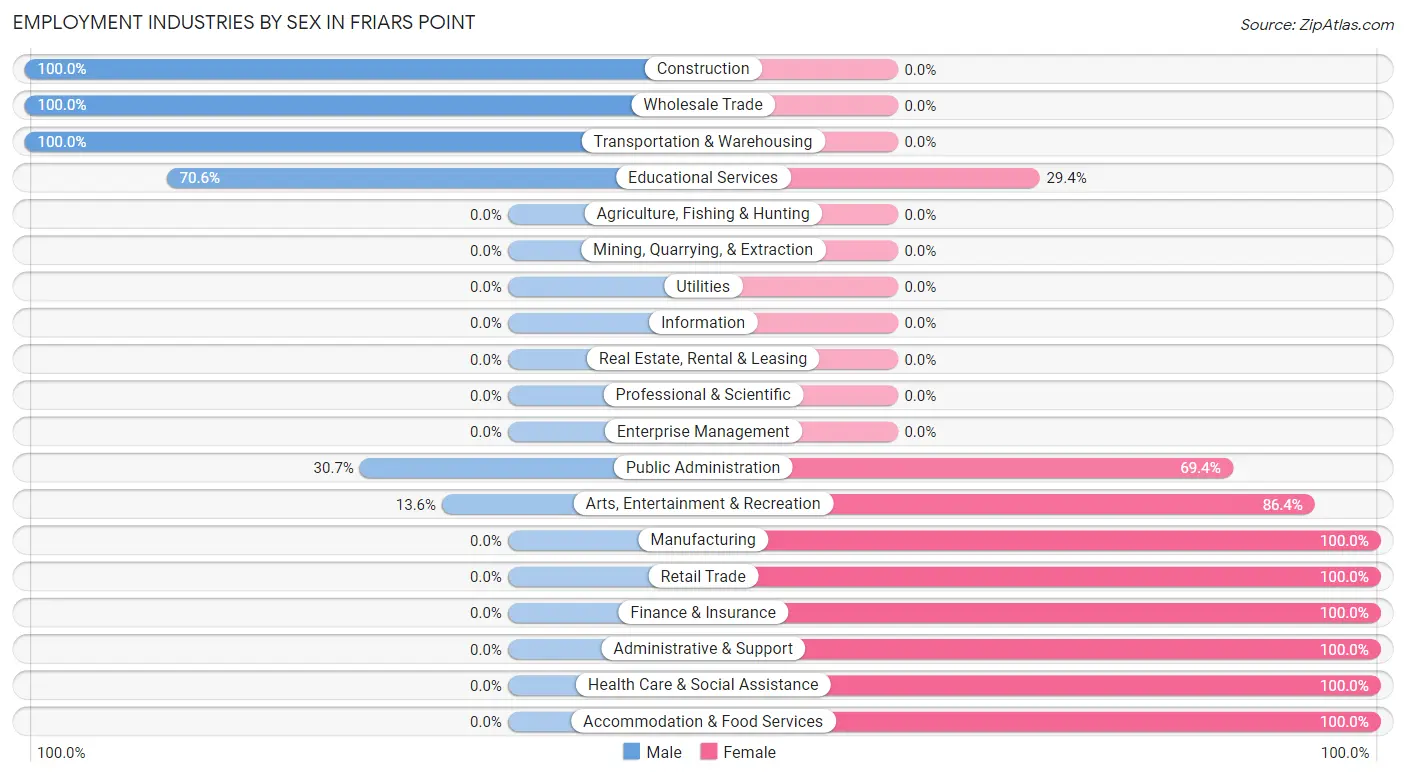
| Industry | Male | Female |
| Agriculture, Fishing & Hunting | 0 (0.0%) | 0 (0.0%) |
| Mining, Quarrying, & Extraction | 0 (0.0%) | 0 (0.0%) |
| Construction | 4 (100.0%) | 0 (0.0%) |
| Manufacturing | 0 (0.0%) | 23 (100.0%) |
| Wholesale Trade | 20 (100.0%) | 0 (0.0%) |
| Retail Trade | 0 (0.0%) | 29 (100.0%) |
| Transportation & Warehousing | 18 (100.0%) | 0 (0.0%) |
| Utilities | 0 (0.0%) | 0 (0.0%) |
| Information | 0 (0.0%) | 0 (0.0%) |
| Finance & Insurance | 0 (0.0%) | 3 (100.0%) |
| Real Estate, Rental & Leasing | 0 (0.0%) | 0 (0.0%) |
| Professional & Scientific | 0 (0.0%) | 0 (0.0%) |
| Enterprise Management | 0 (0.0%) | 0 (0.0%) |
| Administrative & Support | 0 (0.0%) | 5 (100.0%) |
| Educational Services | 12 (70.6%) | 5 (29.4%) |
| Health Care & Social Assistance | 0 (0.0%) | 62 (100.0%) |
| Arts, Entertainment & Recreation | 12 (13.6%) | 76 (86.4%) |
| Accommodation & Food Services | 0 (0.0%) | 47 (100.0%) |
| Public Administration | 19 (30.6%) | 43 (69.4%) |
| Total | 91 (23.7%) | 293 (76.3%) |
Education in Friars Point
School Enrollment in Friars Point
The most common levels of schooling among the 330 students in Friars Point are middle school (96 | 29.1%), high school (72 | 21.8%), and elementary school (66 | 20.0%).
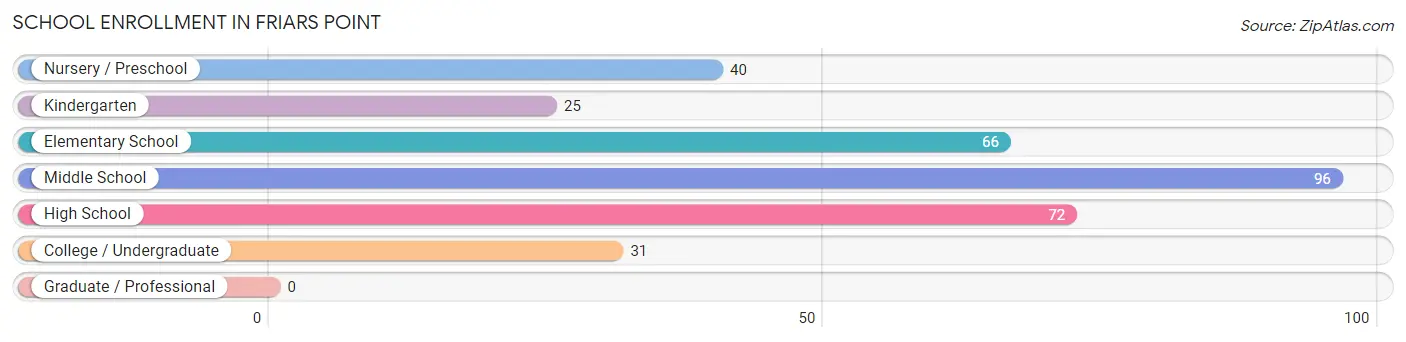
| School Level | # Students | % Students |
| Nursery / Preschool | 40 | 12.1% |
| Kindergarten | 25 | 7.6% |
| Elementary School | 66 | 20.0% |
| Middle School | 96 | 29.1% |
| High School | 72 | 21.8% |
| College / Undergraduate | 31 | 9.4% |
| Graduate / Professional | 0 | 0.0% |
| Total | 330 | 100.0% |
School Enrollment by Age by Funding Source in Friars Point
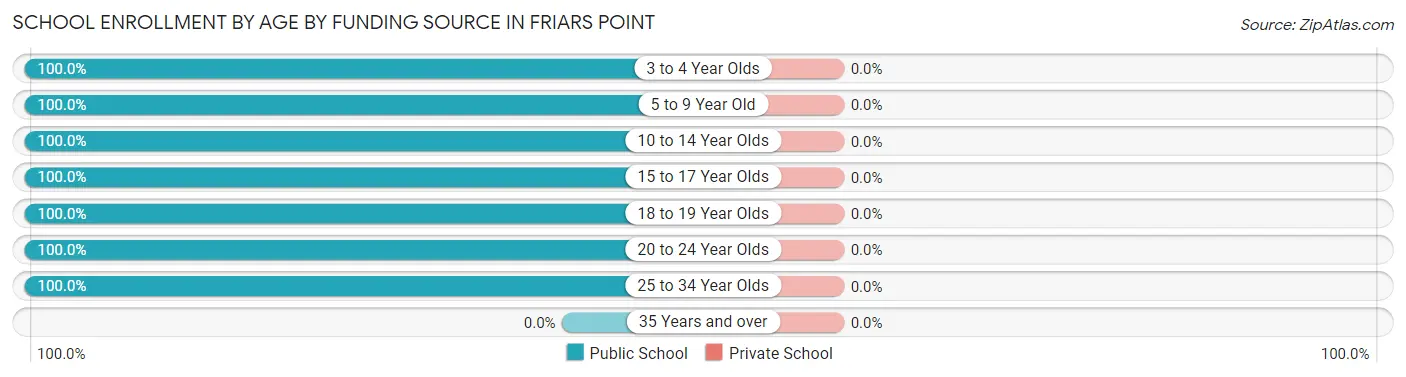
| Age Bracket | Public School | Private School |
| 3 to 4 Year Olds | 31 (100.0%) | 0 (0.0%) |
| 5 to 9 Year Old | 100 (100.0%) | 0 (0.0%) |
| 10 to 14 Year Olds | 102 (100.0%) | 0 (0.0%) |
| 15 to 17 Year Olds | 39 (100.0%) | 0 (0.0%) |
| 18 to 19 Year Olds | 32 (100.0%) | 0 (0.0%) |
| 20 to 24 Year Olds | 19 (100.0%) | 0 (0.0%) |
| 25 to 34 Year Olds | 7 (100.0%) | 0 (0.0%) |
| 35 Years and over | 0 (0.0%) | 0 (0.0%) |
| Total | 330 (100.0%) | 0 (0.0%) |
Educational Attainment by Field of Study in Friars Point
Education (15 | 34.1%), business (13 | 29.5%), science & technology (11 | 25.0%), and liberal arts & history (5 | 11.4%) are the most common fields of study among 44 individuals in Friars Point who have obtained a bachelor's degree or higher.
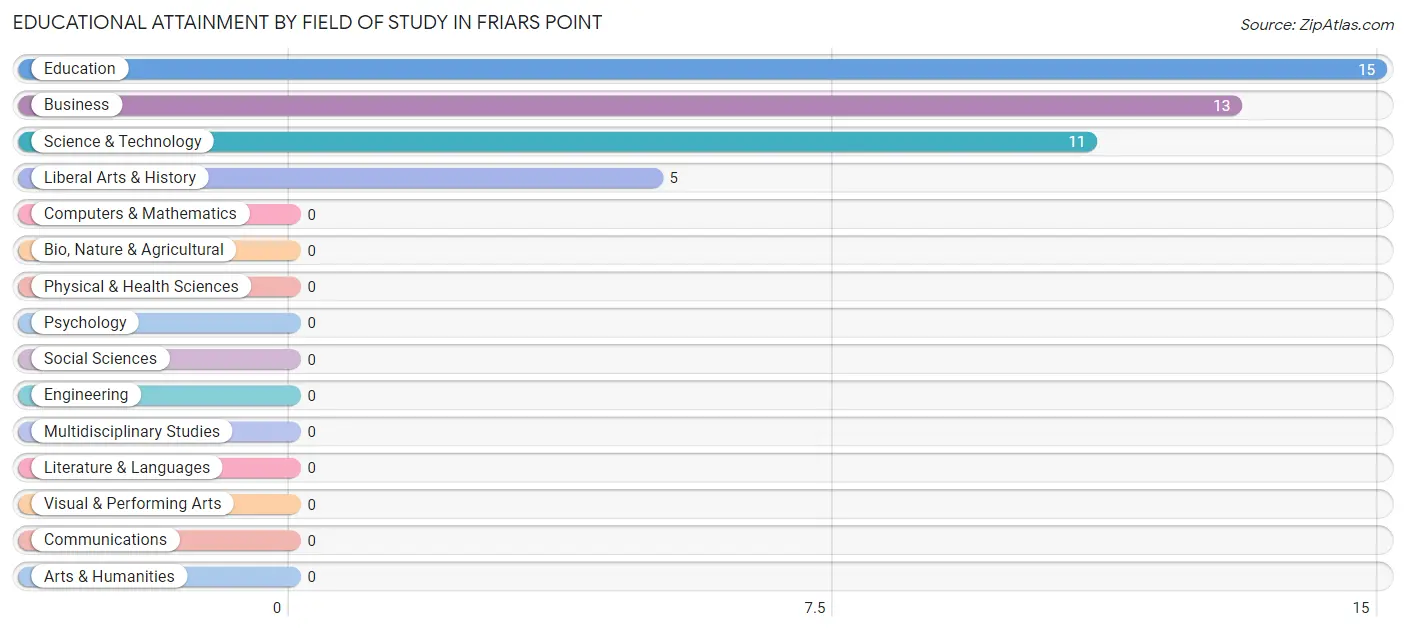
| Field of Study | # Graduates | % Graduates |
| Computers & Mathematics | 0 | 0.0% |
| Bio, Nature & Agricultural | 0 | 0.0% |
| Physical & Health Sciences | 0 | 0.0% |
| Psychology | 0 | 0.0% |
| Social Sciences | 0 | 0.0% |
| Engineering | 0 | 0.0% |
| Multidisciplinary Studies | 0 | 0.0% |
| Science & Technology | 11 | 25.0% |
| Business | 13 | 29.5% |
| Education | 15 | 34.1% |
| Literature & Languages | 0 | 0.0% |
| Liberal Arts & History | 5 | 11.4% |
| Visual & Performing Arts | 0 | 0.0% |
| Communications | 0 | 0.0% |
| Arts & Humanities | 0 | 0.0% |
| Total | 44 | 100.0% |
Transportation & Commute in Friars Point
Vehicle Availability by Sex in Friars Point
The most prevalent vehicle ownership categories in Friars Point are males with 2 vehicles (45, accounting for 49.4%) and females with 2 vehicles (69, making up 16.9%).
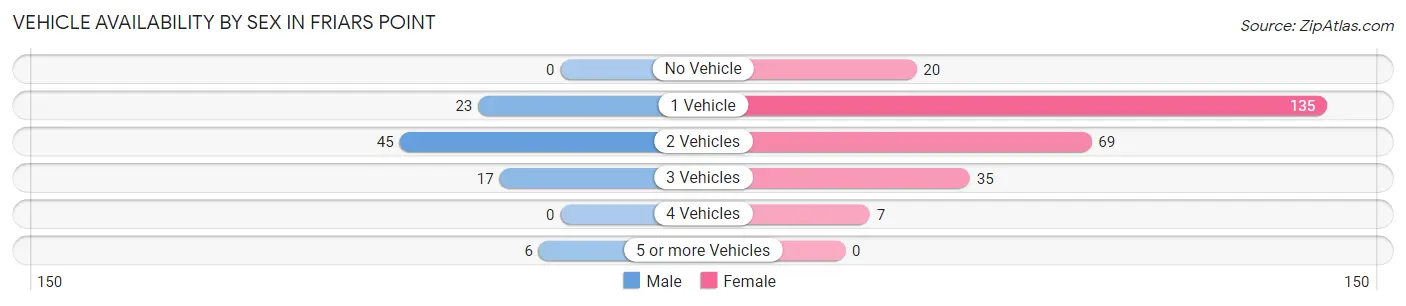
| Vehicles Available | Male | Female |
| No Vehicle | 0 (0.0%) | 20 (7.5%) |
| 1 Vehicle | 23 (25.3%) | 135 (50.7%) |
| 2 Vehicles | 45 (49.4%) | 69 (25.9%) |
| 3 Vehicles | 17 (18.7%) | 35 (13.2%) |
| 4 Vehicles | 0 (0.0%) | 7 (2.6%) |
| 5 or more Vehicles | 6 (6.6%) | 0 (0.0%) |
| Total | 91 (100.0%) | 266 (100.0%) |
Commute Time in Friars Point
The most frequently occuring commute durations in Friars Point are 20 to 24 minutes (78 commuters, 22.9%), 45 to 59 minutes (65 commuters, 19.1%), and 60 to 89 minutes (65 commuters, 19.1%).
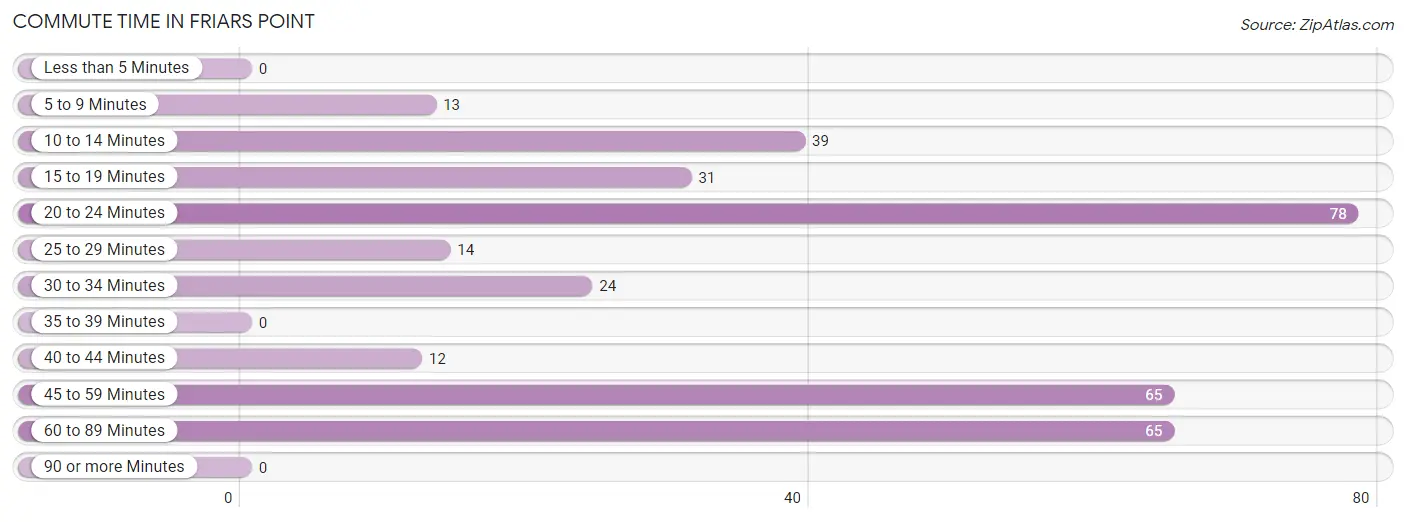
| Commute Time | # Commuters | % Commuters |
| Less than 5 Minutes | 0 | 0.0% |
| 5 to 9 Minutes | 13 | 3.8% |
| 10 to 14 Minutes | 39 | 11.4% |
| 15 to 19 Minutes | 31 | 9.1% |
| 20 to 24 Minutes | 78 | 22.9% |
| 25 to 29 Minutes | 14 | 4.1% |
| 30 to 34 Minutes | 24 | 7.0% |
| 35 to 39 Minutes | 0 | 0.0% |
| 40 to 44 Minutes | 12 | 3.5% |
| 45 to 59 Minutes | 65 | 19.1% |
| 60 to 89 Minutes | 65 | 19.1% |
| 90 or more Minutes | 0 | 0.0% |
Commute Time by Sex in Friars Point
The most common commute times in Friars Point are 45 to 59 minutes (30 commuters, 37.0%) for males and 20 to 24 minutes (78 commuters, 30.0%) for females.
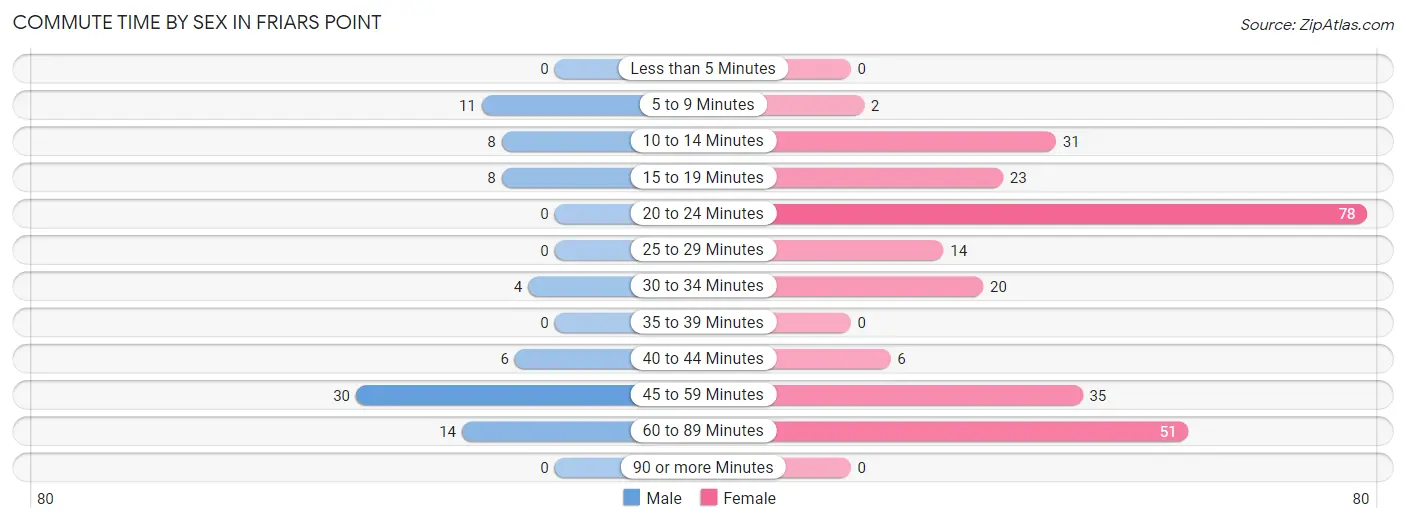
| Commute Time | Male | Female |
| Less than 5 Minutes | 0 (0.0%) | 0 (0.0%) |
| 5 to 9 Minutes | 11 (13.6%) | 2 (0.8%) |
| 10 to 14 Minutes | 8 (9.9%) | 31 (11.9%) |
| 15 to 19 Minutes | 8 (9.9%) | 23 (8.8%) |
| 20 to 24 Minutes | 0 (0.0%) | 78 (30.0%) |
| 25 to 29 Minutes | 0 (0.0%) | 14 (5.4%) |
| 30 to 34 Minutes | 4 (4.9%) | 20 (7.7%) |
| 35 to 39 Minutes | 0 (0.0%) | 0 (0.0%) |
| 40 to 44 Minutes | 6 (7.4%) | 6 (2.3%) |
| 45 to 59 Minutes | 30 (37.0%) | 35 (13.5%) |
| 60 to 89 Minutes | 14 (17.3%) | 51 (19.6%) |
| 90 or more Minutes | 0 (0.0%) | 0 (0.0%) |
Time of Departure to Work by Sex in Friars Point
The most frequent times of departure to work in Friars Point are 6:30 AM to 6:59 AM (16, 19.8%) for males and 12:00 PM to 3:59 PM (43, 16.5%) for females.
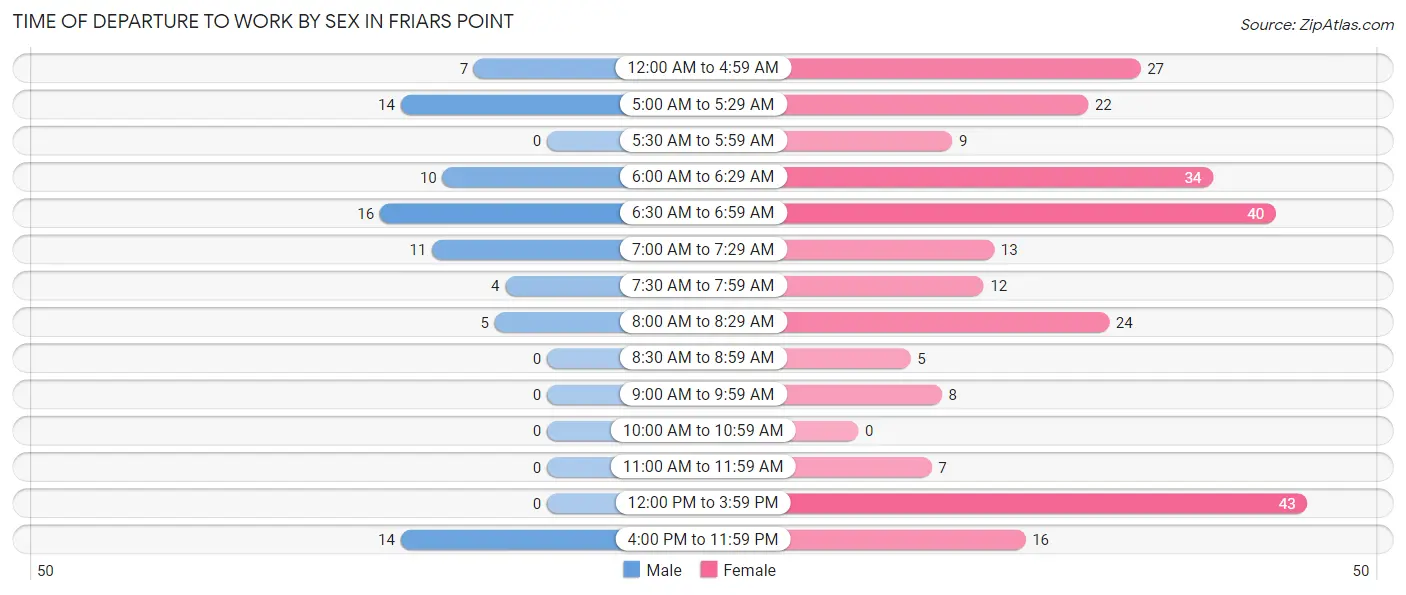
| Time of Departure | Male | Female |
| 12:00 AM to 4:59 AM | 7 (8.6%) | 27 (10.4%) |
| 5:00 AM to 5:29 AM | 14 (17.3%) | 22 (8.5%) |
| 5:30 AM to 5:59 AM | 0 (0.0%) | 9 (3.5%) |
| 6:00 AM to 6:29 AM | 10 (12.3%) | 34 (13.1%) |
| 6:30 AM to 6:59 AM | 16 (19.8%) | 40 (15.4%) |
| 7:00 AM to 7:29 AM | 11 (13.6%) | 13 (5.0%) |
| 7:30 AM to 7:59 AM | 4 (4.9%) | 12 (4.6%) |
| 8:00 AM to 8:29 AM | 5 (6.2%) | 24 (9.2%) |
| 8:30 AM to 8:59 AM | 0 (0.0%) | 5 (1.9%) |
| 9:00 AM to 9:59 AM | 0 (0.0%) | 8 (3.1%) |
| 10:00 AM to 10:59 AM | 0 (0.0%) | 0 (0.0%) |
| 11:00 AM to 11:59 AM | 0 (0.0%) | 7 (2.7%) |
| 12:00 PM to 3:59 PM | 0 (0.0%) | 43 (16.5%) |
| 4:00 PM to 11:59 PM | 14 (17.3%) | 16 (6.1%) |
| Total | 81 (100.0%) | 260 (100.0%) |
Housing Occupancy in Friars Point
Occupancy by Ownership in Friars Point
Of the total 431 dwellings in Friars Point, owner-occupied units account for 187 (43.4%), while renter-occupied units make up 244 (56.6%).
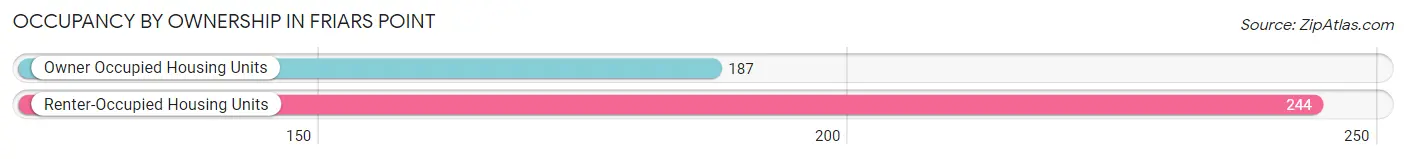
| Occupancy | # Housing Units | % Housing Units |
| Owner Occupied Housing Units | 187 | 43.4% |
| Renter-Occupied Housing Units | 244 | 56.6% |
| Total Occupied Housing Units | 431 | 100.0% |
Occupancy by Household Size in Friars Point
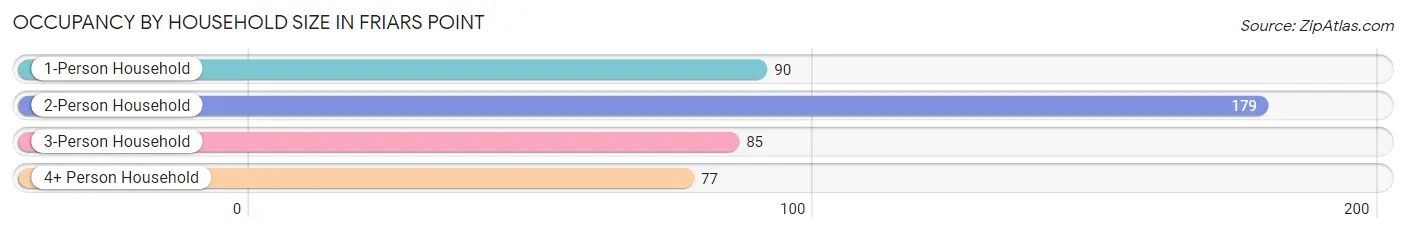
| Household Size | # Housing Units | % Housing Units |
| 1-Person Household | 90 | 20.9% |
| 2-Person Household | 179 | 41.5% |
| 3-Person Household | 85 | 19.7% |
| 4+ Person Household | 77 | 17.9% |
| Total Housing Units | 431 | 100.0% |
Occupancy by Ownership by Household Size in Friars Point
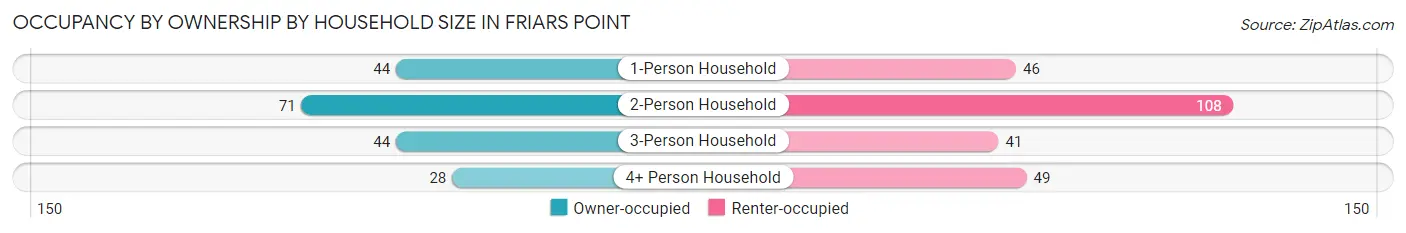
| Household Size | Owner-occupied | Renter-occupied |
| 1-Person Household | 44 (48.9%) | 46 (51.1%) |
| 2-Person Household | 71 (39.7%) | 108 (60.3%) |
| 3-Person Household | 44 (51.8%) | 41 (48.2%) |
| 4+ Person Household | 28 (36.4%) | 49 (63.6%) |
| Total Housing Units | 187 (43.4%) | 244 (56.6%) |
Occupancy by Educational Attainment in Friars Point
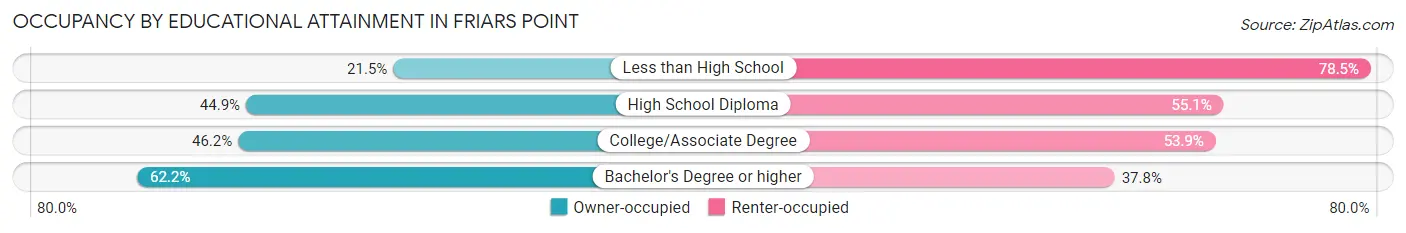
| Household Size | Owner-occupied | Renter-occupied |
| Less than High School | 14 (21.5%) | 51 (78.5%) |
| High School Diploma | 66 (44.9%) | 81 (55.1%) |
| College/Associate Degree | 84 (46.2%) | 98 (53.8%) |
| Bachelor's Degree or higher | 23 (62.2%) | 14 (37.8%) |
Occupancy by Age of Householder in Friars Point
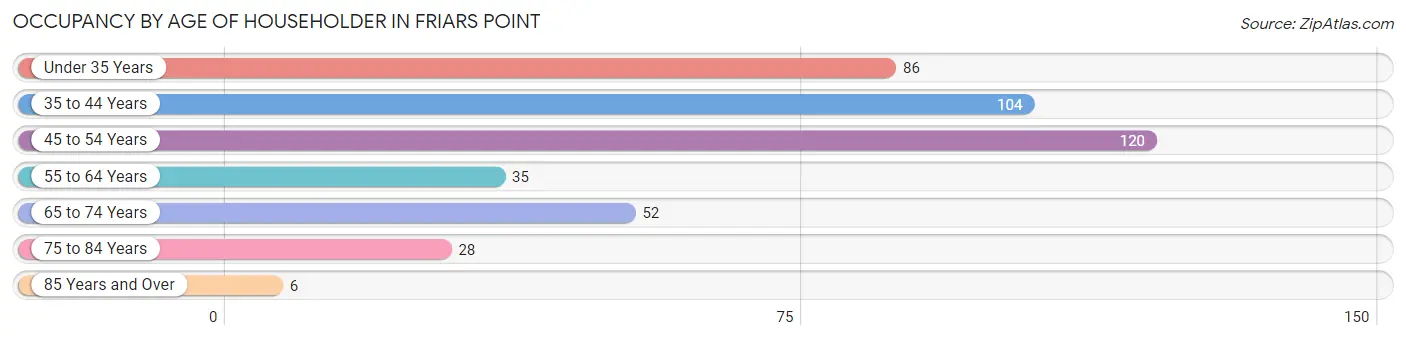
| Age Bracket | # Households | % Households |
| Under 35 Years | 86 | 20.0% |
| 35 to 44 Years | 104 | 24.1% |
| 45 to 54 Years | 120 | 27.8% |
| 55 to 64 Years | 35 | 8.1% |
| 65 to 74 Years | 52 | 12.1% |
| 75 to 84 Years | 28 | 6.5% |
| 85 Years and Over | 6 | 1.4% |
| Total | 431 | 100.0% |
Housing Finances in Friars Point
Median Income by Occupancy in Friars Point
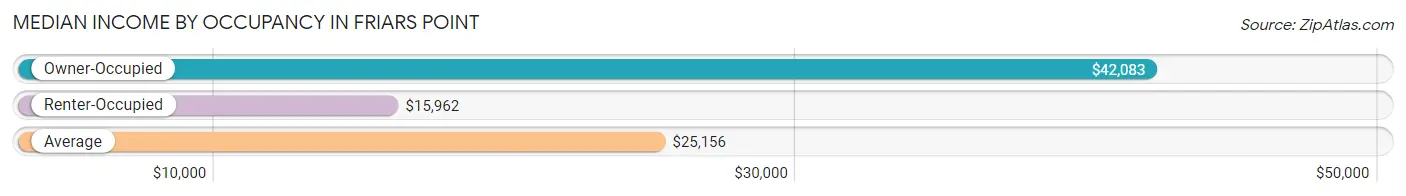
| Occupancy Type | # Households | Median Income |
| Owner-Occupied | 187 (43.4%) | $42,083 |
| Renter-Occupied | 244 (56.6%) | $15,962 |
| Average | 431 (100.0%) | $25,156 |
Occupancy by Householder Income Bracket in Friars Point
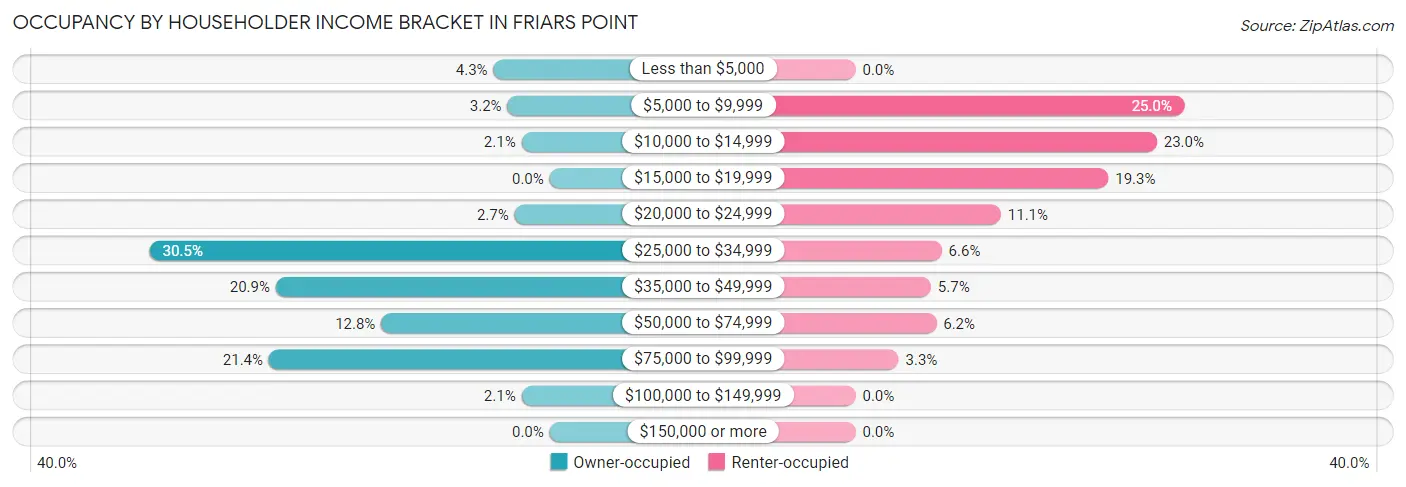
| Income Bracket | Owner-occupied | Renter-occupied |
| Less than $5,000 | 8 (4.3%) | 0 (0.0%) |
| $5,000 to $9,999 | 6 (3.2%) | 61 (25.0%) |
| $10,000 to $14,999 | 4 (2.1%) | 56 (23.0%) |
| $15,000 to $19,999 | 0 (0.0%) | 47 (19.3%) |
| $20,000 to $24,999 | 5 (2.7%) | 27 (11.1%) |
| $25,000 to $34,999 | 57 (30.5%) | 16 (6.6%) |
| $35,000 to $49,999 | 39 (20.9%) | 14 (5.7%) |
| $50,000 to $74,999 | 24 (12.8%) | 15 (6.1%) |
| $75,000 to $99,999 | 40 (21.4%) | 8 (3.3%) |
| $100,000 to $149,999 | 4 (2.1%) | 0 (0.0%) |
| $150,000 or more | 0 (0.0%) | 0 (0.0%) |
| Total | 187 (100.0%) | 244 (100.0%) |
Monthly Housing Cost Tiers in Friars Point
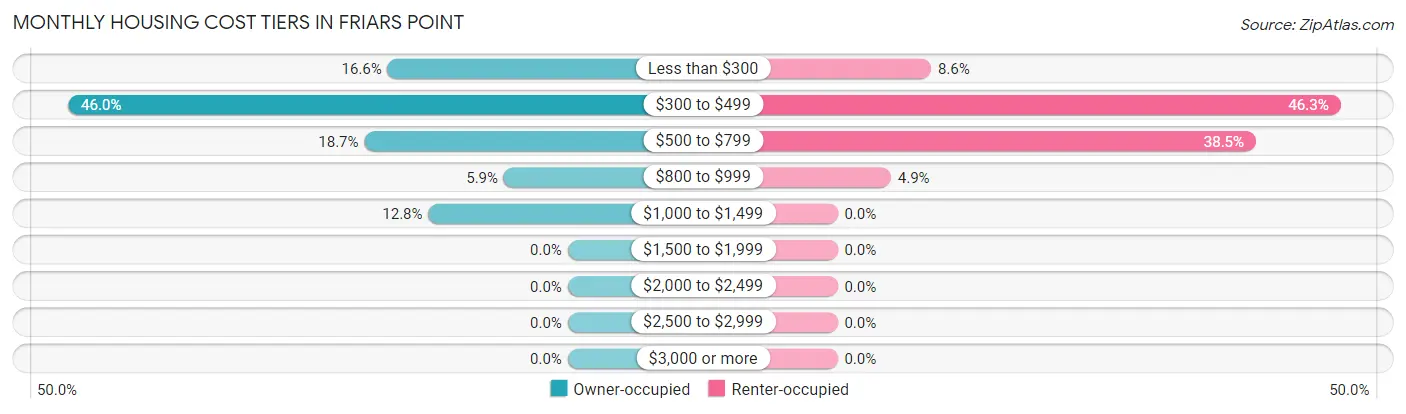
| Monthly Cost | Owner-occupied | Renter-occupied |
| Less than $300 | 31 (16.6%) | 21 (8.6%) |
| $300 to $499 | 86 (46.0%) | 113 (46.3%) |
| $500 to $799 | 35 (18.7%) | 94 (38.5%) |
| $800 to $999 | 11 (5.9%) | 12 (4.9%) |
| $1,000 to $1,499 | 24 (12.8%) | 0 (0.0%) |
| $1,500 to $1,999 | 0 (0.0%) | 0 (0.0%) |
| $2,000 to $2,499 | 0 (0.0%) | 0 (0.0%) |
| $2,500 to $2,999 | 0 (0.0%) | 0 (0.0%) |
| $3,000 or more | 0 (0.0%) | 0 (0.0%) |
| Total | 187 (100.0%) | 244 (100.0%) |
Physical Housing Characteristics in Friars Point
Housing Structures in Friars Point
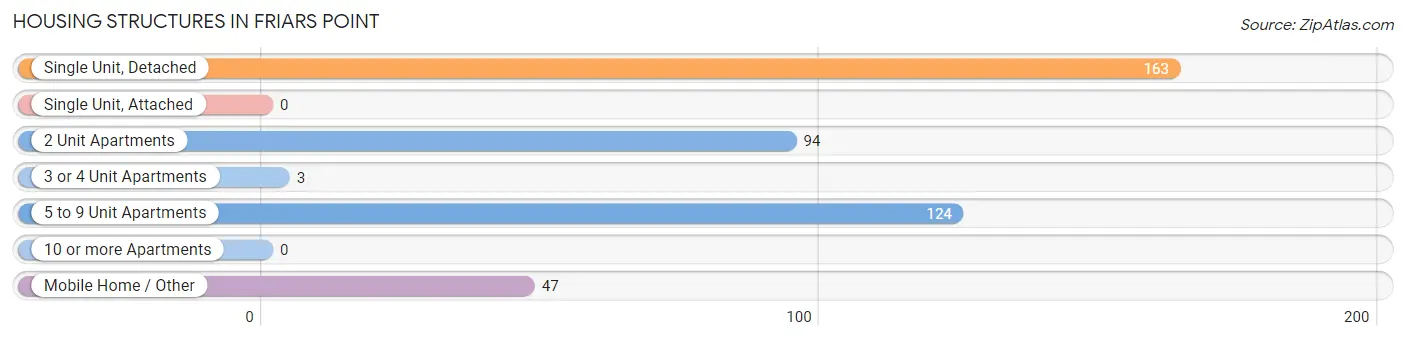
| Structure Type | # Housing Units | % Housing Units |
| Single Unit, Detached | 163 | 37.8% |
| Single Unit, Attached | 0 | 0.0% |
| 2 Unit Apartments | 94 | 21.8% |
| 3 or 4 Unit Apartments | 3 | 0.7% |
| 5 to 9 Unit Apartments | 124 | 28.8% |
| 10 or more Apartments | 0 | 0.0% |
| Mobile Home / Other | 47 | 10.9% |
| Total | 431 | 100.0% |
Housing Structures by Occupancy in Friars Point
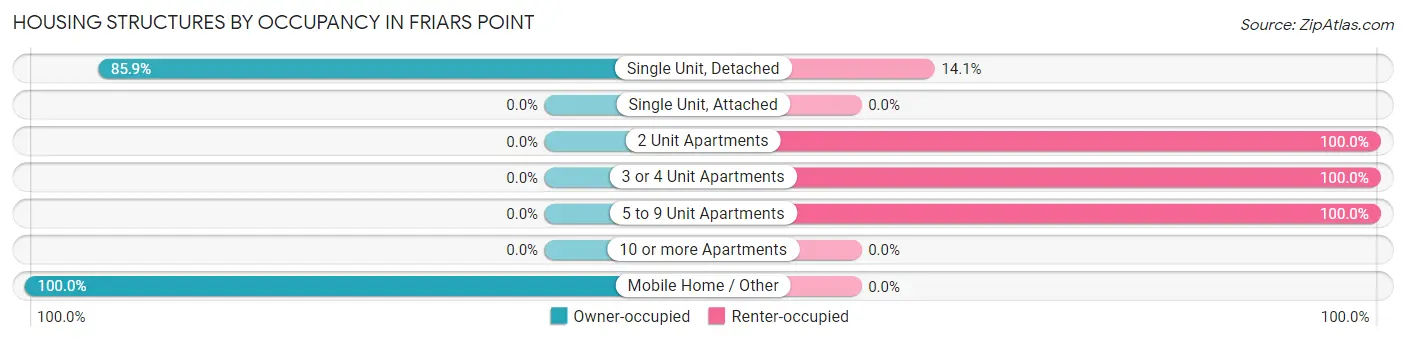
| Structure Type | Owner-occupied | Renter-occupied |
| Single Unit, Detached | 140 (85.9%) | 23 (14.1%) |
| Single Unit, Attached | 0 (0.0%) | 0 (0.0%) |
| 2 Unit Apartments | 0 (0.0%) | 94 (100.0%) |
| 3 or 4 Unit Apartments | 0 (0.0%) | 3 (100.0%) |
| 5 to 9 Unit Apartments | 0 (0.0%) | 124 (100.0%) |
| 10 or more Apartments | 0 (0.0%) | 0 (0.0%) |
| Mobile Home / Other | 47 (100.0%) | 0 (0.0%) |
| Total | 187 (43.4%) | 244 (56.6%) |
Housing Structures by Number of Rooms in Friars Point
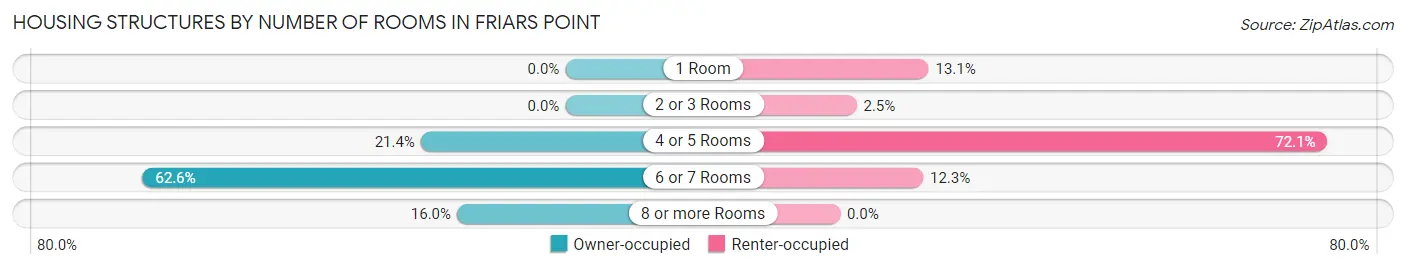
| Number of Rooms | Owner-occupied | Renter-occupied |
| 1 Room | 0 (0.0%) | 32 (13.1%) |
| 2 or 3 Rooms | 0 (0.0%) | 6 (2.5%) |
| 4 or 5 Rooms | 40 (21.4%) | 176 (72.1%) |
| 6 or 7 Rooms | 117 (62.6%) | 30 (12.3%) |
| 8 or more Rooms | 30 (16.0%) | 0 (0.0%) |
| Total | 187 (100.0%) | 244 (100.0%) |
Housing Structure by Heating Type in Friars Point
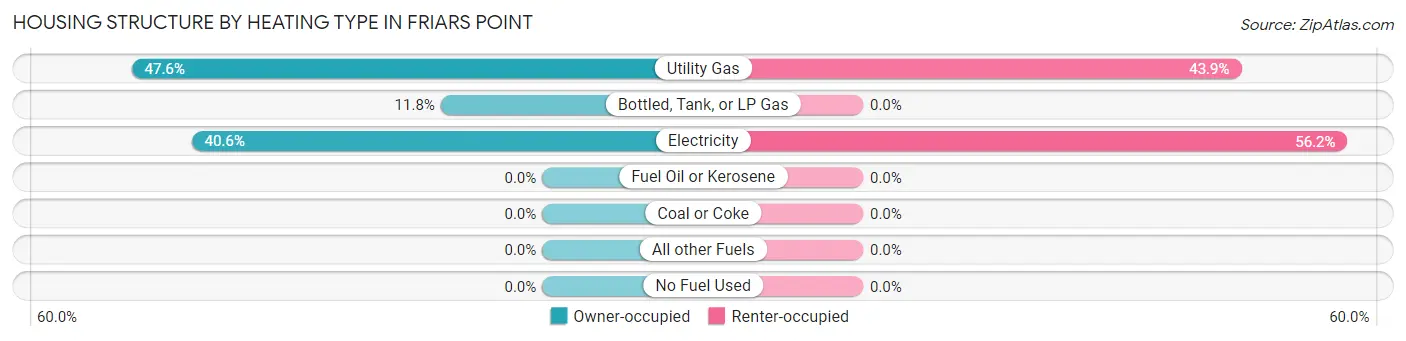
| Heating Type | Owner-occupied | Renter-occupied |
| Utility Gas | 89 (47.6%) | 107 (43.9%) |
| Bottled, Tank, or LP Gas | 22 (11.8%) | 0 (0.0%) |
| Electricity | 76 (40.6%) | 137 (56.1%) |
| Fuel Oil or Kerosene | 0 (0.0%) | 0 (0.0%) |
| Coal or Coke | 0 (0.0%) | 0 (0.0%) |
| All other Fuels | 0 (0.0%) | 0 (0.0%) |
| No Fuel Used | 0 (0.0%) | 0 (0.0%) |
| Total | 187 (100.0%) | 244 (100.0%) |
Household Vehicle Usage in Friars Point
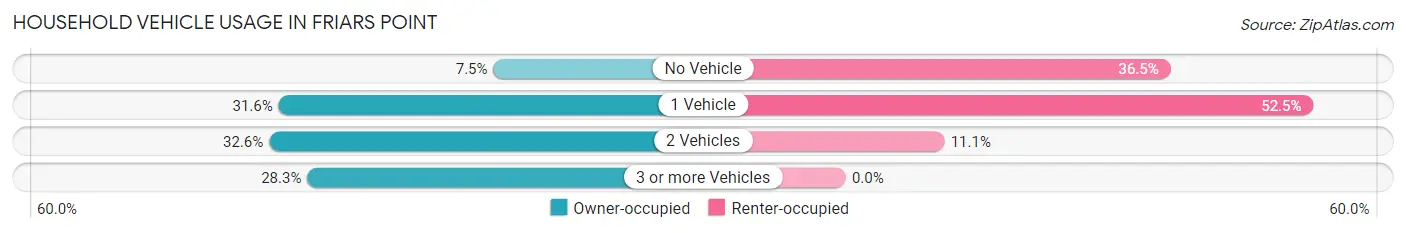
| Vehicles per Household | Owner-occupied | Renter-occupied |
| No Vehicle | 14 (7.5%) | 89 (36.5%) |
| 1 Vehicle | 59 (31.6%) | 128 (52.5%) |
| 2 Vehicles | 61 (32.6%) | 27 (11.1%) |
| 3 or more Vehicles | 53 (28.3%) | 0 (0.0%) |
| Total | 187 (100.0%) | 244 (100.0%) |
Real Estate & Mortgages in Friars Point
Real Estate and Mortgage Overview in Friars Point
| Characteristic | Without Mortgage | With Mortgage |
| Housing Units | 137 | 50 |
| Median Property Value | $53,600 | $72,200 |
| Median Household Income | $40,417 | $0 |
| Monthly Housing Costs | $334 | $0 |
| Real Estate Taxes | $700 | $20 |
Property Value by Mortgage Status in Friars Point
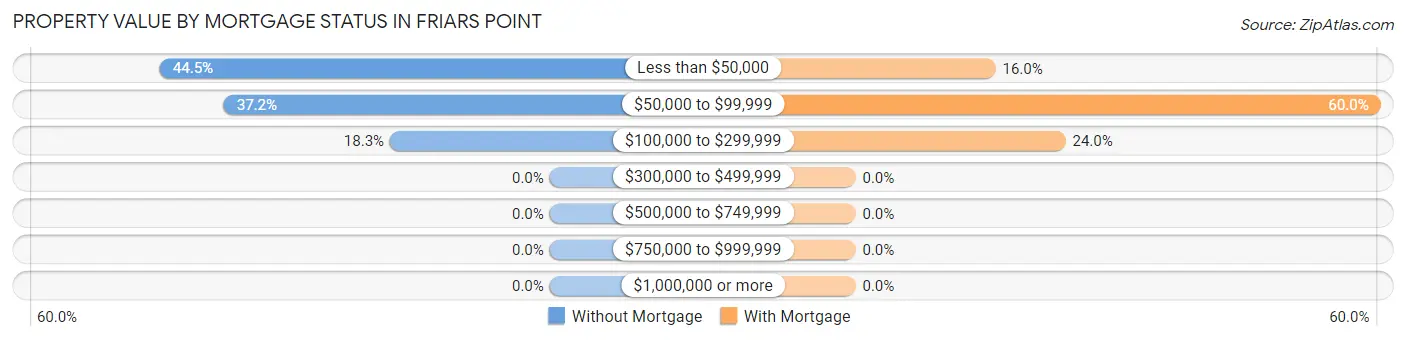
| Property Value | Without Mortgage | With Mortgage |
| Less than $50,000 | 61 (44.5%) | 8 (16.0%) |
| $50,000 to $99,999 | 51 (37.2%) | 30 (60.0%) |
| $100,000 to $299,999 | 25 (18.2%) | 12 (24.0%) |
| $300,000 to $499,999 | 0 (0.0%) | 0 (0.0%) |
| $500,000 to $749,999 | 0 (0.0%) | 0 (0.0%) |
| $750,000 to $999,999 | 0 (0.0%) | 0 (0.0%) |
| $1,000,000 or more | 0 (0.0%) | 0 (0.0%) |
| Total | 137 (100.0%) | 50 (100.0%) |
Household Income by Mortgage Status in Friars Point
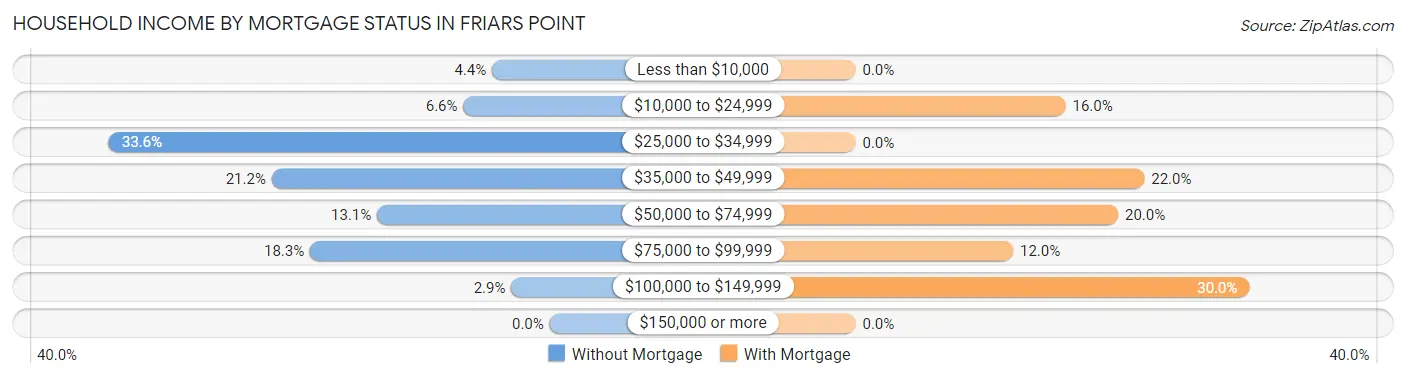
| Household Income | Without Mortgage | With Mortgage |
| Less than $10,000 | 6 (4.4%) | 0 (0.0%) |
| $10,000 to $24,999 | 9 (6.6%) | 8 (16.0%) |
| $25,000 to $34,999 | 46 (33.6%) | 0 (0.0%) |
| $35,000 to $49,999 | 29 (21.2%) | 11 (22.0%) |
| $50,000 to $74,999 | 18 (13.1%) | 10 (20.0%) |
| $75,000 to $99,999 | 25 (18.2%) | 6 (12.0%) |
| $100,000 to $149,999 | 4 (2.9%) | 15 (30.0%) |
| $150,000 or more | 0 (0.0%) | 0 (0.0%) |
| Total | 137 (100.0%) | 50 (100.0%) |
Property Value to Household Income Ratio in Friars Point
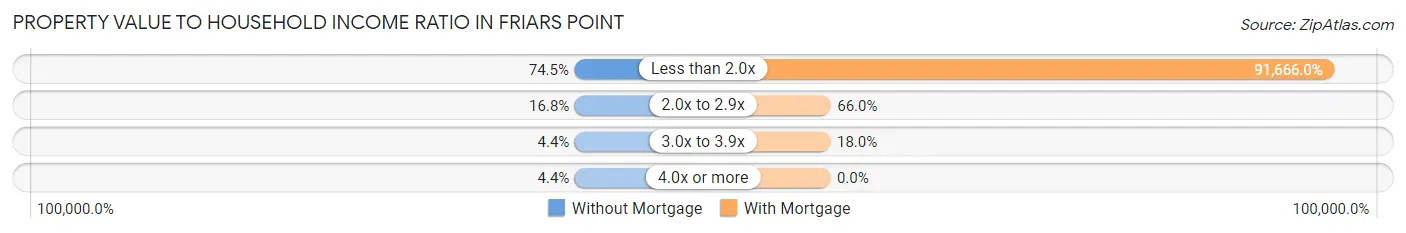
| Value-to-Income Ratio | Without Mortgage | With Mortgage |
| Less than 2.0x | 102 (74.5%) | 45,833 (91,666.0%) |
| 2.0x to 2.9x | 23 (16.8%) | 33 (66.0%) |
| 3.0x to 3.9x | 6 (4.4%) | 9 (18.0%) |
| 4.0x or more | 6 (4.4%) | 0 (0.0%) |
| Total | 137 (100.0%) | 50 (100.0%) |
Real Estate Taxes by Mortgage Status in Friars Point
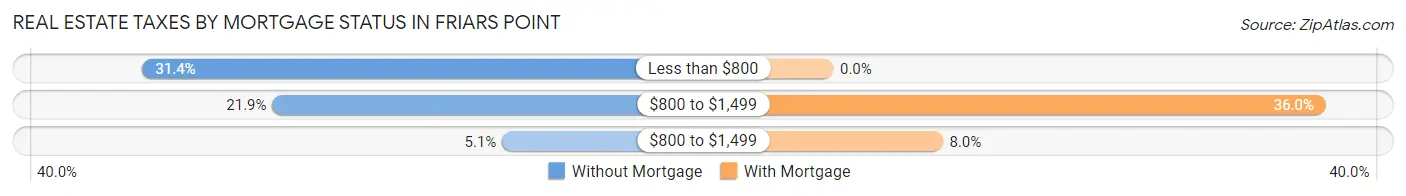
| Property Taxes | Without Mortgage | With Mortgage |
| Less than $800 | 43 (31.4%) | 0 (0.0%) |
| $800 to $1,499 | 30 (21.9%) | 18 (36.0%) |
| $800 to $1,499 | 7 (5.1%) | 4 (8.0%) |
| Total | 137 (100.0%) | 50 (100.0%) |
Health & Disability in Friars Point
Health Insurance Coverage by Age in Friars Point
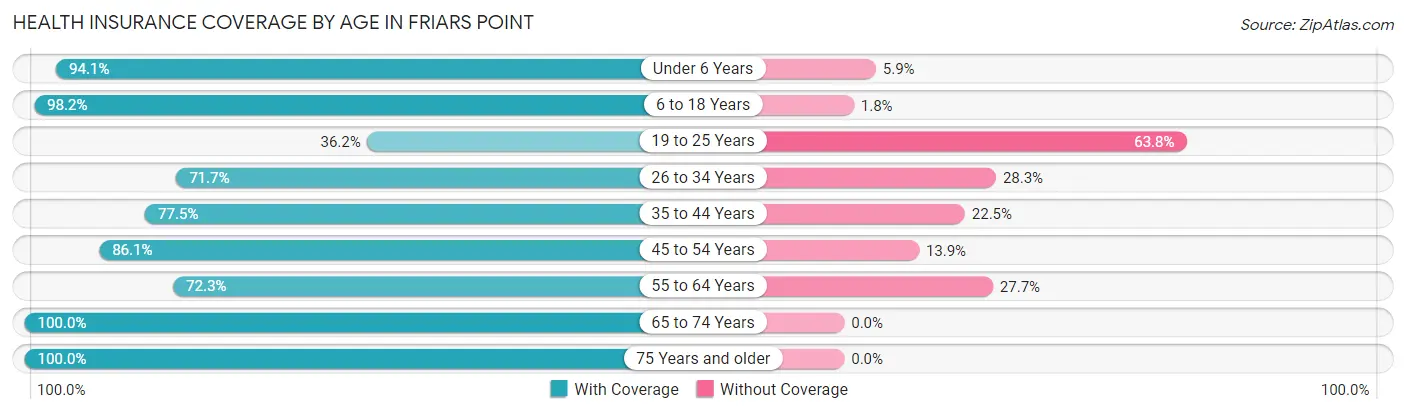
| Age Bracket | With Coverage | Without Coverage |
| Under 6 Years | 144 (94.1%) | 9 (5.9%) |
| 6 to 18 Years | 276 (98.2%) | 5 (1.8%) |
| 19 to 25 Years | 25 (36.2%) | 44 (63.8%) |
| 26 to 34 Years | 71 (71.7%) | 28 (28.3%) |
| 35 to 44 Years | 100 (77.5%) | 29 (22.5%) |
| 45 to 54 Years | 136 (86.1%) | 22 (13.9%) |
| 55 to 64 Years | 60 (72.3%) | 23 (27.7%) |
| 65 to 74 Years | 77 (100.0%) | 0 (0.0%) |
| 75 Years and older | 34 (100.0%) | 0 (0.0%) |
| Total | 923 (85.2%) | 160 (14.8%) |
Health Insurance Coverage by Citizenship Status in Friars Point
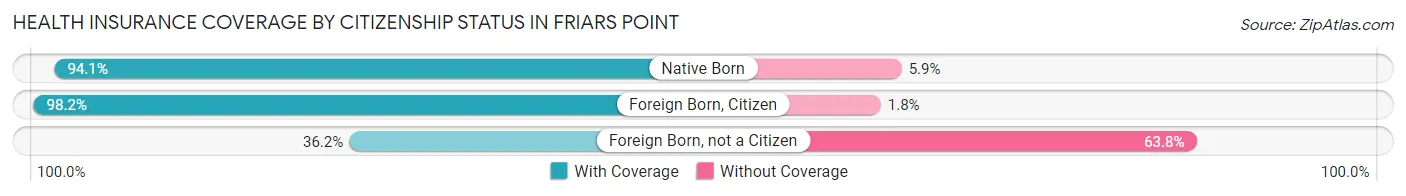
| Citizenship Status | With Coverage | Without Coverage |
| Native Born | 144 (94.1%) | 9 (5.9%) |
| Foreign Born, Citizen | 276 (98.2%) | 5 (1.8%) |
| Foreign Born, not a Citizen | 25 (36.2%) | 44 (63.8%) |
Health Insurance Coverage by Household Income in Friars Point
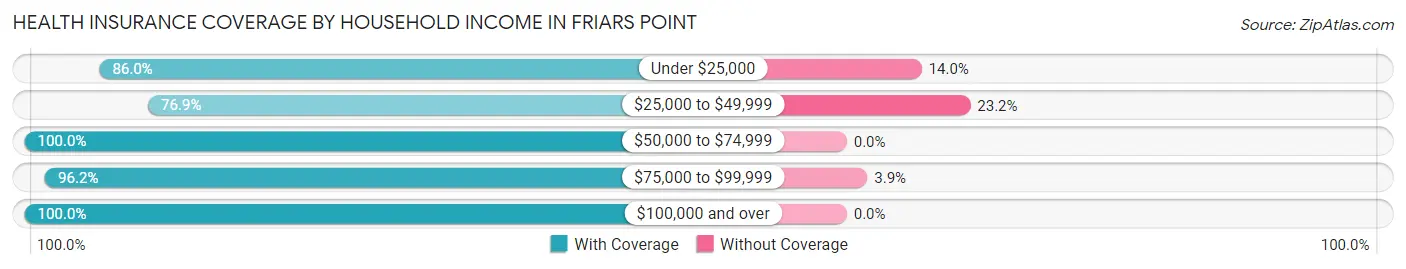
| Household Income | With Coverage | Without Coverage |
| Under $25,000 | 478 (86.0%) | 78 (14.0%) |
| $25,000 to $49,999 | 259 (76.8%) | 78 (23.2%) |
| $50,000 to $74,999 | 77 (100.0%) | 0 (0.0%) |
| $75,000 to $99,999 | 100 (96.2%) | 4 (3.8%) |
| $100,000 and over | 9 (100.0%) | 0 (0.0%) |
Public vs Private Health Insurance Coverage by Age in Friars Point
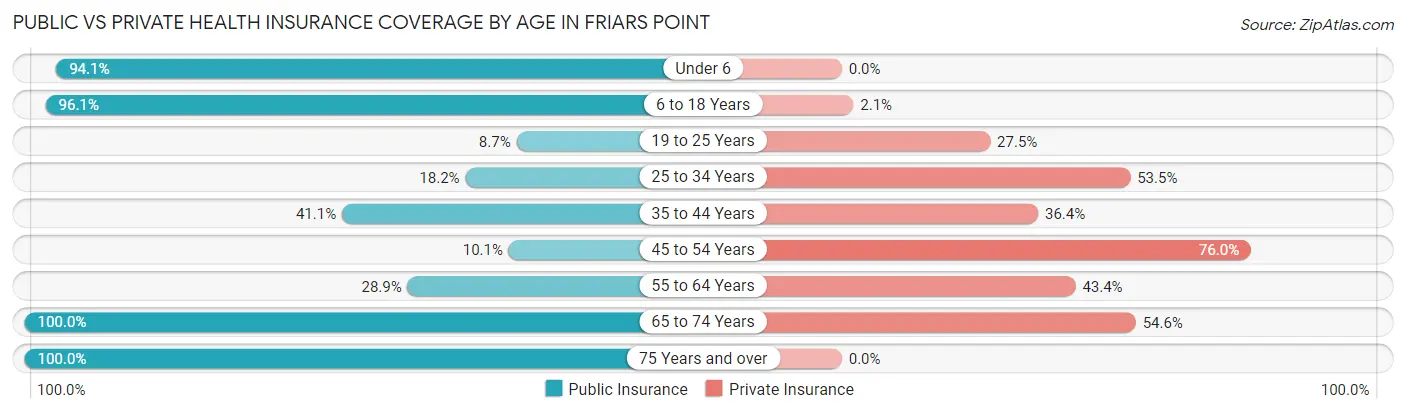
| Age Bracket | Public Insurance | Private Insurance |
| Under 6 | 144 (94.1%) | 0 (0.0%) |
| 6 to 18 Years | 270 (96.1%) | 6 (2.1%) |
| 19 to 25 Years | 6 (8.7%) | 19 (27.5%) |
| 25 to 34 Years | 18 (18.2%) | 53 (53.5%) |
| 35 to 44 Years | 53 (41.1%) | 47 (36.4%) |
| 45 to 54 Years | 16 (10.1%) | 120 (75.9%) |
| 55 to 64 Years | 24 (28.9%) | 36 (43.4%) |
| 65 to 74 Years | 77 (100.0%) | 42 (54.5%) |
| 75 Years and over | 34 (100.0%) | 0 (0.0%) |
| Total | 642 (59.3%) | 323 (29.8%) |
Disability Status by Sex by Age in Friars Point
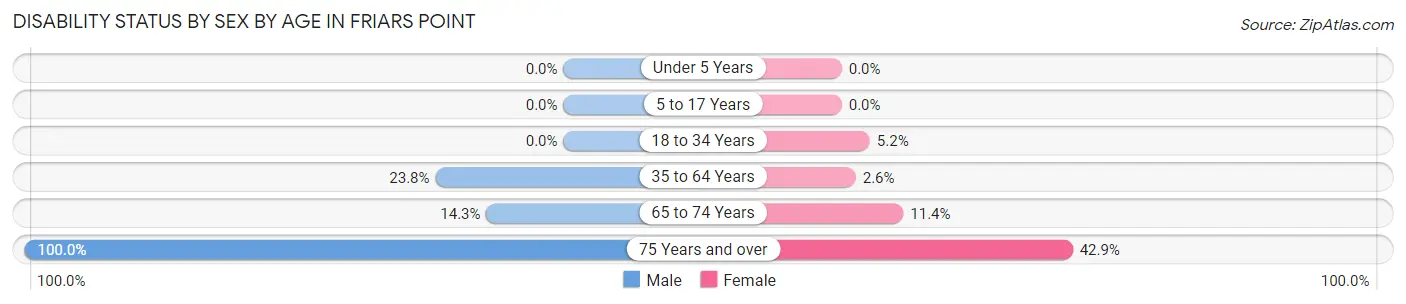
| Age Bracket | Male | Female |
| Under 5 Years | 0 (0.0%) | 0 (0.0%) |
| 5 to 17 Years | 0 (0.0%) | 0 (0.0%) |
| 18 to 34 Years | 0 (0.0%) | 6 (5.2%) |
| 35 to 64 Years | 24 (23.8%) | 7 (2.6%) |
| 65 to 74 Years | 6 (14.3%) | 4 (11.4%) |
| 75 Years and over | 20 (100.0%) | 6 (42.9%) |
Disability Class by Sex by Age in Friars Point
Disability Class: Hearing Difficulty
| Age Bracket | Male | Female |
| Under 5 Years | 0 (0.0%) | 0 (0.0%) |
| 5 to 17 Years | 0 (0.0%) | 0 (0.0%) |
| 18 to 34 Years | 0 (0.0%) | 0 (0.0%) |
| 35 to 64 Years | 0 (0.0%) | 0 (0.0%) |
| 65 to 74 Years | 0 (0.0%) | 0 (0.0%) |
| 75 Years and over | 0 (0.0%) | 0 (0.0%) |
Disability Class: Vision Difficulty
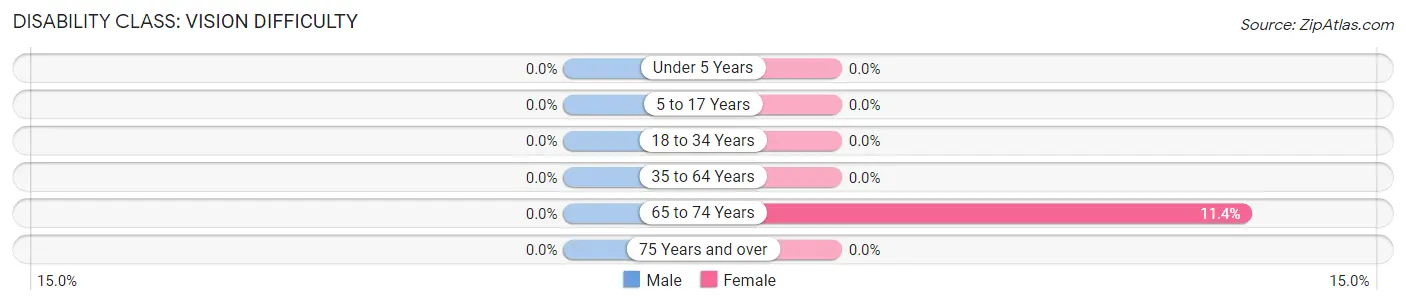
| Age Bracket | Male | Female |
| Under 5 Years | 0 (0.0%) | 0 (0.0%) |
| 5 to 17 Years | 0 (0.0%) | 0 (0.0%) |
| 18 to 34 Years | 0 (0.0%) | 0 (0.0%) |
| 35 to 64 Years | 0 (0.0%) | 0 (0.0%) |
| 65 to 74 Years | 0 (0.0%) | 4 (11.4%) |
| 75 Years and over | 0 (0.0%) | 0 (0.0%) |
Disability Class: Cognitive Difficulty
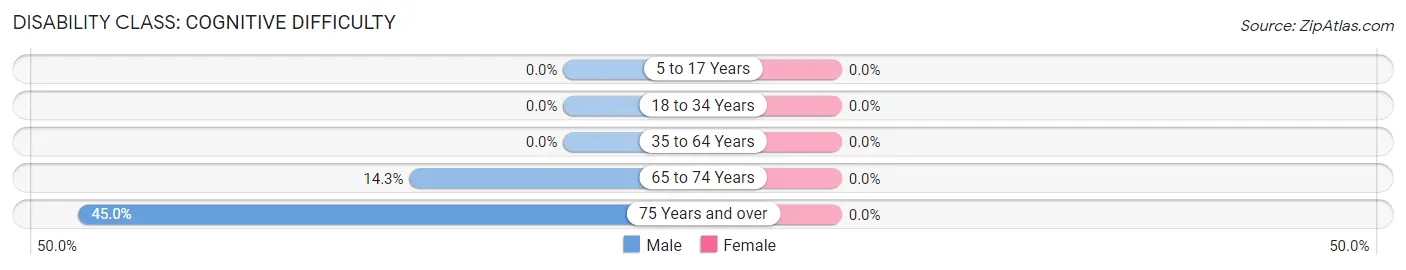
| Age Bracket | Male | Female |
| 5 to 17 Years | 0 (0.0%) | 0 (0.0%) |
| 18 to 34 Years | 0 (0.0%) | 0 (0.0%) |
| 35 to 64 Years | 0 (0.0%) | 0 (0.0%) |
| 65 to 74 Years | 6 (14.3%) | 0 (0.0%) |
| 75 Years and over | 9 (45.0%) | 0 (0.0%) |
Disability Class: Ambulatory Difficulty
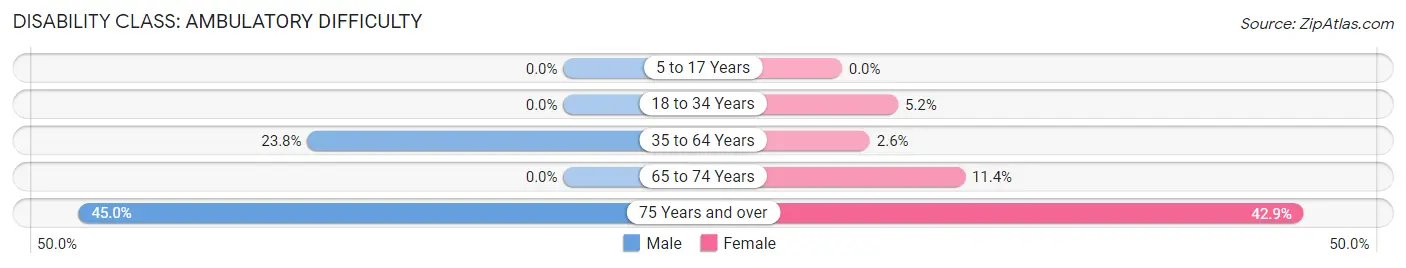
| Age Bracket | Male | Female |
| 5 to 17 Years | 0 (0.0%) | 0 (0.0%) |
| 18 to 34 Years | 0 (0.0%) | 6 (5.2%) |
| 35 to 64 Years | 24 (23.8%) | 7 (2.6%) |
| 65 to 74 Years | 0 (0.0%) | 4 (11.4%) |
| 75 Years and over | 9 (45.0%) | 6 (42.9%) |
Disability Class: Self-Care Difficulty
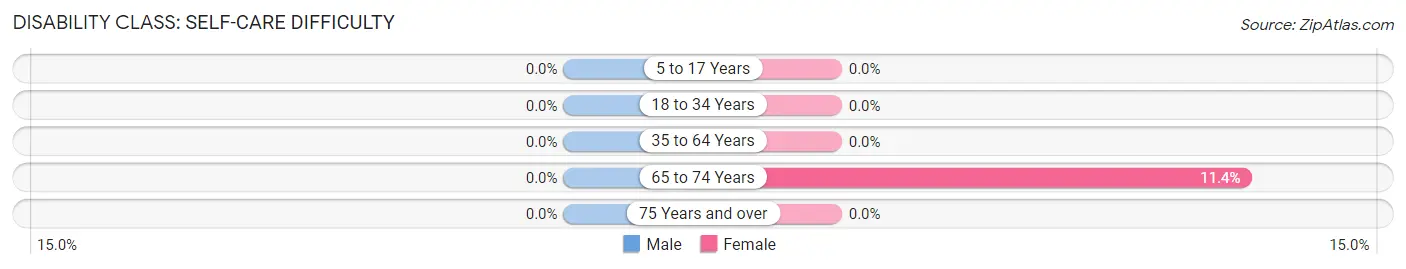
| Age Bracket | Male | Female |
| 5 to 17 Years | 0 (0.0%) | 0 (0.0%) |
| 18 to 34 Years | 0 (0.0%) | 0 (0.0%) |
| 35 to 64 Years | 0 (0.0%) | 0 (0.0%) |
| 65 to 74 Years | 0 (0.0%) | 4 (11.4%) |
| 75 Years and over | 0 (0.0%) | 0 (0.0%) |
Technology Access in Friars Point
Computing Device Access in Friars Point
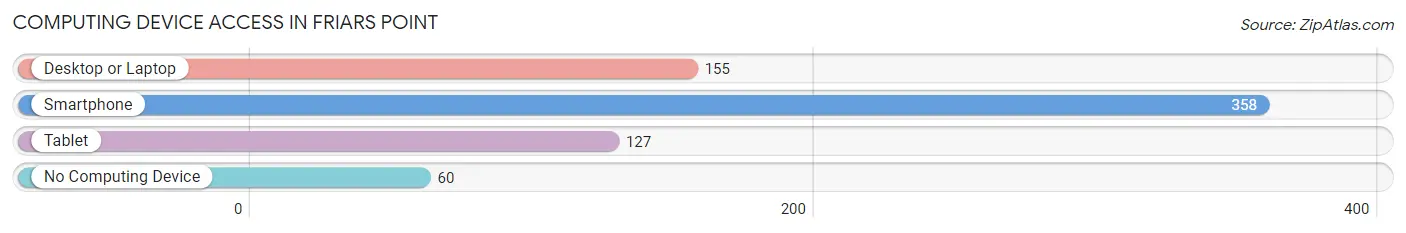
| Device Type | # Households | % Households |
| Desktop or Laptop | 155 | 36.0% |
| Smartphone | 358 | 83.1% |
| Tablet | 127 | 29.5% |
| No Computing Device | 60 | 13.9% |
| Total | 431 | 100.0% |
Internet Access in Friars Point
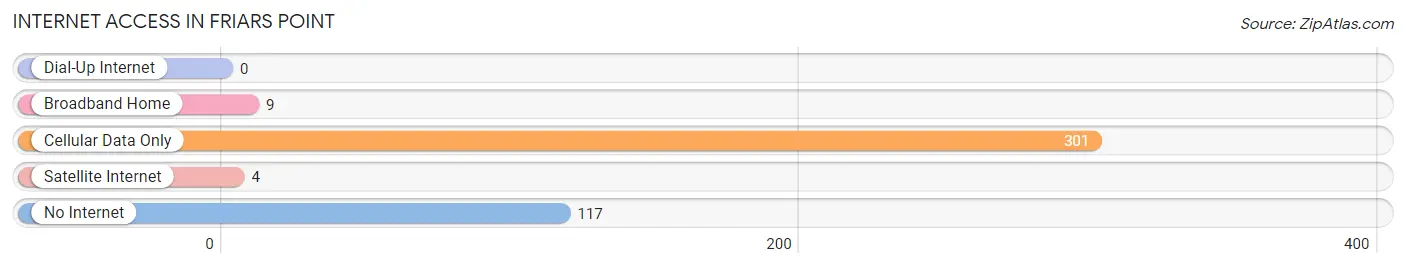
| Internet Type | # Households | % Households |
| Dial-Up Internet | 0 | 0.0% |
| Broadband Home | 9 | 2.1% |
| Cellular Data Only | 301 | 69.8% |
| Satellite Internet | 4 | 0.9% |
| No Internet | 117 | 27.2% |
| Total | 431 | 100.0% |
Friars Point Summary
Friars Point is a small town located in Coahoma County, Mississippi, United States. It is situated on the banks of the Mississippi River, about 25 miles south of Memphis, Tennessee. The population was 1,200 at the 2010 census.
History
Friars Point was founded in 1836 by a group of settlers from Kentucky and Tennessee. The town was named after a nearby bend in the Mississippi River, which was named after a group of Franciscan friars who had once lived in the area.
The town was an important port during the Civil War, and was the site of several battles. In 1862, Confederate forces under General Earl Van Dorn attacked the Union garrison at Friars Point, but were repulsed. In 1863, Union forces under General Ulysses S. Grant captured the town and held it until the end of the war.
After the war, Friars Point became an important trading center for cotton and other agricultural products. The town was also home to several steamboat companies, which provided transportation up and down the Mississippi River.
Geography
Friars Point is located at 34°20'25" North, 90°37'45" West (34.340278, -90.629167). The town is situated on the banks of the Mississippi River, about 25 miles south of Memphis, Tennessee.
The town has a total area of 1 2 square miles all of which is land
Economy
The economy of Friars Point is largely based on agriculture. The town is home to several cotton gins, as well as a number of other agricultural businesses.
The town is also home to several small businesses, including restaurants, convenience stores, and a few retail stores.
Demographics
As of the 2010 census, there were 1,200 people, 463 households, and 308 families residing in Friars Point. The population density was 1,000 people per square mile. The racial makeup of the town was 57.3% African American, 40.3% White, 0.3% Native American, 0.2% Asian, 0.2% from other races, and 1.8% from two or more races.
The median income for a household in Friars Point was $20,000, and the median income for a family was $25,000. The per capita income for the town was $10,000. About 28.3% of families and 33.3% of the population were below the poverty line, including 45.5% of those under age 18 and 25.0% of those age 65 or over.
Common Questions
What is Per Capita Income in Friars Point?
Per Capita income in Friars Point is $13,313.
What is the Median Family Income in Friars Point?
Median Family Income in Friars Point is $23,839.
What is the Median Household income in Friars Point?
Median Household Income in Friars Point is $25,156.
What is Income or Wage Gap in Friars Point?
Income or Wage Gap in Friars Point is 40.0%.
Women in Friars Point earn 60.0 cents for every dollar earned by a man.
What is Inequality or Gini Index in Friars Point?
Inequality or Gini Index in Friars Point is 0.42.
What is the Total Population of Friars Point?
Total Population of Friars Point is 1,083.
What is the Total Male Population of Friars Point?
Total Male Population of Friars Point is 413.
What is the Total Female Population of Friars Point?
Total Female Population of Friars Point is 670.
What is the Ratio of Males per 100 Females in Friars Point?
There are 61.64 Males per 100 Females in Friars Point.
What is the Ratio of Females per 100 Males in Friars Point?
There are 162.23 Females per 100 Males in Friars Point.
What is the Median Population Age in Friars Point?
Median Population Age in Friars Point is 30.6 Years.
What is the Average Family Size in Friars Point
Average Family Size in Friars Point is 3.0 People.
What is the Average Household Size in Friars Point
Average Household Size in Friars Point is 2.5 People.
How Large is the Labor Force in Friars Point?
There are 429 People in the Labor Forcein in Friars Point.
What is the Percentage of People in the Labor Force in Friars Point?
60.3% of People are in the Labor Force in Friars Point.
What is the Unemployment Rate in Friars Point?
Unemployment Rate in Friars Point is 10.5%.