Tunica, MS Map & Demographics
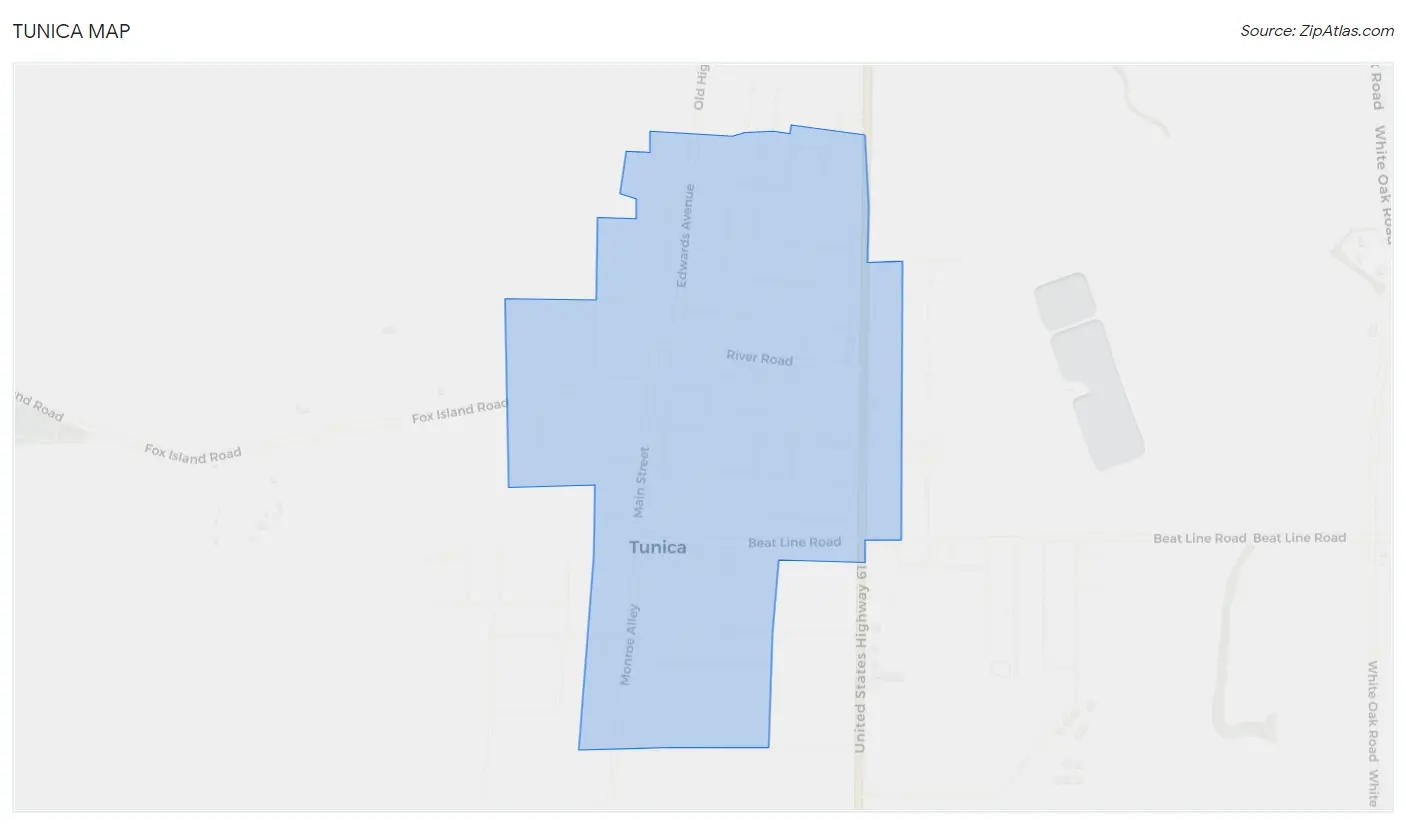
Tunica Map
Tunica Overview
$31,390
PER CAPITA INCOME
$84,500
AVG FAMILY INCOME
$55,865
AVG HOUSEHOLD INCOME
15.6%
WAGE / INCOME GAP [ % ]
84.4¢/ $1
WAGE / INCOME GAP [ $ ]
0.45
INEQUALITY / GINI INDEX
1,062
TOTAL POPULATION
500
MALE POPULATION
562
FEMALE POPULATION
88.97
MALES / 100 FEMALES
112.40
FEMALES / 100 MALES
50.7
MEDIAN AGE
3.1
AVG FAMILY SIZE
2.0
AVG HOUSEHOLD SIZE
484
LABOR FORCE [ PEOPLE ]
53.8%
PERCENT IN LABOR FORCE
2.7%
UNEMPLOYMENT RATE
Tunica Zip Codes
Tunica Area Codes
Income in Tunica
Income Overview in Tunica
Per Capita Income in Tunica is $31,390, while median incomes of families and households are $84,500 and $55,865 respectively.
| Characteristic | Number | Measure |
| Per Capita Income | 1,062 | $31,390 |
| Median Family Income | 250 | $84,500 |
| Mean Family Income | 250 | $99,393 |
| Median Household Income | 521 | $55,865 |
| Mean Household Income | 521 | $65,543 |
| Income Deficit | 250 | $0 |
| Wage / Income Gap (%) | 1,062 | 15.64% |
| Wage / Income Gap ($) | 1,062 | 84.36¢ per $1 |
| Gini / Inequality Index | 1,062 | 0.45 |
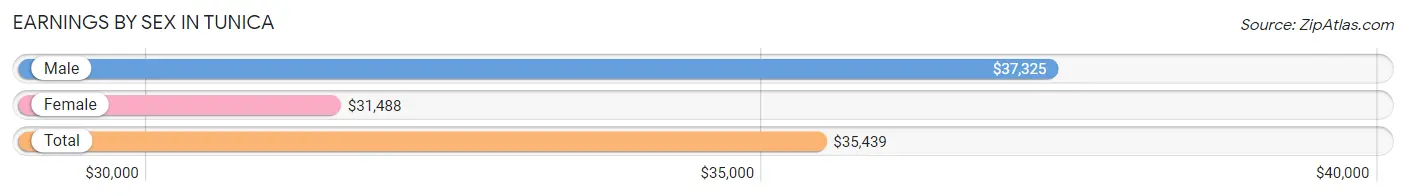
Earnings by Sex in Tunica
Average Earnings in Tunica are $35,439, $37,325 for men and $31,488 for women, a difference of 15.6%.
| Sex | Number | Average Earnings |
| Male | 271 (50.6%) | $37,325 |
| Female | 265 (49.4%) | $31,488 |
| Total | 536 (100.0%) | $35,439 |
Earnings by Sex by Income Bracket in Tunica
The most common earnings brackets in Tunica are $35,000 to $39,999 for men (57 | 21.0%) and $30,000 to $34,999 for women (49 | 18.5%).
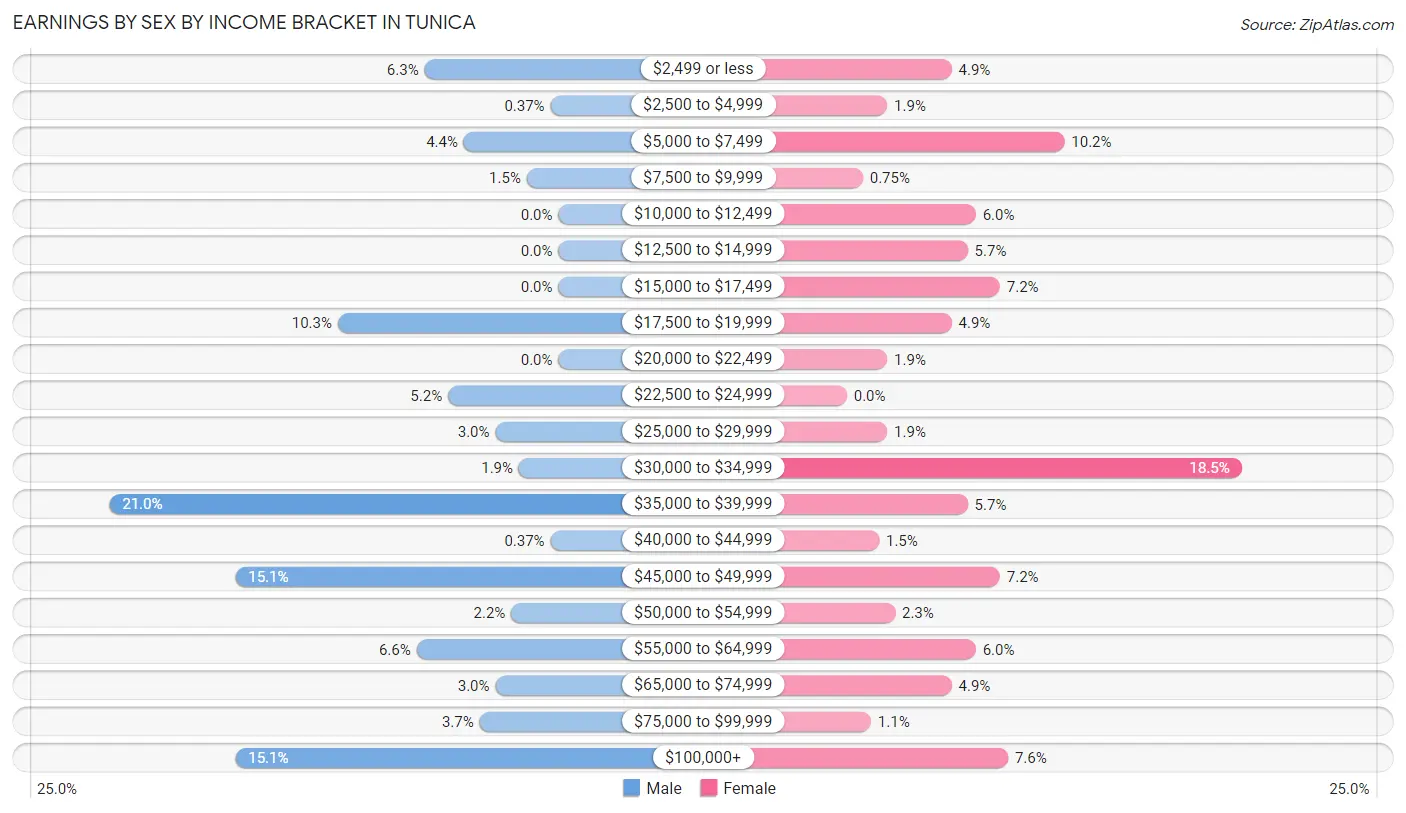
| Income | Male | Female |
| $2,499 or less | 17 (6.3%) | 13 (4.9%) |
| $2,500 to $4,999 | 1 (0.4%) | 5 (1.9%) |
| $5,000 to $7,499 | 12 (4.4%) | 27 (10.2%) |
| $7,500 to $9,999 | 4 (1.5%) | 2 (0.7%) |
| $10,000 to $12,499 | 0 (0.0%) | 16 (6.0%) |
| $12,500 to $14,999 | 0 (0.0%) | 15 (5.7%) |
| $15,000 to $17,499 | 0 (0.0%) | 19 (7.2%) |
| $17,500 to $19,999 | 28 (10.3%) | 13 (4.9%) |
| $20,000 to $22,499 | 0 (0.0%) | 5 (1.9%) |
| $22,500 to $24,999 | 14 (5.2%) | 0 (0.0%) |
| $25,000 to $29,999 | 8 (2.9%) | 5 (1.9%) |
| $30,000 to $34,999 | 5 (1.8%) | 49 (18.5%) |
| $35,000 to $39,999 | 57 (21.0%) | 15 (5.7%) |
| $40,000 to $44,999 | 1 (0.4%) | 4 (1.5%) |
| $45,000 to $49,999 | 41 (15.1%) | 19 (7.2%) |
| $50,000 to $54,999 | 6 (2.2%) | 6 (2.3%) |
| $55,000 to $64,999 | 18 (6.6%) | 16 (6.0%) |
| $65,000 to $74,999 | 8 (2.9%) | 13 (4.9%) |
| $75,000 to $99,999 | 10 (3.7%) | 3 (1.1%) |
| $100,000+ | 41 (15.1%) | 20 (7.5%) |
| Total | 271 (100.0%) | 265 (100.0%) |
Earnings by Sex by Educational Attainment in Tunica
Average earnings in Tunica are $37,857 for men and $32,024 for women, a difference of 15.4%. Men with an educational attainment of less than high school enjoy the highest average annual earnings of $39,107, while those with college or associate's degree education earn the least with $36,616. Women with an educational attainment of bachelor's degree earn the most with the average annual earnings of $45,250, while those with high school diploma education have the smallest earnings of $17,039.
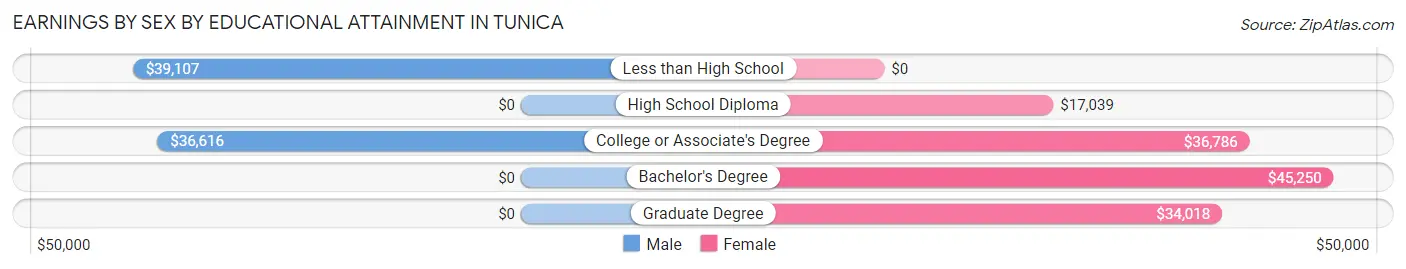
| Educational Attainment | Male Income | Female Income |
| Less than High School | $39,107 | $0 |
| High School Diploma | - | - |
| College or Associate's Degree | $36,616 | $36,786 |
| Bachelor's Degree | - | - |
| Graduate Degree | - | - |
| Total | $37,857 | $32,024 |
Family Income in Tunica
Family Income Brackets in Tunica
According to the Tunica family income data, there are 74 families falling into the $50,000 to $74,999 income range, which is the most common income bracket and makes up 29.6% of all families. Conversely, the $10,000 to $14,999 income bracket is the least frequent group with only 3 families (1.2%) belonging to this category.
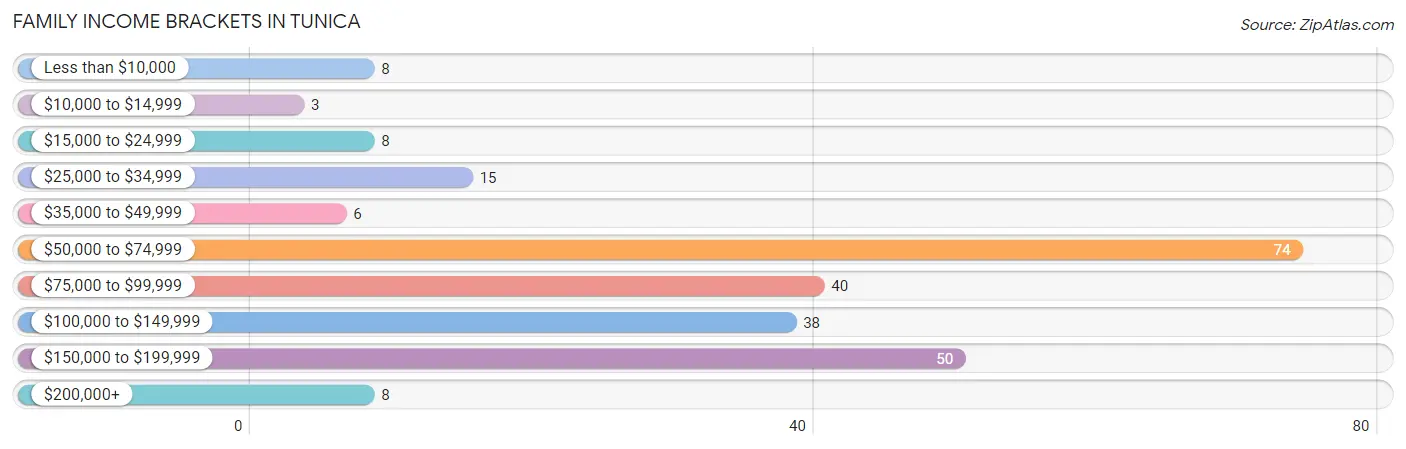
| Income Bracket | # Families | % Families |
| Less than $10,000 | 8 | 3.2% |
| $10,000 to $14,999 | 3 | 1.2% |
| $15,000 to $24,999 | 8 | 3.2% |
| $25,000 to $34,999 | 15 | 6.0% |
| $35,000 to $49,999 | 6 | 2.4% |
| $50,000 to $74,999 | 74 | 29.6% |
| $75,000 to $99,999 | 40 | 16.0% |
| $100,000 to $149,999 | 38 | 15.2% |
| $150,000 to $199,999 | 50 | 20.0% |
| $200,000+ | 8 | 3.2% |
Family Income by Famaliy Size in Tunica
2-person families (151 | 60.4%) account for the highest median family income in Tunica with $101,042 per family, while 2-person families (151 | 60.4%) have the highest median income of $50,521 per family member.
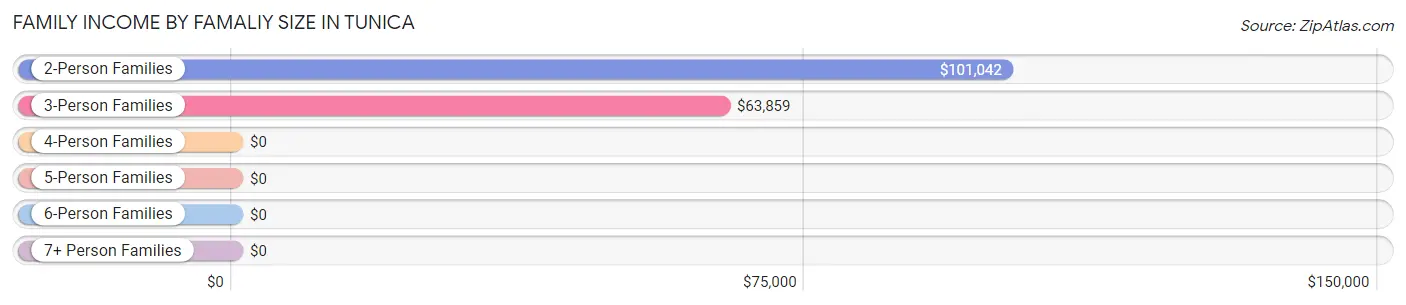
| Income Bracket | # Families | Median Income |
| 2-Person Families | 151 (60.4%) | $101,042 |
| 3-Person Families | 61 (24.4%) | $63,859 |
| 4-Person Families | 35 (14.0%) | $0 |
| 5-Person Families | 2 (0.8%) | $0 |
| 6-Person Families | 1 (0.4%) | $0 |
| 7+ Person Families | 0 (0.0%) | $0 |
| Total | 250 (100.0%) | $84,500 |
Family Income by Number of Earners in Tunica
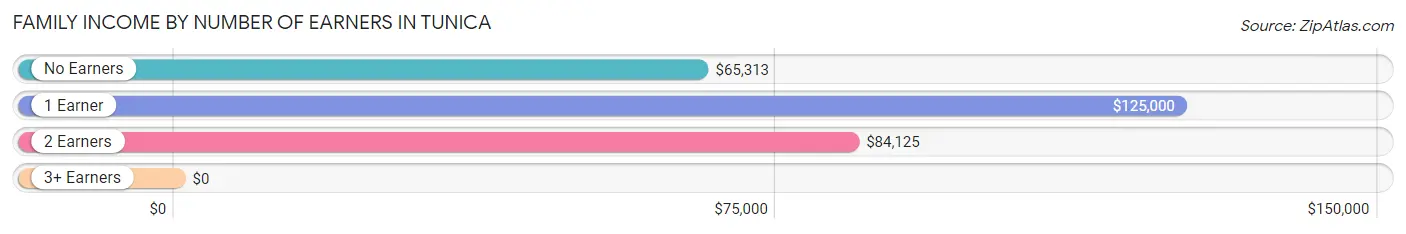
| Number of Earners | # Families | Median Income |
| No Earners | 29 (11.6%) | $65,313 |
| 1 Earner | 100 (40.0%) | $125,000 |
| 2 Earners | 121 (48.4%) | $84,125 |
| 3+ Earners | 0 (0.0%) | $0 |
| Total | 250 (100.0%) | $84,500 |
Household Income in Tunica
Household Income Brackets in Tunica
With 105 households falling in the category, the $50,000 to $74,999 income range is the most frequent in Tunica, accounting for 20.2% of all households. In contrast, only 8 households (1.5%) fall into the $200,000+ income bracket, making it the least populous group.
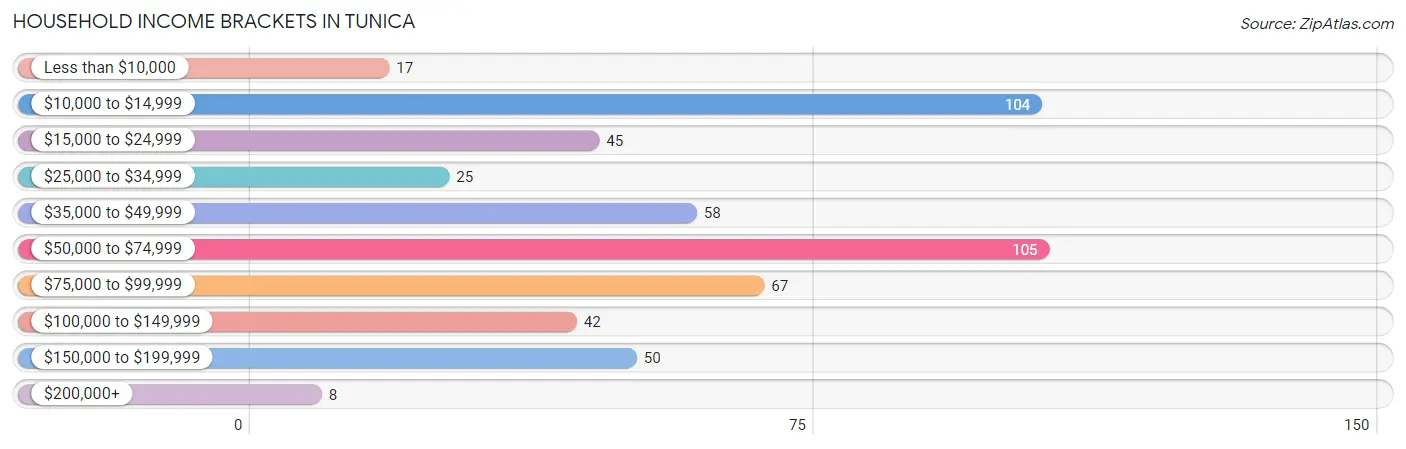
| Income Bracket | # Households | % Households |
| Less than $10,000 | 17 | 3.3% |
| $10,000 to $14,999 | 104 | 20.0% |
| $15,000 to $24,999 | 45 | 8.6% |
| $25,000 to $34,999 | 25 | 4.8% |
| $35,000 to $49,999 | 58 | 11.1% |
| $50,000 to $74,999 | 105 | 20.2% |
| $75,000 to $99,999 | 67 | 12.9% |
| $100,000 to $149,999 | 42 | 8.1% |
| $150,000 to $199,999 | 50 | 9.6% |
| $200,000+ | 8 | 1.5% |
Household Income by Householder Age in Tunica
The median household income in Tunica is $55,865, with the highest median household income of $62,740 found in the 45 to 64 years age bracket for the primary householder. A total of 253 households (48.6%) fall into this category.
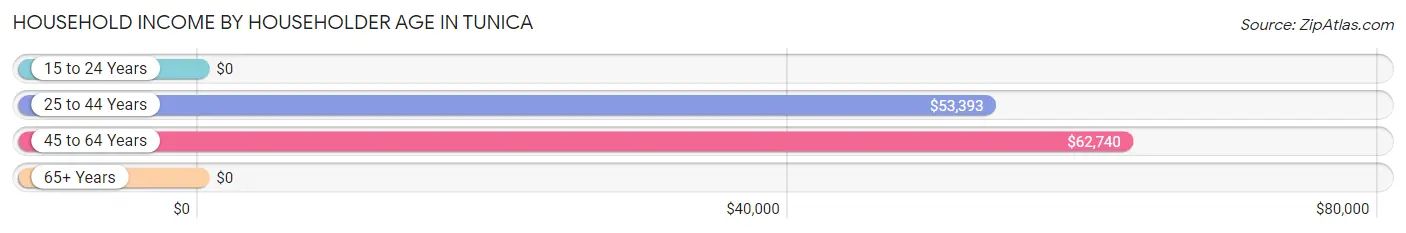
| Income Bracket | # Households | Median Income |
| 15 to 24 Years | 0 (0.0%) | $0 |
| 25 to 44 Years | 69 (13.2%) | $53,393 |
| 45 to 64 Years | 253 (48.6%) | $62,740 |
| 65+ Years | 199 (38.2%) | $0 |
| Total | 521 (100.0%) | $55,865 |
Poverty in Tunica
Income Below Poverty by Sex and Age in Tunica
With 12.4% poverty level for males and 24.7% for females among the residents of Tunica, 35 to 44 year old males and 15 year old females are the most vulnerable to poverty, with 16 males (25.8%) and 7 females (100.0%) in their respective age groups living below the poverty level.
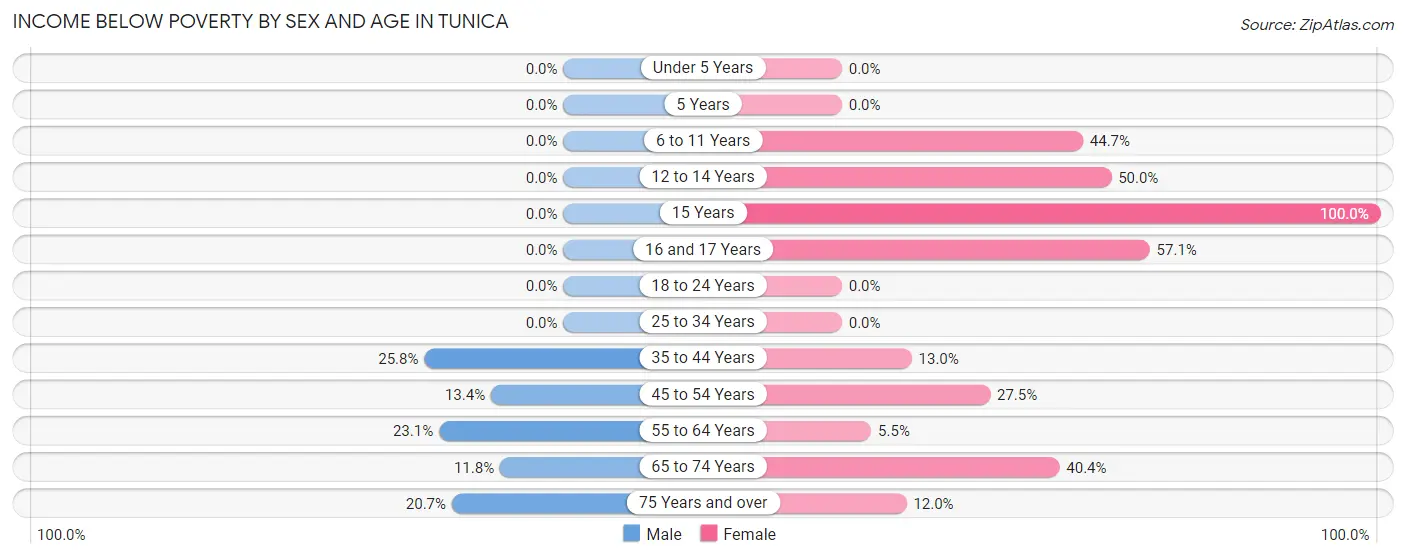
| Age Bracket | Male | Female |
| Under 5 Years | 0 (0.0%) | 0 (0.0%) |
| 5 Years | 0 (0.0%) | 0 (0.0%) |
| 6 to 11 Years | 0 (0.0%) | 17 (44.7%) |
| 12 to 14 Years | 0 (0.0%) | 8 (50.0%) |
| 15 Years | 0 (0.0%) | 7 (100.0%) |
| 16 and 17 Years | 0 (0.0%) | 16 (57.1%) |
| 18 to 24 Years | 0 (0.0%) | 0 (0.0%) |
| 25 to 34 Years | 0 (0.0%) | 0 (0.0%) |
| 35 to 44 Years | 16 (25.8%) | 7 (13.0%) |
| 45 to 54 Years | 18 (13.4%) | 30 (27.5%) |
| 55 to 64 Years | 6 (23.1%) | 6 (5.4%) |
| 65 to 74 Years | 10 (11.8%) | 42 (40.4%) |
| 75 Years and over | 12 (20.7%) | 6 (12.0%) |
| Total | 62 (12.4%) | 139 (24.7%) |
Income Above Poverty by Sex and Age in Tunica
According to the poverty statistics in Tunica, males aged under 5 years and females aged under 5 years are the age groups that are most secure financially, with 100.0% of males and 100.0% of females in these age groups living above the poverty line.
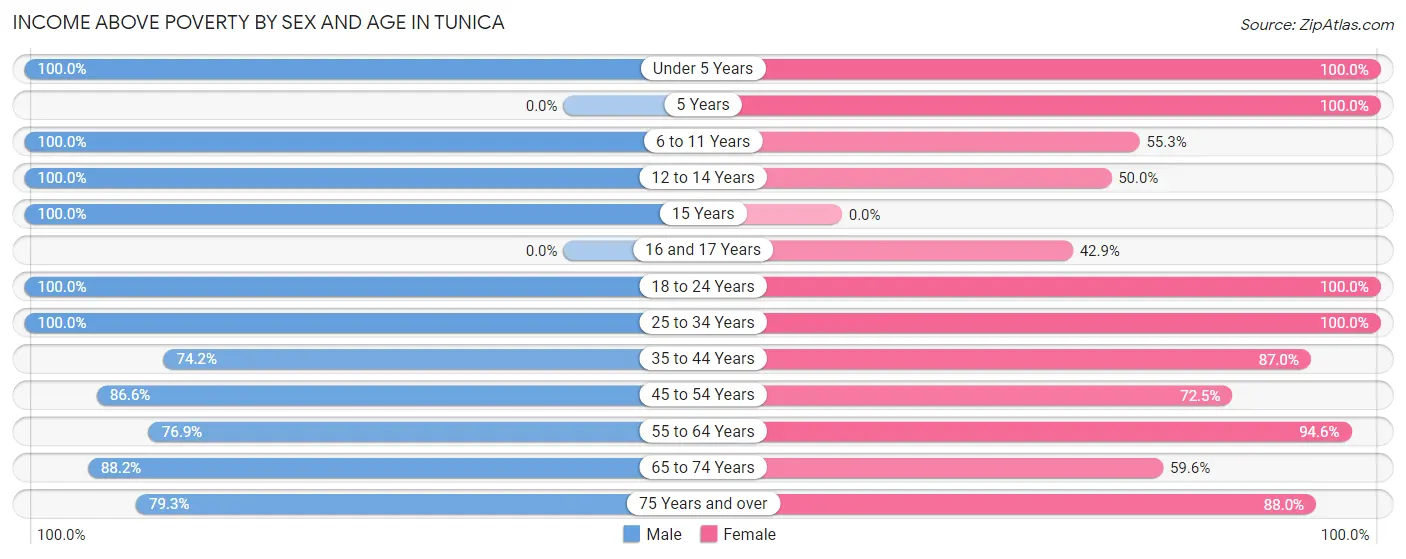
| Age Bracket | Male | Female |
| Under 5 Years | 28 (100.0%) | 5 (100.0%) |
| 5 Years | 0 (0.0%) | 6 (100.0%) |
| 6 to 11 Years | 35 (100.0%) | 21 (55.3%) |
| 12 to 14 Years | 10 (100.0%) | 8 (50.0%) |
| 15 Years | 17 (100.0%) | 0 (0.0%) |
| 16 and 17 Years | 0 (0.0%) | 12 (42.9%) |
| 18 to 24 Years | 26 (100.0%) | 28 (100.0%) |
| 25 to 34 Years | 19 (100.0%) | 7 (100.0%) |
| 35 to 44 Years | 46 (74.2%) | 47 (87.0%) |
| 45 to 54 Years | 116 (86.6%) | 79 (72.5%) |
| 55 to 64 Years | 20 (76.9%) | 104 (94.6%) |
| 65 to 74 Years | 75 (88.2%) | 62 (59.6%) |
| 75 Years and over | 46 (79.3%) | 44 (88.0%) |
| Total | 438 (87.6%) | 423 (75.3%) |
Income Below Poverty Among Married-Couple Families in Tunica
The poverty statistics for married-couple families in Tunica show that 5.7% or 11 of the total 194 families live below the poverty line. Families with 1 or 2 children have the highest poverty rate of 16.0%, comprising of 8 families. On the other hand, families with 3 or 4 children have the lowest poverty rate of 0.0%, which includes 0 families.
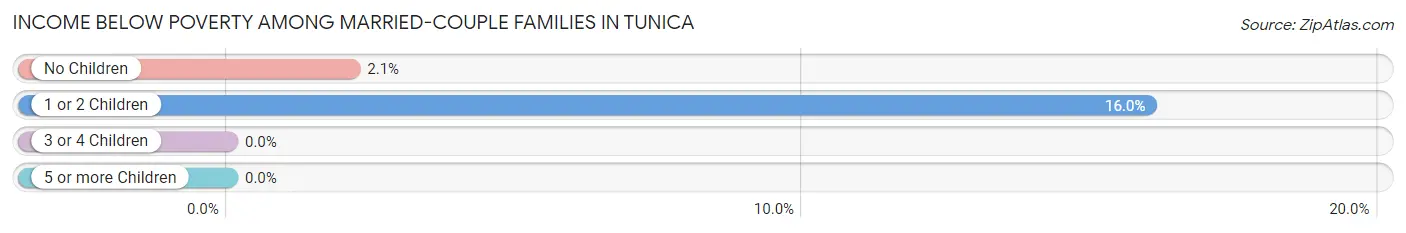
| Children | Above Poverty | Below Poverty |
| No Children | 138 (97.9%) | 3 (2.1%) |
| 1 or 2 Children | 42 (84.0%) | 8 (16.0%) |
| 3 or 4 Children | 3 (100.0%) | 0 (0.0%) |
| 5 or more Children | 0 (0.0%) | 0 (0.0%) |
| Total | 183 (94.3%) | 11 (5.7%) |
Income Below Poverty Among Single-Parent Households in Tunica
According to the poverty data in Tunica, 5.0% or 1 single-father households and 19.4% or 7 single-mother households are living below the poverty line. Among single-father households, those with 1 or 2 children have the highest poverty rate, with 1 households (16.7%) experiencing poverty. Likewise, among single-mother households, those with 3 or 4 children have the highest poverty rate, with 7 households (100.0%) falling below the poverty line.
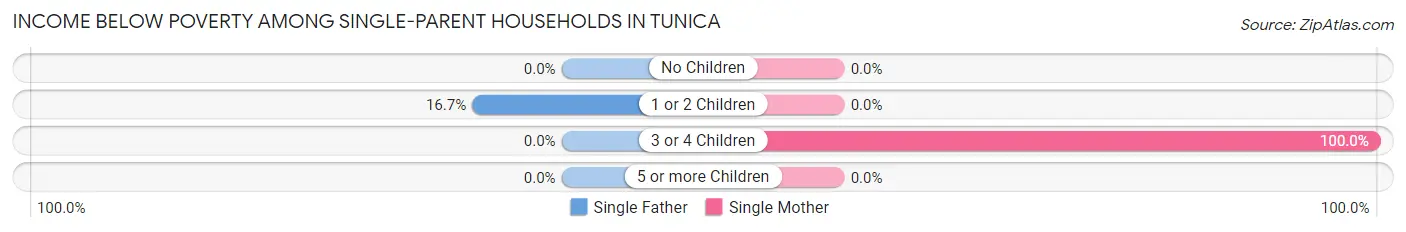
| Children | Single Father | Single Mother |
| No Children | 0 (0.0%) | 0 (0.0%) |
| 1 or 2 Children | 1 (16.7%) | 0 (0.0%) |
| 3 or 4 Children | 0 (0.0%) | 7 (100.0%) |
| 5 or more Children | 0 (0.0%) | 0 (0.0%) |
| Total | 1 (5.0%) | 7 (19.4%) |
Income Below Poverty Among Married-Couple vs Single-Parent Households in Tunica
The poverty data for Tunica shows that 11 of the married-couple family households (5.7%) and 8 of the single-parent households (14.3%) are living below the poverty level. Within the married-couple family households, those with 1 or 2 children have the highest poverty rate, with 8 households (16.0%) falling below the poverty line. Among the single-parent households, those with 3 or 4 children have the highest poverty rate, with 7 household (100.0%) living below poverty.
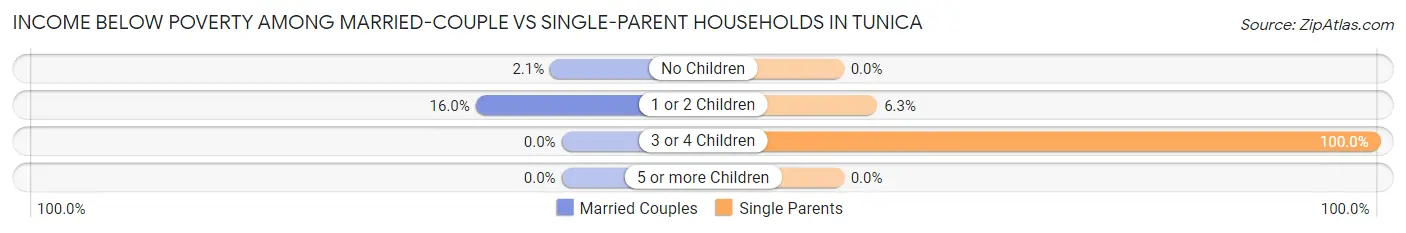
| Children | Married-Couple Families | Single-Parent Households |
| No Children | 3 (2.1%) | 0 (0.0%) |
| 1 or 2 Children | 8 (16.0%) | 1 (6.2%) |
| 3 or 4 Children | 0 (0.0%) | 7 (100.0%) |
| 5 or more Children | 0 (0.0%) | 0 (0.0%) |
| Total | 11 (5.7%) | 8 (14.3%) |
Race in Tunica
The most populous races in Tunica are White / Caucasian (649 | 61.1%), Black / African American (407 | 38.3%), and Hispanic or Latino (35 | 3.3%).
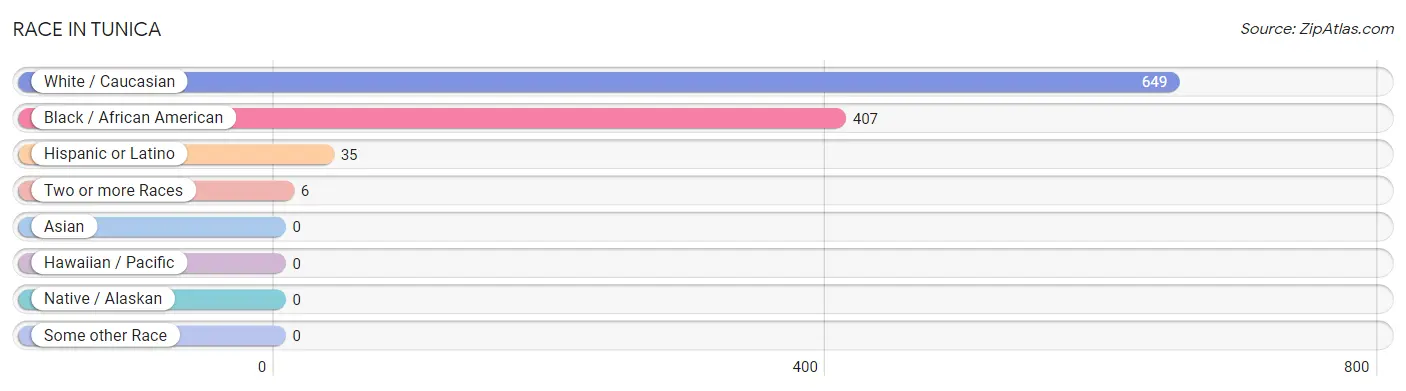
| Race | # Population | % Population |
| Asian | 0 | 0.0% |
| Black / African American | 407 | 38.3% |
| Hawaiian / Pacific | 0 | 0.0% |
| Hispanic or Latino | 35 | 3.3% |
| Native / Alaskan | 0 | 0.0% |
| White / Caucasian | 649 | 61.1% |
| Two or more Races | 6 | 0.6% |
| Some other Race | 0 | 0.0% |
| Total | 1,062 | 100.0% |
Ancestry in Tunica
The most populous ancestries reported in Tunica are English (148 | 13.9%), Irish (89 | 8.4%), German (62 | 5.8%), Italian (60 | 5.7%), and Scotch-Irish (41 | 3.9%), together accounting for 37.7% of all Tunica residents.
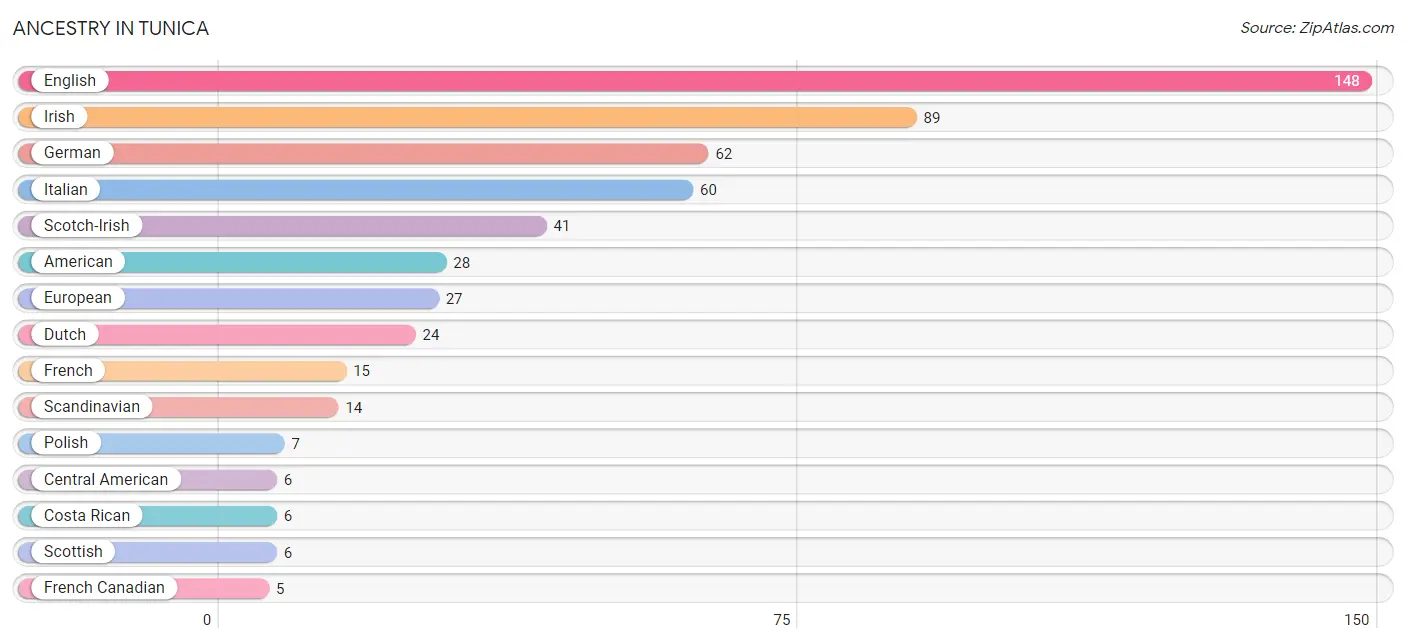
| Ancestry | # Population | % Population |
| American | 28 | 2.6% |
| Canadian | 4 | 0.4% |
| Central American | 6 | 0.6% |
| Costa Rican | 6 | 0.6% |
| Dutch | 24 | 2.3% |
| English | 148 | 13.9% |
| European | 27 | 2.5% |
| French | 15 | 1.4% |
| French Canadian | 5 | 0.5% |
| German | 62 | 5.8% |
| Irish | 89 | 8.4% |
| Italian | 60 | 5.7% |
| Polish | 7 | 0.7% |
| Scandinavian | 14 | 1.3% |
| Scotch-Irish | 41 | 3.9% |
| Scottish | 6 | 0.6% |
| Swedish | 2 | 0.2% | View All 17 Rows |
Immigrants in Tunica
The most numerous immigrant groups reported in Tunica came from Latin America (35 | 3.3%), Caribbean (29 | 2.7%), Cuba (29 | 2.7%), Central America (6 | 0.6%), and Costa Rica (6 | 0.6%), together accounting for 9.9% of all Tunica residents.
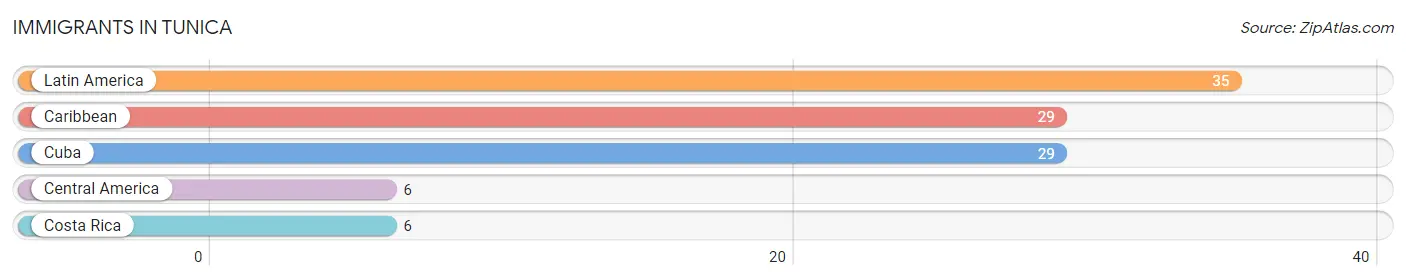
| Immigration Origin | # Population | % Population |
| Caribbean | 29 | 2.7% |
| Central America | 6 | 0.6% |
| Costa Rica | 6 | 0.6% |
| Cuba | 29 | 2.7% |
| Latin America | 35 | 3.3% | View All 5 Rows |
Sex and Age in Tunica
Sex and Age in Tunica
The most populous age groups in Tunica are 50 to 54 Years (91 | 18.2%) for men and 60 to 64 Years (105 | 18.7%) for women.
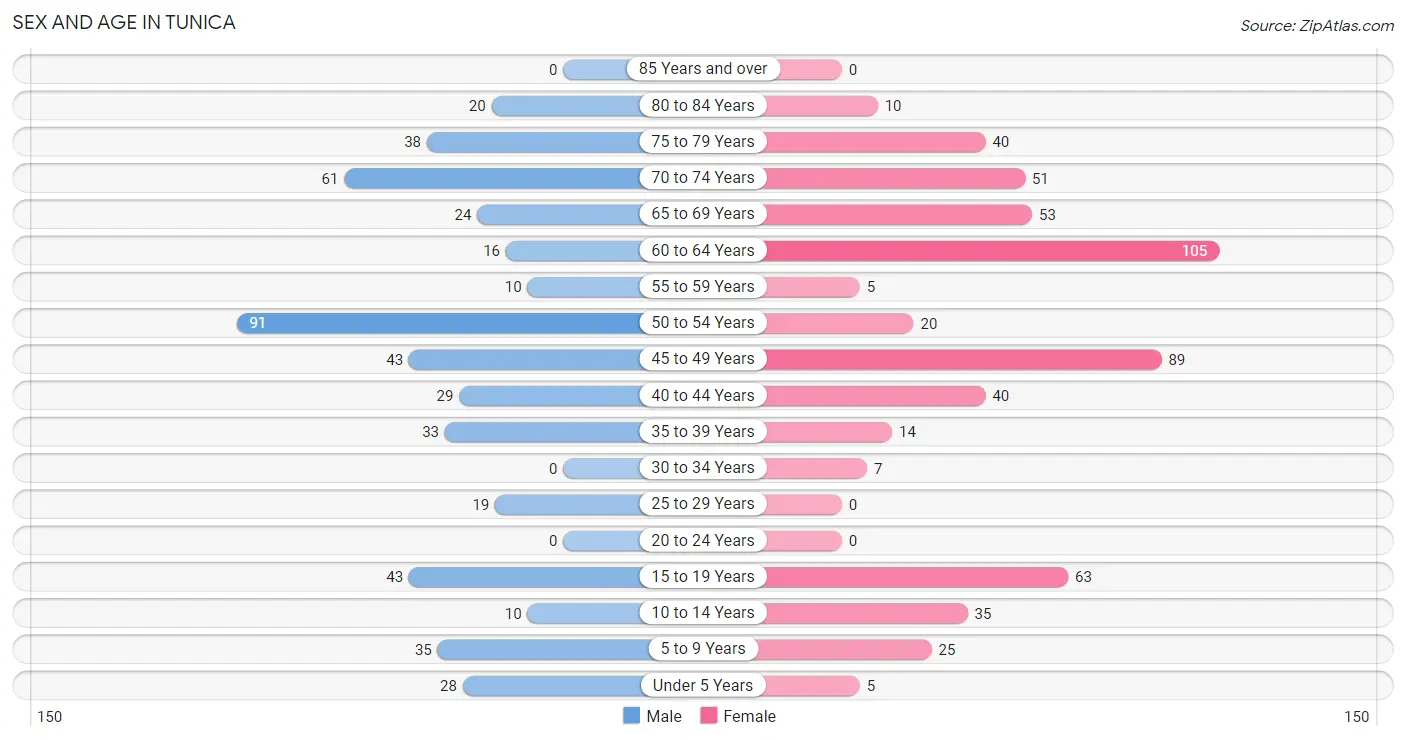
| Age Bracket | Male | Female |
| Under 5 Years | 28 (5.6%) | 5 (0.9%) |
| 5 to 9 Years | 35 (7.0%) | 25 (4.4%) |
| 10 to 14 Years | 10 (2.0%) | 35 (6.2%) |
| 15 to 19 Years | 43 (8.6%) | 63 (11.2%) |
| 20 to 24 Years | 0 (0.0%) | 0 (0.0%) |
| 25 to 29 Years | 19 (3.8%) | 0 (0.0%) |
| 30 to 34 Years | 0 (0.0%) | 7 (1.3%) |
| 35 to 39 Years | 33 (6.6%) | 14 (2.5%) |
| 40 to 44 Years | 29 (5.8%) | 40 (7.1%) |
| 45 to 49 Years | 43 (8.6%) | 89 (15.8%) |
| 50 to 54 Years | 91 (18.2%) | 20 (3.6%) |
| 55 to 59 Years | 10 (2.0%) | 5 (0.9%) |
| 60 to 64 Years | 16 (3.2%) | 105 (18.7%) |
| 65 to 69 Years | 24 (4.8%) | 53 (9.4%) |
| 70 to 74 Years | 61 (12.2%) | 51 (9.1%) |
| 75 to 79 Years | 38 (7.6%) | 40 (7.1%) |
| 80 to 84 Years | 20 (4.0%) | 10 (1.8%) |
| 85 Years and over | 0 (0.0%) | 0 (0.0%) |
| Total | 500 (100.0%) | 562 (100.0%) |
Families and Households in Tunica
Median Family Size in Tunica
The median family size in Tunica is 3.09 persons per family, with single male/father families (20 | 8.0%) accounting for the largest median family size of 4.2 persons per family. On the other hand, married-couple families (194 | 77.6%) represent the smallest median family size with 2.87 persons per family.
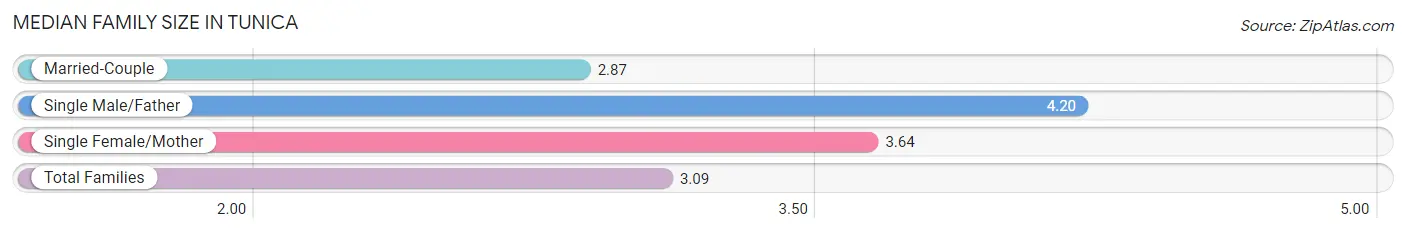
| Family Type | # Families | Family Size |
| Married-Couple | 194 (77.6%) | 2.87 |
| Single Male/Father | 20 (8.0%) | 4.20 |
| Single Female/Mother | 36 (14.4%) | 3.64 |
| Total Families | 250 (100.0%) | 3.09 |
Median Household Size in Tunica
The median household size in Tunica is 2.04 persons per household, with single male/father households (20 | 3.8%) accounting for the largest median household size of 4.2 persons per household. non-family households (271 | 52.0%) represent the smallest median household size with 1.07 persons per household.
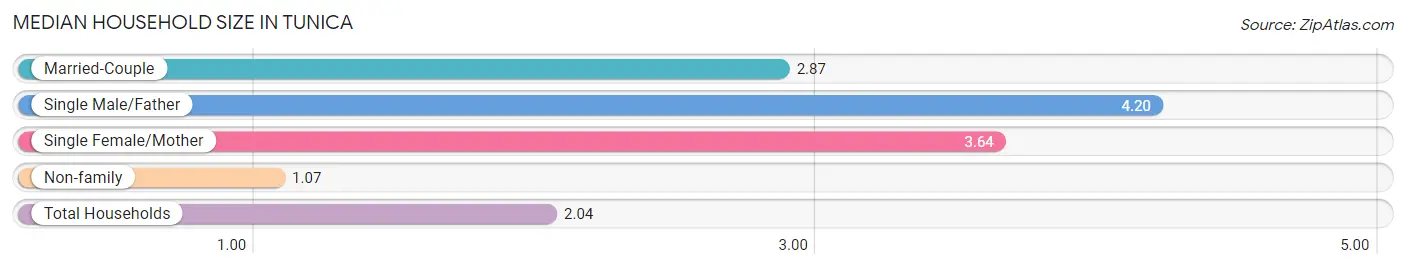
| Household Type | # Households | Household Size |
| Married-Couple | 194 (37.2%) | 2.87 |
| Single Male/Father | 20 (3.8%) | 4.20 |
| Single Female/Mother | 36 (6.9%) | 3.64 |
| Non-family | 271 (52.0%) | 1.07 |
| Total Households | 521 (100.0%) | 2.04 |
Household Size by Marriage Status in Tunica
Out of a total of 521 households in Tunica, 250 (48.0%) are family households, while 271 (52.0%) are nonfamily households. The most numerous type of family households are 2-person households, comprising 151, and the most common type of nonfamily households are 1-person households, comprising 249.
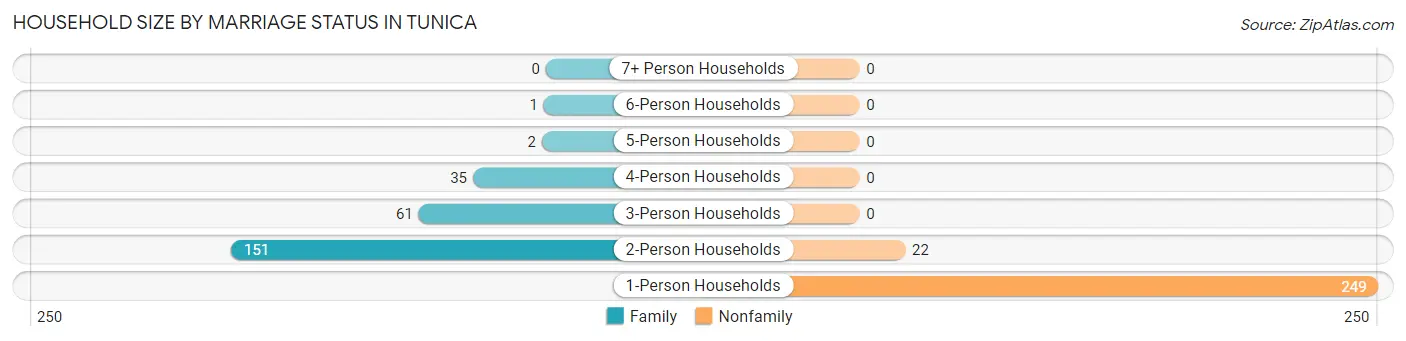
| Household Size | Family Households | Nonfamily Households |
| 1-Person Households | - | 249 (47.8%) |
| 2-Person Households | 151 (29.0%) | 22 (4.2%) |
| 3-Person Households | 61 (11.7%) | 0 (0.0%) |
| 4-Person Households | 35 (6.7%) | 0 (0.0%) |
| 5-Person Households | 2 (0.4%) | 0 (0.0%) |
| 6-Person Households | 1 (0.2%) | 0 (0.0%) |
| 7+ Person Households | 0 (0.0%) | 0 (0.0%) |
| Total | 250 (48.0%) | 271 (52.0%) |
Female Fertility in Tunica
Fertility by Age in Tunica
| Age Bracket | Women with Births | Births / 1,000 Women |
| 15 to 19 years | 0 (0.0%) | 0.0 |
| 20 to 34 years | 0 (0.0%) | 0.0 |
| 35 to 50 years | 0 (0.0%) | 0.0 |
| Total | 0 (0.0%) | 0.0 |
Fertility by Age by Marriage Status in Tunica
| Age Bracket | Married | Unmarried |
| 15 to 19 years | 0 (0.0%) | 0 (0.0%) |
| 20 to 34 years | 0 (0.0%) | 0 (0.0%) |
| 35 to 50 years | 0 (0.0%) | 0 (0.0%) |
| Total | 0 (0.0%) | 0 (0.0%) |
Fertility by Education in Tunica
| Educational Attainment | Women with Births | Births / 1,000 Women |
| Less than High School | 0 (0.0%) | 0.0 |
| High School Diploma | 0 (0.0%) | 0.0 |
| College or Associate's Degree | 0 (0.0%) | 0.0 |
| Bachelor's Degree | 0 (0.0%) | 0.0 |
| Graduate Degree | 0 (0.0%) | 0.0 |
| Total | 0 (0.0%) | 0.0 |
Fertility by Education by Marriage Status in Tunica
| Educational Attainment | Married | Unmarried |
| Less than High School | 0 (0.0%) | 0 (0.0%) |
| High School Diploma | 0 (0.0%) | 0 (0.0%) |
| College or Associate's Degree | 0 (0.0%) | 0 (0.0%) |
| Bachelor's Degree | 0 (0.0%) | 0 (0.0%) |
| Graduate Degree | 0 (0.0%) | 0 (0.0%) |
| Total | 0 (0.0%) | 0 (0.0%) |
Employment Characteristics in Tunica
Employment by Class of Employer in Tunica
Among the 458 employed individuals in Tunica, private company employees (311 | 67.9%), not-for-profit organizations (38 | 8.3%), and self-employed (incorporated) (35 | 7.6%) make up the most common classes of employment.
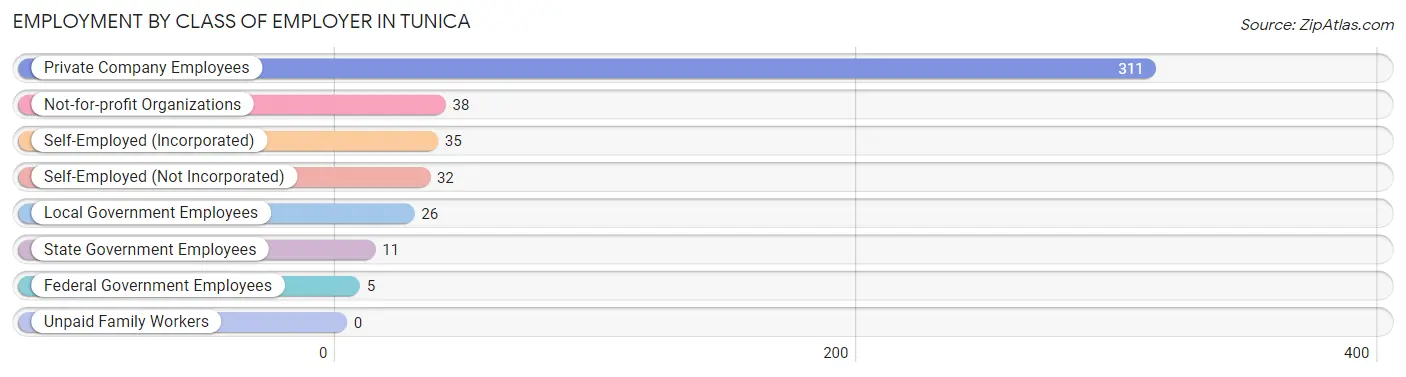
| Employer Class | # Employees | % Employees |
| Private Company Employees | 311 | 67.9% |
| Self-Employed (Incorporated) | 35 | 7.6% |
| Self-Employed (Not Incorporated) | 32 | 7.0% |
| Not-for-profit Organizations | 38 | 8.3% |
| Local Government Employees | 26 | 5.7% |
| State Government Employees | 11 | 2.4% |
| Federal Government Employees | 5 | 1.1% |
| Unpaid Family Workers | 0 | 0.0% |
| Total | 458 | 100.0% |
Employment Status by Age in Tunica
According to the labor force statistics for Tunica, out of the total population over 16 years of age (900), 53.8% or 484 individuals are in the labor force, with 2.7% or 13 of them unemployed. The age group with the highest labor force participation rate is 25 to 29 years, with 100.0% or 19 individuals in the labor force. Within the labor force, the 55 to 59 years age range has the highest percentage of unemployed individuals, with 100.0% or 6 of them being unemployed.
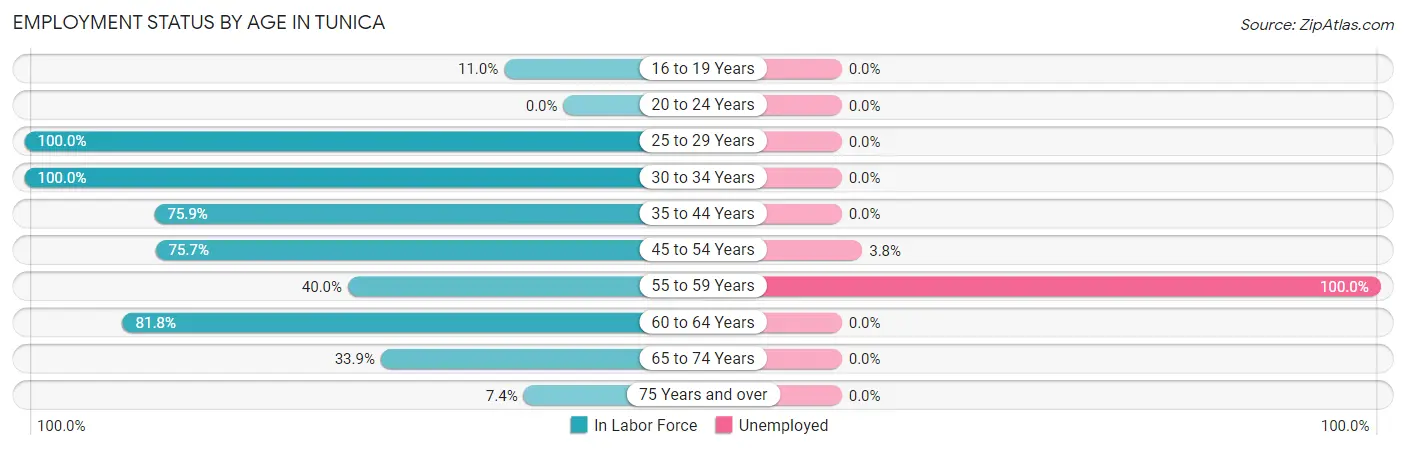
| Age Bracket | In Labor Force | Unemployed |
| 16 to 19 Years | 9 (11.0%) | 0 (0.0%) |
| 20 to 24 Years | 0 (0.0%) | 0 (0.0%) |
| 25 to 29 Years | 19 (100.0%) | 0 (0.0%) |
| 30 to 34 Years | 7 (100.0%) | 0 (0.0%) |
| 35 to 44 Years | 88 (75.9%) | 0 (0.0%) |
| 45 to 54 Years | 184 (75.7%) | 7 (3.8%) |
| 55 to 59 Years | 6 (40.0%) | 6 (100.0%) |
| 60 to 64 Years | 99 (81.8%) | 0 (0.0%) |
| 65 to 74 Years | 64 (33.9%) | 0 (0.0%) |
| 75 Years and over | 8 (7.4%) | 0 (0.0%) |
| Total | 484 (53.8%) | 13 (2.7%) |
Employment Status by Educational Attainment in Tunica
According to labor force statistics for Tunica, 77.4% of individuals (403) out of the total population between 25 and 64 years of age (521) are in the labor force, with 3.2% or 13 of them being unemployed. The group with the highest labor force participation rate are those with the educational attainment of college / associate degree, with 90.7% or 186 individuals in the labor force. Within the labor force, individuals with less than high school education have the highest percentage of unemployment, with 28.6% or 6 of them being unemployed.
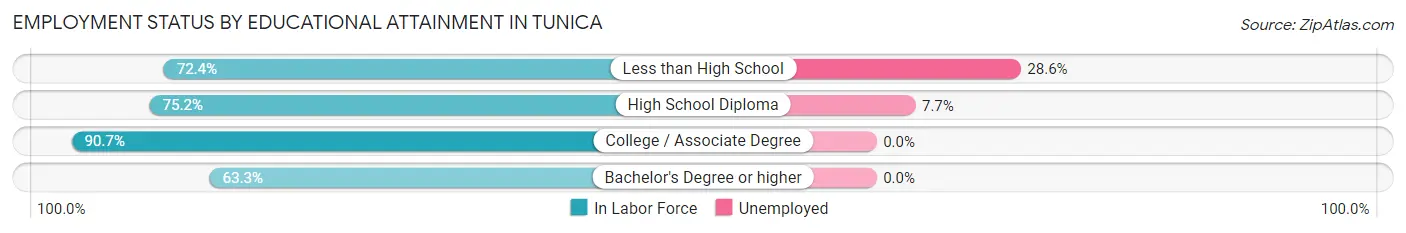
| Educational Attainment | In Labor Force | Unemployed |
| Less than High School | 21 (72.4%) | 8 (28.6%) |
| High School Diploma | 91 (75.2%) | 9 (7.7%) |
| College / Associate Degree | 186 (90.7%) | 0 (0.0%) |
| Bachelor's Degree or higher | 105 (63.3%) | 0 (0.0%) |
| Total | 403 (77.4%) | 17 (3.2%) |
Employment Occupations by Sex in Tunica
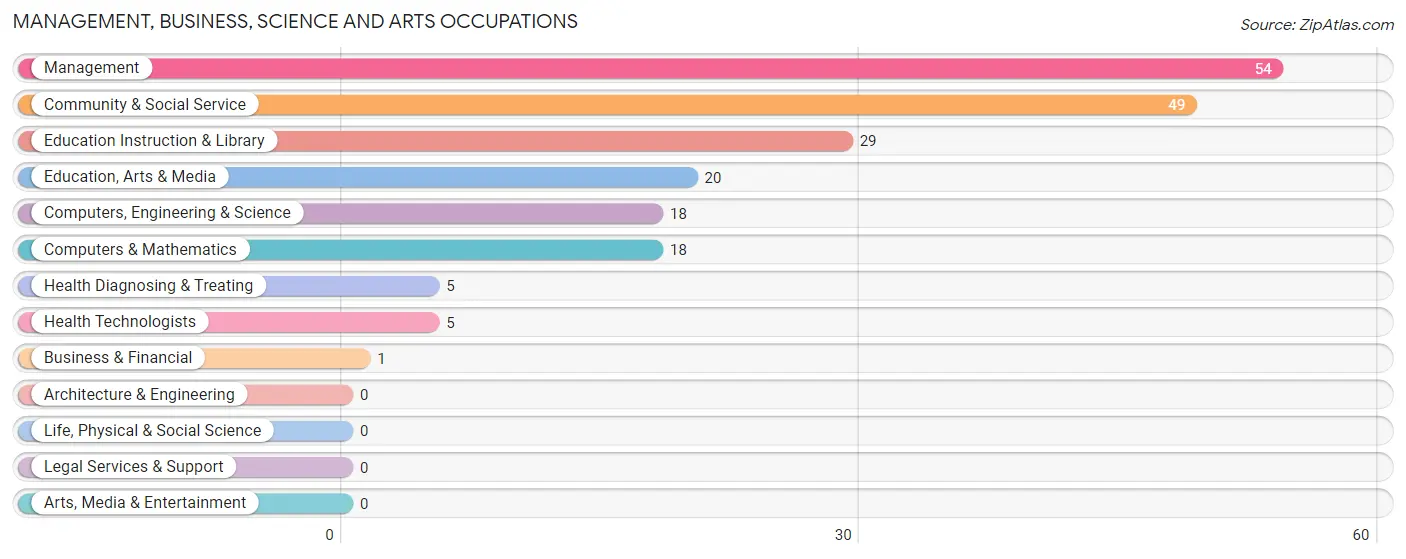
Management, Business, Science and Arts Occupations
The most common Management, Business, Science and Arts occupations in Tunica are Management (54 | 11.5%), Community & Social Service (49 | 10.4%), Education Instruction & Library (29 | 6.2%), Education, Arts & Media (20 | 4.3%), and Computers, Engineering & Science (18 | 3.8%).
Management, Business, Science and Arts Occupations by Sex
Within the Management, Business, Science and Arts occupations in Tunica, the most male-oriented occupations are Business & Financial (100.0%), Computers, Engineering & Science (100.0%), and Computers & Mathematics (100.0%), while the most female-oriented occupations are Health Diagnosing & Treating (100.0%), Health Technologists (100.0%), and Education, Arts & Media (90.0%).
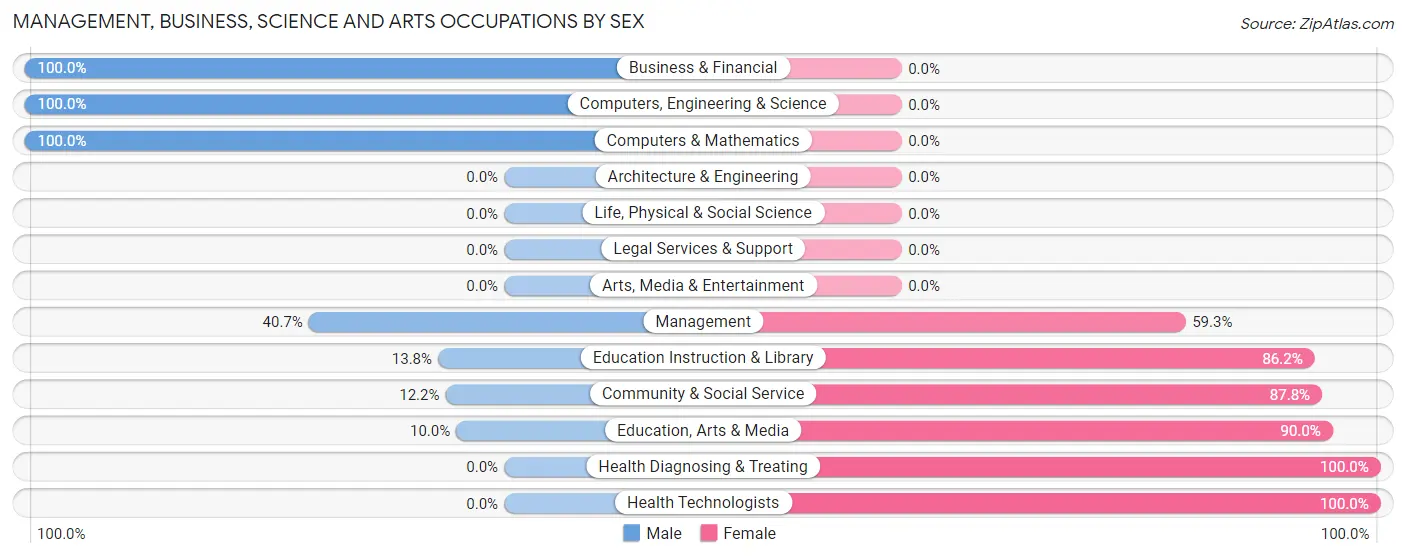
| Occupation | Male | Female |
| Management | 22 (40.7%) | 32 (59.3%) |
| Business & Financial | 1 (100.0%) | 0 (0.0%) |
| Computers, Engineering & Science | 18 (100.0%) | 0 (0.0%) |
| Computers & Mathematics | 18 (100.0%) | 0 (0.0%) |
| Architecture & Engineering | 0 (0.0%) | 0 (0.0%) |
| Life, Physical & Social Science | 0 (0.0%) | 0 (0.0%) |
| Community & Social Service | 6 (12.2%) | 43 (87.8%) |
| Education, Arts & Media | 2 (10.0%) | 18 (90.0%) |
| Legal Services & Support | 0 (0.0%) | 0 (0.0%) |
| Education Instruction & Library | 4 (13.8%) | 25 (86.2%) |
| Arts, Media & Entertainment | 0 (0.0%) | 0 (0.0%) |
| Health Diagnosing & Treating | 0 (0.0%) | 5 (100.0%) |
| Health Technologists | 0 (0.0%) | 5 (100.0%) |
| Total (Category) | 47 (37.0%) | 80 (63.0%) |
| Total (Overall) | 230 (48.8%) | 241 (51.2%) |
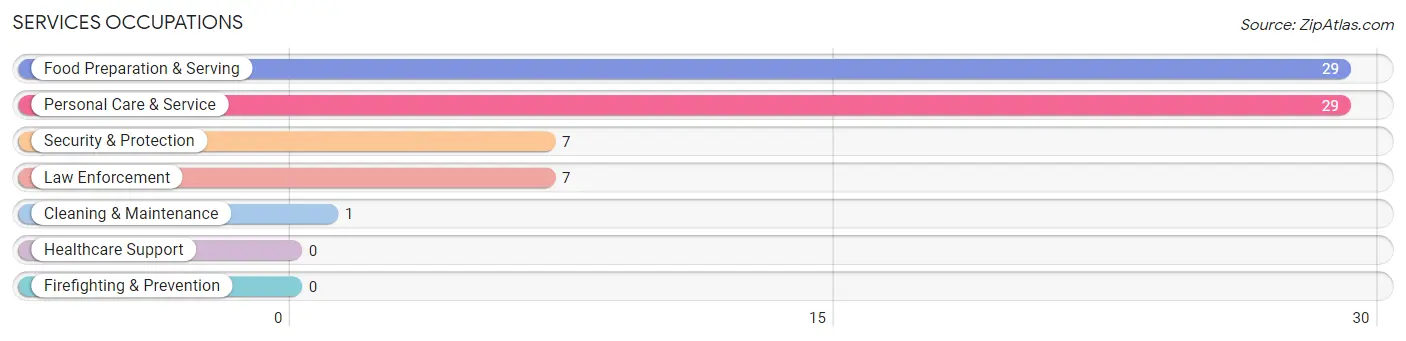
Services Occupations
The most common Services occupations in Tunica are Food Preparation & Serving (29 | 6.2%), Personal Care & Service (29 | 6.2%), Security & Protection (7 | 1.5%), Law Enforcement (7 | 1.5%), and Cleaning & Maintenance (1 | 0.2%).
Services Occupations by Sex
Within the Services occupations in Tunica, the most male-oriented occupations are Security & Protection (100.0%), Law Enforcement (100.0%), and Cleaning & Maintenance (100.0%), while the most female-oriented occupations are Food Preparation & Serving (100.0%), and Personal Care & Service (100.0%).
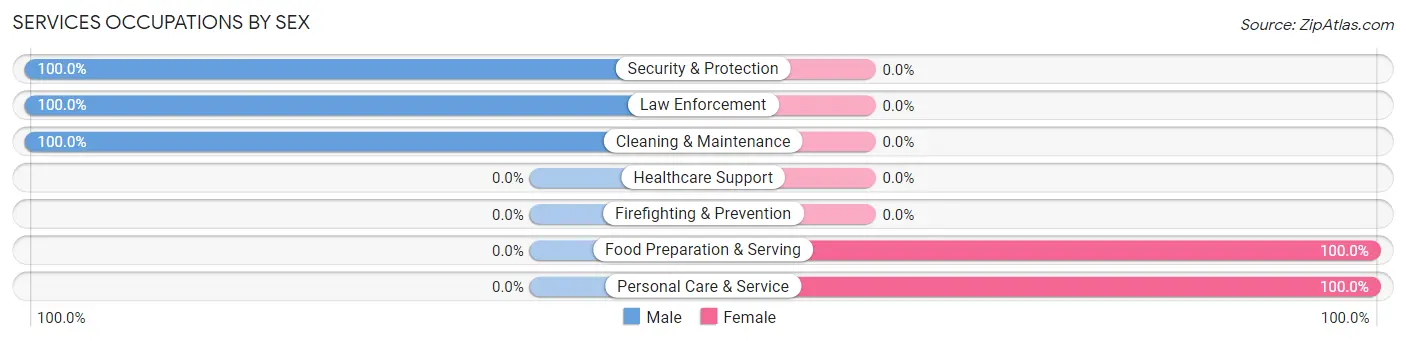
| Occupation | Male | Female |
| Healthcare Support | 0 (0.0%) | 0 (0.0%) |
| Security & Protection | 7 (100.0%) | 0 (0.0%) |
| Firefighting & Prevention | 0 (0.0%) | 0 (0.0%) |
| Law Enforcement | 7 (100.0%) | 0 (0.0%) |
| Food Preparation & Serving | 0 (0.0%) | 29 (100.0%) |
| Cleaning & Maintenance | 1 (100.0%) | 0 (0.0%) |
| Personal Care & Service | 0 (0.0%) | 29 (100.0%) |
| Total (Category) | 8 (12.1%) | 58 (87.9%) |
| Total (Overall) | 230 (48.8%) | 241 (51.2%) |
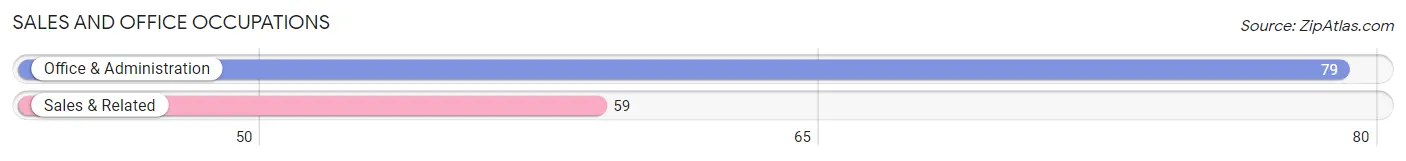
Sales and Office Occupations
The most common Sales and Office occupations in Tunica are Office & Administration (79 | 16.8%), and Sales & Related (59 | 12.5%).
Sales and Office Occupations by Sex
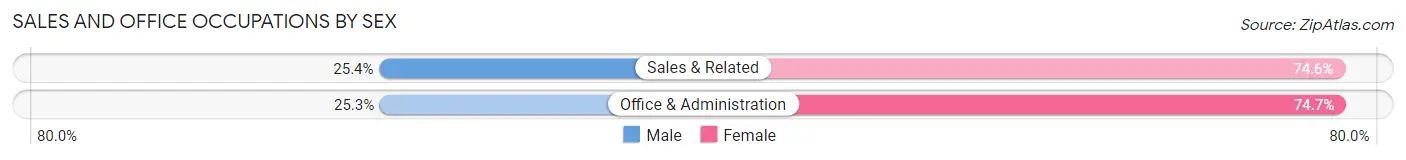
| Occupation | Male | Female |
| Sales & Related | 15 (25.4%) | 44 (74.6%) |
| Office & Administration | 20 (25.3%) | 59 (74.7%) |
| Total (Category) | 35 (25.4%) | 103 (74.6%) |
| Total (Overall) | 230 (48.8%) | 241 (51.2%) |
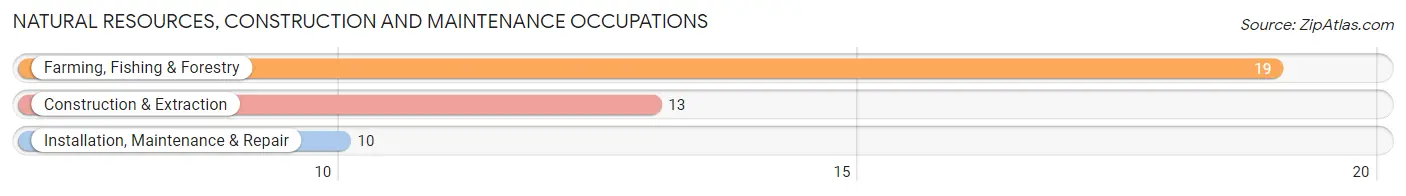
Natural Resources, Construction and Maintenance Occupations
The most common Natural Resources, Construction and Maintenance occupations in Tunica are Farming, Fishing & Forestry (19 | 4.0%), Construction & Extraction (13 | 2.8%), and Installation, Maintenance & Repair (10 | 2.1%).
Natural Resources, Construction and Maintenance Occupations by Sex
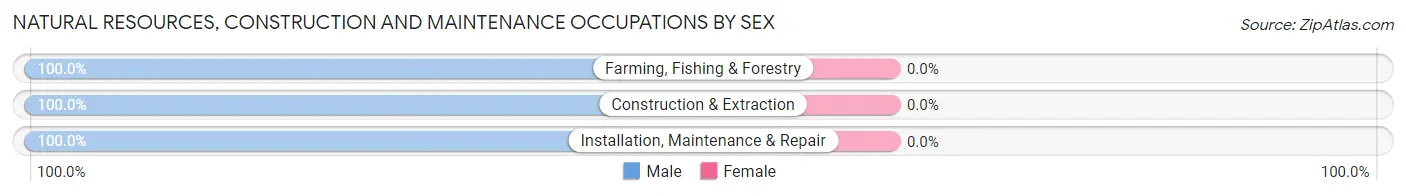
| Occupation | Male | Female |
| Farming, Fishing & Forestry | 19 (100.0%) | 0 (0.0%) |
| Construction & Extraction | 13 (100.0%) | 0 (0.0%) |
| Installation, Maintenance & Repair | 10 (100.0%) | 0 (0.0%) |
| Total (Category) | 42 (100.0%) | 0 (0.0%) |
| Total (Overall) | 230 (48.8%) | 241 (51.2%) |
Production, Transportation and Moving Occupations
The most common Production, Transportation and Moving occupations in Tunica are Production (45 | 9.6%), Transportation (39 | 8.3%), and Material Moving (14 | 3.0%).
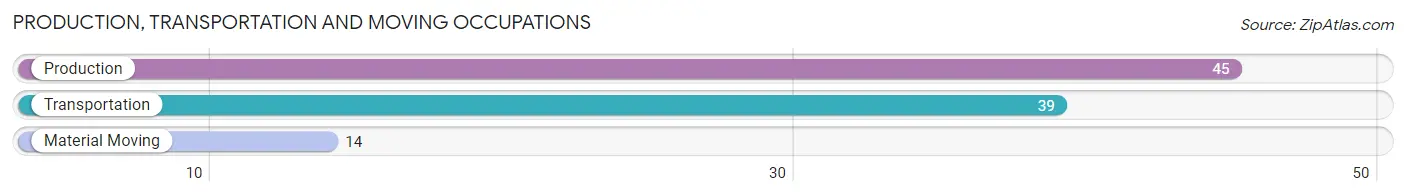
Production, Transportation and Moving Occupations by Sex

| Occupation | Male | Female |
| Production | 45 (100.0%) | 0 (0.0%) |
| Transportation | 39 (100.0%) | 0 (0.0%) |
| Material Moving | 14 (100.0%) | 0 (0.0%) |
| Total (Category) | 98 (100.0%) | 0 (0.0%) |
| Total (Overall) | 230 (48.8%) | 241 (51.2%) |
Employment Industries by Sex in Tunica
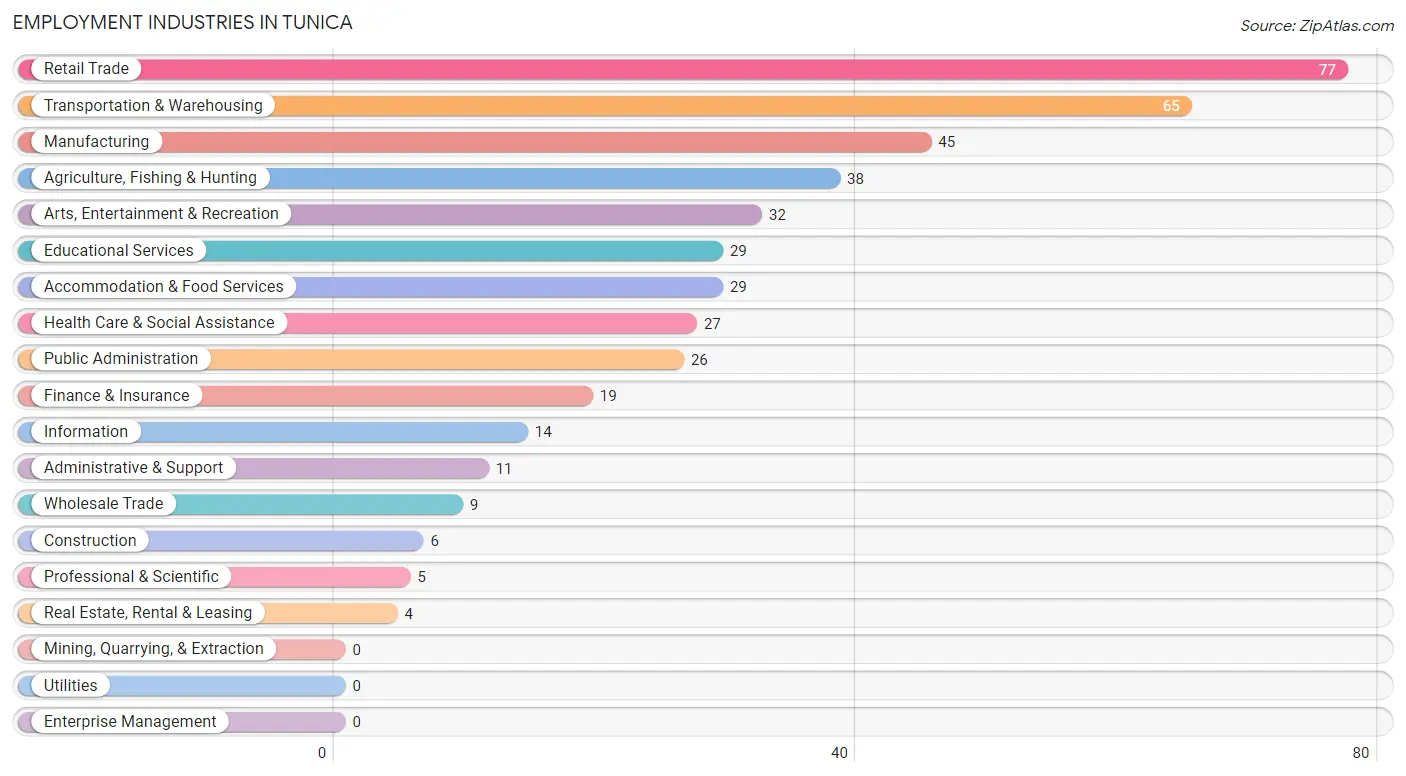
Employment Industries in Tunica
The major employment industries in Tunica include Retail Trade (77 | 16.4%), Transportation & Warehousing (65 | 13.8%), Manufacturing (45 | 9.6%), Agriculture, Fishing & Hunting (38 | 8.1%), and Arts, Entertainment & Recreation (32 | 6.8%).
Employment Industries by Sex in Tunica
The Tunica industries that see more men than women are Agriculture, Fishing & Hunting (100.0%), Construction (100.0%), and Manufacturing (100.0%), whereas the industries that tend to have a higher number of women are Information (100.0%), Finance & Insurance (100.0%), and Real Estate, Rental & Leasing (100.0%).
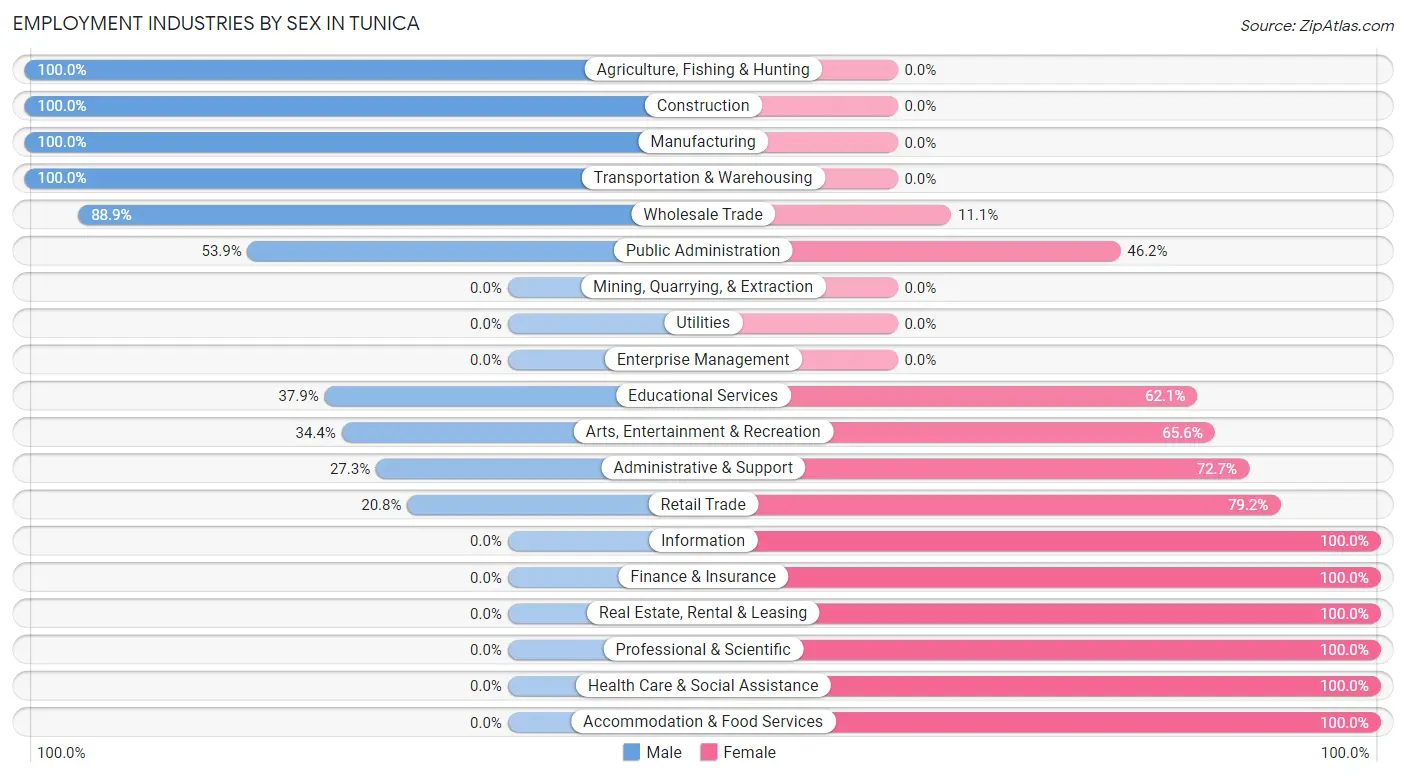
| Industry | Male | Female |
| Agriculture, Fishing & Hunting | 38 (100.0%) | 0 (0.0%) |
| Mining, Quarrying, & Extraction | 0 (0.0%) | 0 (0.0%) |
| Construction | 6 (100.0%) | 0 (0.0%) |
| Manufacturing | 45 (100.0%) | 0 (0.0%) |
| Wholesale Trade | 8 (88.9%) | 1 (11.1%) |
| Retail Trade | 16 (20.8%) | 61 (79.2%) |
| Transportation & Warehousing | 65 (100.0%) | 0 (0.0%) |
| Utilities | 0 (0.0%) | 0 (0.0%) |
| Information | 0 (0.0%) | 14 (100.0%) |
| Finance & Insurance | 0 (0.0%) | 19 (100.0%) |
| Real Estate, Rental & Leasing | 0 (0.0%) | 4 (100.0%) |
| Professional & Scientific | 0 (0.0%) | 5 (100.0%) |
| Enterprise Management | 0 (0.0%) | 0 (0.0%) |
| Administrative & Support | 3 (27.3%) | 8 (72.7%) |
| Educational Services | 11 (37.9%) | 18 (62.1%) |
| Health Care & Social Assistance | 0 (0.0%) | 27 (100.0%) |
| Arts, Entertainment & Recreation | 11 (34.4%) | 21 (65.6%) |
| Accommodation & Food Services | 0 (0.0%) | 29 (100.0%) |
| Public Administration | 14 (53.8%) | 12 (46.2%) |
| Total | 230 (48.8%) | 241 (51.2%) |
Education in Tunica
School Enrollment in Tunica
The most common levels of schooling among the 218 students in Tunica are elementary school (64 | 29.4%), high school (61 | 28.0%), and college / undergraduate (51 | 23.4%).
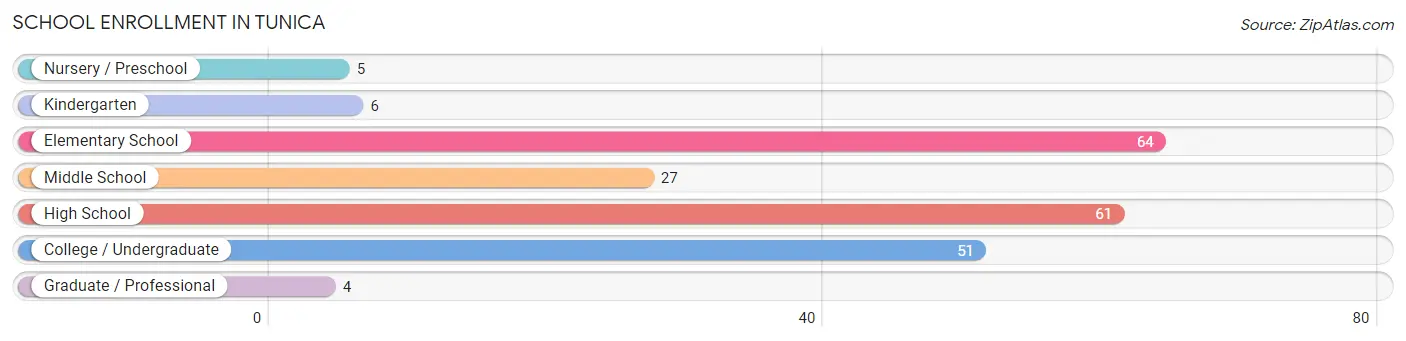
| School Level | # Students | % Students |
| Nursery / Preschool | 5 | 2.3% |
| Kindergarten | 6 | 2.8% |
| Elementary School | 64 | 29.4% |
| Middle School | 27 | 12.4% |
| High School | 61 | 28.0% |
| College / Undergraduate | 51 | 23.4% |
| Graduate / Professional | 4 | 1.8% |
| Total | 218 | 100.0% |
School Enrollment by Age by Funding Source in Tunica
Out of a total of 218 students who are enrolled in schools in Tunica, 113 (51.8%) attend a private institution, while the remaining 105 (48.2%) are enrolled in public schools. The age group of 3 to 4 year olds has the highest likelihood of being enrolled in private schools, with 5 (100.0% in the age bracket) enrolled. Conversely, the age group of 35 years and over has the lowest likelihood of being enrolled in a private school, with 9 (90.0% in the age bracket) attending a public institution.
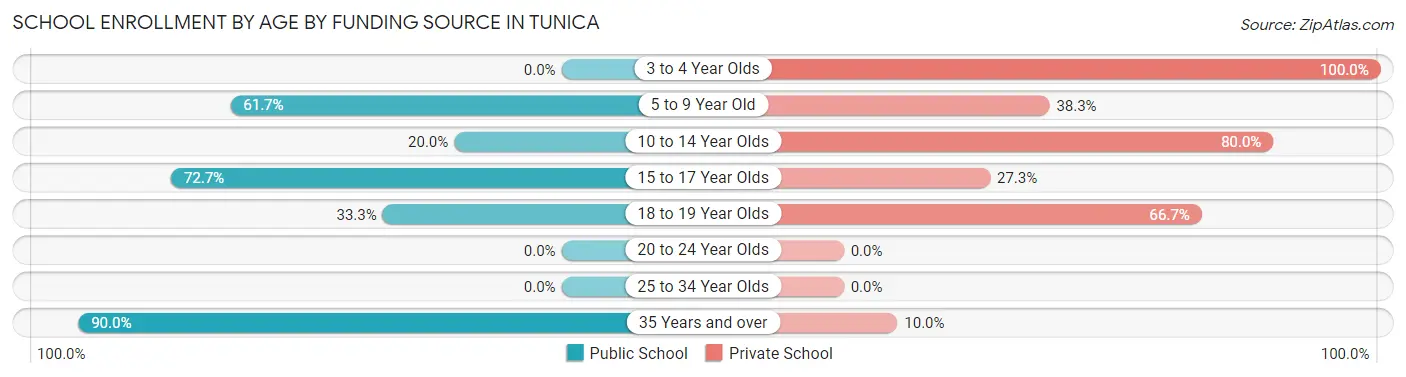
| Age Bracket | Public School | Private School |
| 3 to 4 Year Olds | 0 (0.0%) | 5 (100.0%) |
| 5 to 9 Year Old | 37 (61.7%) | 23 (38.3%) |
| 10 to 14 Year Olds | 9 (20.0%) | 36 (80.0%) |
| 15 to 17 Year Olds | 32 (72.7%) | 12 (27.3%) |
| 18 to 19 Year Olds | 18 (33.3%) | 36 (66.7%) |
| 20 to 24 Year Olds | 0 (0.0%) | 0 (0.0%) |
| 25 to 34 Year Olds | 0 (0.0%) | 0 (0.0%) |
| 35 Years and over | 9 (90.0%) | 1 (10.0%) |
| Total | 105 (48.2%) | 113 (51.8%) |
Educational Attainment by Field of Study in Tunica
Education (50 | 18.9%), business (41 | 15.5%), science & technology (35 | 13.2%), literature & languages (31 | 11.7%), and bio, nature & agricultural (30 | 11.3%) are the most common fields of study among 265 individuals in Tunica who have obtained a bachelor's degree or higher.
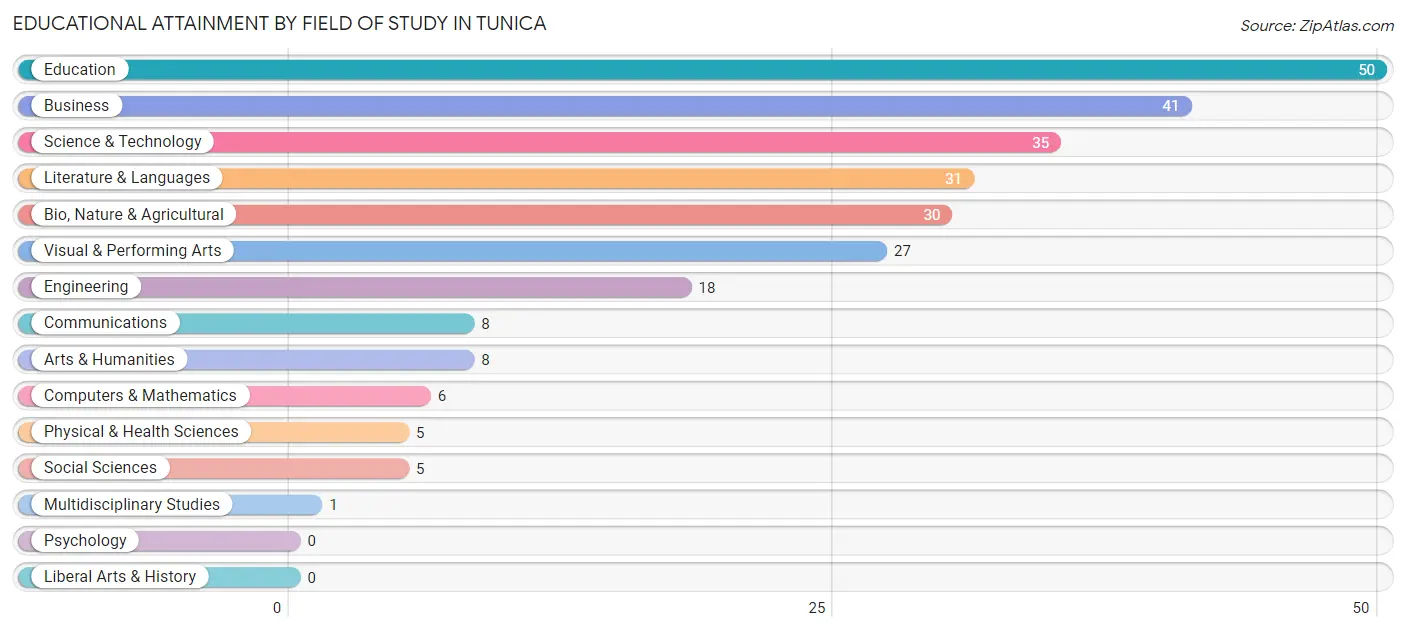
| Field of Study | # Graduates | % Graduates |
| Computers & Mathematics | 6 | 2.3% |
| Bio, Nature & Agricultural | 30 | 11.3% |
| Physical & Health Sciences | 5 | 1.9% |
| Psychology | 0 | 0.0% |
| Social Sciences | 5 | 1.9% |
| Engineering | 18 | 6.8% |
| Multidisciplinary Studies | 1 | 0.4% |
| Science & Technology | 35 | 13.2% |
| Business | 41 | 15.5% |
| Education | 50 | 18.9% |
| Literature & Languages | 31 | 11.7% |
| Liberal Arts & History | 0 | 0.0% |
| Visual & Performing Arts | 27 | 10.2% |
| Communications | 8 | 3.0% |
| Arts & Humanities | 8 | 3.0% |
| Total | 265 | 100.0% |
Transportation & Commute in Tunica
Vehicle Availability by Sex in Tunica
The most prevalent vehicle ownership categories in Tunica are males with 2 vehicles (127, accounting for 55.2%) and females with 2 vehicles (104, making up 55.7%).
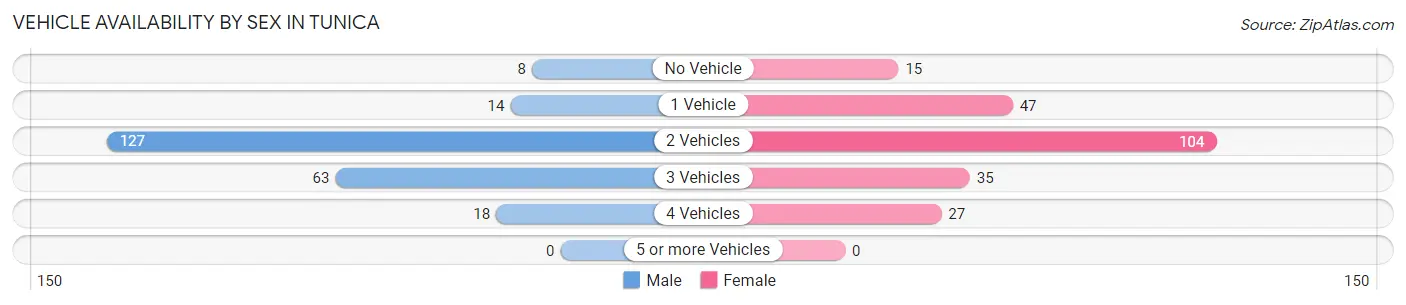
| Vehicles Available | Male | Female |
| No Vehicle | 8 (3.5%) | 15 (6.6%) |
| 1 Vehicle | 14 (6.1%) | 47 (20.6%) |
| 2 Vehicles | 127 (55.2%) | 104 (45.6%) |
| 3 Vehicles | 63 (27.4%) | 35 (15.3%) |
| 4 Vehicles | 18 (7.8%) | 27 (11.8%) |
| 5 or more Vehicles | 0 (0.0%) | 0 (0.0%) |
| Total | 230 (100.0%) | 228 (100.0%) |
Commute Time in Tunica
The most frequently occuring commute durations in Tunica are 5 to 9 minutes (120 commuters, 26.6%), less than 5 minutes (66 commuters, 14.6%), and 10 to 14 minutes (52 commuters, 11.5%).
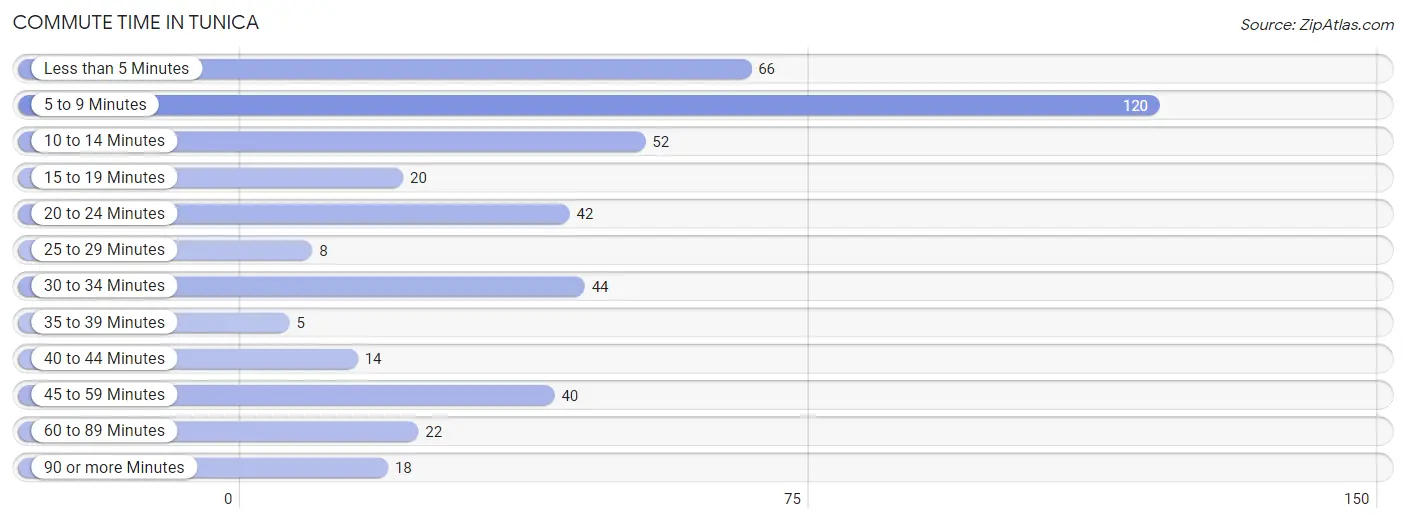
| Commute Time | # Commuters | % Commuters |
| Less than 5 Minutes | 66 | 14.6% |
| 5 to 9 Minutes | 120 | 26.6% |
| 10 to 14 Minutes | 52 | 11.5% |
| 15 to 19 Minutes | 20 | 4.4% |
| 20 to 24 Minutes | 42 | 9.3% |
| 25 to 29 Minutes | 8 | 1.8% |
| 30 to 34 Minutes | 44 | 9.8% |
| 35 to 39 Minutes | 5 | 1.1% |
| 40 to 44 Minutes | 14 | 3.1% |
| 45 to 59 Minutes | 40 | 8.9% |
| 60 to 89 Minutes | 22 | 4.9% |
| 90 or more Minutes | 18 | 4.0% |
Commute Time by Sex in Tunica
The most common commute times in Tunica are 5 to 9 minutes (47 commuters, 21.0%) for males and 5 to 9 minutes (73 commuters, 32.2%) for females.
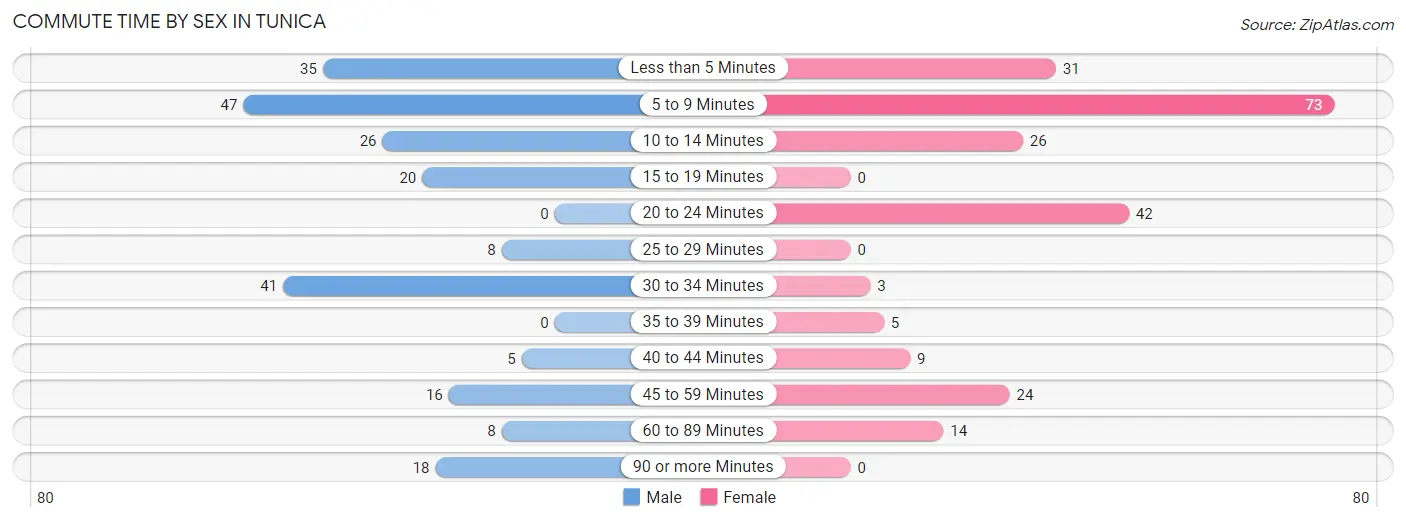
| Commute Time | Male | Female |
| Less than 5 Minutes | 35 (15.6%) | 31 (13.7%) |
| 5 to 9 Minutes | 47 (21.0%) | 73 (32.2%) |
| 10 to 14 Minutes | 26 (11.6%) | 26 (11.5%) |
| 15 to 19 Minutes | 20 (8.9%) | 0 (0.0%) |
| 20 to 24 Minutes | 0 (0.0%) | 42 (18.5%) |
| 25 to 29 Minutes | 8 (3.6%) | 0 (0.0%) |
| 30 to 34 Minutes | 41 (18.3%) | 3 (1.3%) |
| 35 to 39 Minutes | 0 (0.0%) | 5 (2.2%) |
| 40 to 44 Minutes | 5 (2.2%) | 9 (4.0%) |
| 45 to 59 Minutes | 16 (7.1%) | 24 (10.6%) |
| 60 to 89 Minutes | 8 (3.6%) | 14 (6.2%) |
| 90 or more Minutes | 18 (8.0%) | 0 (0.0%) |
Time of Departure to Work by Sex in Tunica
The most frequent times of departure to work in Tunica are 6:00 AM to 6:29 AM (82, 36.6%) for males and 7:30 AM to 7:59 AM (51, 22.5%) for females.
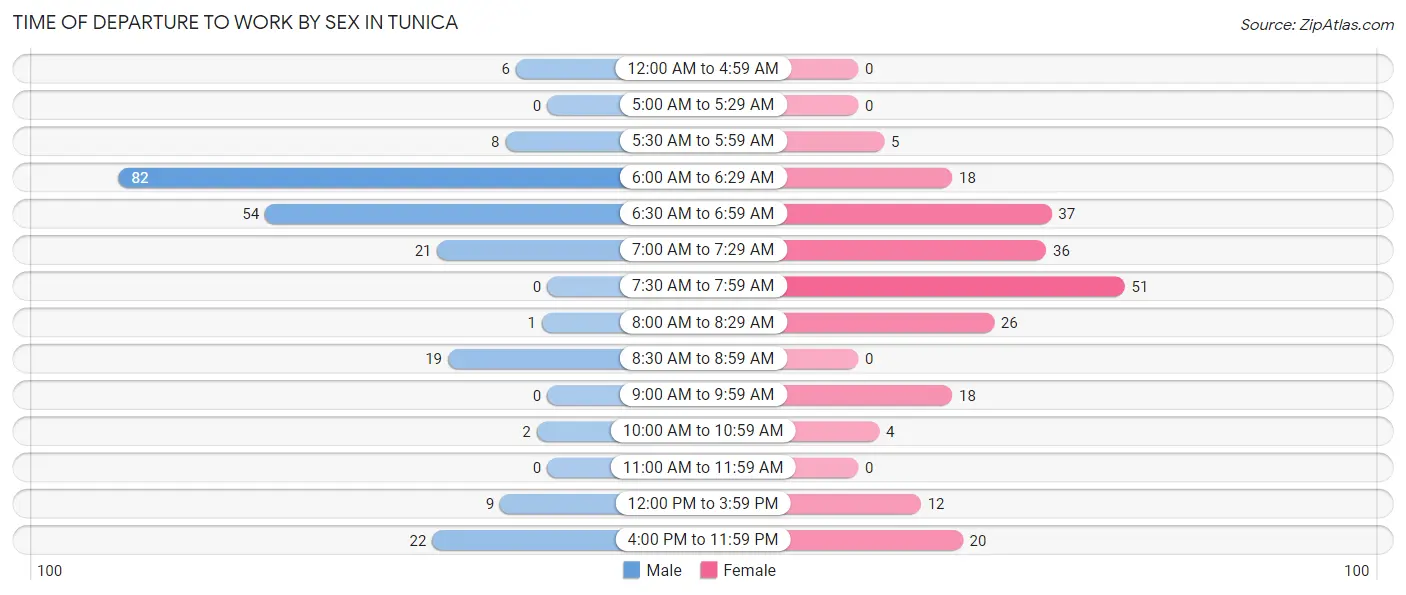
| Time of Departure | Male | Female |
| 12:00 AM to 4:59 AM | 6 (2.7%) | 0 (0.0%) |
| 5:00 AM to 5:29 AM | 0 (0.0%) | 0 (0.0%) |
| 5:30 AM to 5:59 AM | 8 (3.6%) | 5 (2.2%) |
| 6:00 AM to 6:29 AM | 82 (36.6%) | 18 (7.9%) |
| 6:30 AM to 6:59 AM | 54 (24.1%) | 37 (16.3%) |
| 7:00 AM to 7:29 AM | 21 (9.4%) | 36 (15.9%) |
| 7:30 AM to 7:59 AM | 0 (0.0%) | 51 (22.5%) |
| 8:00 AM to 8:29 AM | 1 (0.4%) | 26 (11.5%) |
| 8:30 AM to 8:59 AM | 19 (8.5%) | 0 (0.0%) |
| 9:00 AM to 9:59 AM | 0 (0.0%) | 18 (7.9%) |
| 10:00 AM to 10:59 AM | 2 (0.9%) | 4 (1.8%) |
| 11:00 AM to 11:59 AM | 0 (0.0%) | 0 (0.0%) |
| 12:00 PM to 3:59 PM | 9 (4.0%) | 12 (5.3%) |
| 4:00 PM to 11:59 PM | 22 (9.8%) | 20 (8.8%) |
| Total | 224 (100.0%) | 227 (100.0%) |
Housing Occupancy in Tunica
Occupancy by Ownership in Tunica
Of the total 521 dwellings in Tunica, owner-occupied units account for 257 (49.3%), while renter-occupied units make up 264 (50.7%).
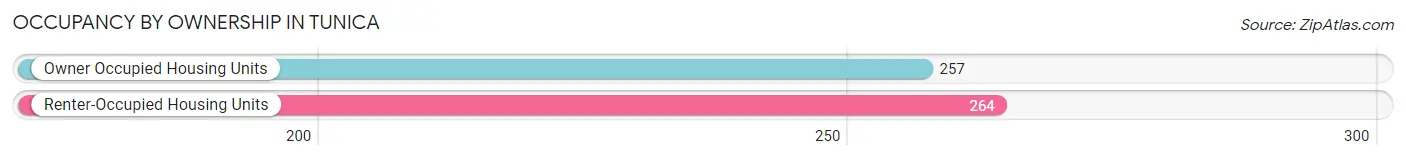
| Occupancy | # Housing Units | % Housing Units |
| Owner Occupied Housing Units | 257 | 49.3% |
| Renter-Occupied Housing Units | 264 | 50.7% |
| Total Occupied Housing Units | 521 | 100.0% |
Occupancy by Household Size in Tunica
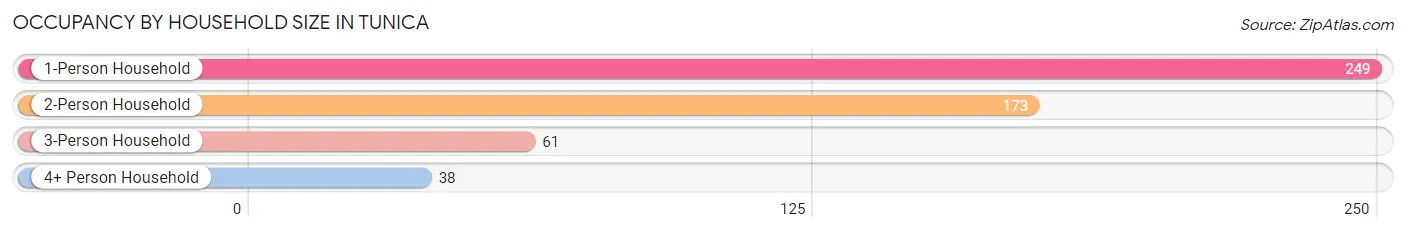
| Household Size | # Housing Units | % Housing Units |
| 1-Person Household | 249 | 47.8% |
| 2-Person Household | 173 | 33.2% |
| 3-Person Household | 61 | 11.7% |
| 4+ Person Household | 38 | 7.3% |
| Total Housing Units | 521 | 100.0% |
Occupancy by Ownership by Household Size in Tunica
| Household Size | Owner-occupied | Renter-occupied |
| 1-Person Household | 59 (23.7%) | 190 (76.3%) |
| 2-Person Household | 142 (82.1%) | 31 (17.9%) |
| 3-Person Household | 46 (75.4%) | 15 (24.6%) |
| 4+ Person Household | 10 (26.3%) | 28 (73.7%) |
| Total Housing Units | 257 (49.3%) | 264 (50.7%) |
Occupancy by Educational Attainment in Tunica
| Household Size | Owner-occupied | Renter-occupied |
| Less than High School | 11 (13.9%) | 68 (86.1%) |
| High School Diploma | 31 (29.2%) | 75 (70.8%) |
| College/Associate Degree | 77 (43.8%) | 99 (56.2%) |
| Bachelor's Degree or higher | 138 (86.3%) | 22 (13.8%) |
Occupancy by Age of Householder in Tunica
| Age Bracket | # Households | % Households |
| Under 35 Years | 5 | 1.0% |
| 35 to 44 Years | 64 | 12.3% |
| 45 to 54 Years | 173 | 33.2% |
| 55 to 64 Years | 80 | 15.4% |
| 65 to 74 Years | 128 | 24.6% |
| 75 to 84 Years | 71 | 13.6% |
| 85 Years and Over | 0 | 0.0% |
| Total | 521 | 100.0% |
Housing Finances in Tunica
Median Income by Occupancy in Tunica
| Occupancy Type | # Households | Median Income |
| Owner-Occupied | 257 (49.3%) | $71,793 |
| Renter-Occupied | 264 (50.7%) | $23,750 |
| Average | 521 (100.0%) | $55,865 |
Occupancy by Householder Income Bracket in Tunica
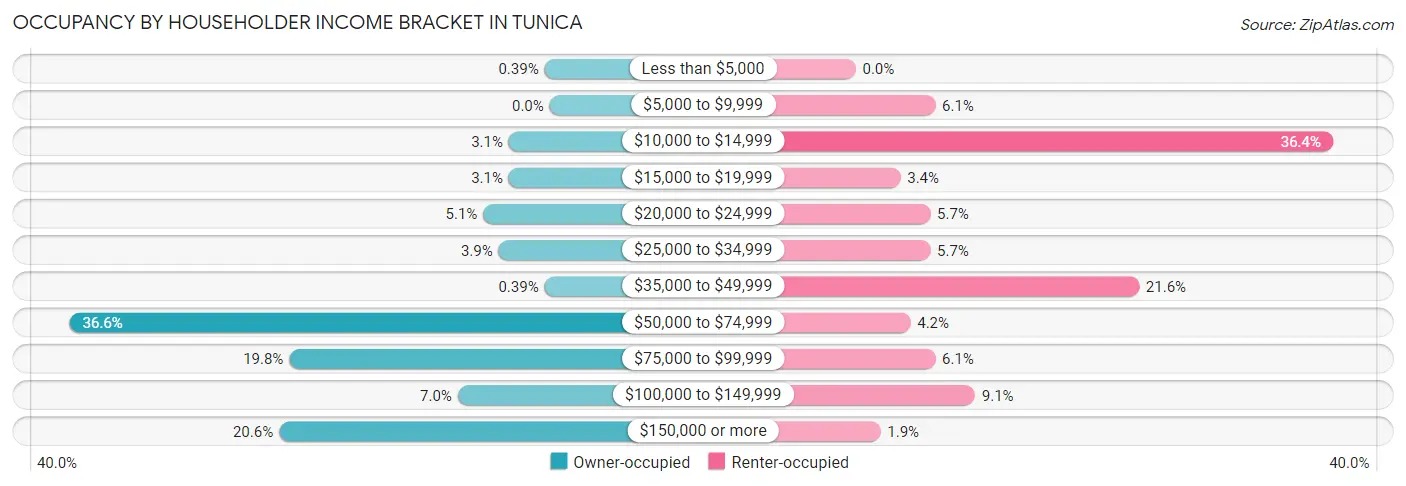
| Income Bracket | Owner-occupied | Renter-occupied |
| Less than $5,000 | 1 (0.4%) | 0 (0.0%) |
| $5,000 to $9,999 | 0 (0.0%) | 16 (6.1%) |
| $10,000 to $14,999 | 8 (3.1%) | 96 (36.4%) |
| $15,000 to $19,999 | 8 (3.1%) | 9 (3.4%) |
| $20,000 to $24,999 | 13 (5.1%) | 15 (5.7%) |
| $25,000 to $34,999 | 10 (3.9%) | 15 (5.7%) |
| $35,000 to $49,999 | 1 (0.4%) | 57 (21.6%) |
| $50,000 to $74,999 | 94 (36.6%) | 11 (4.2%) |
| $75,000 to $99,999 | 51 (19.8%) | 16 (6.1%) |
| $100,000 to $149,999 | 18 (7.0%) | 24 (9.1%) |
| $150,000 or more | 53 (20.6%) | 5 (1.9%) |
| Total | 257 (100.0%) | 264 (100.0%) |
Monthly Housing Cost Tiers in Tunica
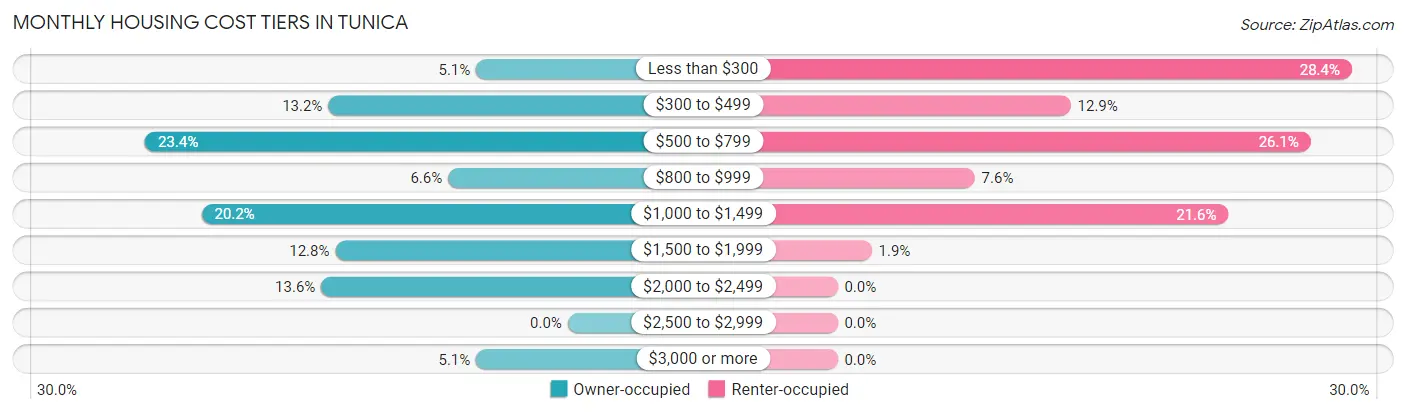
| Monthly Cost | Owner-occupied | Renter-occupied |
| Less than $300 | 13 (5.1%) | 75 (28.4%) |
| $300 to $499 | 34 (13.2%) | 34 (12.9%) |
| $500 to $799 | 60 (23.4%) | 69 (26.1%) |
| $800 to $999 | 17 (6.6%) | 20 (7.6%) |
| $1,000 to $1,499 | 52 (20.2%) | 57 (21.6%) |
| $1,500 to $1,999 | 33 (12.8%) | 5 (1.9%) |
| $2,000 to $2,499 | 35 (13.6%) | 0 (0.0%) |
| $2,500 to $2,999 | 0 (0.0%) | 0 (0.0%) |
| $3,000 or more | 13 (5.1%) | 0 (0.0%) |
| Total | 257 (100.0%) | 264 (100.0%) |
Physical Housing Characteristics in Tunica
Housing Structures in Tunica
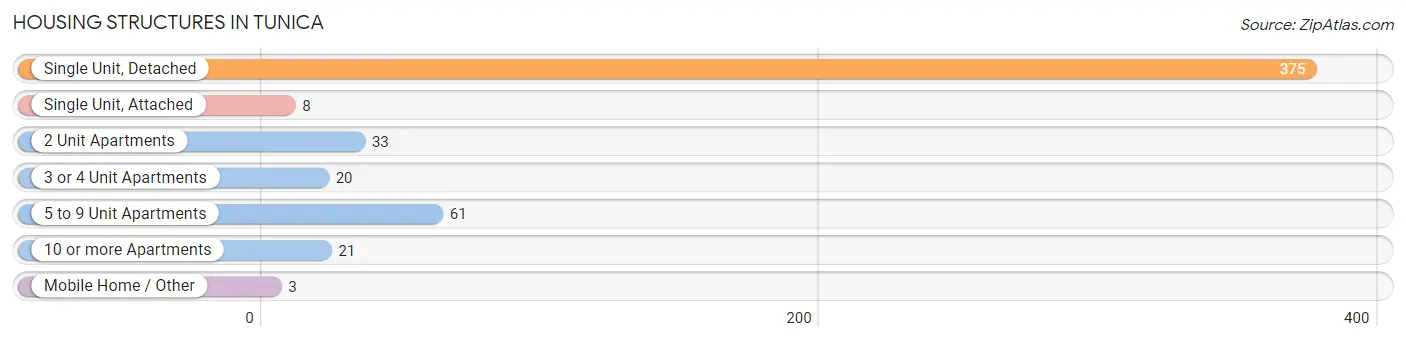
| Structure Type | # Housing Units | % Housing Units |
| Single Unit, Detached | 375 | 72.0% |
| Single Unit, Attached | 8 | 1.5% |
| 2 Unit Apartments | 33 | 6.3% |
| 3 or 4 Unit Apartments | 20 | 3.8% |
| 5 to 9 Unit Apartments | 61 | 11.7% |
| 10 or more Apartments | 21 | 4.0% |
| Mobile Home / Other | 3 | 0.6% |
| Total | 521 | 100.0% |
Housing Structures by Occupancy in Tunica
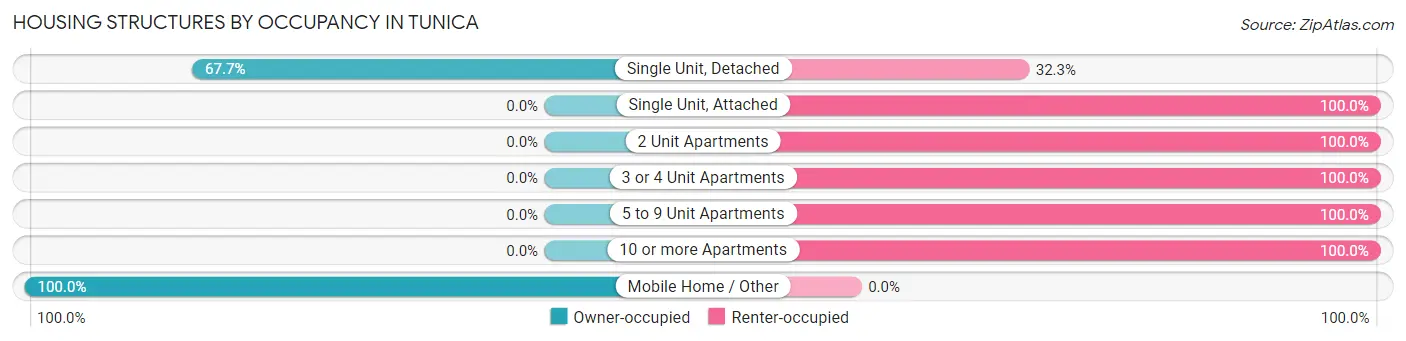
| Structure Type | Owner-occupied | Renter-occupied |
| Single Unit, Detached | 254 (67.7%) | 121 (32.3%) |
| Single Unit, Attached | 0 (0.0%) | 8 (100.0%) |
| 2 Unit Apartments | 0 (0.0%) | 33 (100.0%) |
| 3 or 4 Unit Apartments | 0 (0.0%) | 20 (100.0%) |
| 5 to 9 Unit Apartments | 0 (0.0%) | 61 (100.0%) |
| 10 or more Apartments | 0 (0.0%) | 21 (100.0%) |
| Mobile Home / Other | 3 (100.0%) | 0 (0.0%) |
| Total | 257 (49.3%) | 264 (50.7%) |
Housing Structures by Number of Rooms in Tunica
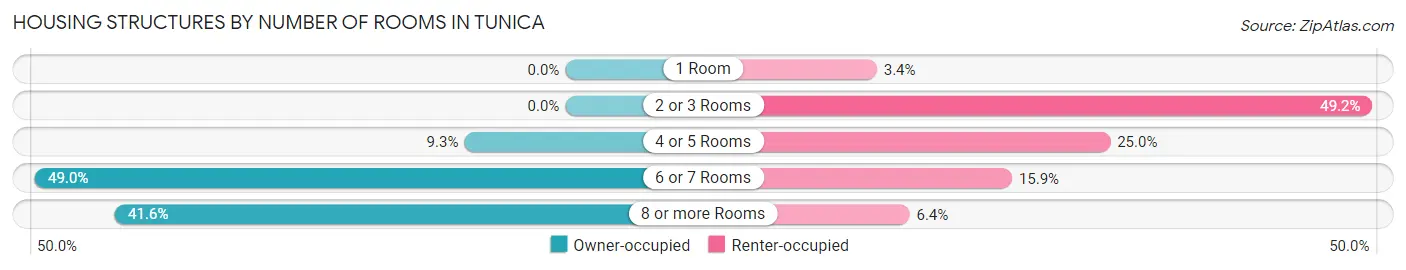
| Number of Rooms | Owner-occupied | Renter-occupied |
| 1 Room | 0 (0.0%) | 9 (3.4%) |
| 2 or 3 Rooms | 0 (0.0%) | 130 (49.2%) |
| 4 or 5 Rooms | 24 (9.3%) | 66 (25.0%) |
| 6 or 7 Rooms | 126 (49.0%) | 42 (15.9%) |
| 8 or more Rooms | 107 (41.6%) | 17 (6.4%) |
| Total | 257 (100.0%) | 264 (100.0%) |
Housing Structure by Heating Type in Tunica
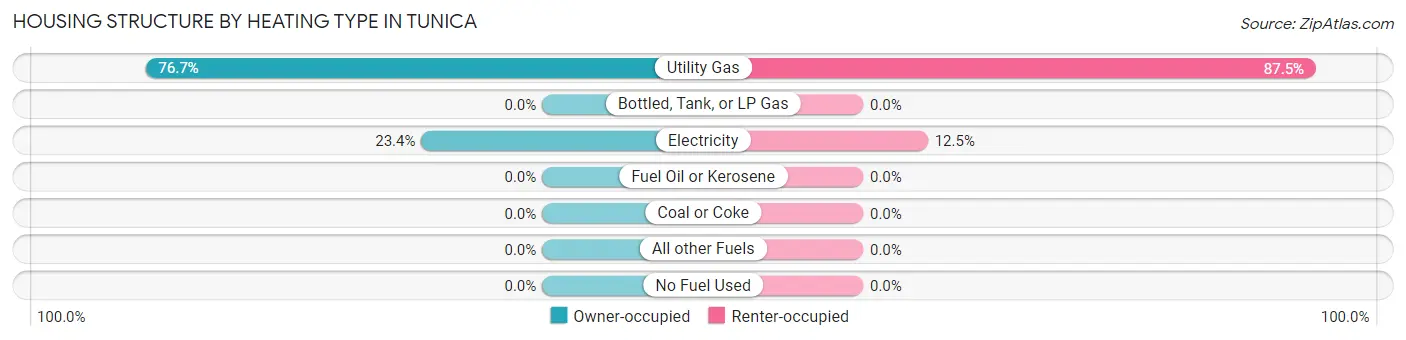
| Heating Type | Owner-occupied | Renter-occupied |
| Utility Gas | 197 (76.6%) | 231 (87.5%) |
| Bottled, Tank, or LP Gas | 0 (0.0%) | 0 (0.0%) |
| Electricity | 60 (23.4%) | 33 (12.5%) |
| Fuel Oil or Kerosene | 0 (0.0%) | 0 (0.0%) |
| Coal or Coke | 0 (0.0%) | 0 (0.0%) |
| All other Fuels | 0 (0.0%) | 0 (0.0%) |
| No Fuel Used | 0 (0.0%) | 0 (0.0%) |
| Total | 257 (100.0%) | 264 (100.0%) |
Household Vehicle Usage in Tunica
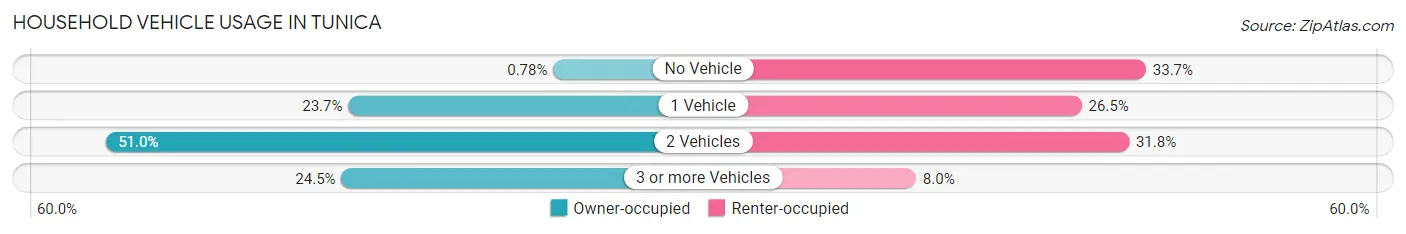
| Vehicles per Household | Owner-occupied | Renter-occupied |
| No Vehicle | 2 (0.8%) | 89 (33.7%) |
| 1 Vehicle | 61 (23.7%) | 70 (26.5%) |
| 2 Vehicles | 131 (51.0%) | 84 (31.8%) |
| 3 or more Vehicles | 63 (24.5%) | 21 (8.0%) |
| Total | 257 (100.0%) | 264 (100.0%) |
Real Estate & Mortgages in Tunica
Real Estate and Mortgage Overview in Tunica
| Characteristic | Without Mortgage | With Mortgage |
| Housing Units | 101 | 156 |
| Median Property Value | $185,300 | $184,100 |
| Median Household Income | $64,083 | $31 |
| Monthly Housing Costs | $527 | $13 |
| Real Estate Taxes | $1,500 | $28 |
Property Value by Mortgage Status in Tunica
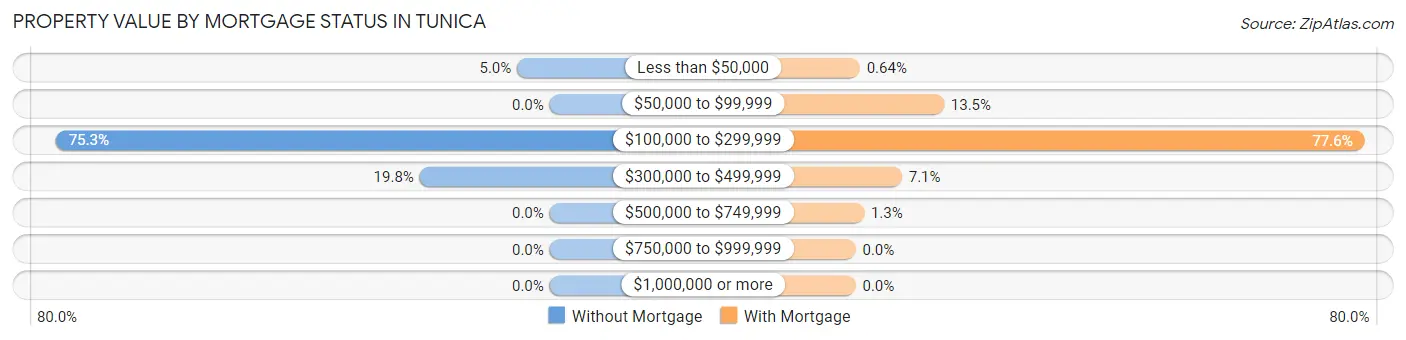
| Property Value | Without Mortgage | With Mortgage |
| Less than $50,000 | 5 (5.0%) | 1 (0.6%) |
| $50,000 to $99,999 | 0 (0.0%) | 21 (13.5%) |
| $100,000 to $299,999 | 76 (75.2%) | 121 (77.6%) |
| $300,000 to $499,999 | 20 (19.8%) | 11 (7.0%) |
| $500,000 to $749,999 | 0 (0.0%) | 2 (1.3%) |
| $750,000 to $999,999 | 0 (0.0%) | 0 (0.0%) |
| $1,000,000 or more | 0 (0.0%) | 0 (0.0%) |
| Total | 101 (100.0%) | 156 (100.0%) |
Household Income by Mortgage Status in Tunica
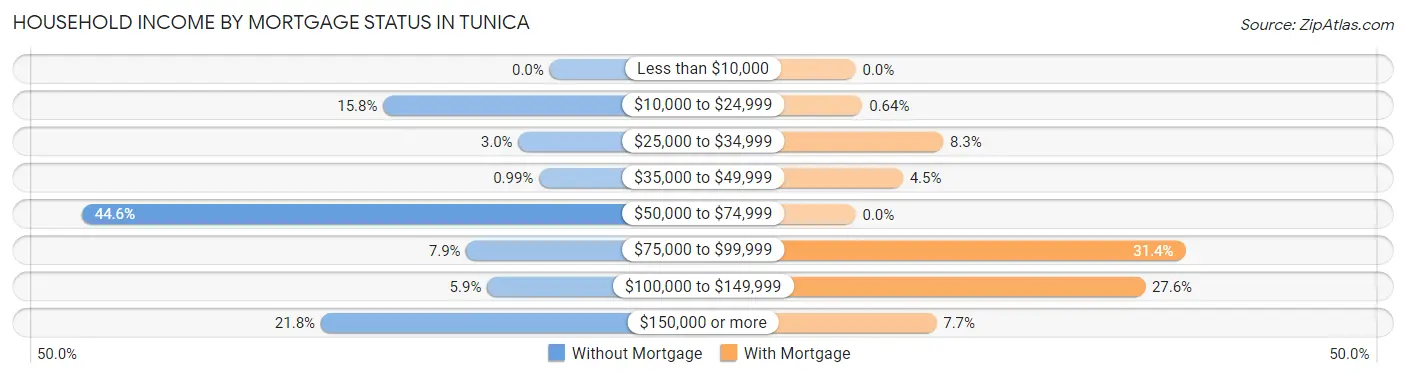
| Household Income | Without Mortgage | With Mortgage |
| Less than $10,000 | 0 (0.0%) | 0 (0.0%) |
| $10,000 to $24,999 | 16 (15.8%) | 1 (0.6%) |
| $25,000 to $34,999 | 3 (3.0%) | 13 (8.3%) |
| $35,000 to $49,999 | 1 (1.0%) | 7 (4.5%) |
| $50,000 to $74,999 | 45 (44.6%) | 0 (0.0%) |
| $75,000 to $99,999 | 8 (7.9%) | 49 (31.4%) |
| $100,000 to $149,999 | 6 (5.9%) | 43 (27.6%) |
| $150,000 or more | 22 (21.8%) | 12 (7.7%) |
| Total | 101 (100.0%) | 156 (100.0%) |
Property Value to Household Income Ratio in Tunica
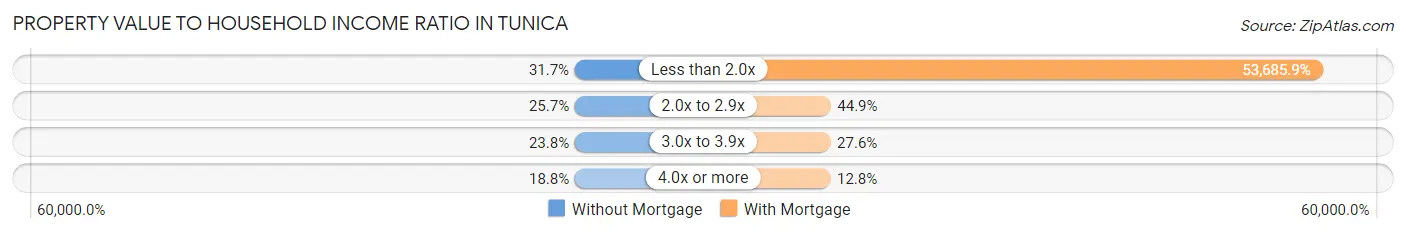
| Value-to-Income Ratio | Without Mortgage | With Mortgage |
| Less than 2.0x | 32 (31.7%) | 83,750 (53,685.9%) |
| 2.0x to 2.9x | 26 (25.7%) | 70 (44.9%) |
| 3.0x to 3.9x | 24 (23.8%) | 43 (27.6%) |
| 4.0x or more | 19 (18.8%) | 20 (12.8%) |
| Total | 101 (100.0%) | 156 (100.0%) |
Real Estate Taxes by Mortgage Status in Tunica
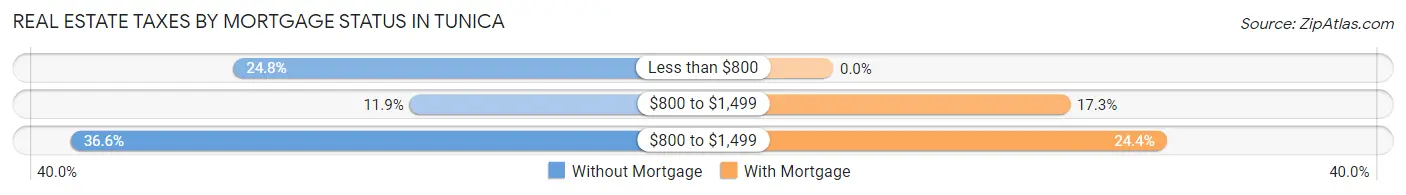
| Property Taxes | Without Mortgage | With Mortgage |
| Less than $800 | 25 (24.7%) | 0 (0.0%) |
| $800 to $1,499 | 12 (11.9%) | 27 (17.3%) |
| $800 to $1,499 | 37 (36.6%) | 38 (24.4%) |
| Total | 101 (100.0%) | 156 (100.0%) |
Health & Disability in Tunica
Health Insurance Coverage by Age in Tunica
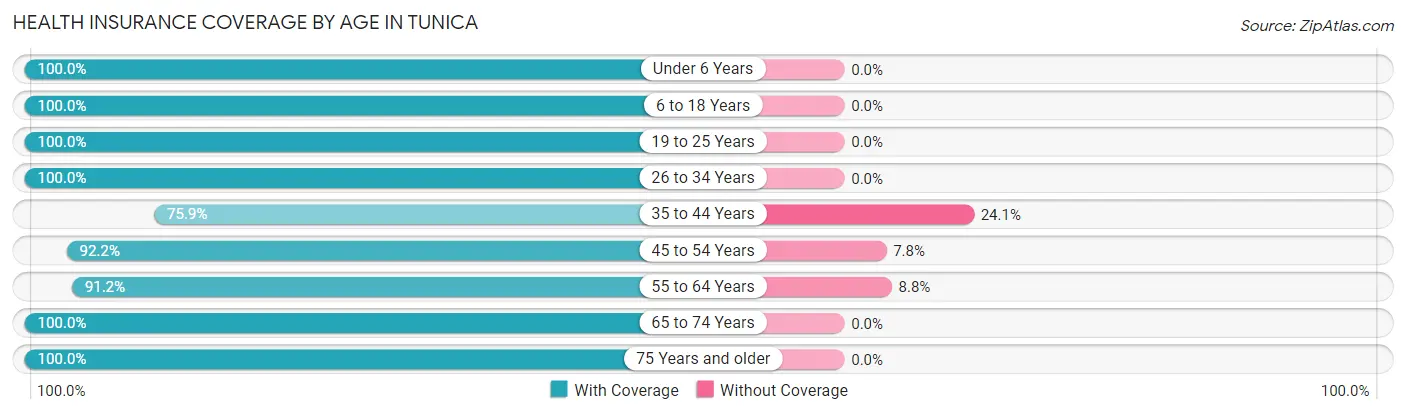
| Age Bracket | With Coverage | Without Coverage |
| Under 6 Years | 39 (100.0%) | 0 (0.0%) |
| 6 to 18 Years | 169 (100.0%) | 0 (0.0%) |
| 19 to 25 Years | 41 (100.0%) | 0 (0.0%) |
| 26 to 34 Years | 21 (100.0%) | 0 (0.0%) |
| 35 to 44 Years | 88 (75.9%) | 28 (24.1%) |
| 45 to 54 Years | 224 (92.2%) | 19 (7.8%) |
| 55 to 64 Years | 124 (91.2%) | 12 (8.8%) |
| 65 to 74 Years | 189 (100.0%) | 0 (0.0%) |
| 75 Years and older | 108 (100.0%) | 0 (0.0%) |
| Total | 1,003 (94.4%) | 59 (5.6%) |
Health Insurance Coverage by Citizenship Status in Tunica
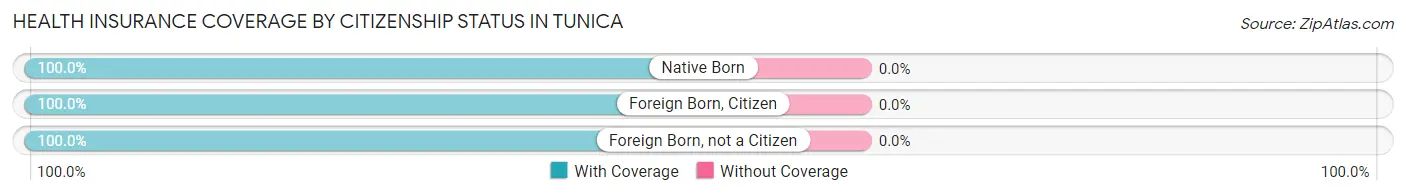
| Citizenship Status | With Coverage | Without Coverage |
| Native Born | 39 (100.0%) | 0 (0.0%) |
| Foreign Born, Citizen | 169 (100.0%) | 0 (0.0%) |
| Foreign Born, not a Citizen | 41 (100.0%) | 0 (0.0%) |
Health Insurance Coverage by Household Income in Tunica
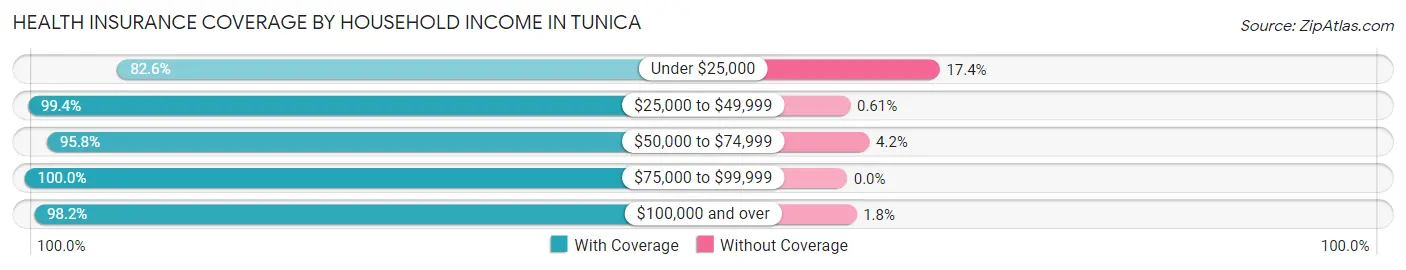
| Household Income | With Coverage | Without Coverage |
| Under $25,000 | 200 (82.6%) | 42 (17.4%) |
| $25,000 to $49,999 | 163 (99.4%) | 1 (0.6%) |
| $50,000 to $74,999 | 275 (95.8%) | 12 (4.2%) |
| $75,000 to $99,999 | 142 (100.0%) | 0 (0.0%) |
| $100,000 and over | 223 (98.2%) | 4 (1.8%) |
Public vs Private Health Insurance Coverage by Age in Tunica
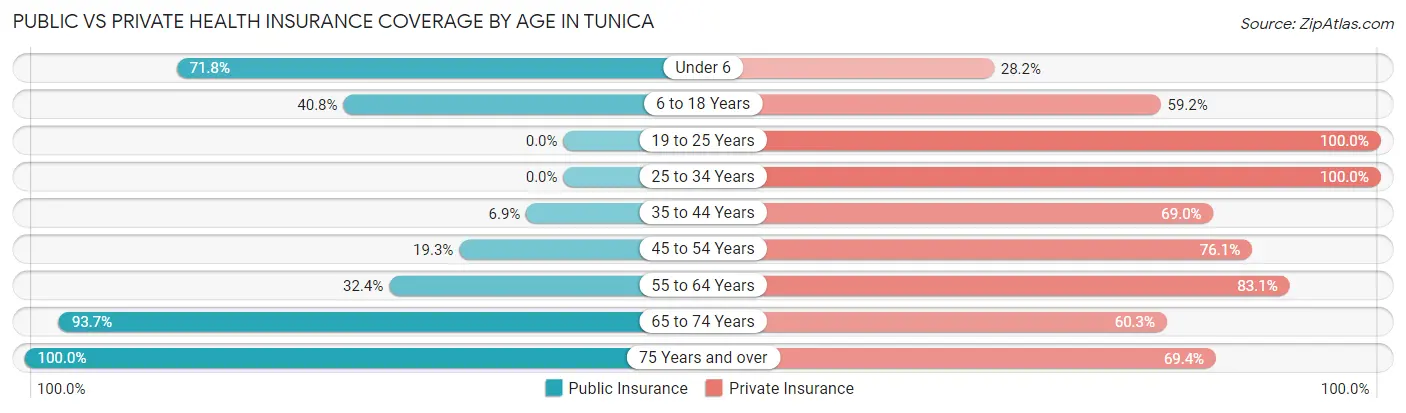
| Age Bracket | Public Insurance | Private Insurance |
| Under 6 | 28 (71.8%) | 11 (28.2%) |
| 6 to 18 Years | 69 (40.8%) | 100 (59.2%) |
| 19 to 25 Years | 0 (0.0%) | 41 (100.0%) |
| 25 to 34 Years | 0 (0.0%) | 21 (100.0%) |
| 35 to 44 Years | 8 (6.9%) | 80 (69.0%) |
| 45 to 54 Years | 47 (19.3%) | 185 (76.1%) |
| 55 to 64 Years | 44 (32.4%) | 113 (83.1%) |
| 65 to 74 Years | 177 (93.6%) | 114 (60.3%) |
| 75 Years and over | 108 (100.0%) | 75 (69.4%) |
| Total | 481 (45.3%) | 740 (69.7%) |
Disability Status by Sex by Age in Tunica
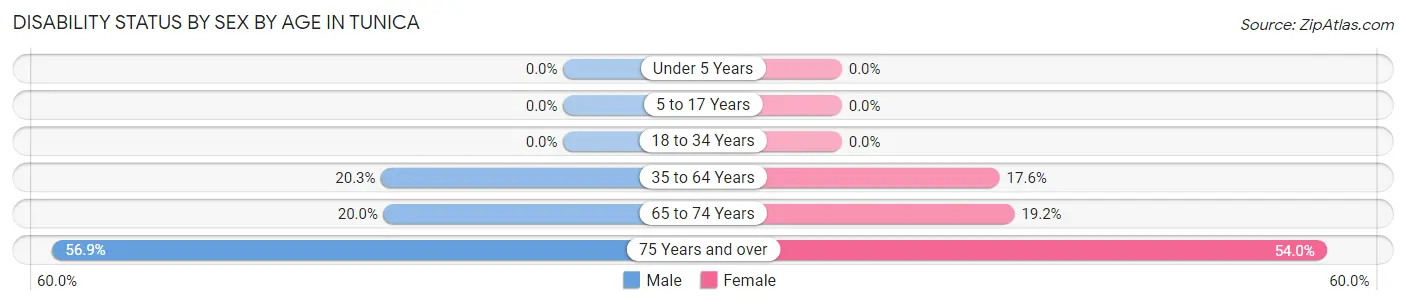
| Age Bracket | Male | Female |
| Under 5 Years | 0 (0.0%) | 0 (0.0%) |
| 5 to 17 Years | 0 (0.0%) | 0 (0.0%) |
| 18 to 34 Years | 0 (0.0%) | 0 (0.0%) |
| 35 to 64 Years | 45 (20.3%) | 48 (17.6%) |
| 65 to 74 Years | 17 (20.0%) | 20 (19.2%) |
| 75 Years and over | 33 (56.9%) | 27 (54.0%) |
Disability Class by Sex by Age in Tunica
Disability Class: Hearing Difficulty
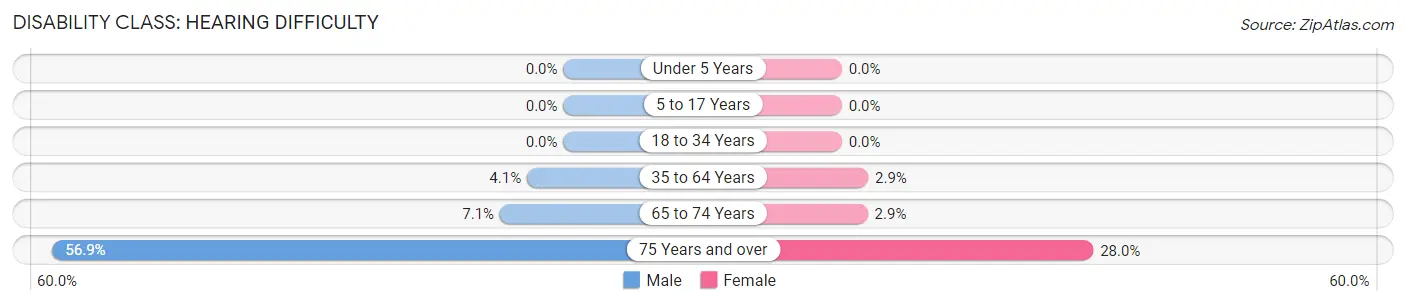
| Age Bracket | Male | Female |
| Under 5 Years | 0 (0.0%) | 0 (0.0%) |
| 5 to 17 Years | 0 (0.0%) | 0 (0.0%) |
| 18 to 34 Years | 0 (0.0%) | 0 (0.0%) |
| 35 to 64 Years | 9 (4.1%) | 8 (2.9%) |
| 65 to 74 Years | 6 (7.1%) | 3 (2.9%) |
| 75 Years and over | 33 (56.9%) | 14 (28.0%) |
Disability Class: Vision Difficulty
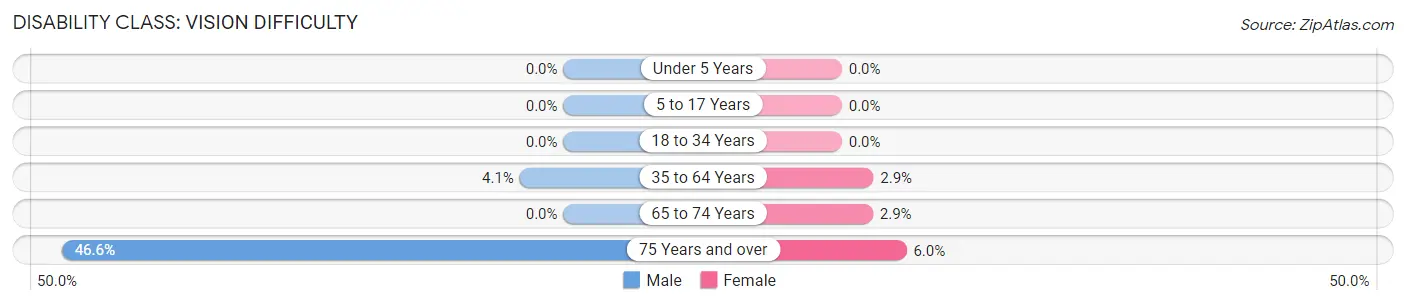
| Age Bracket | Male | Female |
| Under 5 Years | 0 (0.0%) | 0 (0.0%) |
| 5 to 17 Years | 0 (0.0%) | 0 (0.0%) |
| 18 to 34 Years | 0 (0.0%) | 0 (0.0%) |
| 35 to 64 Years | 9 (4.1%) | 8 (2.9%) |
| 65 to 74 Years | 0 (0.0%) | 3 (2.9%) |
| 75 Years and over | 27 (46.6%) | 3 (6.0%) |
Disability Class: Cognitive Difficulty
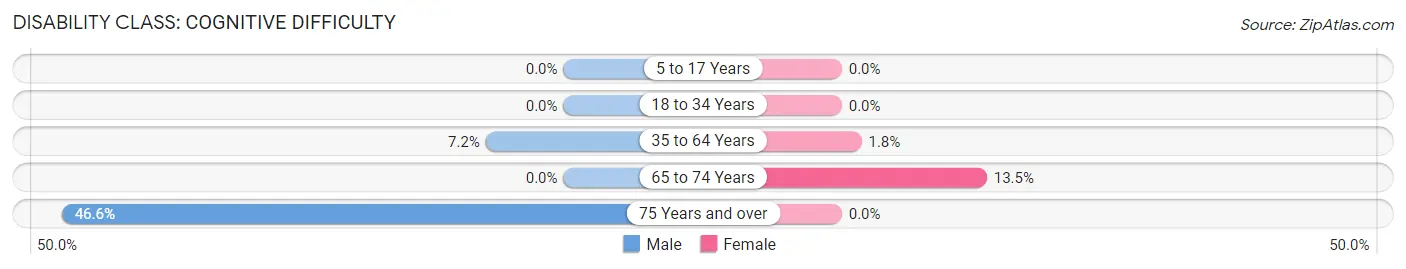
| Age Bracket | Male | Female |
| 5 to 17 Years | 0 (0.0%) | 0 (0.0%) |
| 18 to 34 Years | 0 (0.0%) | 0 (0.0%) |
| 35 to 64 Years | 16 (7.2%) | 5 (1.8%) |
| 65 to 74 Years | 0 (0.0%) | 14 (13.5%) |
| 75 Years and over | 27 (46.6%) | 0 (0.0%) |
Disability Class: Ambulatory Difficulty
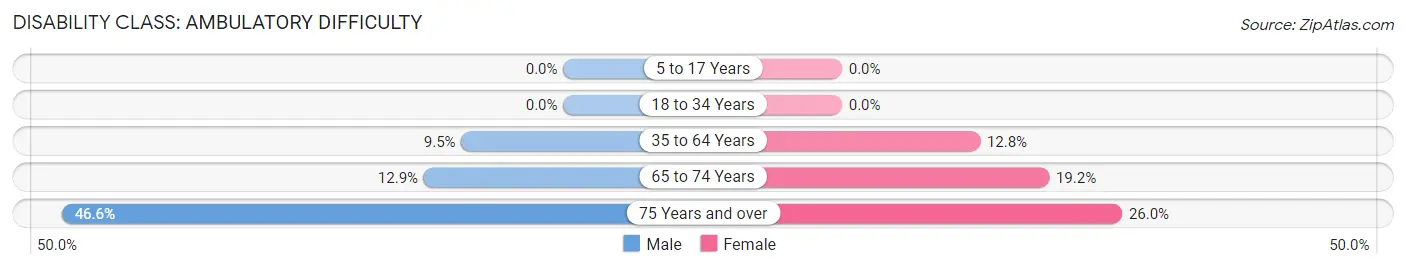
| Age Bracket | Male | Female |
| 5 to 17 Years | 0 (0.0%) | 0 (0.0%) |
| 18 to 34 Years | 0 (0.0%) | 0 (0.0%) |
| 35 to 64 Years | 21 (9.5%) | 35 (12.8%) |
| 65 to 74 Years | 11 (12.9%) | 20 (19.2%) |
| 75 Years and over | 27 (46.6%) | 13 (26.0%) |
Disability Class: Self-Care Difficulty
| Age Bracket | Male | Female |
| 5 to 17 Years | 0 (0.0%) | 0 (0.0%) |
| 18 to 34 Years | 0 (0.0%) | 0 (0.0%) |
| 35 to 64 Years | 7 (3.2%) | 6 (2.2%) |
| 65 to 74 Years | 0 (0.0%) | 3 (2.9%) |
| 75 Years and over | 27 (46.6%) | 0 (0.0%) |
Technology Access in Tunica
Computing Device Access in Tunica
| Device Type | # Households | % Households |
| Desktop or Laptop | 260 | 49.9% |
| Smartphone | 370 | 71.0% |
| Tablet | 244 | 46.8% |
| No Computing Device | 140 | 26.9% |
| Total | 521 | 100.0% |
Internet Access in Tunica
| Internet Type | # Households | % Households |
| Dial-Up Internet | 0 | 0.0% |
| Broadband Home | 241 | 46.3% |
| Cellular Data Only | 117 | 22.5% |
| Satellite Internet | 3 | 0.6% |
| No Internet | 163 | 31.3% |
| Total | 521 | 100.0% |
Tunica Summary
Tunica, Mississippi is a small town located in the northwest corner of the state, just south of Memphis, Tennessee. It is part of the larger Tunica County, which is home to a population of about 10,000 people. The town of Tunica was founded in 1836 and has a rich history of cotton production, gambling, and blues music.
Geography
Tunica is located in the northwest corner of Mississippi, just south of Memphis, Tennessee. It is part of the larger Tunica County, which is home to a population of about 10,000 people. The town of Tunica is situated on the banks of the Mississippi River, and is surrounded by the Tunica Hills. The area is known for its rolling hills and lush vegetation, and is home to a variety of wildlife.
Economy
Tunica has a diverse economy, with a mix of agriculture, manufacturing, and tourism. Agriculture is the mainstay of the local economy, with cotton, soybeans, and corn being the primary crops. Manufacturing is also an important part of the local economy, with several factories located in the area. Tourism is also a major contributor to the local economy, with the town being home to several casinos and resorts.
Demographics
As of the 2010 census, the population of Tunica was 8,521. The racial makeup of the town was 63.3% African American, 33.2% White, 0.3% Native American, 0.2% Asian, 0.1% Pacific Islander, and 2.9% from other races. The median household income was $25,945, and the median family income was $31,945.
History
Tunica was founded in 1836 by a group of settlers from Tennessee. The town was named after the Tunica Indians, who had lived in the area for centuries. The town quickly grew, and by the late 19th century, it was a thriving cotton-producing center. In the early 20th century, the town was home to a thriving blues music scene, and was the birthplace of several famous blues musicians.
In the late 20th century, Tunica became known for its gambling industry. Several casinos were built in the area, and the town quickly became a popular destination for tourists. Today, Tunica is still a popular destination for tourists, and the town is home to several casinos, resorts, and other attractions.
Common Questions
What is Per Capita Income in Tunica?
Per Capita income in Tunica is $31,390.
What is the Median Family Income in Tunica?
Median Family Income in Tunica is $84,500.
What is the Median Household income in Tunica?
Median Household Income in Tunica is $55,865.
What is Income or Wage Gap in Tunica?
Income or Wage Gap in Tunica is 15.6%.
Women in Tunica earn 84.4 cents for every dollar earned by a man.
What is Inequality or Gini Index in Tunica?
Inequality or Gini Index in Tunica is 0.45.
What is the Total Population of Tunica?
Total Population of Tunica is 1,062.
What is the Total Male Population of Tunica?
Total Male Population of Tunica is 500.
What is the Total Female Population of Tunica?
Total Female Population of Tunica is 562.
What is the Ratio of Males per 100 Females in Tunica?
There are 88.97 Males per 100 Females in Tunica.
What is the Ratio of Females per 100 Males in Tunica?
There are 112.40 Females per 100 Males in Tunica.
What is the Median Population Age in Tunica?
Median Population Age in Tunica is 50.7 Years.
What is the Average Family Size in Tunica
Average Family Size in Tunica is 3.1 People.
What is the Average Household Size in Tunica
Average Household Size in Tunica is 2.0 People.
How Large is the Labor Force in Tunica?
There are 484 People in the Labor Forcein in Tunica.
What is the Percentage of People in the Labor Force in Tunica?
53.8% of People are in the Labor Force in Tunica.
What is the Unemployment Rate in Tunica?
Unemployment Rate in Tunica is 2.7%.