Holcomb, MS Map & Demographics
Holcomb Map
Holcomb Overview
$32,409
PER CAPITA INCOME
$61,629
AVG FAMILY INCOME
$61,429
AVG HOUSEHOLD INCOME
0.23
INEQUALITY / GINI INDEX
143
TOTAL POPULATION
68
MALE POPULATION
75
FEMALE POPULATION
90.67
MALES / 100 FEMALES
110.29
FEMALES / 100 MALES
49.2
MEDIAN AGE
1.8
AVG FAMILY SIZE
1.7
AVG HOUSEHOLD SIZE
124
LABOR FORCE [ PEOPLE ]
86.7%
PERCENT IN LABOR FORCE
Holcomb Zip Codes
Holcomb Area Codes
Income in Holcomb
Income Overview in Holcomb
Per Capita Income in Holcomb is $32,409, while median incomes of families and households are $61,629 and $61,429 respectively.
| Characteristic | Number | Measure |
| Per Capita Income | 143 | $32,409 |
| Median Family Income | 73 | $61,629 |
| Mean Family Income | 73 | $71,258 |
| Median Household Income | 82 | $61,429 |
| Mean Household Income | 82 | $63,437 |
| Income Deficit | 73 | $0 |
| Wage / Income Gap (%) | 143 | 0.00% |
| Wage / Income Gap ($) | 143 | 100.00¢ per $1 |
| Gini / Inequality Index | 143 | 0.23 |
Earnings by Sex in Holcomb
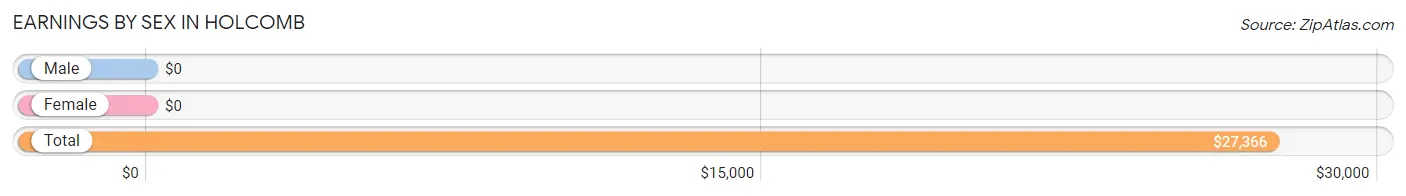
| Sex | Number | Average Earnings |
| Male | 59 (47.6%) | $0 |
| Female | 65 (52.4%) | $0 |
| Total | 124 (100.0%) | $27,366 |
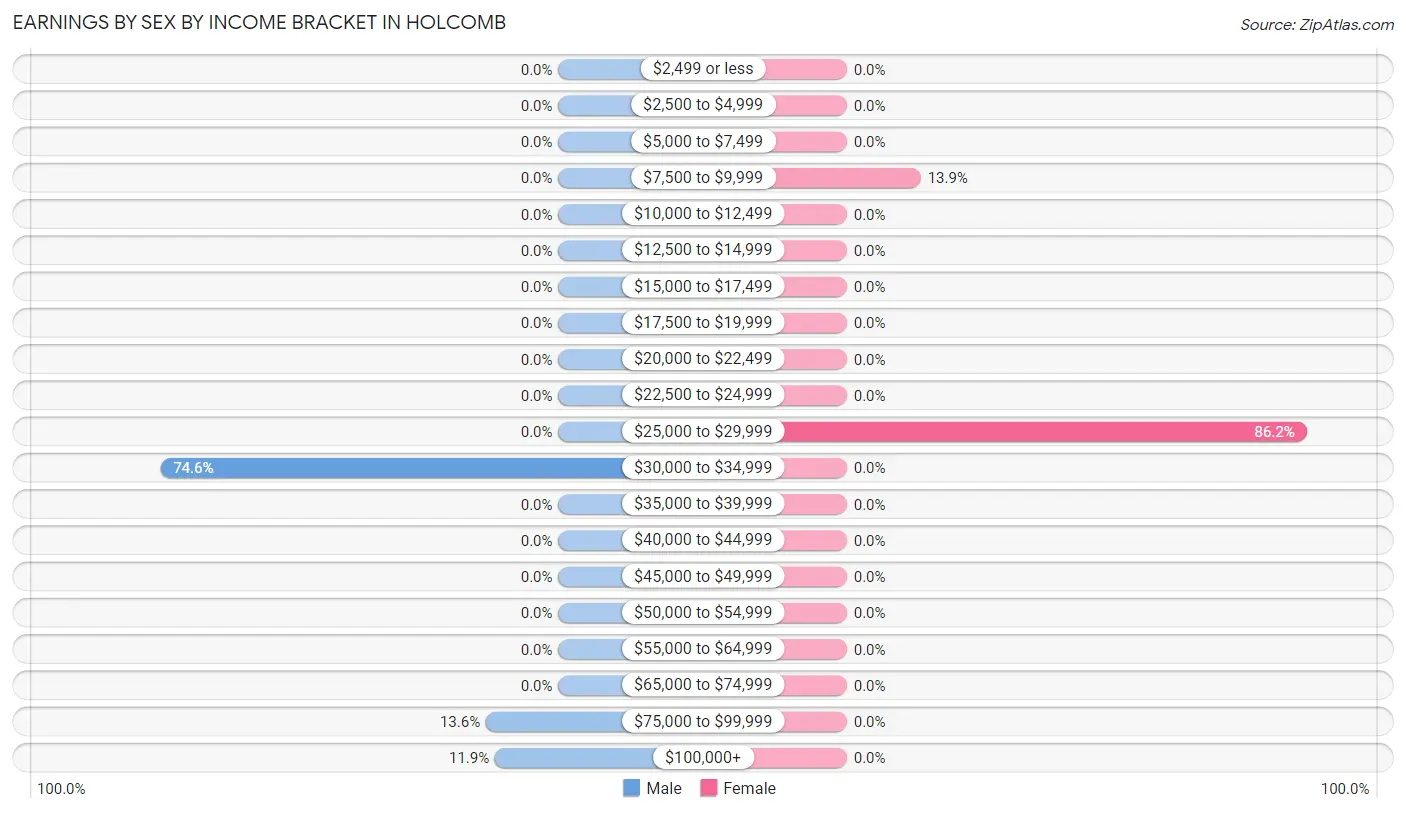
Earnings by Sex by Income Bracket in Holcomb
The most common earnings brackets in Holcomb are $30,000 to $34,999 for men (44 | 74.6%) and $25,000 to $29,999 for women (56 | 86.2%).
| Income | Male | Female |
| $2,499 or less | 0 (0.0%) | 0 (0.0%) |
| $2,500 to $4,999 | 0 (0.0%) | 0 (0.0%) |
| $5,000 to $7,499 | 0 (0.0%) | 0 (0.0%) |
| $7,500 to $9,999 | 0 (0.0%) | 9 (13.9%) |
| $10,000 to $12,499 | 0 (0.0%) | 0 (0.0%) |
| $12,500 to $14,999 | 0 (0.0%) | 0 (0.0%) |
| $15,000 to $17,499 | 0 (0.0%) | 0 (0.0%) |
| $17,500 to $19,999 | 0 (0.0%) | 0 (0.0%) |
| $20,000 to $22,499 | 0 (0.0%) | 0 (0.0%) |
| $22,500 to $24,999 | 0 (0.0%) | 0 (0.0%) |
| $25,000 to $29,999 | 0 (0.0%) | 56 (86.2%) |
| $30,000 to $34,999 | 44 (74.6%) | 0 (0.0%) |
| $35,000 to $39,999 | 0 (0.0%) | 0 (0.0%) |
| $40,000 to $44,999 | 0 (0.0%) | 0 (0.0%) |
| $45,000 to $49,999 | 0 (0.0%) | 0 (0.0%) |
| $50,000 to $54,999 | 0 (0.0%) | 0 (0.0%) |
| $55,000 to $64,999 | 0 (0.0%) | 0 (0.0%) |
| $65,000 to $74,999 | 0 (0.0%) | 0 (0.0%) |
| $75,000 to $99,999 | 8 (13.6%) | 0 (0.0%) |
| $100,000+ | 7 (11.9%) | 0 (0.0%) |
| Total | 59 (100.0%) | 65 (100.0%) |
Earnings by Sex by Educational Attainment in Holcomb
| Educational Attainment | Male Income | Female Income |
| Less than High School | - | - |
| High School Diploma | - | - |
| College or Associate's Degree | - | - |
| Bachelor's Degree | - | - |
| Graduate Degree | - | - |
| Total | - | - |
Family Income in Holcomb
Family Income Brackets in Holcomb
According to the Holcomb family income data, there are 56 families falling into the $50,000 to $74,999 income range, which is the most common income bracket and makes up 76.7% of all families.
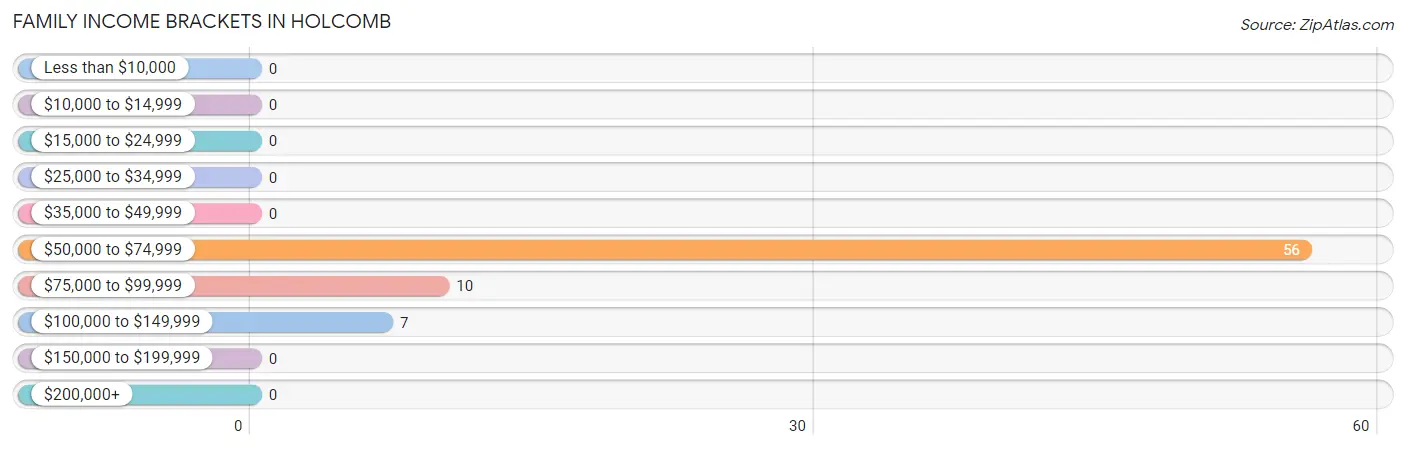
| Income Bracket | # Families | % Families |
| Less than $10,000 | 0 | 0.0% |
| $10,000 to $14,999 | 0 | 0.0% |
| $15,000 to $24,999 | 0 | 0.0% |
| $25,000 to $34,999 | 0 | 0.0% |
| $35,000 to $49,999 | 0 | 0.0% |
| $50,000 to $74,999 | 56 | 76.7% |
| $75,000 to $99,999 | 10 | 13.7% |
| $100,000 to $149,999 | 7 | 9.6% |
| $150,000 to $199,999 | 0 | 0.0% |
| $200,000+ | 0 | 0.0% |
Family Income by Famaliy Size in Holcomb
2-person families (73 | 100.0%) account for the highest median family income in Holcomb with $61,629 per family, while 2-person families (73 | 100.0%) have the highest median income of $30,814 per family member.
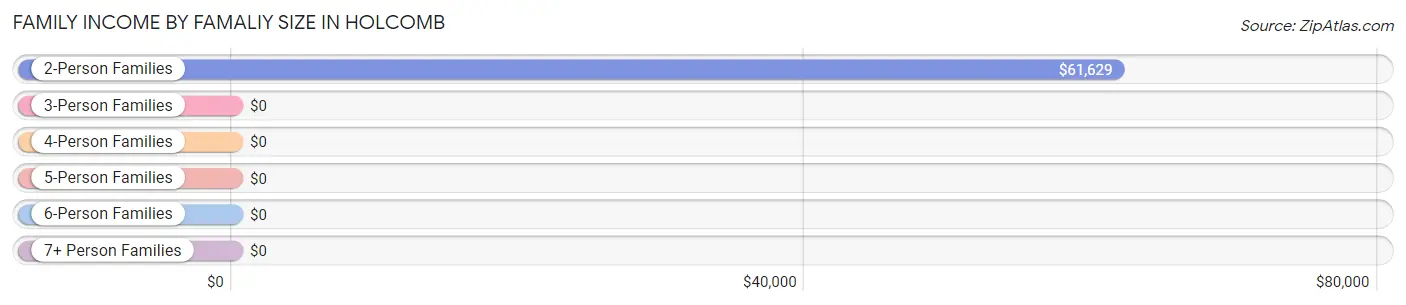
| Income Bracket | # Families | Median Income |
| 2-Person Families | 73 (100.0%) | $61,629 |
| 3-Person Families | 0 (0.0%) | $0 |
| 4-Person Families | 0 (0.0%) | $0 |
| 5-Person Families | 0 (0.0%) | $0 |
| 6-Person Families | 0 (0.0%) | $0 |
| 7+ Person Families | 0 (0.0%) | $0 |
| Total | 73 (100.0%) | $61,629 |
Family Income by Number of Earners in Holcomb
| Number of Earners | # Families | Median Income |
| No Earners | 0 (0.0%) | $0 |
| 1 Earner | 10 (13.7%) | $0 |
| 2 Earners | 63 (86.3%) | $0 |
| 3+ Earners | 0 (0.0%) | $0 |
| Total | 73 (100.0%) | $61,629 |
Household Income in Holcomb
Household Income Brackets in Holcomb
With 56 households falling in the category, the $50,000 to $74,999 income range is the most frequent in Holcomb, accounting for 68.3% of all households.
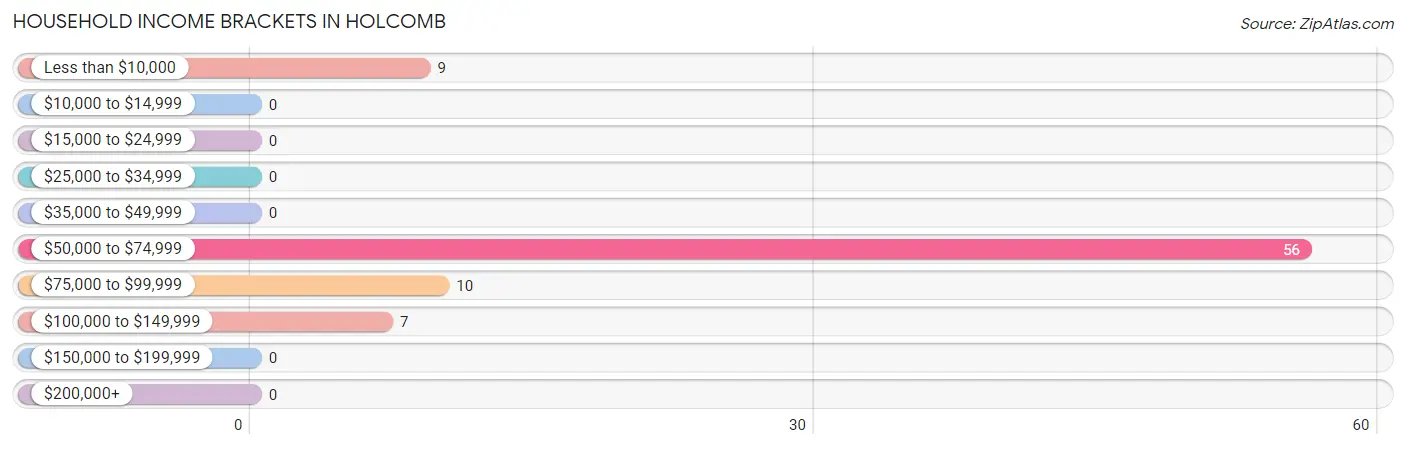
| Income Bracket | # Households | % Households |
| Less than $10,000 | 9 | 11.0% |
| $10,000 to $14,999 | 0 | 0.0% |
| $15,000 to $24,999 | 0 | 0.0% |
| $25,000 to $34,999 | 0 | 0.0% |
| $35,000 to $49,999 | 0 | 0.0% |
| $50,000 to $74,999 | 56 | 68.3% |
| $75,000 to $99,999 | 10 | 12.2% |
| $100,000 to $149,999 | 7 | 8.5% |
| $150,000 to $199,999 | 0 | 0.0% |
| $200,000+ | 0 | 0.0% |
Household Income by Householder Age in Holcomb
The median household income in Holcomb is $61,429, with the highest median household income of $61,429 found in the 45 to 64 years age bracket for the primary householder. A total of 82 households (100.0%) fall into this category.
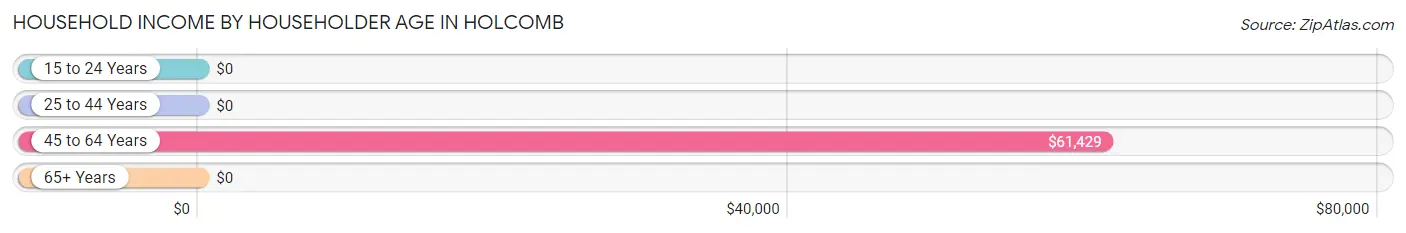
| Income Bracket | # Households | Median Income |
| 15 to 24 Years | 0 (0.0%) | $0 |
| 25 to 44 Years | 0 (0.0%) | $0 |
| 45 to 64 Years | 82 (100.0%) | $61,429 |
| 65+ Years | 0 (0.0%) | $0 |
| Total | 82 (100.0%) | $61,429 |
Poverty in Holcomb
Income Below Poverty by Sex and Age in Holcomb
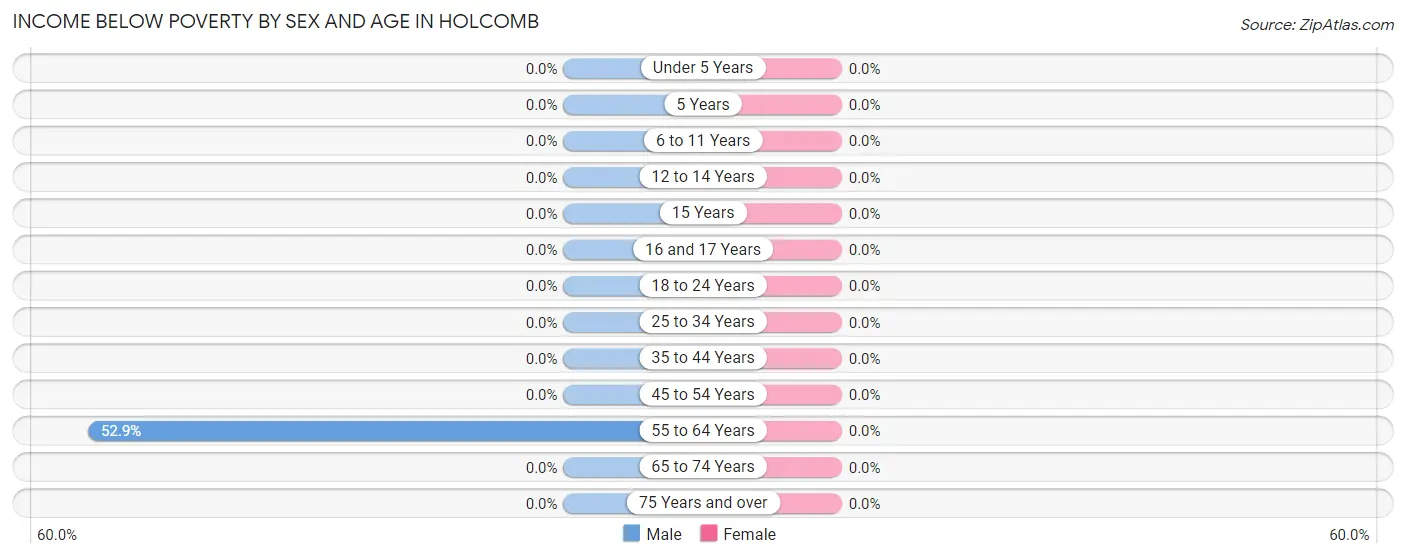
| Age Bracket | Male | Female |
| Under 5 Years | 0 (0.0%) | 0 (0.0%) |
| 5 Years | 0 (0.0%) | 0 (0.0%) |
| 6 to 11 Years | 0 (0.0%) | 0 (0.0%) |
| 12 to 14 Years | 0 (0.0%) | 0 (0.0%) |
| 15 Years | 0 (0.0%) | 0 (0.0%) |
| 16 and 17 Years | 0 (0.0%) | 0 (0.0%) |
| 18 to 24 Years | 0 (0.0%) | 0 (0.0%) |
| 25 to 34 Years | 0 (0.0%) | 0 (0.0%) |
| 35 to 44 Years | 0 (0.0%) | 0 (0.0%) |
| 45 to 54 Years | 0 (0.0%) | 0 (0.0%) |
| 55 to 64 Years | 9 (52.9%) | 0 (0.0%) |
| 65 to 74 Years | 0 (0.0%) | 0 (0.0%) |
| 75 Years and over | 0 (0.0%) | 0 (0.0%) |
| Total | 9 (13.2%) | 0 (0.0%) |
Income Above Poverty by Sex and Age in Holcomb
According to the poverty statistics in Holcomb, males aged 25 to 34 years and females aged 45 to 54 years are the age groups that are most secure financially, with 100.0% of males and 100.0% of females in these age groups living above the poverty line.
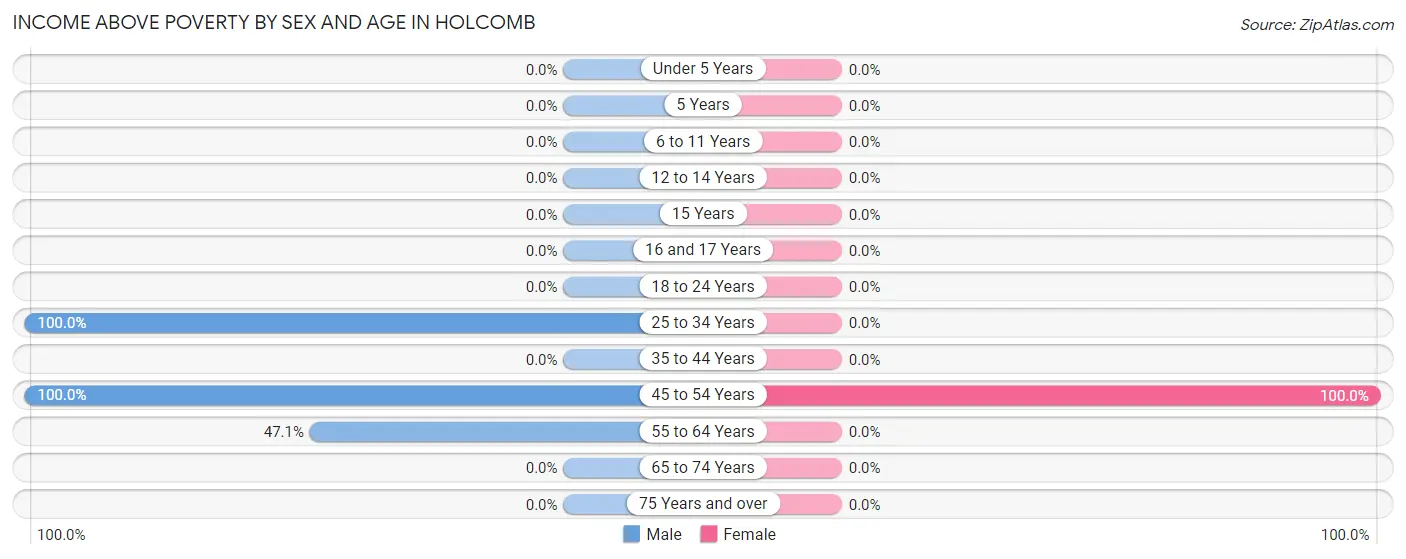
| Age Bracket | Male | Female |
| Under 5 Years | 0 (0.0%) | 0 (0.0%) |
| 5 Years | 0 (0.0%) | 0 (0.0%) |
| 6 to 11 Years | 0 (0.0%) | 0 (0.0%) |
| 12 to 14 Years | 0 (0.0%) | 0 (0.0%) |
| 15 Years | 0 (0.0%) | 0 (0.0%) |
| 16 and 17 Years | 0 (0.0%) | 0 (0.0%) |
| 18 to 24 Years | 0 (0.0%) | 0 (0.0%) |
| 25 to 34 Years | 44 (100.0%) | 0 (0.0%) |
| 35 to 44 Years | 0 (0.0%) | 0 (0.0%) |
| 45 to 54 Years | 7 (100.0%) | 75 (100.0%) |
| 55 to 64 Years | 8 (47.1%) | 0 (0.0%) |
| 65 to 74 Years | 0 (0.0%) | 0 (0.0%) |
| 75 Years and over | 0 (0.0%) | 0 (0.0%) |
| Total | 59 (86.8%) | 75 (100.0%) |
Income Below Poverty Among Married-Couple Families in Holcomb
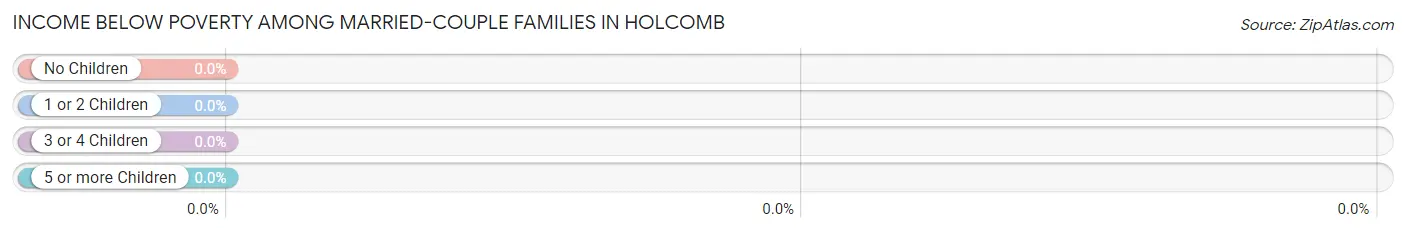
| Children | Above Poverty | Below Poverty |
| No Children | 17 (100.0%) | 0 (0.0%) |
| 1 or 2 Children | 0 (0.0%) | 0 (0.0%) |
| 3 or 4 Children | 0 (0.0%) | 0 (0.0%) |
| 5 or more Children | 0 (0.0%) | 0 (0.0%) |
| Total | 17 (100.0%) | 0 (0.0%) |
Income Below Poverty Among Single-Parent Households in Holcomb
| Children | Single Father | Single Mother |
| No Children | 0 (0.0%) | 0 (0.0%) |
| 1 or 2 Children | 0 (0.0%) | 0 (0.0%) |
| 3 or 4 Children | 0 (0.0%) | 0 (0.0%) |
| 5 or more Children | 0 (0.0%) | 0 (0.0%) |
| Total | 0 (0.0%) | 0 (0.0%) |
Income Below Poverty Among Married-Couple vs Single-Parent Households in Holcomb
| Children | Married-Couple Families | Single-Parent Households |
| No Children | 0 (0.0%) | 0 (0.0%) |
| 1 or 2 Children | 0 (0.0%) | 0 (0.0%) |
| 3 or 4 Children | 0 (0.0%) | 0 (0.0%) |
| 5 or more Children | 0 (0.0%) | 0 (0.0%) |
| Total | 0 (0.0%) | 0 (0.0%) |
Race in Holcomb
The most populous races in Holcomb are Black / African American (100 | 69.9%), and White / Caucasian (43 | 30.1%).
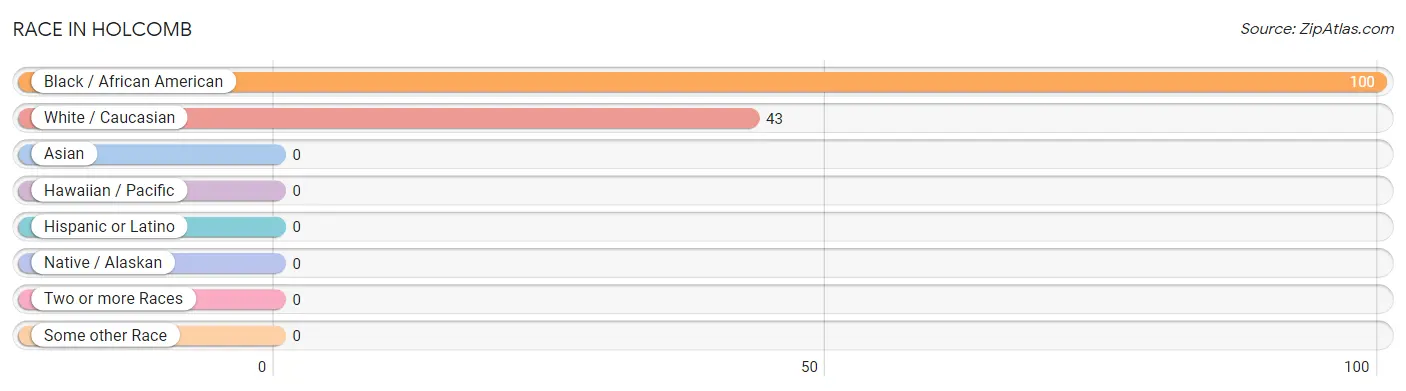
| Race | # Population | % Population |
| Asian | 0 | 0.0% |
| Black / African American | 100 | 69.9% |
| Hawaiian / Pacific | 0 | 0.0% |
| Hispanic or Latino | 0 | 0.0% |
| Native / Alaskan | 0 | 0.0% |
| White / Caucasian | 43 | 30.1% |
| Two or more Races | 0 | 0.0% |
| Some other Race | 0 | 0.0% |
| Total | 143 | 100.0% |
Ancestry in Holcomb
The most populous ancestries reported in Holcomb are American (80 | 55.9%), and English (10 | 7.0%), together accounting for 62.9% of all Holcomb residents.
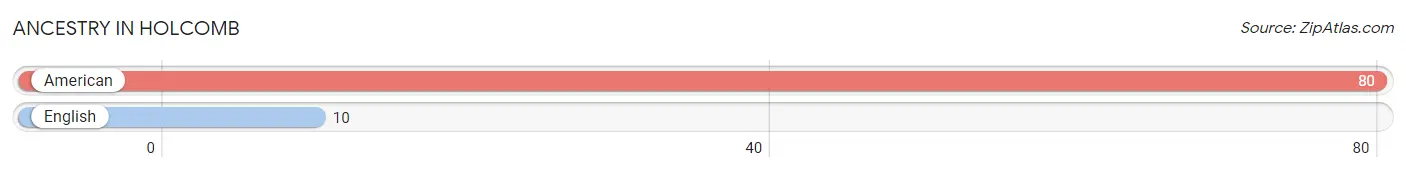
| Ancestry | # Population | % Population |
| American | 80 | 55.9% |
| English | 10 | 7.0% | View All 2 Rows |
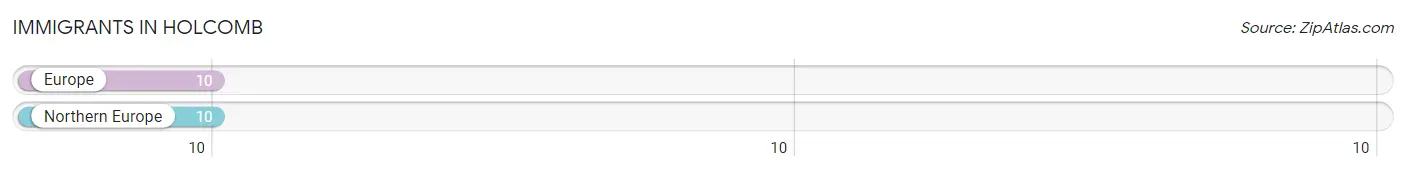
Immigrants in Holcomb
The most numerous immigrant groups reported in Holcomb came from Europe (10 | 7.0%), and Northern Europe (10 | 7.0%), together accounting for 14.0% of all Holcomb residents.
| Immigration Origin | # Population | % Population |
| Europe | 10 | 7.0% |
| Northern Europe | 10 | 7.0% | View All 2 Rows |
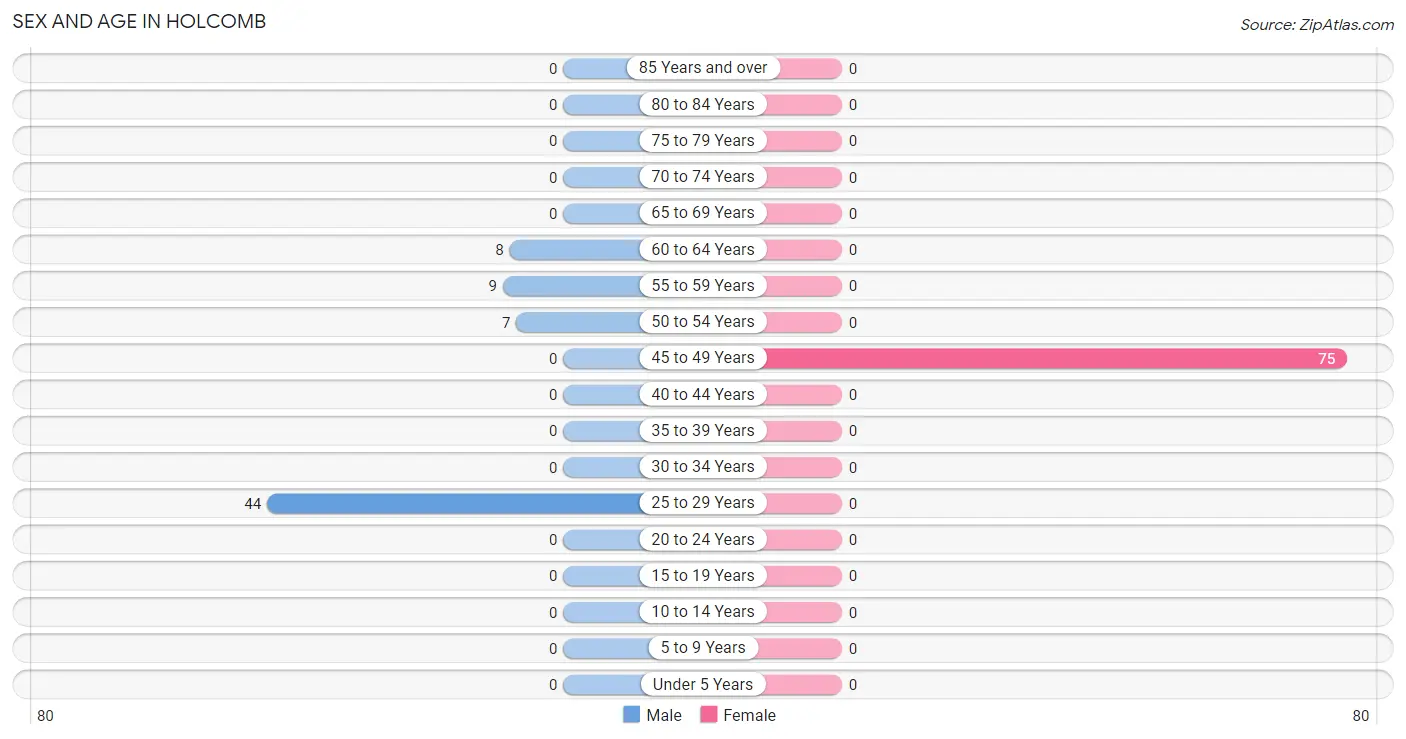
Sex and Age in Holcomb
Sex and Age in Holcomb
The most populous age groups in Holcomb are 25 to 29 Years (44 | 64.7%) for men and 45 to 49 Years (75 | 100.0%) for women.
| Age Bracket | Male | Female |
| Under 5 Years | 0 (0.0%) | 0 (0.0%) |
| 5 to 9 Years | 0 (0.0%) | 0 (0.0%) |
| 10 to 14 Years | 0 (0.0%) | 0 (0.0%) |
| 15 to 19 Years | 0 (0.0%) | 0 (0.0%) |
| 20 to 24 Years | 0 (0.0%) | 0 (0.0%) |
| 25 to 29 Years | 44 (64.7%) | 0 (0.0%) |
| 30 to 34 Years | 0 (0.0%) | 0 (0.0%) |
| 35 to 39 Years | 0 (0.0%) | 0 (0.0%) |
| 40 to 44 Years | 0 (0.0%) | 0 (0.0%) |
| 45 to 49 Years | 0 (0.0%) | 75 (100.0%) |
| 50 to 54 Years | 7 (10.3%) | 0 (0.0%) |
| 55 to 59 Years | 9 (13.2%) | 0 (0.0%) |
| 60 to 64 Years | 8 (11.8%) | 0 (0.0%) |
| 65 to 69 Years | 0 (0.0%) | 0 (0.0%) |
| 70 to 74 Years | 0 (0.0%) | 0 (0.0%) |
| 75 to 79 Years | 0 (0.0%) | 0 (0.0%) |
| 80 to 84 Years | 0 (0.0%) | 0 (0.0%) |
| 85 Years and over | 0 (0.0%) | 0 (0.0%) |
| Total | 68 (100.0%) | 75 (100.0%) |
Families and Households in Holcomb
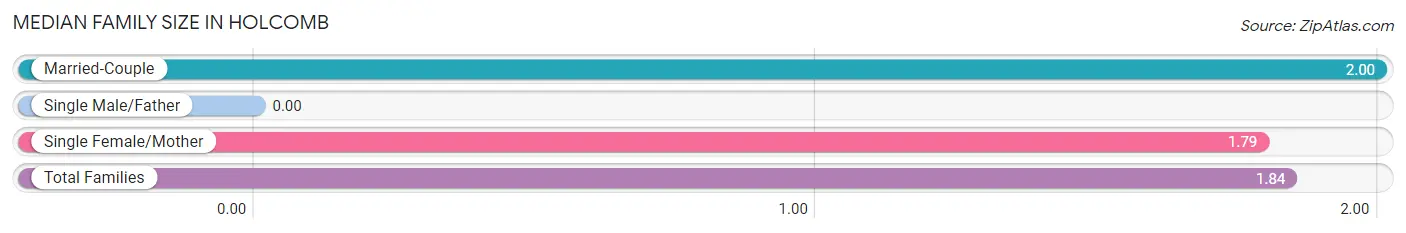
Median Family Size in Holcomb
| Family Type | # Families | Family Size |
| Married-Couple | 17 (23.3%) | 2.00 |
| Single Male/Father | 0 (0.0%) | - |
| Single Female/Mother | 56 (76.7%) | 1.79 |
| Total Families | 73 (100.0%) | 1.84 |
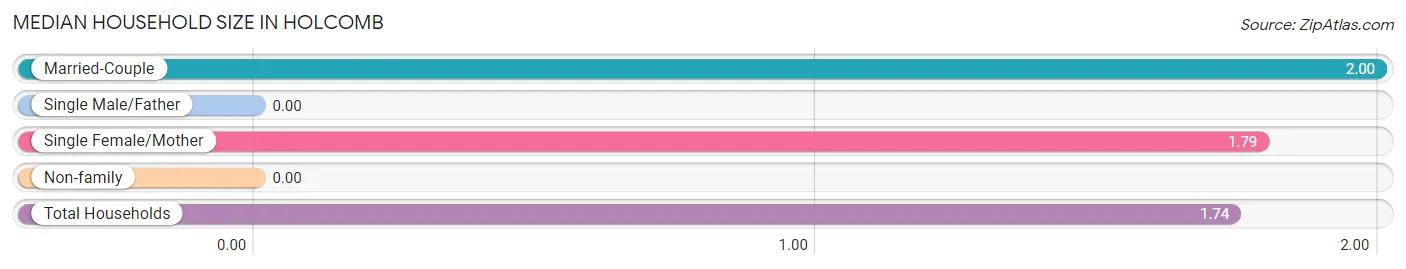
Median Household Size in Holcomb
| Household Type | # Households | Household Size |
| Married-Couple | 17 (20.7%) | 2.00 |
| Single Male/Father | 0 (0.0%) | - |
| Single Female/Mother | 56 (68.3%) | 1.79 |
| Non-family | 9 (11.0%) | - |
| Total Households | 82 (100.0%) | 1.74 |
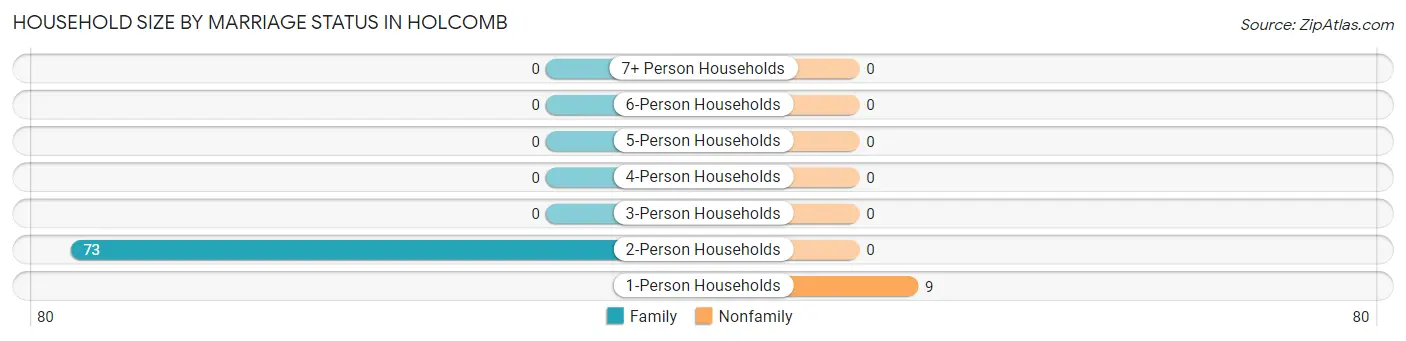
Household Size by Marriage Status in Holcomb
Out of a total of 82 households in Holcomb, 73 (89.0%) are family households, while 9 (11.0%) are nonfamily households. The most numerous type of family households are 2-person households, comprising 73, and the most common type of nonfamily households are 1-person households, comprising 9.
| Household Size | Family Households | Nonfamily Households |
| 1-Person Households | - | 9 (11.0%) |
| 2-Person Households | 73 (89.0%) | 0 (0.0%) |
| 3-Person Households | 0 (0.0%) | 0 (0.0%) |
| 4-Person Households | 0 (0.0%) | 0 (0.0%) |
| 5-Person Households | 0 (0.0%) | 0 (0.0%) |
| 6-Person Households | 0 (0.0%) | 0 (0.0%) |
| 7+ Person Households | 0 (0.0%) | 0 (0.0%) |
| Total | 73 (89.0%) | 9 (11.0%) |
Female Fertility in Holcomb
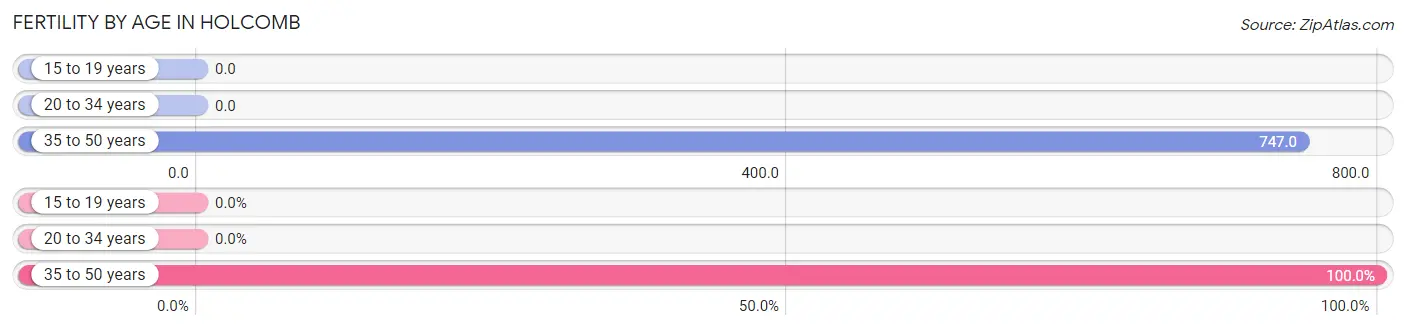
Fertility by Age in Holcomb
Average fertility rate in Holcomb is 747.0 births per 1,000 women. Women in the age bracket of 35 to 50 years have the highest fertility rate with 747.0 births per 1,000 women. Women in the age bracket of 35 to 50 years acount for 100.0% of all women with births.
| Age Bracket | Women with Births | Births / 1,000 Women |
| 15 to 19 years | 0 (0.0%) | 0.0 |
| 20 to 34 years | 0 (0.0%) | 0.0 |
| 35 to 50 years | 56 (100.0%) | 747.0 |
| Total | 56 (100.0%) | 747.0 |
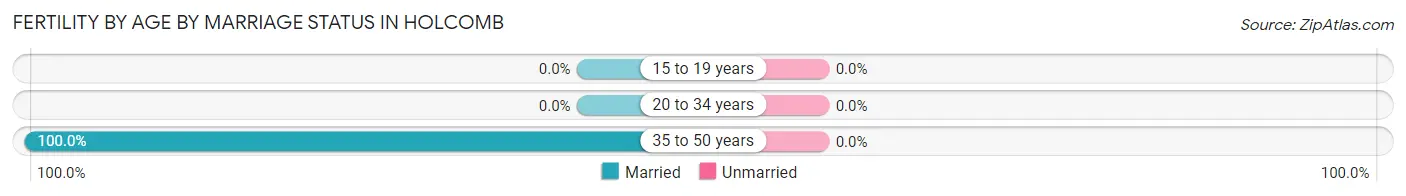
Fertility by Age by Marriage Status in Holcomb
| Age Bracket | Married | Unmarried |
| 15 to 19 years | 0 (0.0%) | 0 (0.0%) |
| 20 to 34 years | 0 (0.0%) | 0 (0.0%) |
| 35 to 50 years | 56 (100.0%) | 0 (0.0%) |
| Total | 56 (100.0%) | 0 (0.0%) |
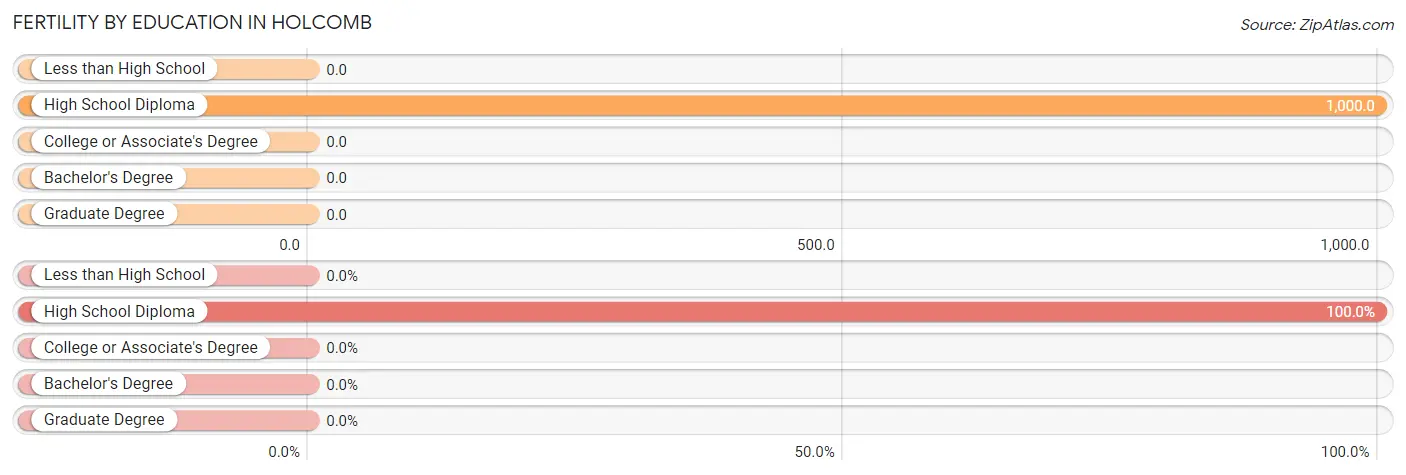
Fertility by Education in Holcomb
| Educational Attainment | Women with Births | Births / 1,000 Women |
| Less than High School | 0 (0.0%) | 0.0 |
| High School Diploma | 56 (100.0%) | 1,000.0 |
| College or Associate's Degree | 0 (0.0%) | 0.0 |
| Bachelor's Degree | 0 (0.0%) | 0.0 |
| Graduate Degree | 0 (0.0%) | 0.0 |
| Total | 56 (100.0%) | 747.0 |
Fertility by Education by Marriage Status in Holcomb
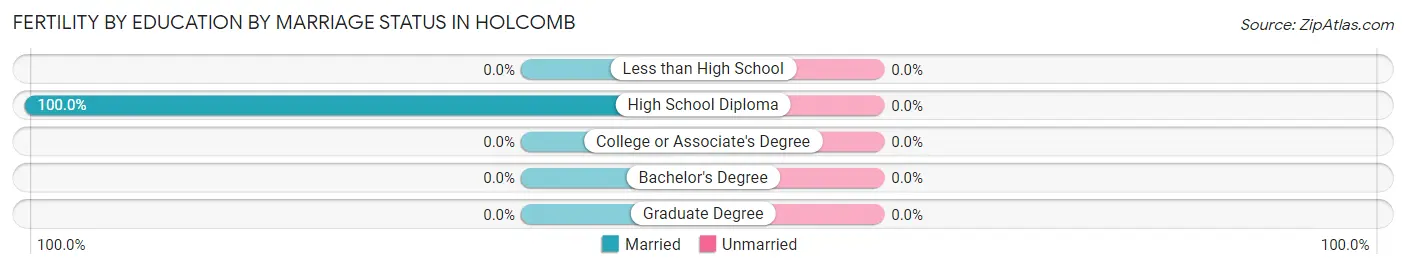
| Educational Attainment | Married | Unmarried |
| Less than High School | 0 (0.0%) | 0 (0.0%) |
| High School Diploma | 56 (100.0%) | 0 (0.0%) |
| College or Associate's Degree | 0 (0.0%) | 0 (0.0%) |
| Bachelor's Degree | 0 (0.0%) | 0 (0.0%) |
| Graduate Degree | 0 (0.0%) | 0 (0.0%) |
| Total | 56 (100.0%) | 0 (0.0%) |
Employment Characteristics in Holcomb
Employment by Class of Employer in Holcomb
Among the 124 employed individuals in Holcomb, private company employees (116 | 93.5%), and local government employees (8 | 6.5%) make up the most common classes of employment.
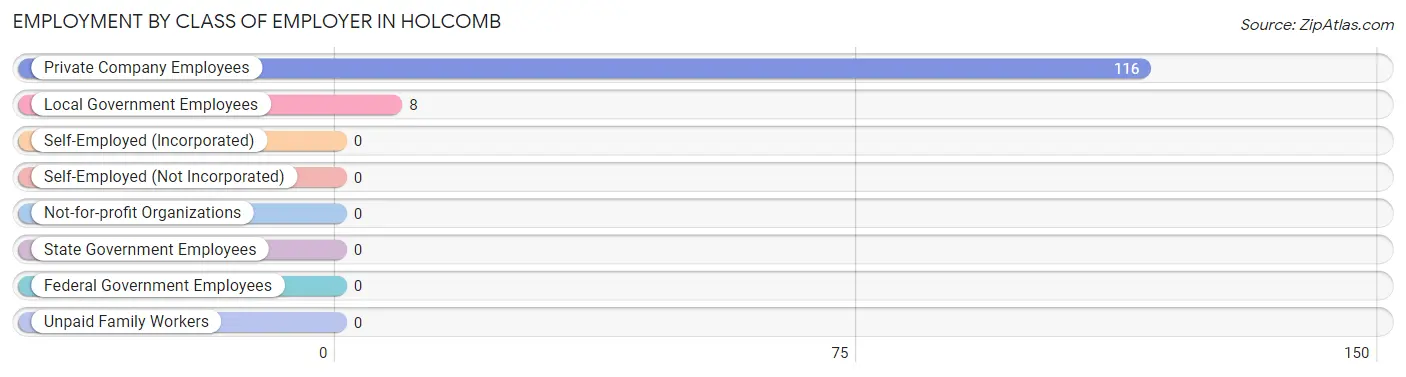
| Employer Class | # Employees | % Employees |
| Private Company Employees | 116 | 93.5% |
| Self-Employed (Incorporated) | 0 | 0.0% |
| Self-Employed (Not Incorporated) | 0 | 0.0% |
| Not-for-profit Organizations | 0 | 0.0% |
| Local Government Employees | 8 | 6.5% |
| State Government Employees | 0 | 0.0% |
| Federal Government Employees | 0 | 0.0% |
| Unpaid Family Workers | 0 | 0.0% |
| Total | 124 | 100.0% |
Employment Status by Age in Holcomb
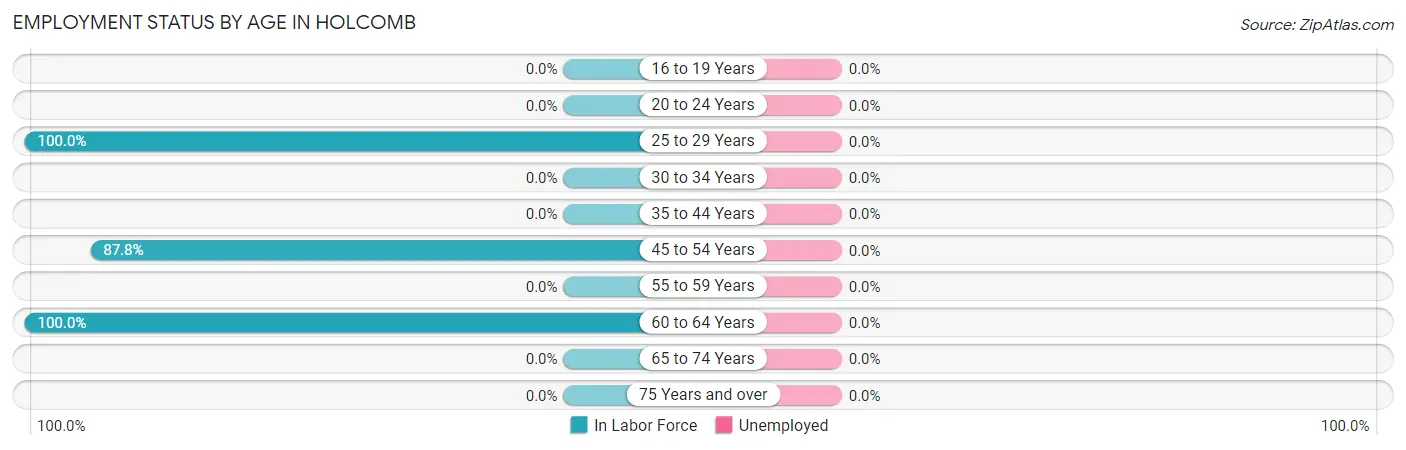
| Age Bracket | In Labor Force | Unemployed |
| 16 to 19 Years | 0 (0.0%) | 0 (0.0%) |
| 20 to 24 Years | 0 (0.0%) | 0 (0.0%) |
| 25 to 29 Years | 44 (100.0%) | 0 (0.0%) |
| 30 to 34 Years | 0 (0.0%) | 0 (0.0%) |
| 35 to 44 Years | 0 (0.0%) | 0 (0.0%) |
| 45 to 54 Years | 72 (87.8%) | 0 (0.0%) |
| 55 to 59 Years | 0 (0.0%) | 0 (0.0%) |
| 60 to 64 Years | 8 (100.0%) | 0 (0.0%) |
| 65 to 74 Years | 0 (0.0%) | 0 (0.0%) |
| 75 Years and over | 0 (0.0%) | 0 (0.0%) |
| Total | 124 (86.7%) | 0 (0.0%) |
Employment Status by Educational Attainment in Holcomb
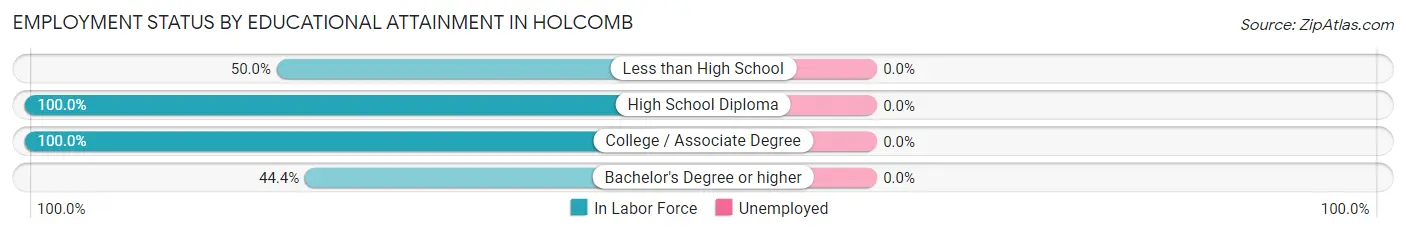
| Educational Attainment | In Labor Force | Unemployed |
| Less than High School | 9 (50.0%) | 0 (0.0%) |
| High School Diploma | 63 (100.0%) | 0 (0.0%) |
| College / Associate Degree | 44 (100.0%) | 0 (0.0%) |
| Bachelor's Degree or higher | 8 (44.4%) | 0 (0.0%) |
| Total | 124 (86.7%) | 0 (0.0%) |
Employment Occupations by Sex in Holcomb
Management, Business, Science and Arts Occupations
The most common Management, Business, Science and Arts occupations in Holcomb are , and Management (8 | 6.5%).
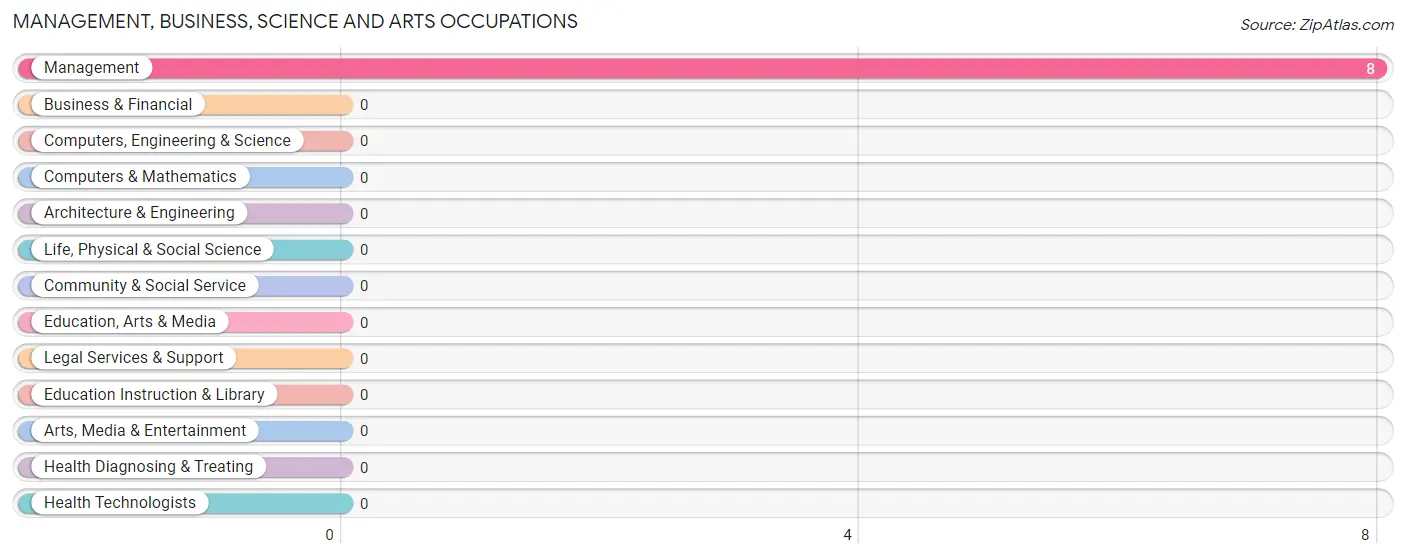
Management, Business, Science and Arts Occupations by Sex
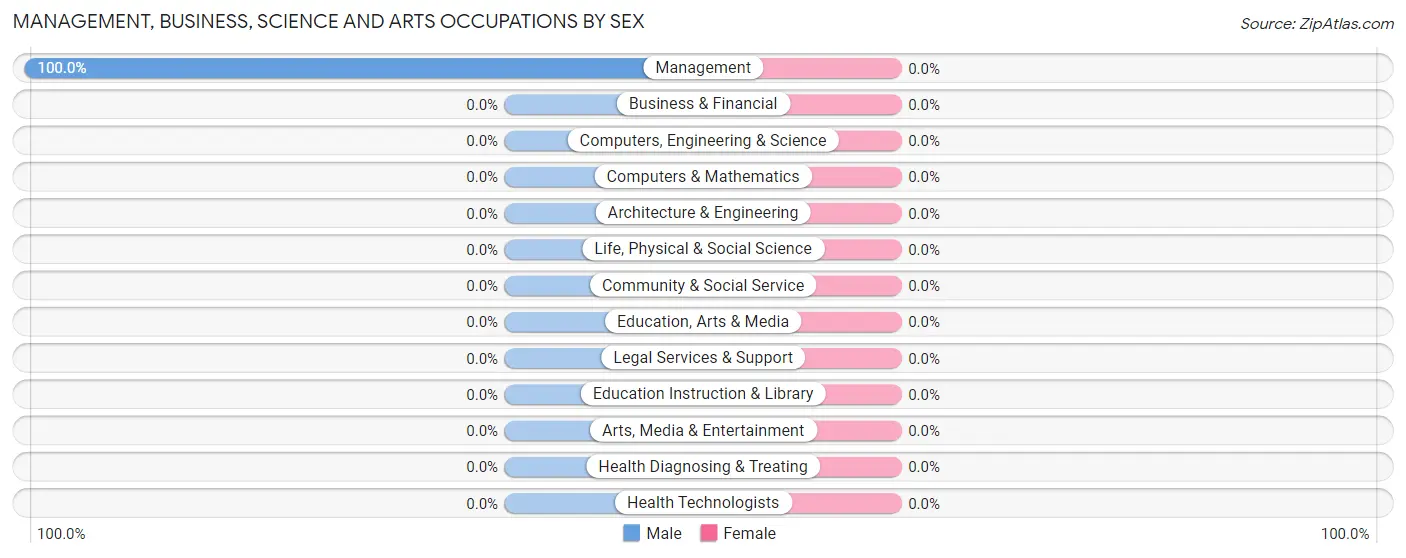
| Occupation | Male | Female |
| Management | 8 (100.0%) | 0 (0.0%) |
| Business & Financial | 0 (0.0%) | 0 (0.0%) |
| Computers, Engineering & Science | 0 (0.0%) | 0 (0.0%) |
| Computers & Mathematics | 0 (0.0%) | 0 (0.0%) |
| Architecture & Engineering | 0 (0.0%) | 0 (0.0%) |
| Life, Physical & Social Science | 0 (0.0%) | 0 (0.0%) |
| Community & Social Service | 0 (0.0%) | 0 (0.0%) |
| Education, Arts & Media | 0 (0.0%) | 0 (0.0%) |
| Legal Services & Support | 0 (0.0%) | 0 (0.0%) |
| Education Instruction & Library | 0 (0.0%) | 0 (0.0%) |
| Arts, Media & Entertainment | 0 (0.0%) | 0 (0.0%) |
| Health Diagnosing & Treating | 0 (0.0%) | 0 (0.0%) |
| Health Technologists | 0 (0.0%) | 0 (0.0%) |
| Total (Category) | 8 (100.0%) | 0 (0.0%) |
| Total (Overall) | 59 (47.6%) | 65 (52.4%) |
Services Occupations
The most common Services occupations in Holcomb are , and Healthcare Support (56 | 45.2%).
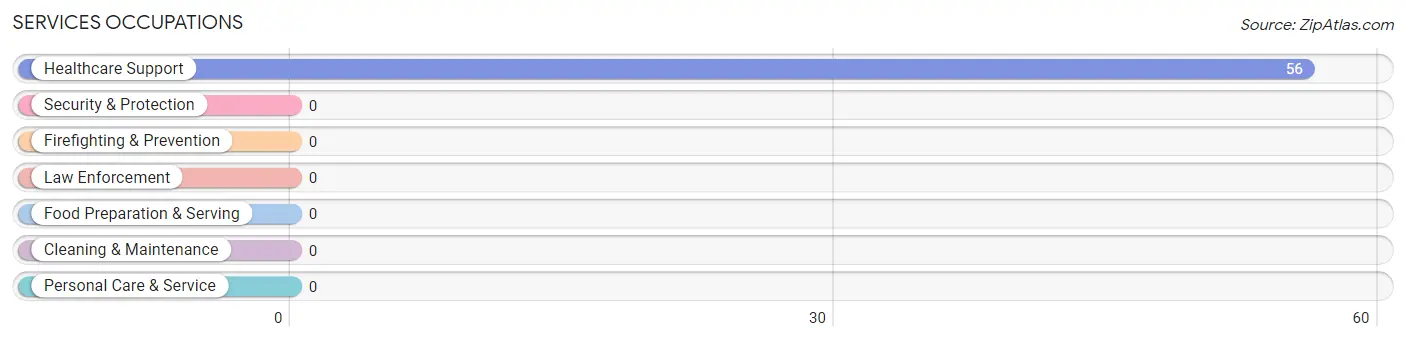
Services Occupations by Sex
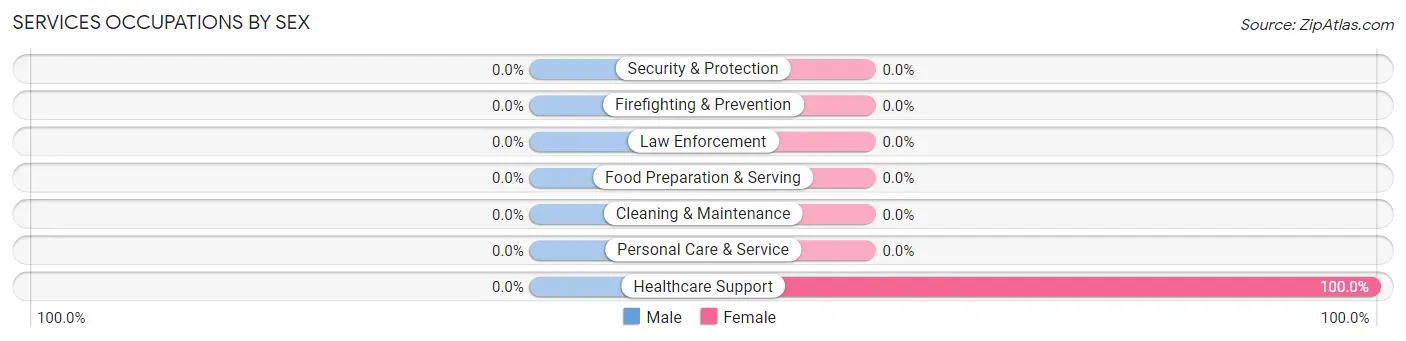
| Occupation | Male | Female |
| Healthcare Support | 0 (0.0%) | 56 (100.0%) |
| Security & Protection | 0 (0.0%) | 0 (0.0%) |
| Firefighting & Prevention | 0 (0.0%) | 0 (0.0%) |
| Law Enforcement | 0 (0.0%) | 0 (0.0%) |
| Food Preparation & Serving | 0 (0.0%) | 0 (0.0%) |
| Cleaning & Maintenance | 0 (0.0%) | 0 (0.0%) |
| Personal Care & Service | 0 (0.0%) | 0 (0.0%) |
| Total (Category) | 0 (0.0%) | 56 (100.0%) |
| Total (Overall) | 59 (47.6%) | 65 (52.4%) |
Sales and Office Occupations
The most common Sales and Office occupations in Holcomb are Office & Administration (9 | 7.3%), and Sales & Related (7 | 5.7%).
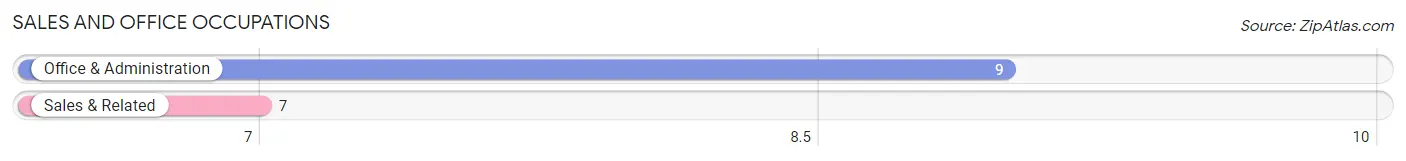
Sales and Office Occupations by Sex
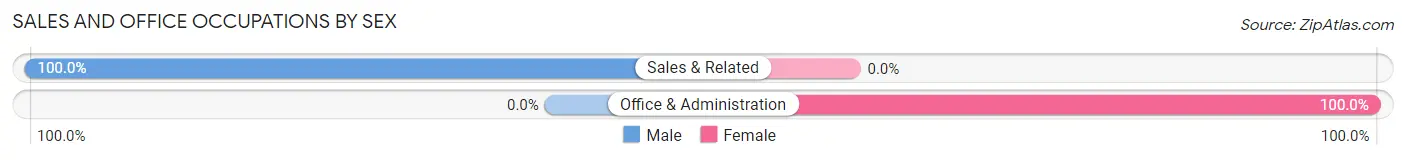
| Occupation | Male | Female |
| Sales & Related | 7 (100.0%) | 0 (0.0%) |
| Office & Administration | 0 (0.0%) | 9 (100.0%) |
| Total (Category) | 7 (43.8%) | 9 (56.2%) |
| Total (Overall) | 59 (47.6%) | 65 (52.4%) |
Natural Resources, Construction and Maintenance Occupations
The most common Natural Resources, Construction and Maintenance occupations in Holcomb are , and Installation, Maintenance & Repair (44 | 35.5%).
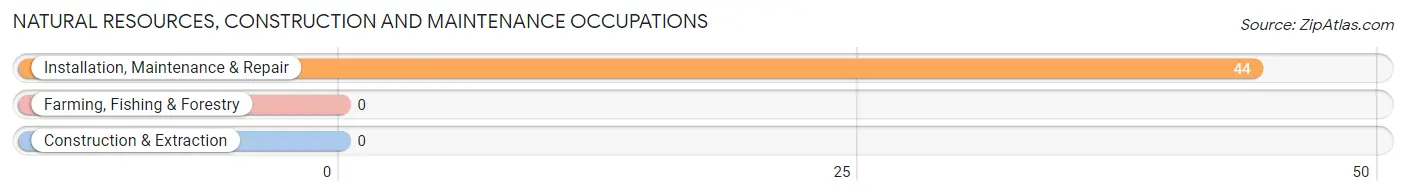
Natural Resources, Construction and Maintenance Occupations by Sex
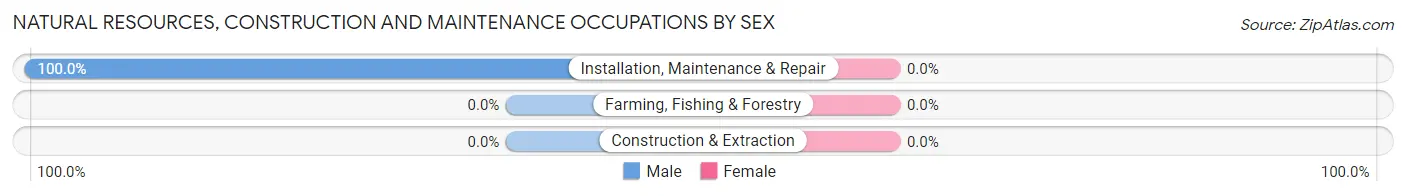
| Occupation | Male | Female |
| Farming, Fishing & Forestry | 0 (0.0%) | 0 (0.0%) |
| Construction & Extraction | 0 (0.0%) | 0 (0.0%) |
| Installation, Maintenance & Repair | 44 (100.0%) | 0 (0.0%) |
| Total (Category) | 44 (100.0%) | 0 (0.0%) |
| Total (Overall) | 59 (47.6%) | 65 (52.4%) |
Production, Transportation and Moving Occupations
Production, Transportation and Moving Occupations by Sex
| Occupation | Male | Female |
| Production | 0 (0.0%) | 0 (0.0%) |
| Transportation | 0 (0.0%) | 0 (0.0%) |
| Material Moving | 0 (0.0%) | 0 (0.0%) |
| Total (Category) | 0 (0.0%) | 0 (0.0%) |
| Total (Overall) | 59 (47.6%) | 65 (52.4%) |
Employment Industries by Sex in Holcomb
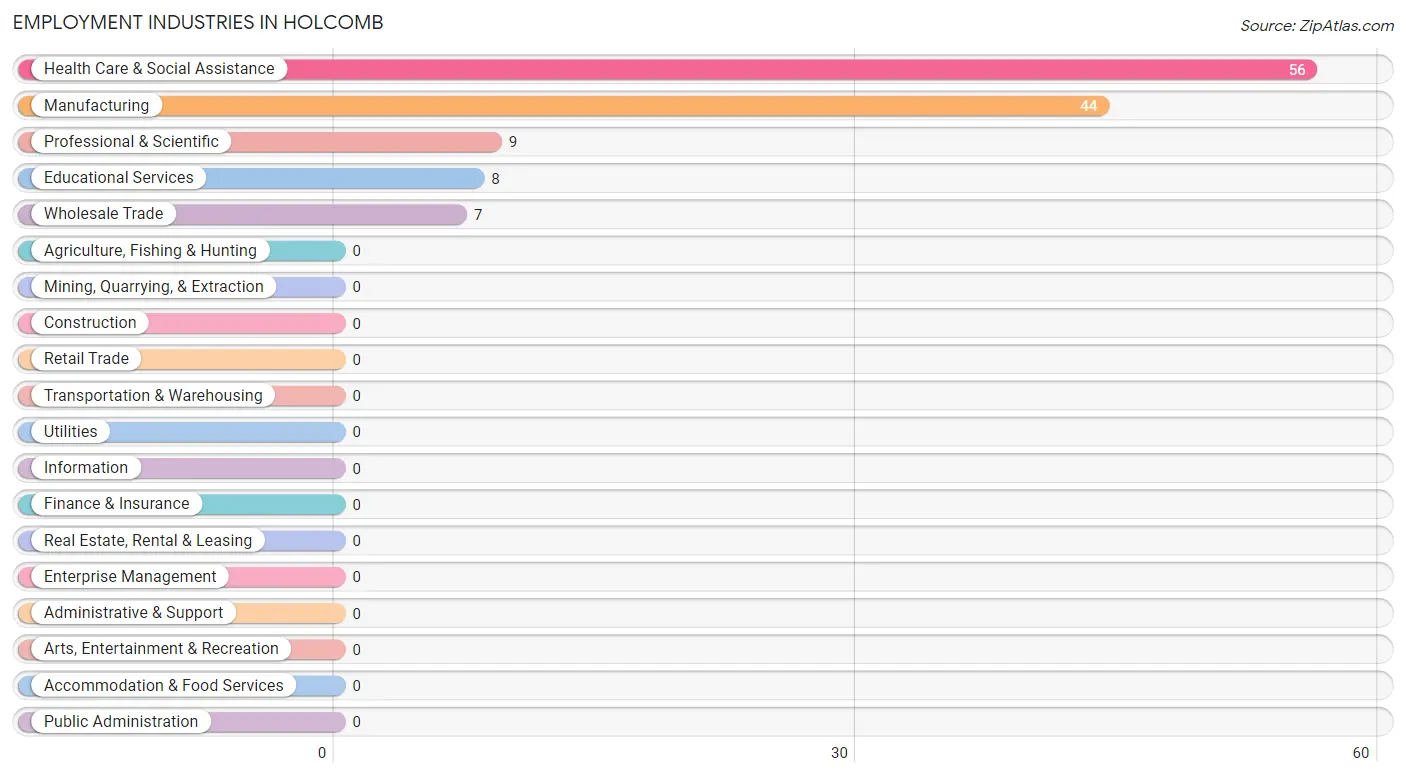
Employment Industries in Holcomb
The major employment industries in Holcomb include Health Care & Social Assistance (56 | 45.2%), Manufacturing (44 | 35.5%), Professional & Scientific (9 | 7.3%), Educational Services (8 | 6.5%), and Wholesale Trade (7 | 5.7%).
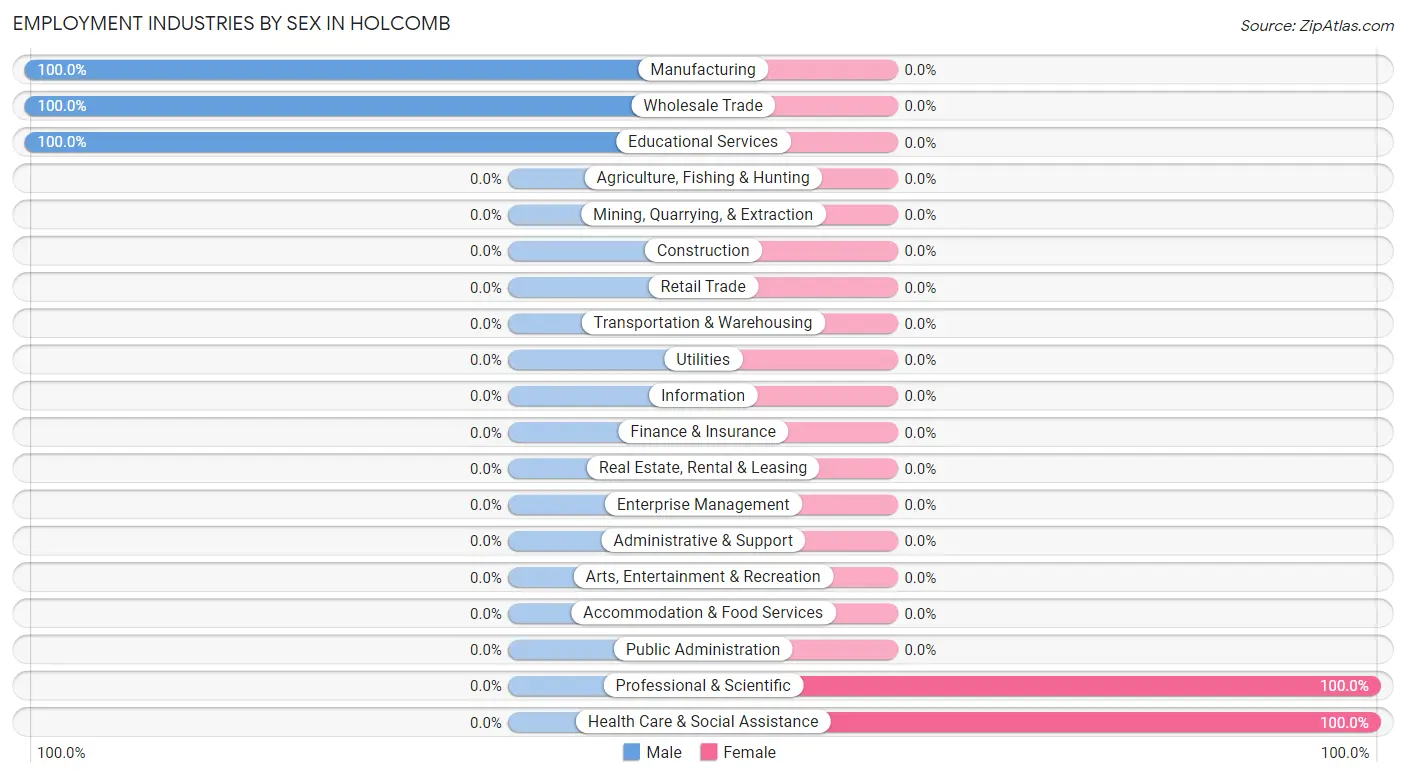
Employment Industries by Sex in Holcomb
The Holcomb industries that see more men than women are Manufacturing (100.0%), Wholesale Trade (100.0%), and Educational Services (100.0%), whereas the industries that tend to have a higher number of women are Professional & Scientific (100.0%), and Health Care & Social Assistance (100.0%).
| Industry | Male | Female |
| Agriculture, Fishing & Hunting | 0 (0.0%) | 0 (0.0%) |
| Mining, Quarrying, & Extraction | 0 (0.0%) | 0 (0.0%) |
| Construction | 0 (0.0%) | 0 (0.0%) |
| Manufacturing | 44 (100.0%) | 0 (0.0%) |
| Wholesale Trade | 7 (100.0%) | 0 (0.0%) |
| Retail Trade | 0 (0.0%) | 0 (0.0%) |
| Transportation & Warehousing | 0 (0.0%) | 0 (0.0%) |
| Utilities | 0 (0.0%) | 0 (0.0%) |
| Information | 0 (0.0%) | 0 (0.0%) |
| Finance & Insurance | 0 (0.0%) | 0 (0.0%) |
| Real Estate, Rental & Leasing | 0 (0.0%) | 0 (0.0%) |
| Professional & Scientific | 0 (0.0%) | 9 (100.0%) |
| Enterprise Management | 0 (0.0%) | 0 (0.0%) |
| Administrative & Support | 0 (0.0%) | 0 (0.0%) |
| Educational Services | 8 (100.0%) | 0 (0.0%) |
| Health Care & Social Assistance | 0 (0.0%) | 56 (100.0%) |
| Arts, Entertainment & Recreation | 0 (0.0%) | 0 (0.0%) |
| Accommodation & Food Services | 0 (0.0%) | 0 (0.0%) |
| Public Administration | 0 (0.0%) | 0 (0.0%) |
| Total | 59 (47.6%) | 65 (52.4%) |
Education in Holcomb
School Enrollment in Holcomb
| School Level | # Students | % Students |
| Nursery / Preschool | 0 | 0.0% |
| Kindergarten | 0 | 0.0% |
| Elementary School | 0 | 0.0% |
| Middle School | 0 | 0.0% |
| High School | 0 | 0.0% |
| College / Undergraduate | 0 | 0.0% |
| Graduate / Professional | 0 | 0.0% |
| Total | 0 | 0.0% |
School Enrollment by Age by Funding Source in Holcomb
| Age Bracket | Public School | Private School |
| 3 to 4 Year Olds | 0 (0.0%) | 0 (0.0%) |
| 5 to 9 Year Old | 0 (0.0%) | 0 (0.0%) |
| 10 to 14 Year Olds | 0 (0.0%) | 0 (0.0%) |
| 15 to 17 Year Olds | 0 (0.0%) | 0 (0.0%) |
| 18 to 19 Year Olds | 0 (0.0%) | 0 (0.0%) |
| 20 to 24 Year Olds | 0 (0.0%) | 0 (0.0%) |
| 25 to 34 Year Olds | 0 (0.0%) | 0 (0.0%) |
| 35 Years and over | 0 (0.0%) | 0 (0.0%) |
| Total | 0 (0.0%) | 0 (0.0%) |
Educational Attainment by Field of Study in Holcomb
Psychology (10 | 55.6%), and literature & languages (8 | 44.4%) are the most common fields of study among 18 individuals in Holcomb who have obtained a bachelor's degree or higher.
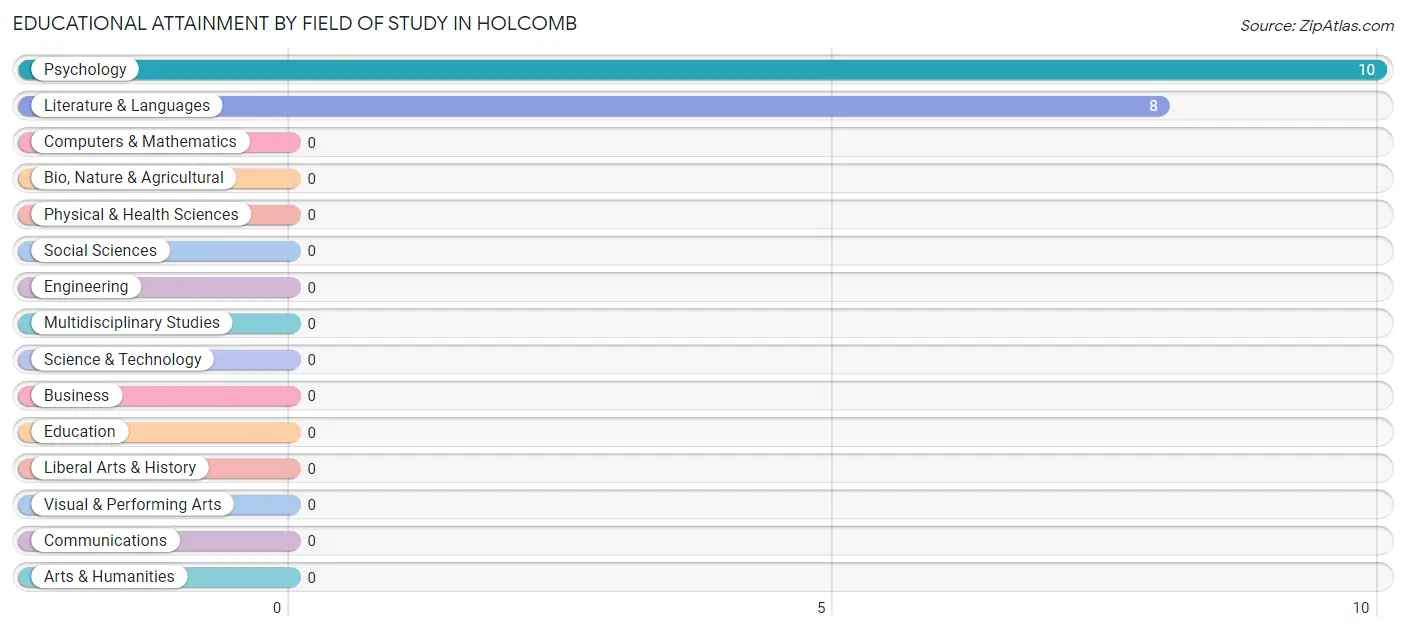
| Field of Study | # Graduates | % Graduates |
| Computers & Mathematics | 0 | 0.0% |
| Bio, Nature & Agricultural | 0 | 0.0% |
| Physical & Health Sciences | 0 | 0.0% |
| Psychology | 10 | 55.6% |
| Social Sciences | 0 | 0.0% |
| Engineering | 0 | 0.0% |
| Multidisciplinary Studies | 0 | 0.0% |
| Science & Technology | 0 | 0.0% |
| Business | 0 | 0.0% |
| Education | 0 | 0.0% |
| Literature & Languages | 8 | 44.4% |
| Liberal Arts & History | 0 | 0.0% |
| Visual & Performing Arts | 0 | 0.0% |
| Communications | 0 | 0.0% |
| Arts & Humanities | 0 | 0.0% |
| Total | 18 | 100.0% |
Transportation & Commute in Holcomb
Vehicle Availability by Sex in Holcomb
The most prevalent vehicle ownership categories in Holcomb are males with 2 vehicles (52, accounting for 88.1%) and females with 2 vehicles (56, making up 80.0%).
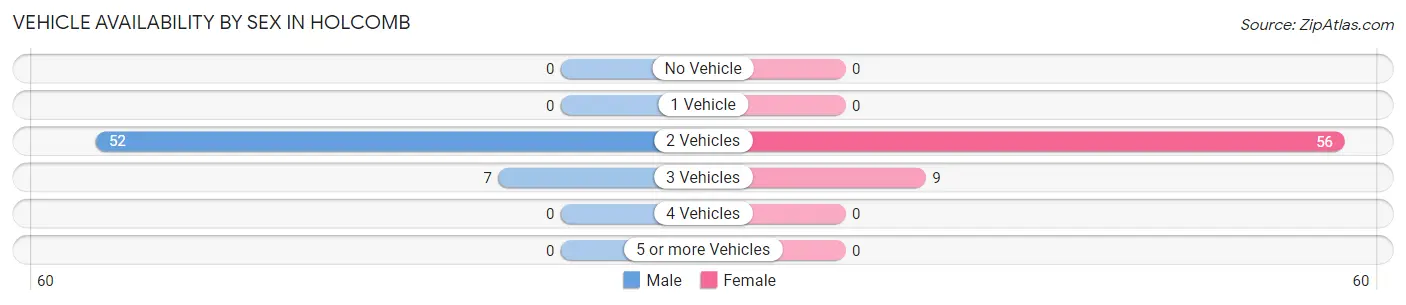
| Vehicles Available | Male | Female |
| No Vehicle | 0 (0.0%) | 0 (0.0%) |
| 1 Vehicle | 0 (0.0%) | 0 (0.0%) |
| 2 Vehicles | 52 (88.1%) | 56 (86.2%) |
| 3 Vehicles | 7 (11.9%) | 9 (13.9%) |
| 4 Vehicles | 0 (0.0%) | 0 (0.0%) |
| 5 or more Vehicles | 0 (0.0%) | 0 (0.0%) |
| Total | 59 (100.0%) | 65 (100.0%) |
Commute Time in Holcomb
The most frequently occuring commute durations in Holcomb are 15 to 19 minutes (56 commuters, 45.2%), 20 to 24 minutes (44 commuters, 35.5%), and 60 to 89 minutes (9 commuters, 7.3%).
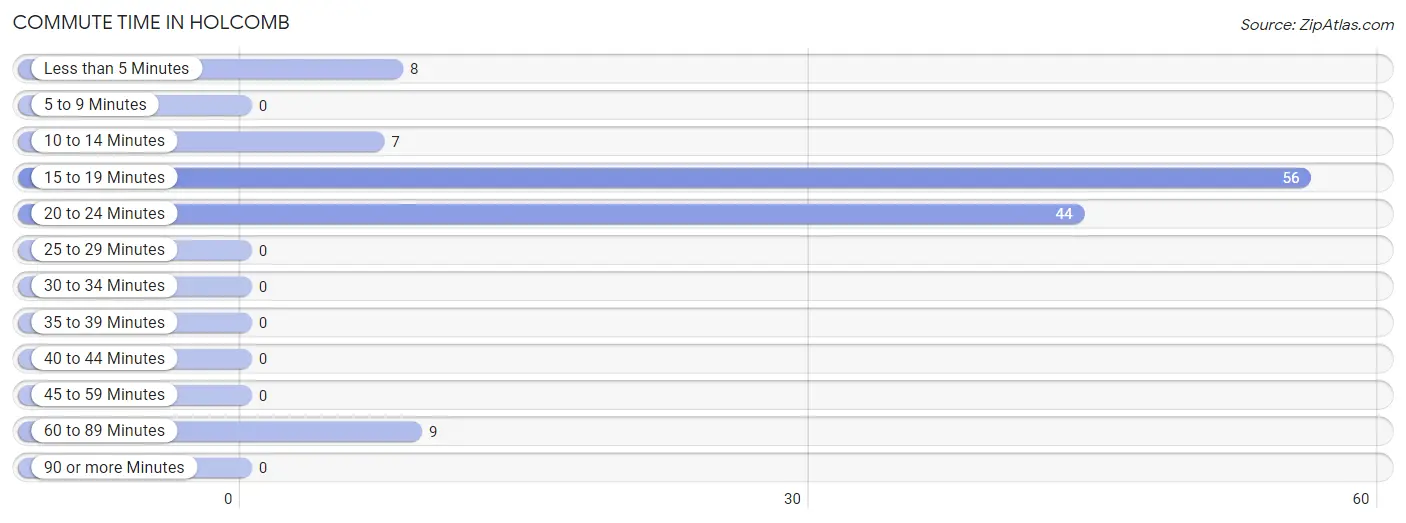
| Commute Time | # Commuters | % Commuters |
| Less than 5 Minutes | 8 | 6.5% |
| 5 to 9 Minutes | 0 | 0.0% |
| 10 to 14 Minutes | 7 | 5.7% |
| 15 to 19 Minutes | 56 | 45.2% |
| 20 to 24 Minutes | 44 | 35.5% |
| 25 to 29 Minutes | 0 | 0.0% |
| 30 to 34 Minutes | 0 | 0.0% |
| 35 to 39 Minutes | 0 | 0.0% |
| 40 to 44 Minutes | 0 | 0.0% |
| 45 to 59 Minutes | 0 | 0.0% |
| 60 to 89 Minutes | 9 | 7.3% |
| 90 or more Minutes | 0 | 0.0% |
Commute Time by Sex in Holcomb
The most common commute times in Holcomb are 20 to 24 minutes (44 commuters, 74.6%) for males and 15 to 19 minutes (56 commuters, 86.2%) for females.
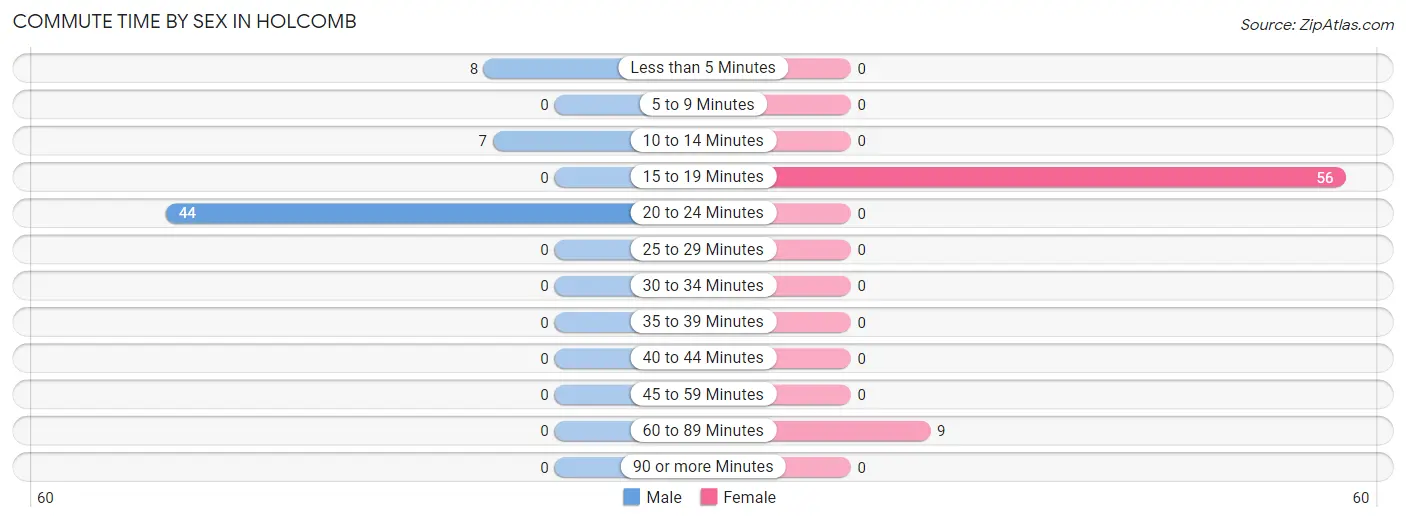
| Commute Time | Male | Female |
| Less than 5 Minutes | 8 (13.6%) | 0 (0.0%) |
| 5 to 9 Minutes | 0 (0.0%) | 0 (0.0%) |
| 10 to 14 Minutes | 7 (11.9%) | 0 (0.0%) |
| 15 to 19 Minutes | 0 (0.0%) | 56 (86.2%) |
| 20 to 24 Minutes | 44 (74.6%) | 0 (0.0%) |
| 25 to 29 Minutes | 0 (0.0%) | 0 (0.0%) |
| 30 to 34 Minutes | 0 (0.0%) | 0 (0.0%) |
| 35 to 39 Minutes | 0 (0.0%) | 0 (0.0%) |
| 40 to 44 Minutes | 0 (0.0%) | 0 (0.0%) |
| 45 to 59 Minutes | 0 (0.0%) | 0 (0.0%) |
| 60 to 89 Minutes | 0 (0.0%) | 9 (13.9%) |
| 90 or more Minutes | 0 (0.0%) | 0 (0.0%) |
Time of Departure to Work by Sex in Holcomb
The most frequent times of departure to work in Holcomb are 10:00 AM to 10:59 AM (44, 74.6%) for males and 11:00 AM to 11:59 AM (56, 86.2%) for females.
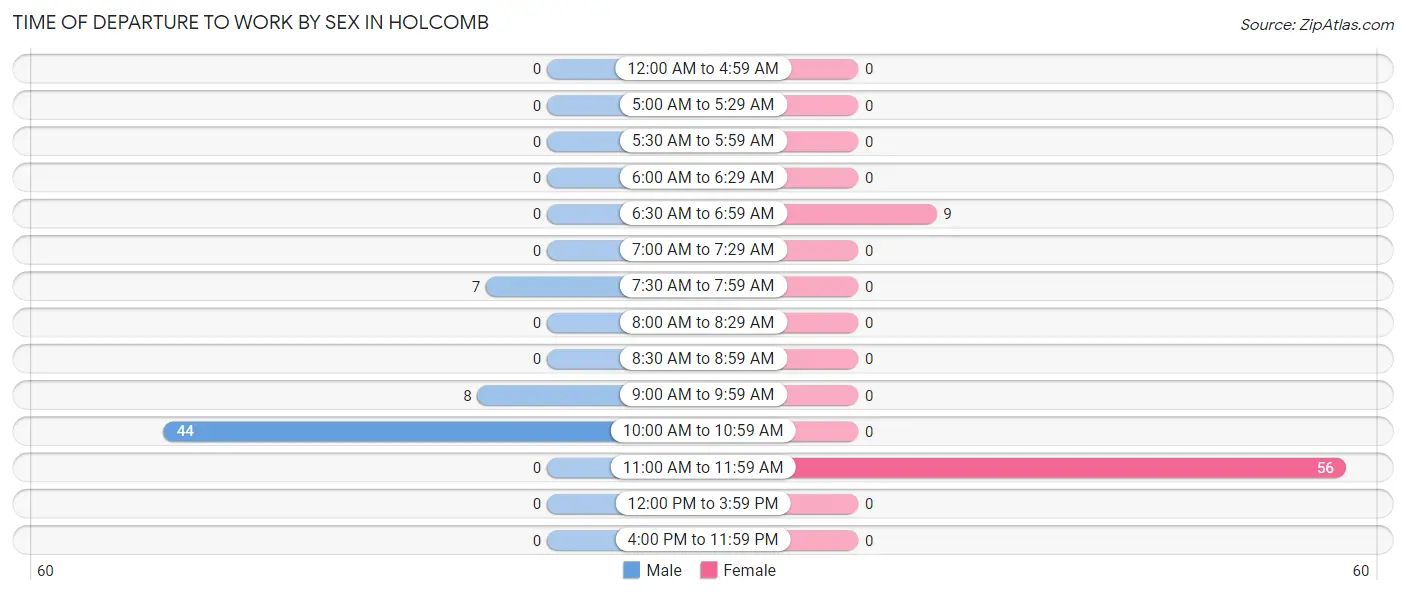
| Time of Departure | Male | Female |
| 12:00 AM to 4:59 AM | 0 (0.0%) | 0 (0.0%) |
| 5:00 AM to 5:29 AM | 0 (0.0%) | 0 (0.0%) |
| 5:30 AM to 5:59 AM | 0 (0.0%) | 0 (0.0%) |
| 6:00 AM to 6:29 AM | 0 (0.0%) | 0 (0.0%) |
| 6:30 AM to 6:59 AM | 0 (0.0%) | 9 (13.9%) |
| 7:00 AM to 7:29 AM | 0 (0.0%) | 0 (0.0%) |
| 7:30 AM to 7:59 AM | 7 (11.9%) | 0 (0.0%) |
| 8:00 AM to 8:29 AM | 0 (0.0%) | 0 (0.0%) |
| 8:30 AM to 8:59 AM | 0 (0.0%) | 0 (0.0%) |
| 9:00 AM to 9:59 AM | 8 (13.6%) | 0 (0.0%) |
| 10:00 AM to 10:59 AM | 44 (74.6%) | 0 (0.0%) |
| 11:00 AM to 11:59 AM | 0 (0.0%) | 56 (86.2%) |
| 12:00 PM to 3:59 PM | 0 (0.0%) | 0 (0.0%) |
| 4:00 PM to 11:59 PM | 0 (0.0%) | 0 (0.0%) |
| Total | 59 (100.0%) | 65 (100.0%) |
Housing Occupancy in Holcomb
Occupancy by Ownership in Holcomb
Of the total 82 dwellings in Holcomb, owner-occupied units account for 72 (87.8%), while renter-occupied units make up 10 (12.2%).
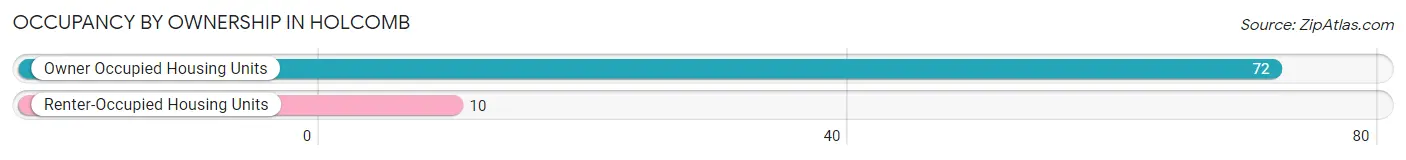
| Occupancy | # Housing Units | % Housing Units |
| Owner Occupied Housing Units | 72 | 87.8% |
| Renter-Occupied Housing Units | 10 | 12.2% |
| Total Occupied Housing Units | 82 | 100.0% |
Occupancy by Household Size in Holcomb
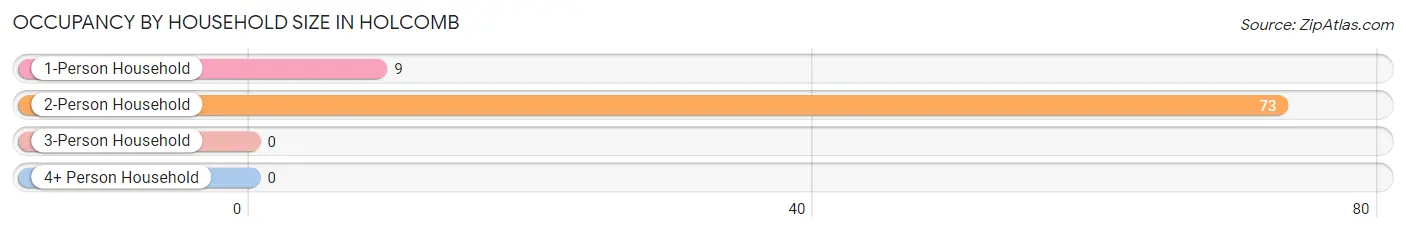
| Household Size | # Housing Units | % Housing Units |
| 1-Person Household | 9 | 11.0% |
| 2-Person Household | 73 | 89.0% |
| 3-Person Household | 0 | 0.0% |
| 4+ Person Household | 0 | 0.0% |
| Total Housing Units | 82 | 100.0% |
Occupancy by Ownership by Household Size in Holcomb
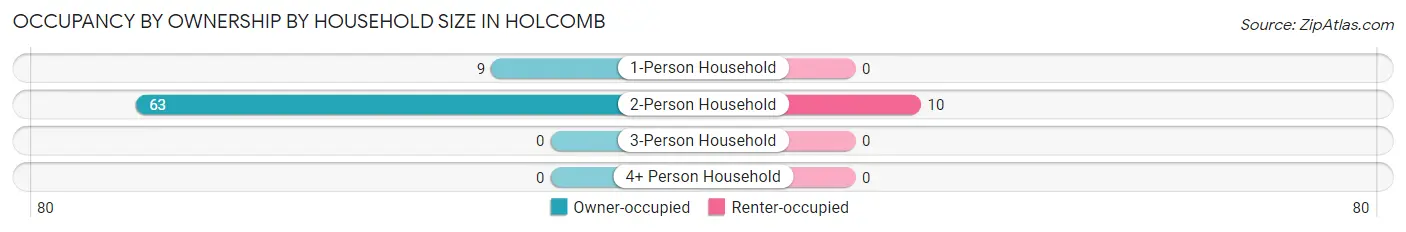
| Household Size | Owner-occupied | Renter-occupied |
| 1-Person Household | 9 (100.0%) | 0 (0.0%) |
| 2-Person Household | 63 (86.3%) | 10 (13.7%) |
| 3-Person Household | 0 (0.0%) | 0 (0.0%) |
| 4+ Person Household | 0 (0.0%) | 0 (0.0%) |
| Total Housing Units | 72 (87.8%) | 10 (12.2%) |
Occupancy by Educational Attainment in Holcomb
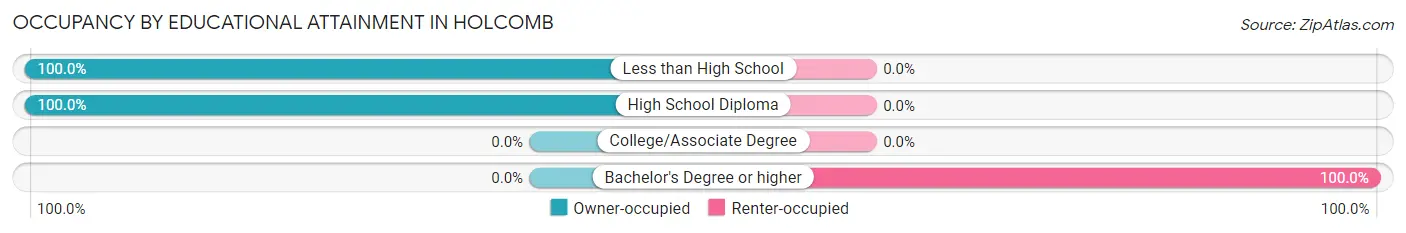
| Household Size | Owner-occupied | Renter-occupied |
| Less than High School | 9 (100.0%) | 0 (0.0%) |
| High School Diploma | 63 (100.0%) | 0 (0.0%) |
| College/Associate Degree | 0 (0.0%) | 0 (0.0%) |
| Bachelor's Degree or higher | 0 (0.0%) | 10 (100.0%) |
Occupancy by Age of Householder in Holcomb
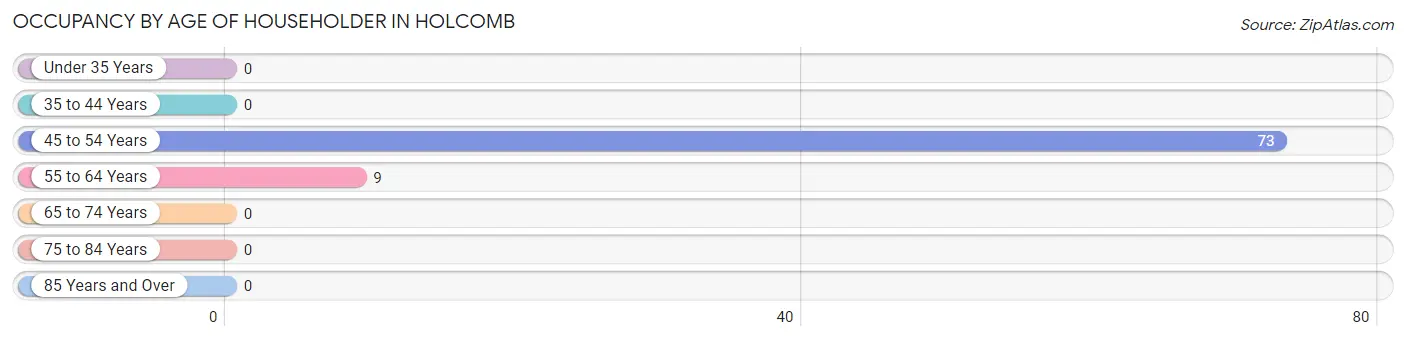
| Age Bracket | # Households | % Households |
| Under 35 Years | 0 | 0.0% |
| 35 to 44 Years | 0 | 0.0% |
| 45 to 54 Years | 73 | 89.0% |
| 55 to 64 Years | 9 | 11.0% |
| 65 to 74 Years | 0 | 0.0% |
| 75 to 84 Years | 0 | 0.0% |
| 85 Years and Over | 0 | 0.0% |
| Total | 82 | 100.0% |
Housing Finances in Holcomb
Median Income by Occupancy in Holcomb
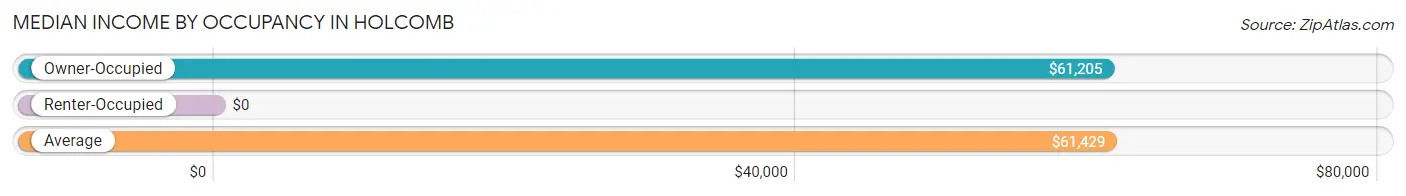
| Occupancy Type | # Households | Median Income |
| Owner-Occupied | 72 (87.8%) | $61,205 |
| Renter-Occupied | 10 (12.2%) | $0 |
| Average | 82 (100.0%) | $61,429 |
Occupancy by Householder Income Bracket in Holcomb
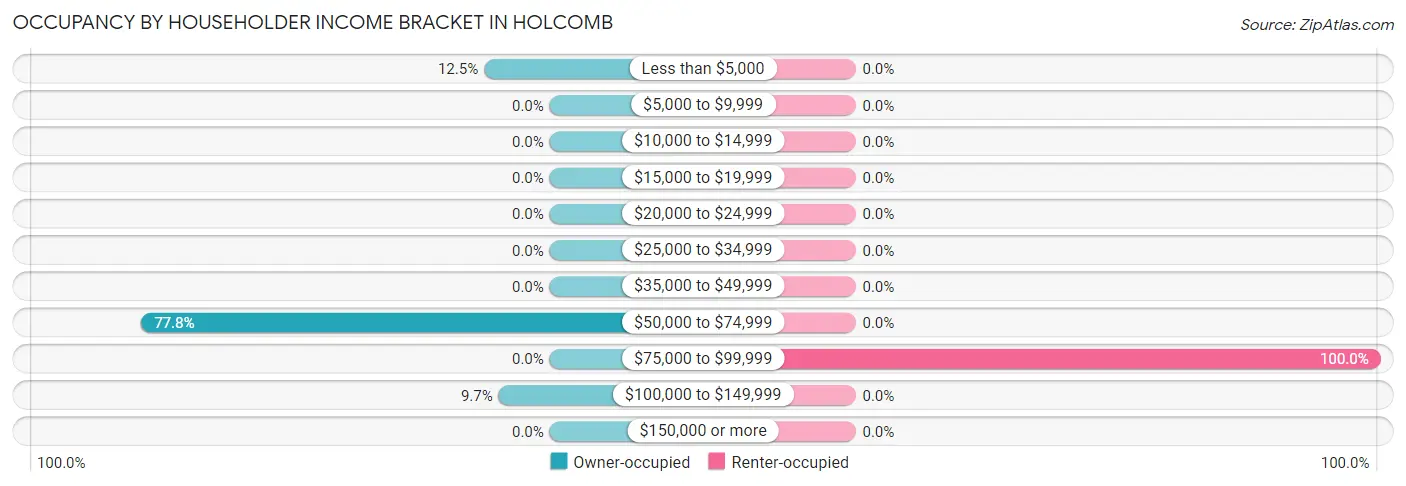
| Income Bracket | Owner-occupied | Renter-occupied |
| Less than $5,000 | 9 (12.5%) | 0 (0.0%) |
| $5,000 to $9,999 | 0 (0.0%) | 0 (0.0%) |
| $10,000 to $14,999 | 0 (0.0%) | 0 (0.0%) |
| $15,000 to $19,999 | 0 (0.0%) | 0 (0.0%) |
| $20,000 to $24,999 | 0 (0.0%) | 0 (0.0%) |
| $25,000 to $34,999 | 0 (0.0%) | 0 (0.0%) |
| $35,000 to $49,999 | 0 (0.0%) | 0 (0.0%) |
| $50,000 to $74,999 | 56 (77.8%) | 0 (0.0%) |
| $75,000 to $99,999 | 0 (0.0%) | 10 (100.0%) |
| $100,000 to $149,999 | 7 (9.7%) | 0 (0.0%) |
| $150,000 or more | 0 (0.0%) | 0 (0.0%) |
| Total | 72 (100.0%) | 10 (100.0%) |
Monthly Housing Cost Tiers in Holcomb
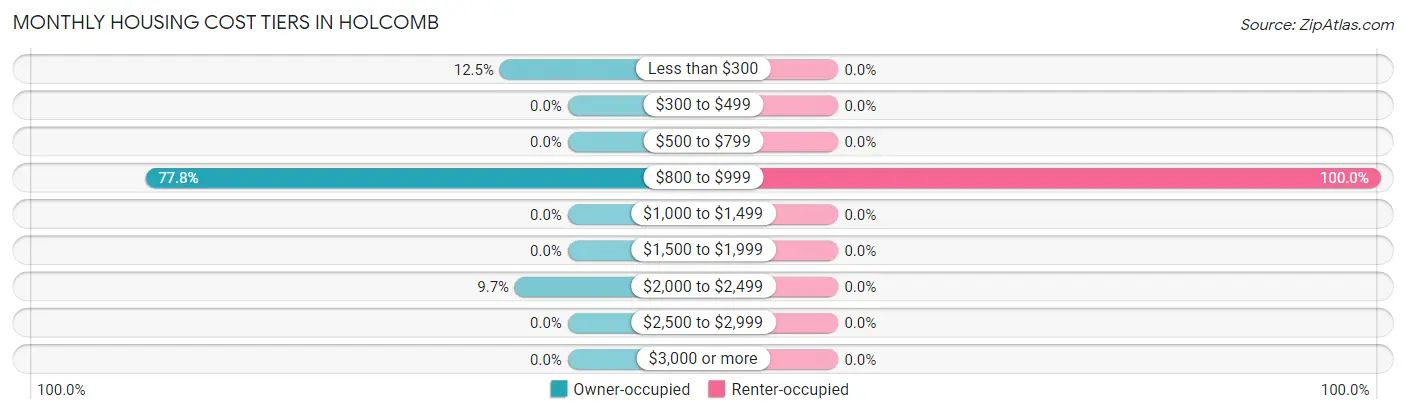
| Monthly Cost | Owner-occupied | Renter-occupied |
| Less than $300 | 9 (12.5%) | 0 (0.0%) |
| $300 to $499 | 0 (0.0%) | 0 (0.0%) |
| $500 to $799 | 0 (0.0%) | 0 (0.0%) |
| $800 to $999 | 56 (77.8%) | 10 (100.0%) |
| $1,000 to $1,499 | 0 (0.0%) | 0 (0.0%) |
| $1,500 to $1,999 | 0 (0.0%) | 0 (0.0%) |
| $2,000 to $2,499 | 7 (9.7%) | 0 (0.0%) |
| $2,500 to $2,999 | 0 (0.0%) | 0 (0.0%) |
| $3,000 or more | 0 (0.0%) | 0 (0.0%) |
| Total | 72 (100.0%) | 10 (100.0%) |
Physical Housing Characteristics in Holcomb
Housing Structures in Holcomb
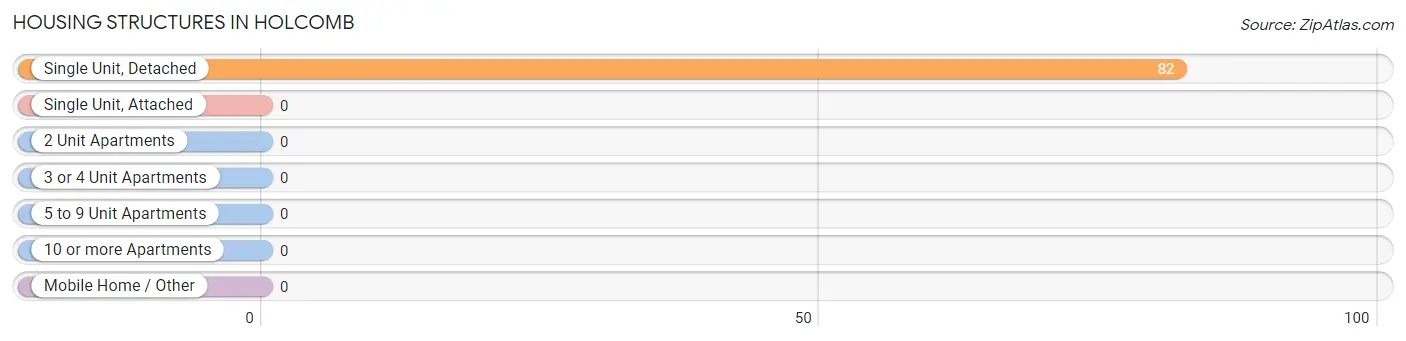
| Structure Type | # Housing Units | % Housing Units |
| Single Unit, Detached | 82 | 100.0% |
| Single Unit, Attached | 0 | 0.0% |
| 2 Unit Apartments | 0 | 0.0% |
| 3 or 4 Unit Apartments | 0 | 0.0% |
| 5 to 9 Unit Apartments | 0 | 0.0% |
| 10 or more Apartments | 0 | 0.0% |
| Mobile Home / Other | 0 | 0.0% |
| Total | 82 | 100.0% |
Housing Structures by Occupancy in Holcomb
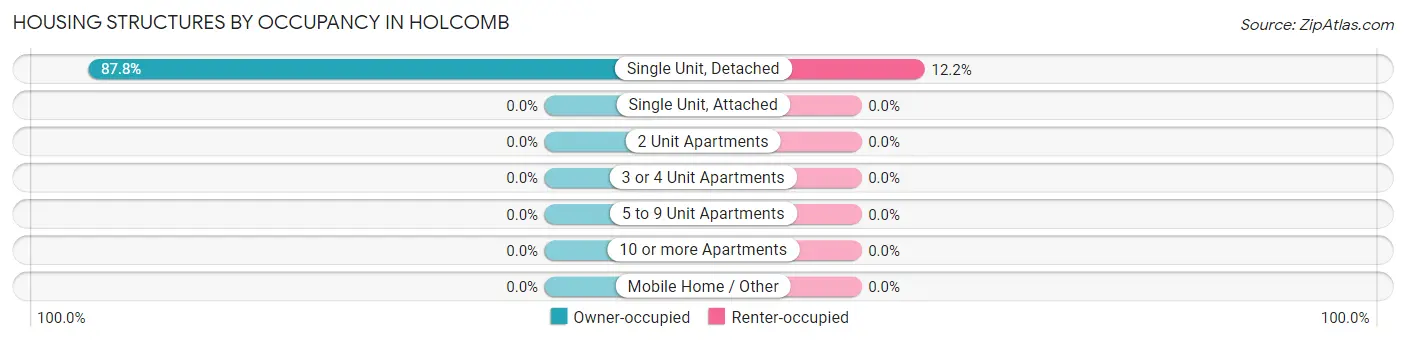
| Structure Type | Owner-occupied | Renter-occupied |
| Single Unit, Detached | 72 (87.8%) | 10 (12.2%) |
| Single Unit, Attached | 0 (0.0%) | 0 (0.0%) |
| 2 Unit Apartments | 0 (0.0%) | 0 (0.0%) |
| 3 or 4 Unit Apartments | 0 (0.0%) | 0 (0.0%) |
| 5 to 9 Unit Apartments | 0 (0.0%) | 0 (0.0%) |
| 10 or more Apartments | 0 (0.0%) | 0 (0.0%) |
| Mobile Home / Other | 0 (0.0%) | 0 (0.0%) |
| Total | 72 (87.8%) | 10 (12.2%) |
Housing Structures by Number of Rooms in Holcomb
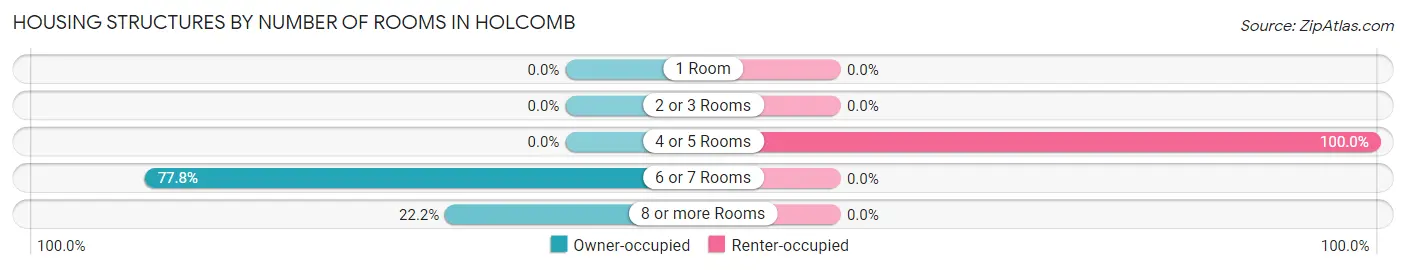
| Number of Rooms | Owner-occupied | Renter-occupied |
| 1 Room | 0 (0.0%) | 0 (0.0%) |
| 2 or 3 Rooms | 0 (0.0%) | 0 (0.0%) |
| 4 or 5 Rooms | 0 (0.0%) | 10 (100.0%) |
| 6 or 7 Rooms | 56 (77.8%) | 0 (0.0%) |
| 8 or more Rooms | 16 (22.2%) | 0 (0.0%) |
| Total | 72 (100.0%) | 10 (100.0%) |
Housing Structure by Heating Type in Holcomb
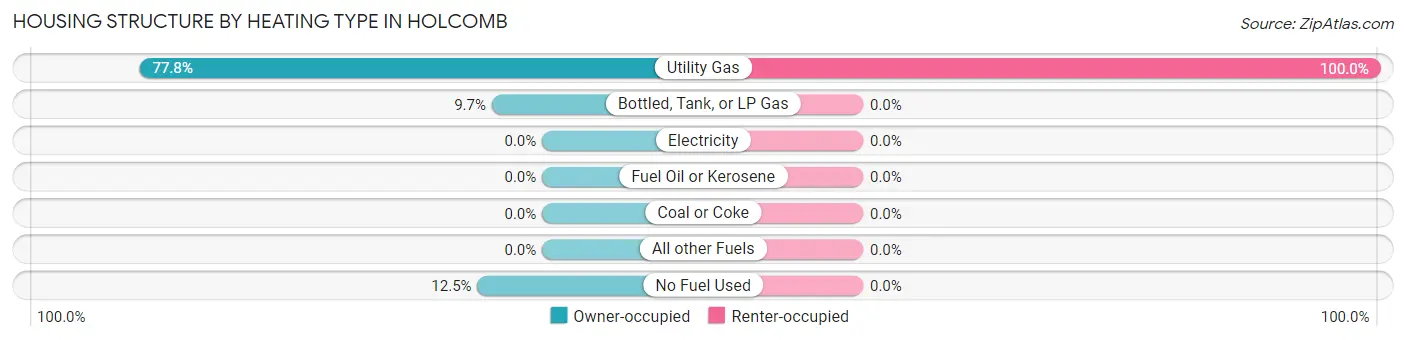
| Heating Type | Owner-occupied | Renter-occupied |
| Utility Gas | 56 (77.8%) | 10 (100.0%) |
| Bottled, Tank, or LP Gas | 7 (9.7%) | 0 (0.0%) |
| Electricity | 0 (0.0%) | 0 (0.0%) |
| Fuel Oil or Kerosene | 0 (0.0%) | 0 (0.0%) |
| Coal or Coke | 0 (0.0%) | 0 (0.0%) |
| All other Fuels | 0 (0.0%) | 0 (0.0%) |
| No Fuel Used | 9 (12.5%) | 0 (0.0%) |
| Total | 72 (100.0%) | 10 (100.0%) |
Household Vehicle Usage in Holcomb
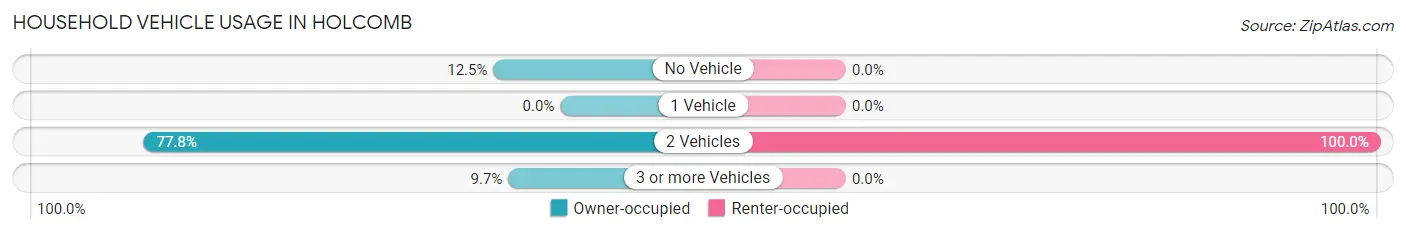
| Vehicles per Household | Owner-occupied | Renter-occupied |
| No Vehicle | 9 (12.5%) | 0 (0.0%) |
| 1 Vehicle | 0 (0.0%) | 0 (0.0%) |
| 2 Vehicles | 56 (77.8%) | 10 (100.0%) |
| 3 or more Vehicles | 7 (9.7%) | 0 (0.0%) |
| Total | 72 (100.0%) | 10 (100.0%) |
Real Estate & Mortgages in Holcomb
Real Estate and Mortgage Overview in Holcomb
| Characteristic | Without Mortgage | With Mortgage |
| Housing Units | 9 | 63 |
| Median Property Value | - | - |
| Median Household Income | - | - |
| Monthly Housing Costs | - | - |
| Real Estate Taxes | - | - |
Property Value by Mortgage Status in Holcomb
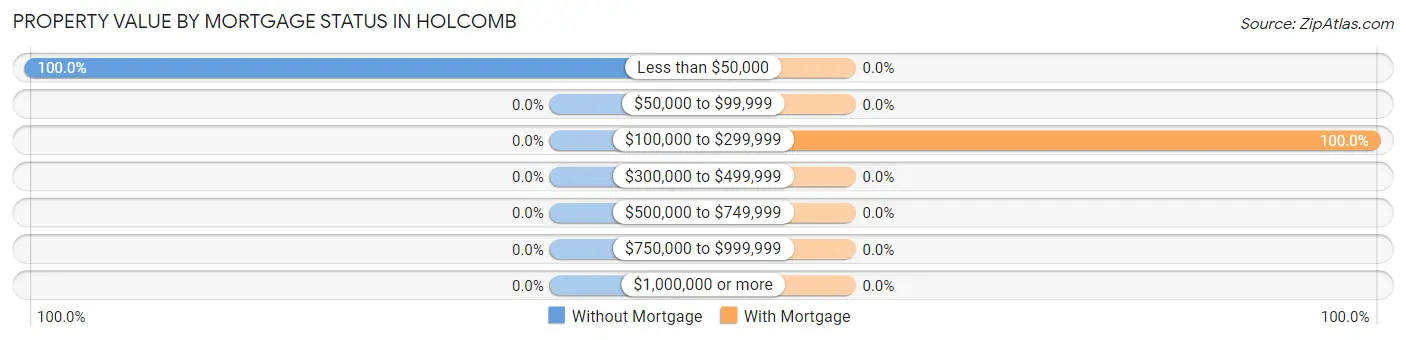
| Property Value | Without Mortgage | With Mortgage |
| Less than $50,000 | 9 (100.0%) | 0 (0.0%) |
| $50,000 to $99,999 | 0 (0.0%) | 0 (0.0%) |
| $100,000 to $299,999 | 0 (0.0%) | 63 (100.0%) |
| $300,000 to $499,999 | 0 (0.0%) | 0 (0.0%) |
| $500,000 to $749,999 | 0 (0.0%) | 0 (0.0%) |
| $750,000 to $999,999 | 0 (0.0%) | 0 (0.0%) |
| $1,000,000 or more | 0 (0.0%) | 0 (0.0%) |
| Total | 9 (100.0%) | 63 (100.0%) |
Household Income by Mortgage Status in Holcomb
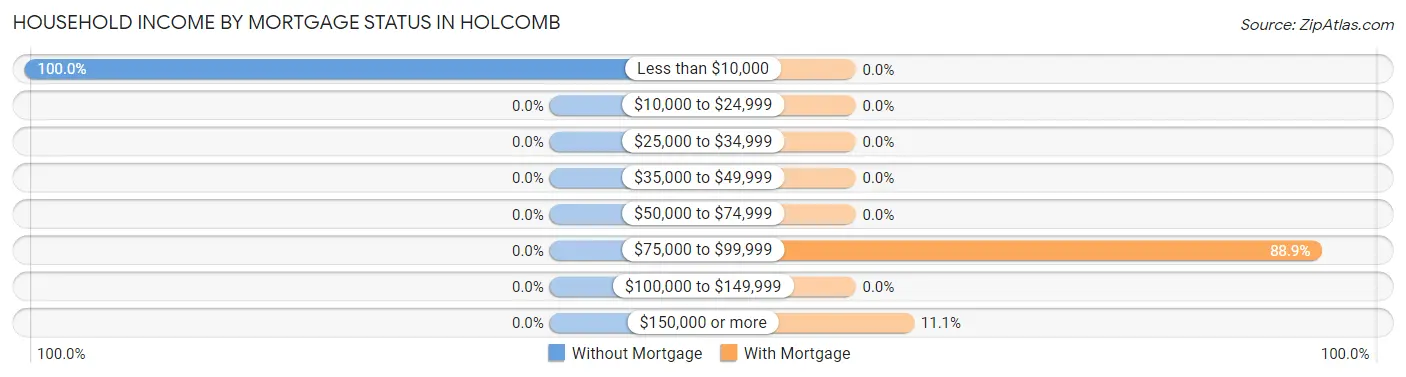
| Household Income | Without Mortgage | With Mortgage |
| Less than $10,000 | 9 (100.0%) | 0 (0.0%) |
| $10,000 to $24,999 | 0 (0.0%) | 0 (0.0%) |
| $25,000 to $34,999 | 0 (0.0%) | 0 (0.0%) |
| $35,000 to $49,999 | 0 (0.0%) | 0 (0.0%) |
| $50,000 to $74,999 | 0 (0.0%) | 0 (0.0%) |
| $75,000 to $99,999 | 0 (0.0%) | 56 (88.9%) |
| $100,000 to $149,999 | 0 (0.0%) | 0 (0.0%) |
| $150,000 or more | 0 (0.0%) | 7 (11.1%) |
| Total | 9 (100.0%) | 63 (100.0%) |
Property Value to Household Income Ratio in Holcomb
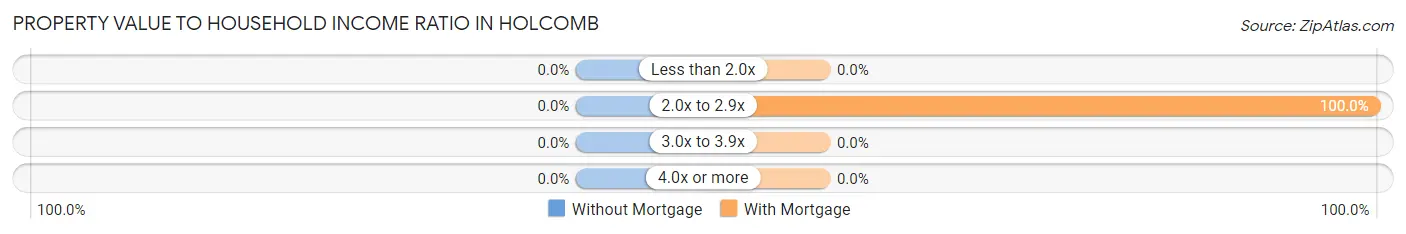
| Value-to-Income Ratio | Without Mortgage | With Mortgage |
| Less than 2.0x | 0 (0.0%) | 0 (0.0%) |
| 2.0x to 2.9x | 0 (0.0%) | 63 (100.0%) |
| 3.0x to 3.9x | 0 (0.0%) | 0 (0.0%) |
| 4.0x or more | 0 (0.0%) | 0 (0.0%) |
| Total | 9 (100.0%) | 63 (100.0%) |
Real Estate Taxes by Mortgage Status in Holcomb
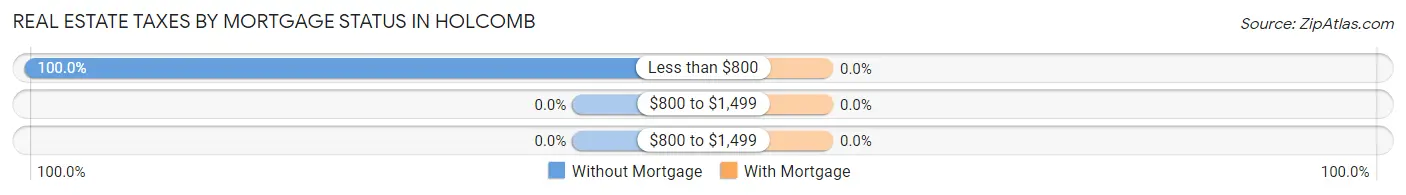
| Property Taxes | Without Mortgage | With Mortgage |
| Less than $800 | 9 (100.0%) | 0 (0.0%) |
| $800 to $1,499 | 0 (0.0%) | 0 (0.0%) |
| $800 to $1,499 | 0 (0.0%) | 0 (0.0%) |
| Total | 9 (100.0%) | 63 (100.0%) |
Health & Disability in Holcomb
Health Insurance Coverage by Age in Holcomb
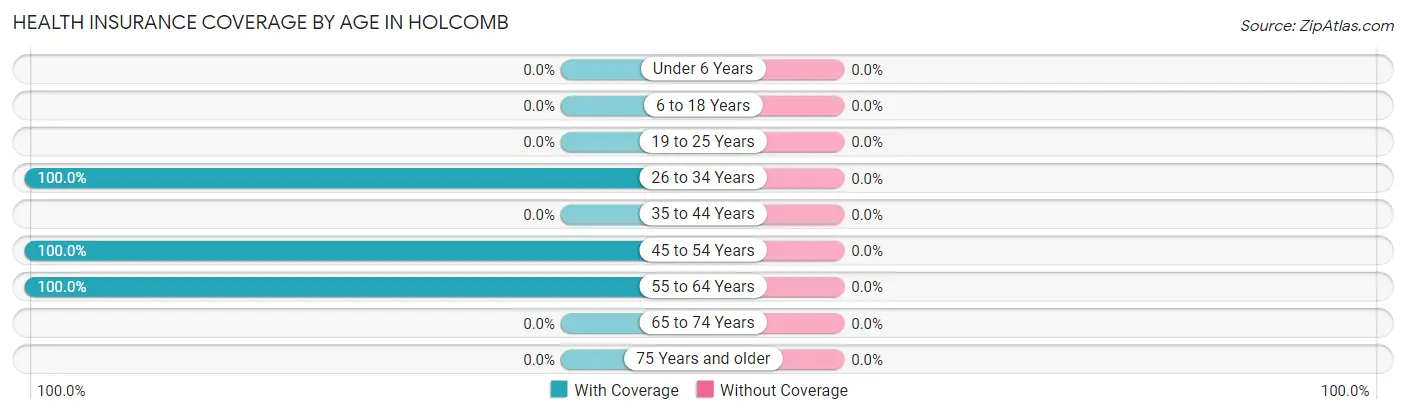
| Age Bracket | With Coverage | Without Coverage |
| Under 6 Years | 0 (0.0%) | 0 (0.0%) |
| 6 to 18 Years | 0 (0.0%) | 0 (0.0%) |
| 19 to 25 Years | 0 (0.0%) | 0 (0.0%) |
| 26 to 34 Years | 44 (100.0%) | 0 (0.0%) |
| 35 to 44 Years | 0 (0.0%) | 0 (0.0%) |
| 45 to 54 Years | 82 (100.0%) | 0 (0.0%) |
| 55 to 64 Years | 17 (100.0%) | 0 (0.0%) |
| 65 to 74 Years | 0 (0.0%) | 0 (0.0%) |
| 75 Years and older | 0 (0.0%) | 0 (0.0%) |
| Total | 143 (100.0%) | 0 (0.0%) |
Health Insurance Coverage by Citizenship Status in Holcomb
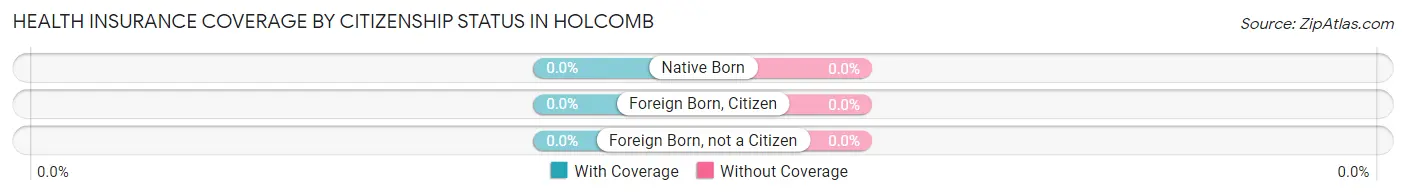
| Citizenship Status | With Coverage | Without Coverage |
| Native Born | 0 (0.0%) | 0 (0.0%) |
| Foreign Born, Citizen | 0 (0.0%) | 0 (0.0%) |
| Foreign Born, not a Citizen | 0 (0.0%) | 0 (0.0%) |
Health Insurance Coverage by Household Income in Holcomb
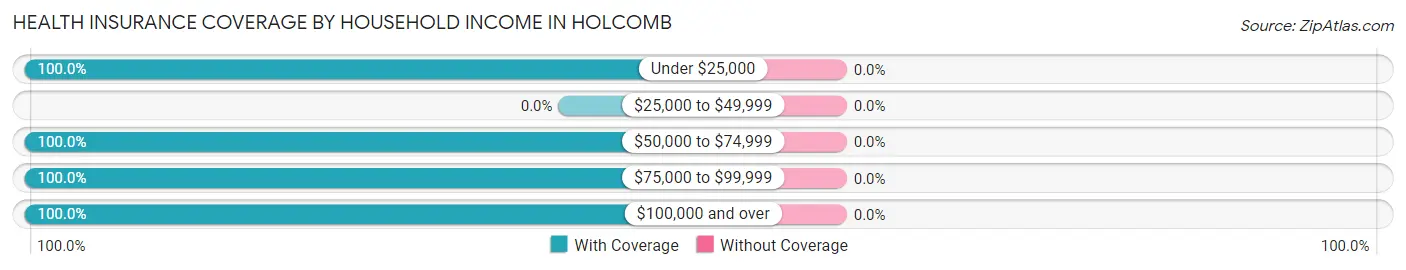
| Household Income | With Coverage | Without Coverage |
| Under $25,000 | 9 (100.0%) | 0 (0.0%) |
| $25,000 to $49,999 | 0 (0.0%) | 0 (0.0%) |
| $50,000 to $74,999 | 100 (100.0%) | 0 (0.0%) |
| $75,000 to $99,999 | 18 (100.0%) | 0 (0.0%) |
| $100,000 and over | 16 (100.0%) | 0 (0.0%) |
Public vs Private Health Insurance Coverage by Age in Holcomb
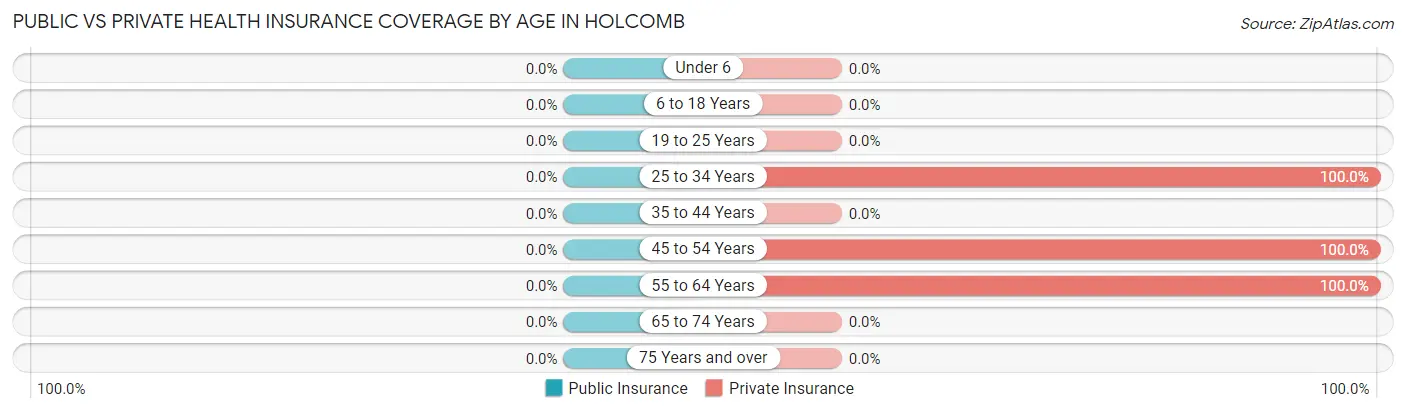
| Age Bracket | Public Insurance | Private Insurance |
| Under 6 | 0 (0.0%) | 0 (0.0%) |
| 6 to 18 Years | 0 (0.0%) | 0 (0.0%) |
| 19 to 25 Years | 0 (0.0%) | 0 (0.0%) |
| 25 to 34 Years | 0 (0.0%) | 44 (100.0%) |
| 35 to 44 Years | 0 (0.0%) | 0 (0.0%) |
| 45 to 54 Years | 0 (0.0%) | 82 (100.0%) |
| 55 to 64 Years | 0 (0.0%) | 17 (100.0%) |
| 65 to 74 Years | 0 (0.0%) | 0 (0.0%) |
| 75 Years and over | 0 (0.0%) | 0 (0.0%) |
| Total | 0 (0.0%) | 143 (100.0%) |
Disability Status by Sex by Age in Holcomb
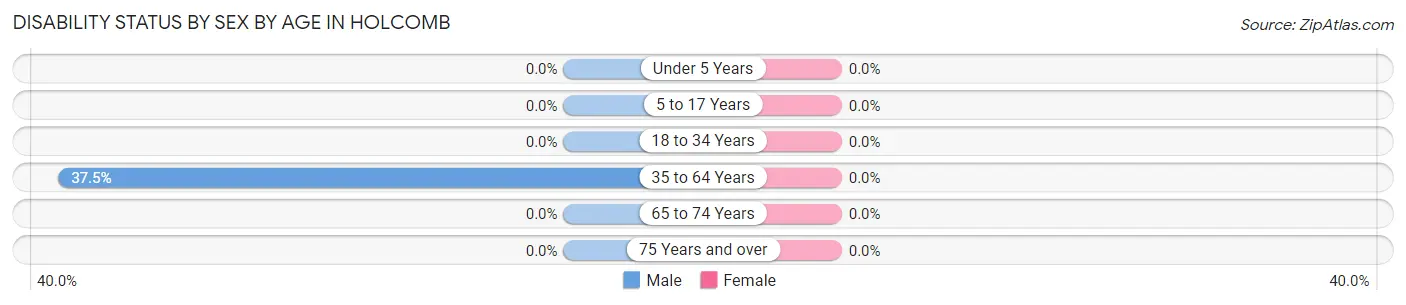
| Age Bracket | Male | Female |
| Under 5 Years | 0 (0.0%) | 0 (0.0%) |
| 5 to 17 Years | 0 (0.0%) | 0 (0.0%) |
| 18 to 34 Years | 0 (0.0%) | 0 (0.0%) |
| 35 to 64 Years | 9 (37.5%) | 0 (0.0%) |
| 65 to 74 Years | 0 (0.0%) | 0 (0.0%) |
| 75 Years and over | 0 (0.0%) | 0 (0.0%) |
Disability Class by Sex by Age in Holcomb
Disability Class: Hearing Difficulty
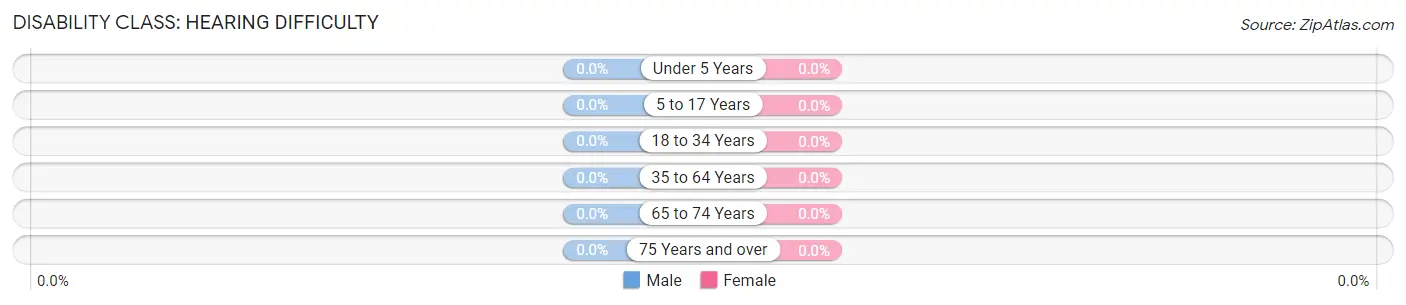
| Age Bracket | Male | Female |
| Under 5 Years | 0 (0.0%) | 0 (0.0%) |
| 5 to 17 Years | 0 (0.0%) | 0 (0.0%) |
| 18 to 34 Years | 0 (0.0%) | 0 (0.0%) |
| 35 to 64 Years | 0 (0.0%) | 0 (0.0%) |
| 65 to 74 Years | 0 (0.0%) | 0 (0.0%) |
| 75 Years and over | 0 (0.0%) | 0 (0.0%) |
Disability Class: Vision Difficulty
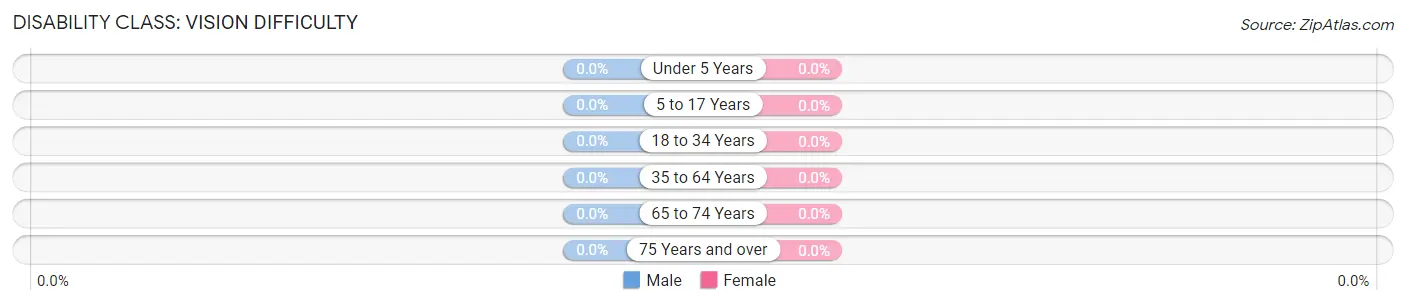
| Age Bracket | Male | Female |
| Under 5 Years | 0 (0.0%) | 0 (0.0%) |
| 5 to 17 Years | 0 (0.0%) | 0 (0.0%) |
| 18 to 34 Years | 0 (0.0%) | 0 (0.0%) |
| 35 to 64 Years | 0 (0.0%) | 0 (0.0%) |
| 65 to 74 Years | 0 (0.0%) | 0 (0.0%) |
| 75 Years and over | 0 (0.0%) | 0 (0.0%) |
Disability Class: Cognitive Difficulty
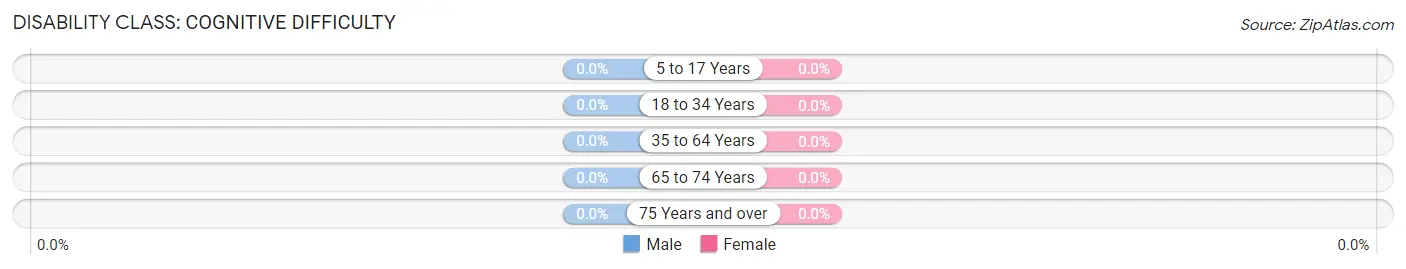
| Age Bracket | Male | Female |
| 5 to 17 Years | 0 (0.0%) | 0 (0.0%) |
| 18 to 34 Years | 0 (0.0%) | 0 (0.0%) |
| 35 to 64 Years | 0 (0.0%) | 0 (0.0%) |
| 65 to 74 Years | 0 (0.0%) | 0 (0.0%) |
| 75 Years and over | 0 (0.0%) | 0 (0.0%) |
Disability Class: Ambulatory Difficulty
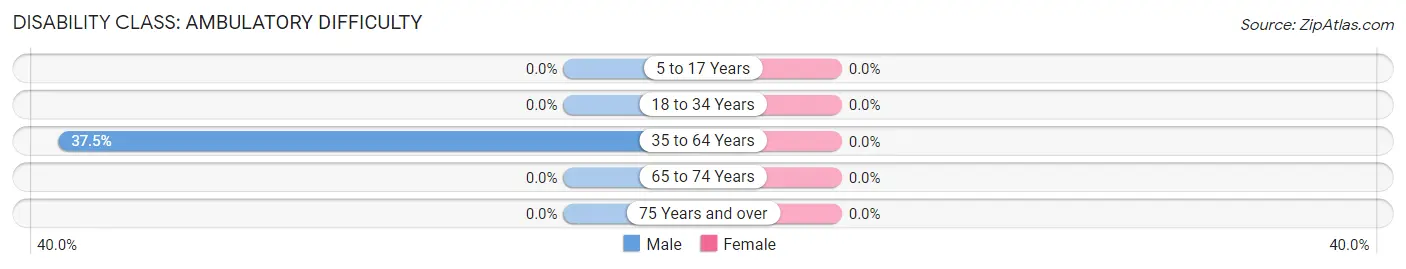
| Age Bracket | Male | Female |
| 5 to 17 Years | 0 (0.0%) | 0 (0.0%) |
| 18 to 34 Years | 0 (0.0%) | 0 (0.0%) |
| 35 to 64 Years | 9 (37.5%) | 0 (0.0%) |
| 65 to 74 Years | 0 (0.0%) | 0 (0.0%) |
| 75 Years and over | 0 (0.0%) | 0 (0.0%) |
Disability Class: Self-Care Difficulty
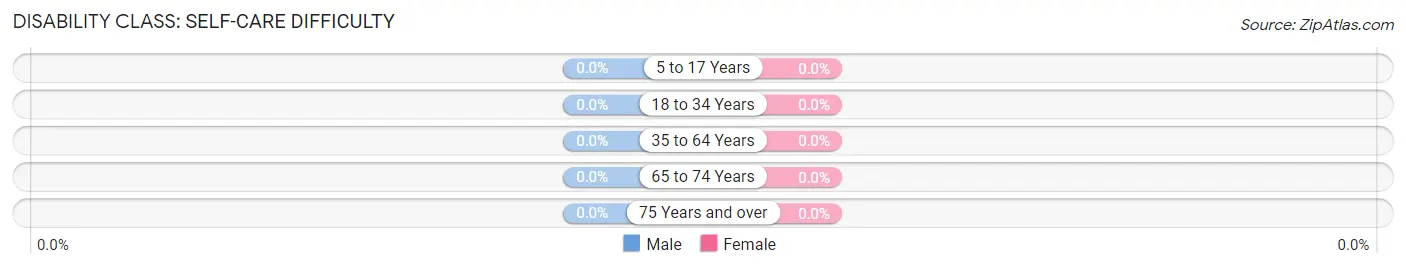
| Age Bracket | Male | Female |
| 5 to 17 Years | 0 (0.0%) | 0 (0.0%) |
| 18 to 34 Years | 0 (0.0%) | 0 (0.0%) |
| 35 to 64 Years | 0 (0.0%) | 0 (0.0%) |
| 65 to 74 Years | 0 (0.0%) | 0 (0.0%) |
| 75 Years and over | 0 (0.0%) | 0 (0.0%) |
Technology Access in Holcomb
Computing Device Access in Holcomb
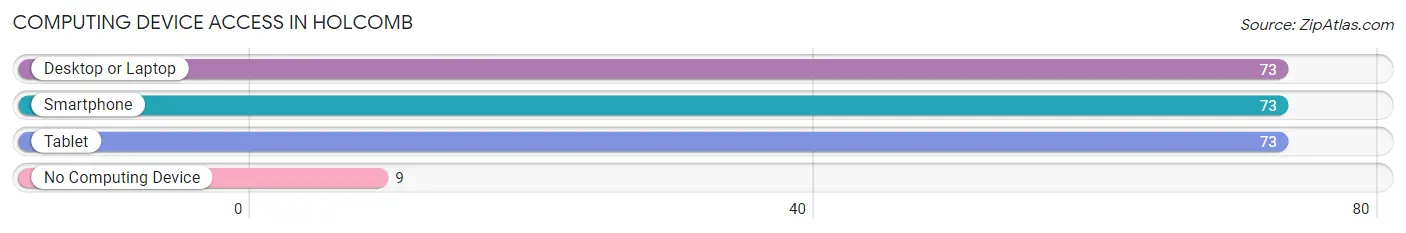
| Device Type | # Households | % Households |
| Desktop or Laptop | 73 | 89.0% |
| Smartphone | 73 | 89.0% |
| Tablet | 73 | 89.0% |
| No Computing Device | 9 | 11.0% |
| Total | 82 | 100.0% |
Internet Access in Holcomb
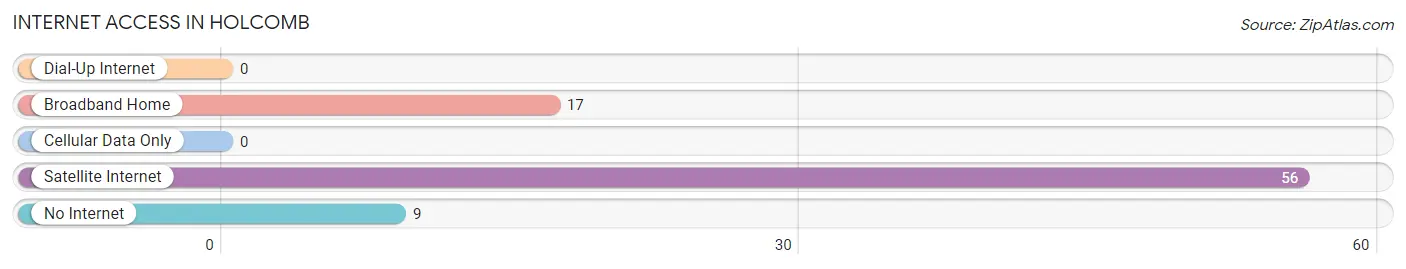
| Internet Type | # Households | % Households |
| Dial-Up Internet | 0 | 0.0% |
| Broadband Home | 17 | 20.7% |
| Cellular Data Only | 0 | 0.0% |
| Satellite Internet | 56 | 68.3% |
| No Internet | 9 | 11.0% |
| Total | 82 | 100.0% |
Holcomb Summary
Holcomb, Mississippi is a small town located in the northwest corner of the state, near the Mississippi-Tennessee border. It is part of the DeSoto County School District and is home to approximately 1,000 people. The town was founded in 1837 and has a rich history of agriculture, industry, and education.
Geography
Holcomb is located in the northwest corner of Mississippi, near the Mississippi-Tennessee border. It is situated in the foothills of the Appalachian Mountains and is surrounded by rolling hills and forests. The town is located on the banks of the Hatchie River, which is a tributary of the Mississippi River. The town is approximately 30 miles from Memphis, Tennessee and is accessible by US Highway 78.
Economy
Holcomb’s economy is largely based on agriculture and manufacturing. The town is home to several farms, which produce a variety of crops, including cotton, soybeans, corn, and wheat. The town also has several manufacturing plants, which produce a variety of products, including furniture, textiles, and automotive parts.
In addition to agriculture and manufacturing, Holcomb is home to several small businesses, including restaurants, retail stores, and service providers. The town also has a few tourist attractions, including the Hatchie National Wildlife Refuge and the Holcomb Historical Museum.
Demographics
As of the 2010 census, Holcomb had a population of 1,000 people. The racial makeup of the town was 97.2% White, 0.7% African American, 0.3% Native American, 0.2% Asian, and 1.6% from other races. The median household income was $37,500, and the median age was 38.
Education
Holcomb is part of the DeSoto County School District. The town is home to one elementary school, one middle school, and one high school. The town also has a public library and a community college.
Conclusion
Holcomb, Mississippi is a small town located in the northwest corner of the state, near the Mississippi-Tennessee border. It is part of the DeSoto County School District and is home to approximately 1,000 people. The town has a rich history of agriculture, industry, and education, and its economy is largely based on agriculture and manufacturing. The town is also home to several small businesses, tourist attractions, and educational institutions. The racial makeup of the town is predominantly White, with a small percentage of African American, Native American, and Asian residents.
Common Questions
What is Per Capita Income in Holcomb?
Per Capita income in Holcomb is $32,409.
What is the Median Family Income in Holcomb?
Median Family Income in Holcomb is $61,629.
What is the Median Household income in Holcomb?
Median Household Income in Holcomb is $61,429.
What is Inequality or Gini Index in Holcomb?
Inequality or Gini Index in Holcomb is 0.23.
What is the Total Population of Holcomb?
Total Population of Holcomb is 143.
What is the Total Male Population of Holcomb?
Total Male Population of Holcomb is 68.
What is the Total Female Population of Holcomb?
Total Female Population of Holcomb is 75.
What is the Ratio of Males per 100 Females in Holcomb?
There are 90.67 Males per 100 Females in Holcomb.
What is the Ratio of Females per 100 Males in Holcomb?
There are 110.29 Females per 100 Males in Holcomb.
What is the Median Population Age in Holcomb?
Median Population Age in Holcomb is 49.2 Years.
What is the Average Family Size in Holcomb
Average Family Size in Holcomb is 1.8 People.
What is the Average Household Size in Holcomb
Average Household Size in Holcomb is 1.7 People.
How Large is the Labor Force in Holcomb?
There are 124 People in the Labor Forcein in Holcomb.
What is the Percentage of People in the Labor Force in Holcomb?
86.7% of People are in the Labor Force in Holcomb.