Silver City, MS Map & Demographics
Silver City Map
Silver City Overview
$24,288
PER CAPITA INCOME
$53,750
AVG FAMILY INCOME
0.58
INEQUALITY / GINI INDEX
201
TOTAL POPULATION
93
MALE POPULATION
108
FEMALE POPULATION
86.11
MALES / 100 FEMALES
116.13
FEMALES / 100 MALES
57.0
MEDIAN AGE
2.9
AVG FAMILY SIZE
2.1
AVG HOUSEHOLD SIZE
81
LABOR FORCE [ PEOPLE ]
47.1%
PERCENT IN LABOR FORCE
2.5%
UNEMPLOYMENT RATE
Silver City Zip Codes
Income in Silver City
Income Overview in Silver City
| Characteristic | Number | Measure |
| Per Capita Income | 201 | $24,288 |
| Median Family Income | 52 | $53,750 |
| Mean Family Income | 52 | $67,250 |
| Median Household Income | 94 | $0 |
| Mean Household Income | 94 | $46,481 |
| Income Deficit | 52 | $0 |
| Wage / Income Gap (%) | 201 | 0.00% |
| Wage / Income Gap ($) | 201 | 100.00¢ per $1 |
| Gini / Inequality Index | 201 | 0.58 |
Earnings by Sex in Silver City
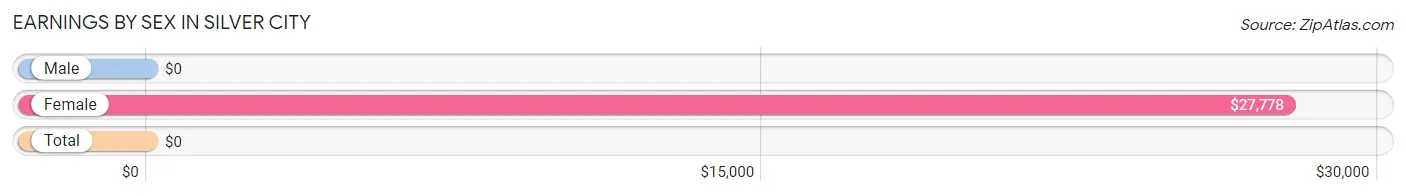
| Sex | Number | Average Earnings |
| Male | 42 (45.7%) | $0 |
| Female | 50 (54.3%) | $27,778 |
| Total | 92 (100.0%) | $0 |
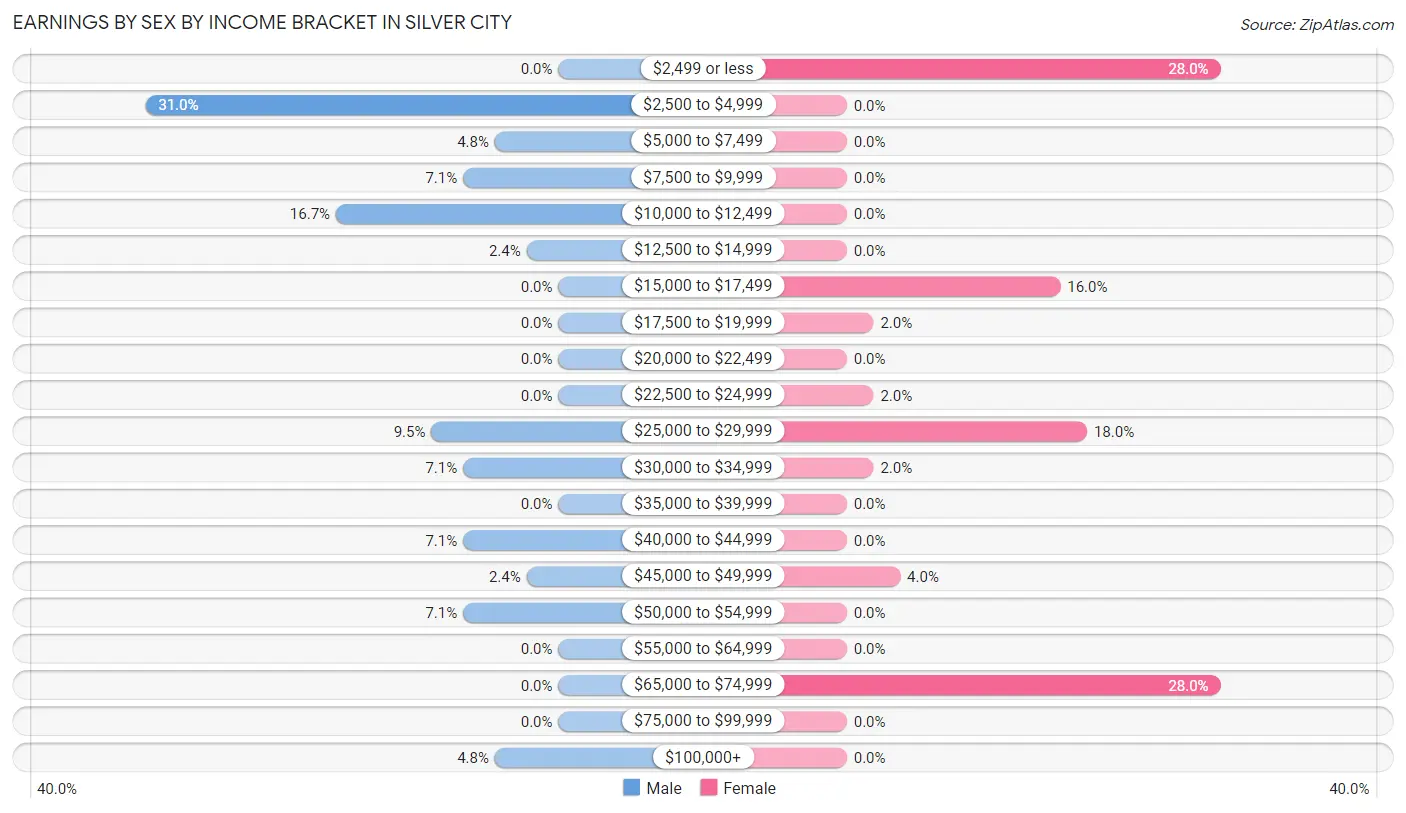
Earnings by Sex by Income Bracket in Silver City
The most common earnings brackets in Silver City are $2,500 to $4,999 for men (13 | 30.9%) and $2,499 or less for women (14 | 28.0%).
| Income | Male | Female |
| $2,499 or less | 0 (0.0%) | 14 (28.0%) |
| $2,500 to $4,999 | 13 (30.9%) | 0 (0.0%) |
| $5,000 to $7,499 | 2 (4.8%) | 0 (0.0%) |
| $7,500 to $9,999 | 3 (7.1%) | 0 (0.0%) |
| $10,000 to $12,499 | 7 (16.7%) | 0 (0.0%) |
| $12,500 to $14,999 | 1 (2.4%) | 0 (0.0%) |
| $15,000 to $17,499 | 0 (0.0%) | 8 (16.0%) |
| $17,500 to $19,999 | 0 (0.0%) | 1 (2.0%) |
| $20,000 to $22,499 | 0 (0.0%) | 0 (0.0%) |
| $22,500 to $24,999 | 0 (0.0%) | 1 (2.0%) |
| $25,000 to $29,999 | 4 (9.5%) | 9 (18.0%) |
| $30,000 to $34,999 | 3 (7.1%) | 1 (2.0%) |
| $35,000 to $39,999 | 0 (0.0%) | 0 (0.0%) |
| $40,000 to $44,999 | 3 (7.1%) | 0 (0.0%) |
| $45,000 to $49,999 | 1 (2.4%) | 2 (4.0%) |
| $50,000 to $54,999 | 3 (7.1%) | 0 (0.0%) |
| $55,000 to $64,999 | 0 (0.0%) | 0 (0.0%) |
| $65,000 to $74,999 | 0 (0.0%) | 14 (28.0%) |
| $75,000 to $99,999 | 0 (0.0%) | 0 (0.0%) |
| $100,000+ | 2 (4.8%) | 0 (0.0%) |
| Total | 42 (100.0%) | 50 (100.0%) |
Earnings by Sex by Educational Attainment in Silver City
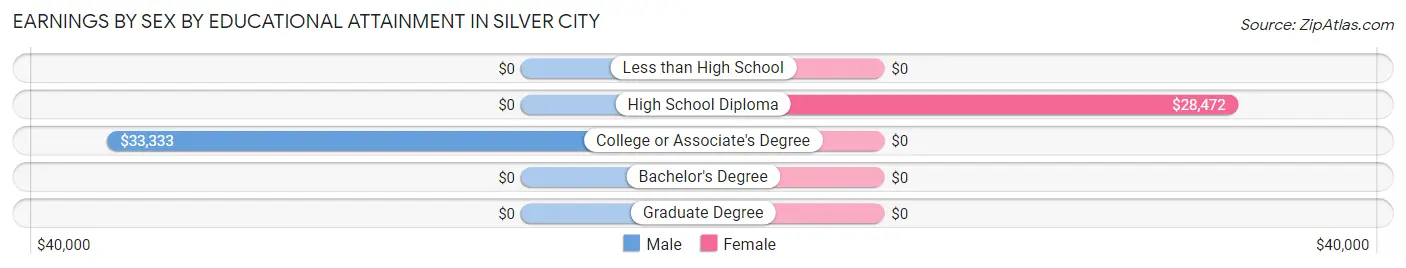
| Educational Attainment | Male Income | Female Income |
| Less than High School | - | - |
| High School Diploma | - | - |
| College or Associate's Degree | $33,333 | $0 |
| Bachelor's Degree | - | - |
| Graduate Degree | - | - |
| Total | - | - |
Family Income in Silver City
Family Income Brackets in Silver City
According to the Silver City family income data, there are 14 families falling into the $75,000 to $99,999 income range, which is the most common income bracket and makes up 26.9% of all families.
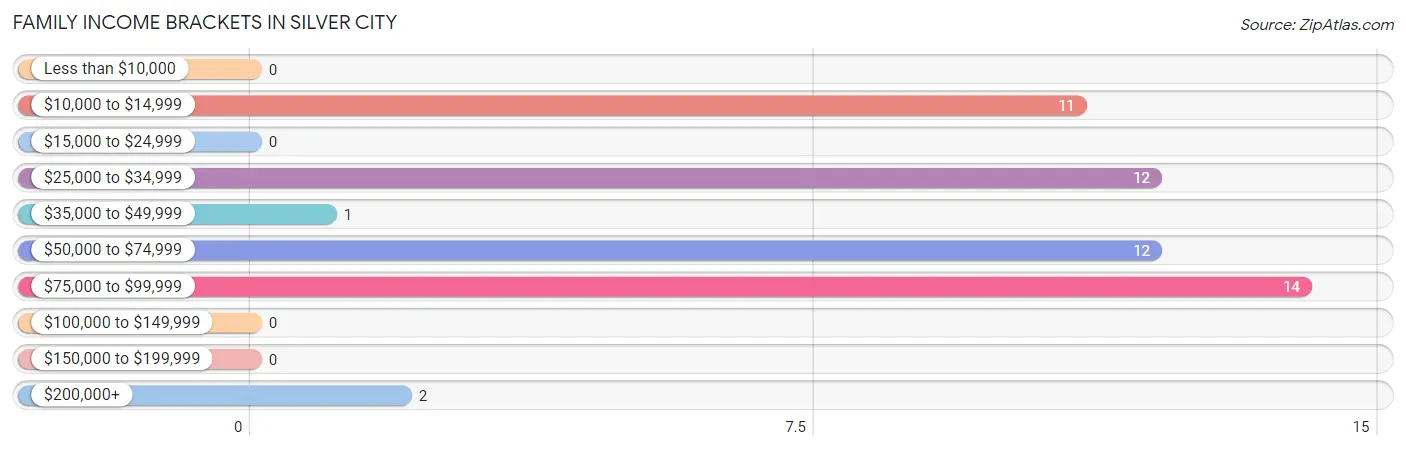
| Income Bracket | # Families | % Families |
| Less than $10,000 | 0 | 0.0% |
| $10,000 to $14,999 | 11 | 21.2% |
| $15,000 to $24,999 | 0 | 0.0% |
| $25,000 to $34,999 | 12 | 23.1% |
| $35,000 to $49,999 | 1 | 1.9% |
| $50,000 to $74,999 | 12 | 23.1% |
| $75,000 to $99,999 | 14 | 26.9% |
| $100,000 to $149,999 | 0 | 0.0% |
| $150,000 to $199,999 | 0 | 0.0% |
| $200,000+ | 2 | 3.8% |
Family Income by Famaliy Size in Silver City
2-person families (31 | 59.6%) account for the highest median family income in Silver City with $61,042 per family, while 2-person families (31 | 59.6%) have the highest median income of $30,521 per family member.
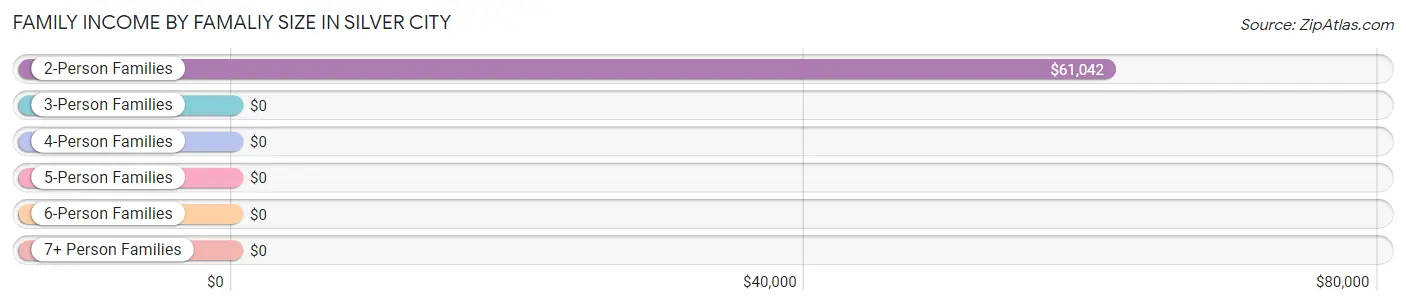
| Income Bracket | # Families | Median Income |
| 2-Person Families | 31 (59.6%) | $61,042 |
| 3-Person Families | 11 (21.1%) | $0 |
| 4-Person Families | 5 (9.6%) | $0 |
| 5-Person Families | 5 (9.6%) | $0 |
| 6-Person Families | 0 (0.0%) | $0 |
| 7+ Person Families | 0 (0.0%) | $0 |
| Total | 52 (100.0%) | $53,750 |
Family Income by Number of Earners in Silver City
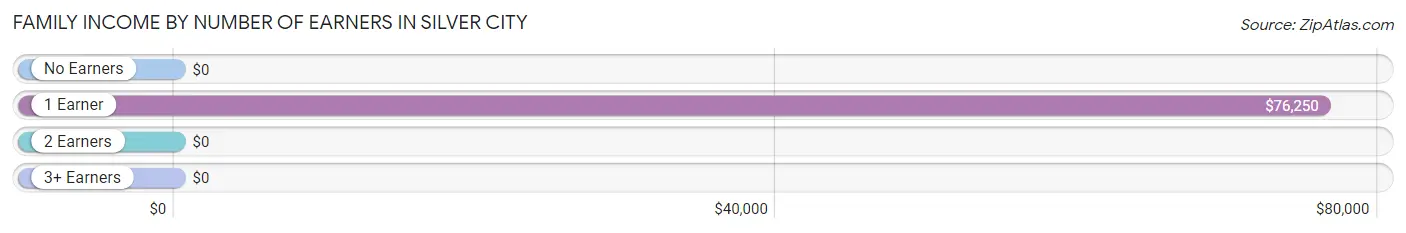
| Number of Earners | # Families | Median Income |
| No Earners | 14 (26.9%) | $0 |
| 1 Earner | 24 (46.2%) | $76,250 |
| 2 Earners | 12 (23.1%) | $0 |
| 3+ Earners | 2 (3.8%) | $0 |
| Total | 52 (100.0%) | $53,750 |
Household Income in Silver City
Household Income Brackets in Silver City
With 26 households falling in the category, the $10,000 to $14,999 income range is the most frequent in Silver City, accounting for 27.7% of all households.
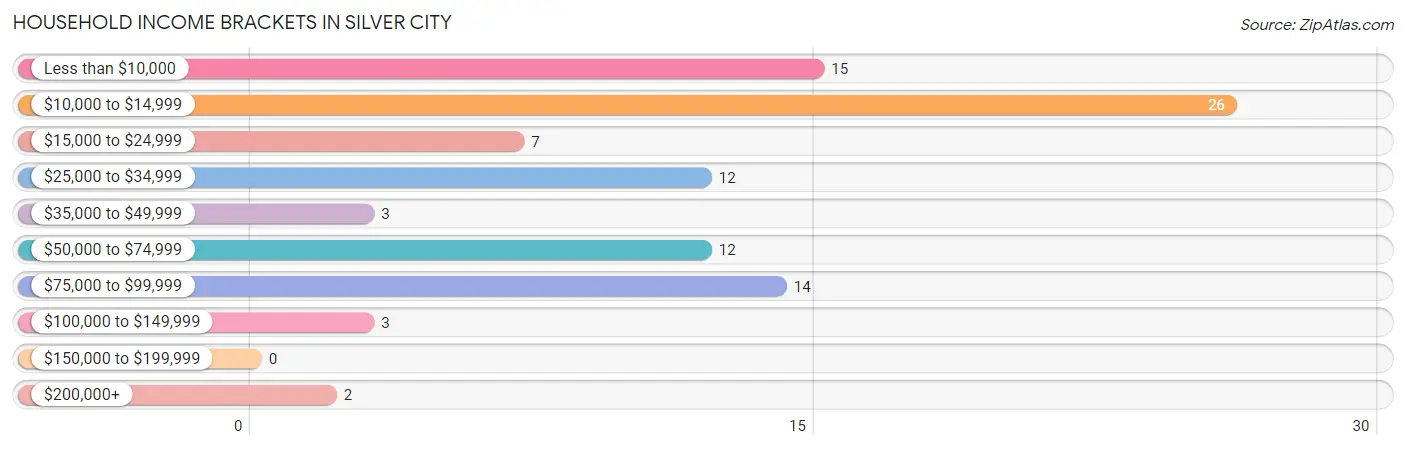
| Income Bracket | # Households | % Households |
| Less than $10,000 | 15 | 16.0% |
| $10,000 to $14,999 | 26 | 27.7% |
| $15,000 to $24,999 | 7 | 7.4% |
| $25,000 to $34,999 | 12 | 12.8% |
| $35,000 to $49,999 | 3 | 3.2% |
| $50,000 to $74,999 | 12 | 12.8% |
| $75,000 to $99,999 | 14 | 14.9% |
| $100,000 to $149,999 | 3 | 3.2% |
| $150,000 to $199,999 | 0 | 0.0% |
| $200,000+ | 2 | 2.1% |
Household Income by Householder Age in Silver City
The median household income in Silver City is $0, with the highest median household income of $90,417 found in the 65+ years age bracket for the primary householder. A total of 27 households (28.7%) fall into this category.
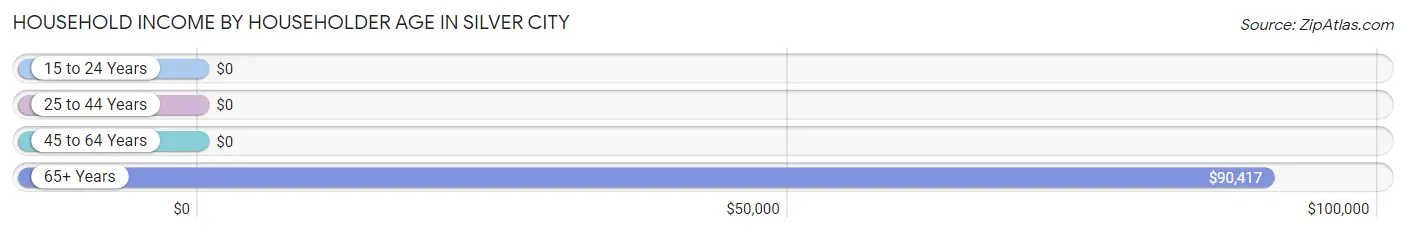
| Income Bracket | # Households | Median Income |
| 15 to 24 Years | 0 (0.0%) | $0 |
| 25 to 44 Years | 15 (16.0%) | $0 |
| 45 to 64 Years | 52 (55.3%) | $0 |
| 65+ Years | 27 (28.7%) | $90,417 |
| Total | 94 (100.0%) | $0 |
Poverty in Silver City
Income Below Poverty by Sex and Age in Silver City
With 25.8% poverty level for males and 38.9% for females among the residents of Silver City, under 5 year old males and 12 to 14 year old females are the most vulnerable to poverty, with 8 males (88.9%) and 11 females (100.0%) in their respective age groups living below the poverty level.
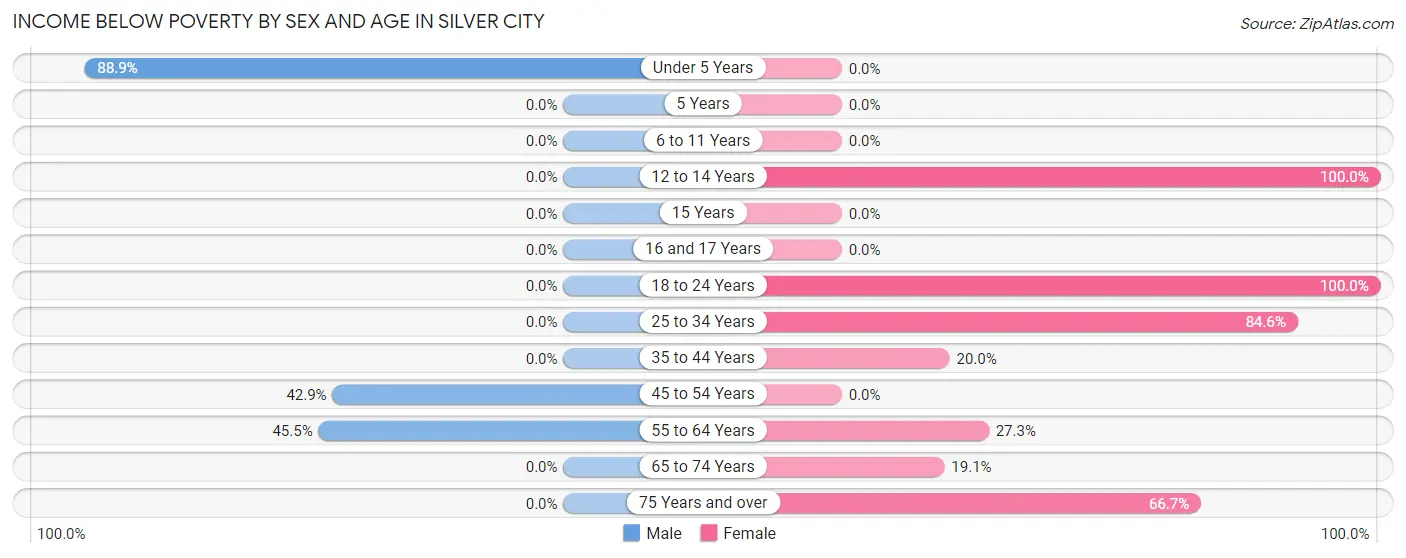
| Age Bracket | Male | Female |
| Under 5 Years | 8 (88.9%) | 0 (0.0%) |
| 5 Years | 0 (0.0%) | 0 (0.0%) |
| 6 to 11 Years | 0 (0.0%) | 0 (0.0%) |
| 12 to 14 Years | 0 (0.0%) | 11 (100.0%) |
| 15 Years | 0 (0.0%) | 0 (0.0%) |
| 16 and 17 Years | 0 (0.0%) | 0 (0.0%) |
| 18 to 24 Years | 0 (0.0%) | 1 (100.0%) |
| 25 to 34 Years | 0 (0.0%) | 11 (84.6%) |
| 35 to 44 Years | 0 (0.0%) | 1 (20.0%) |
| 45 to 54 Years | 6 (42.9%) | 0 (0.0%) |
| 55 to 64 Years | 10 (45.5%) | 12 (27.3%) |
| 65 to 74 Years | 0 (0.0%) | 4 (19.1%) |
| 75 Years and over | 0 (0.0%) | 2 (66.7%) |
| Total | 24 (25.8%) | 42 (38.9%) |
Income Above Poverty by Sex and Age in Silver City
According to the poverty statistics in Silver City, males aged 6 to 11 years and females aged under 5 years are the age groups that are most secure financially, with 100.0% of males and 100.0% of females in these age groups living above the poverty line.
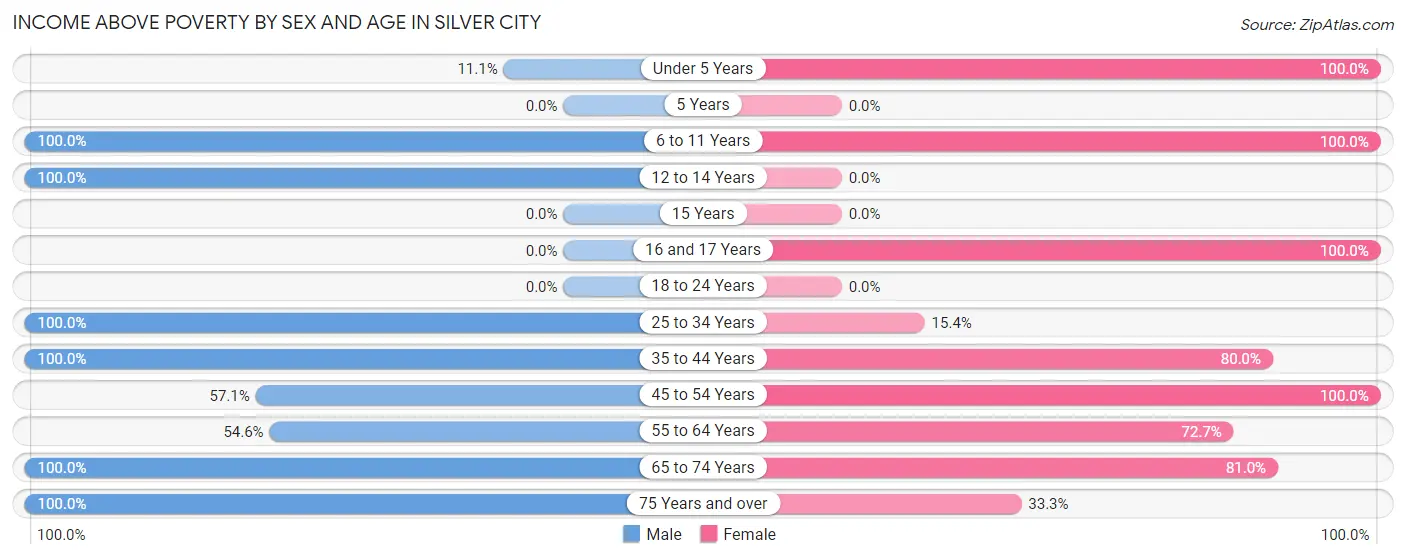
| Age Bracket | Male | Female |
| Under 5 Years | 1 (11.1%) | 4 (100.0%) |
| 5 Years | 0 (0.0%) | 0 (0.0%) |
| 6 to 11 Years | 2 (100.0%) | 1 (100.0%) |
| 12 to 14 Years | 2 (100.0%) | 0 (0.0%) |
| 15 Years | 0 (0.0%) | 0 (0.0%) |
| 16 and 17 Years | 0 (0.0%) | 3 (100.0%) |
| 18 to 24 Years | 0 (0.0%) | 0 (0.0%) |
| 25 to 34 Years | 19 (100.0%) | 2 (15.4%) |
| 35 to 44 Years | 3 (100.0%) | 4 (80.0%) |
| 45 to 54 Years | 8 (57.1%) | 2 (100.0%) |
| 55 to 64 Years | 12 (54.5%) | 32 (72.7%) |
| 65 to 74 Years | 14 (100.0%) | 17 (80.9%) |
| 75 Years and over | 8 (100.0%) | 1 (33.3%) |
| Total | 69 (74.2%) | 66 (61.1%) |
Income Below Poverty Among Married-Couple Families in Silver City
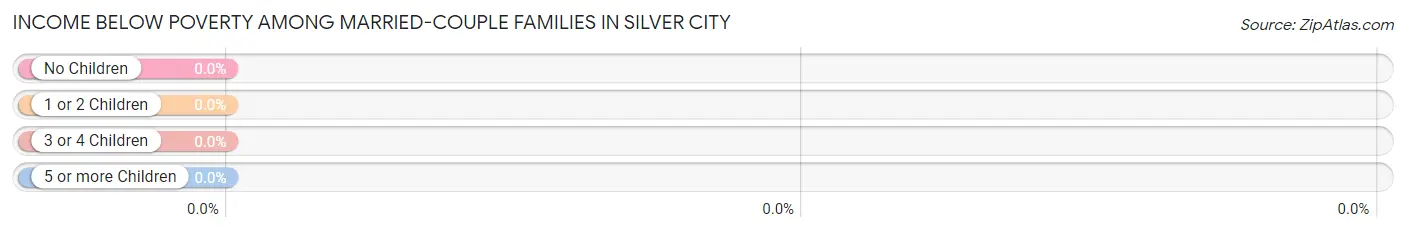
| Children | Above Poverty | Below Poverty |
| No Children | 22 (100.0%) | 0 (0.0%) |
| 1 or 2 Children | 6 (100.0%) | 0 (0.0%) |
| 3 or 4 Children | 3 (100.0%) | 0 (0.0%) |
| 5 or more Children | 0 (0.0%) | 0 (0.0%) |
| Total | 31 (100.0%) | 0 (0.0%) |
Income Below Poverty Among Single-Parent Households in Silver City
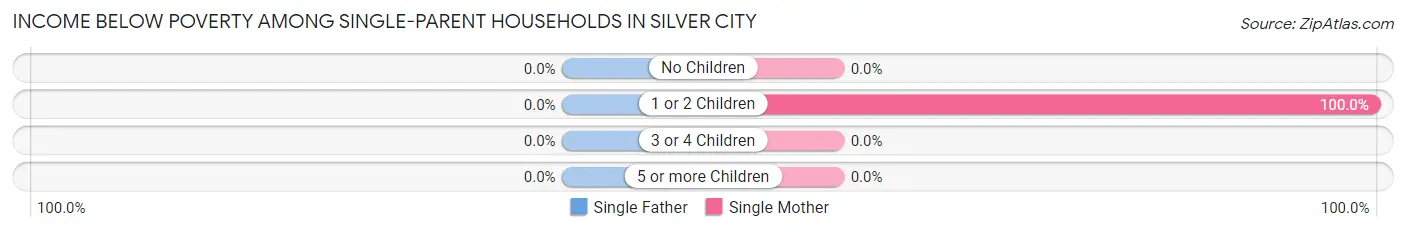
| Children | Single Father | Single Mother |
| No Children | 0 (0.0%) | 0 (0.0%) |
| 1 or 2 Children | 0 (0.0%) | 11 (100.0%) |
| 3 or 4 Children | 0 (0.0%) | 0 (0.0%) |
| 5 or more Children | 0 (0.0%) | 0 (0.0%) |
| Total | 0 (0.0%) | 11 (52.4%) |
Income Below Poverty Among Married-Couple vs Single-Parent Households in Silver City
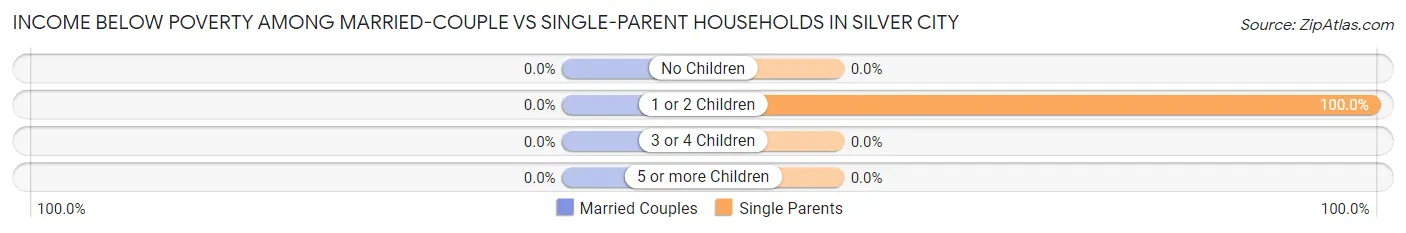
| Children | Married-Couple Families | Single-Parent Households |
| No Children | 0 (0.0%) | 0 (0.0%) |
| 1 or 2 Children | 0 (0.0%) | 11 (100.0%) |
| 3 or 4 Children | 0 (0.0%) | 0 (0.0%) |
| 5 or more Children | 0 (0.0%) | 0 (0.0%) |
| Total | 0 (0.0%) | 11 (52.4%) |
Race in Silver City
The most populous races in Silver City are Black / African American (128 | 63.7%), and White / Caucasian (73 | 36.3%).
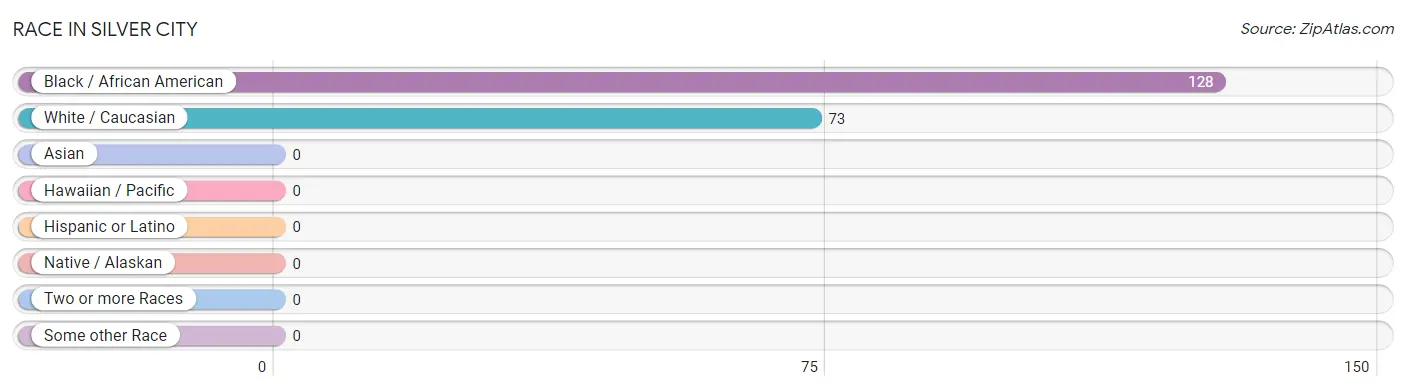
| Race | # Population | % Population |
| Asian | 0 | 0.0% |
| Black / African American | 128 | 63.7% |
| Hawaiian / Pacific | 0 | 0.0% |
| Hispanic or Latino | 0 | 0.0% |
| Native / Alaskan | 0 | 0.0% |
| White / Caucasian | 73 | 36.3% |
| Two or more Races | 0 | 0.0% |
| Some other Race | 0 | 0.0% |
| Total | 201 | 100.0% |
Ancestry in Silver City
The most populous ancestries reported in Silver City are American (23 | 11.4%), English (6 | 3.0%), Irish (4 | 2.0%), Italian (4 | 2.0%), and German (1 | 0.5%), together accounting for 18.9% of all Silver City residents.
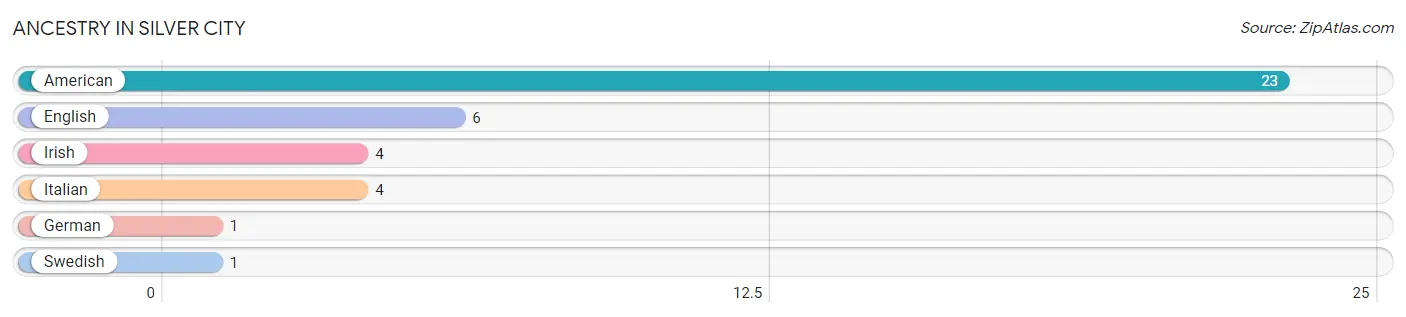
| Ancestry | # Population | % Population |
| American | 23 | 11.4% |
| English | 6 | 3.0% |
| German | 1 | 0.5% |
| Irish | 4 | 2.0% |
| Italian | 4 | 2.0% |
| Swedish | 1 | 0.5% | View All 6 Rows |
Immigrants in Silver City

| Immigration Origin | # Population | % Population | View All 0 Rows |
Sex and Age in Silver City
Sex and Age in Silver City
The most populous age groups in Silver City are 30 to 34 Years (14 | 15.0%) for men and 60 to 64 Years (35 | 32.4%) for women.
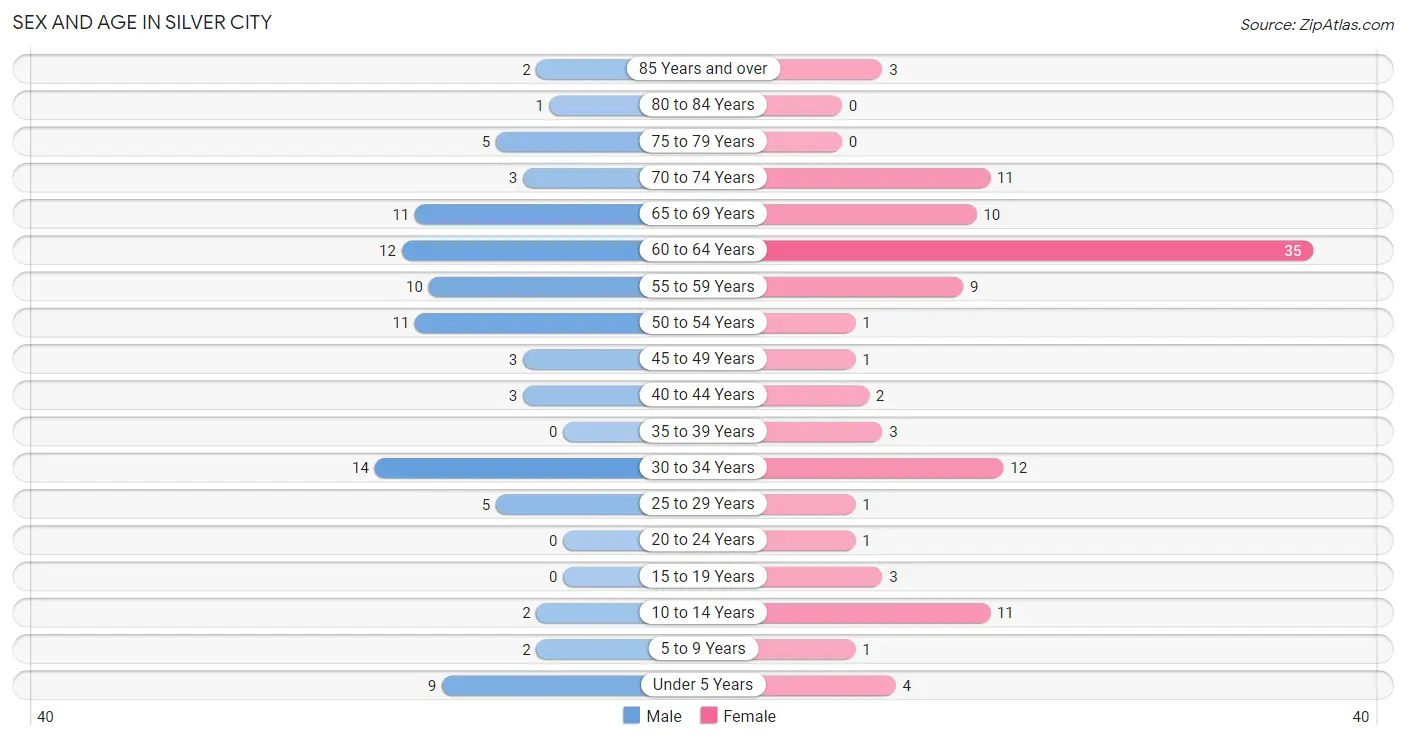
| Age Bracket | Male | Female |
| Under 5 Years | 9 (9.7%) | 4 (3.7%) |
| 5 to 9 Years | 2 (2.1%) | 1 (0.9%) |
| 10 to 14 Years | 2 (2.1%) | 11 (10.2%) |
| 15 to 19 Years | 0 (0.0%) | 3 (2.8%) |
| 20 to 24 Years | 0 (0.0%) | 1 (0.9%) |
| 25 to 29 Years | 5 (5.4%) | 1 (0.9%) |
| 30 to 34 Years | 14 (15.0%) | 12 (11.1%) |
| 35 to 39 Years | 0 (0.0%) | 3 (2.8%) |
| 40 to 44 Years | 3 (3.2%) | 2 (1.8%) |
| 45 to 49 Years | 3 (3.2%) | 1 (0.9%) |
| 50 to 54 Years | 11 (11.8%) | 1 (0.9%) |
| 55 to 59 Years | 10 (10.7%) | 9 (8.3%) |
| 60 to 64 Years | 12 (12.9%) | 35 (32.4%) |
| 65 to 69 Years | 11 (11.8%) | 10 (9.3%) |
| 70 to 74 Years | 3 (3.2%) | 11 (10.2%) |
| 75 to 79 Years | 5 (5.4%) | 0 (0.0%) |
| 80 to 84 Years | 1 (1.1%) | 0 (0.0%) |
| 85 Years and over | 2 (2.1%) | 3 (2.8%) |
| Total | 93 (100.0%) | 108 (100.0%) |
Families and Households in Silver City
Median Family Size in Silver City
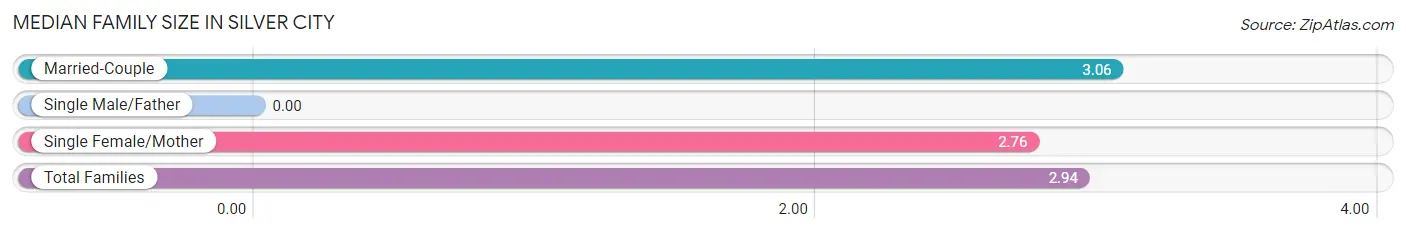
| Family Type | # Families | Family Size |
| Married-Couple | 31 (59.6%) | 3.06 |
| Single Male/Father | 0 (0.0%) | - |
| Single Female/Mother | 21 (40.4%) | 2.76 |
| Total Families | 52 (100.0%) | 2.94 |
Median Household Size in Silver City
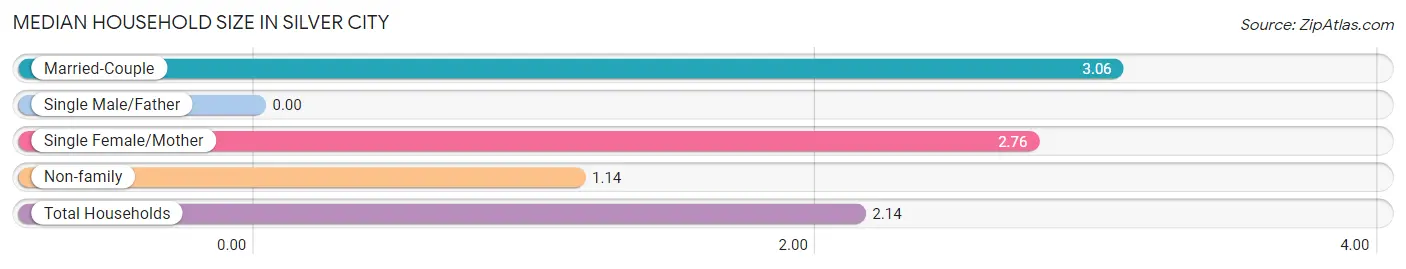
| Household Type | # Households | Household Size |
| Married-Couple | 31 (33.0%) | 3.06 |
| Single Male/Father | 0 (0.0%) | - |
| Single Female/Mother | 21 (22.3%) | 2.76 |
| Non-family | 42 (44.7%) | 1.14 |
| Total Households | 94 (100.0%) | 2.14 |
Household Size by Marriage Status in Silver City
Out of a total of 94 households in Silver City, 52 (55.3%) are family households, while 42 (44.7%) are nonfamily households. The most numerous type of family households are 2-person households, comprising 31, and the most common type of nonfamily households are 1-person households, comprising 40.
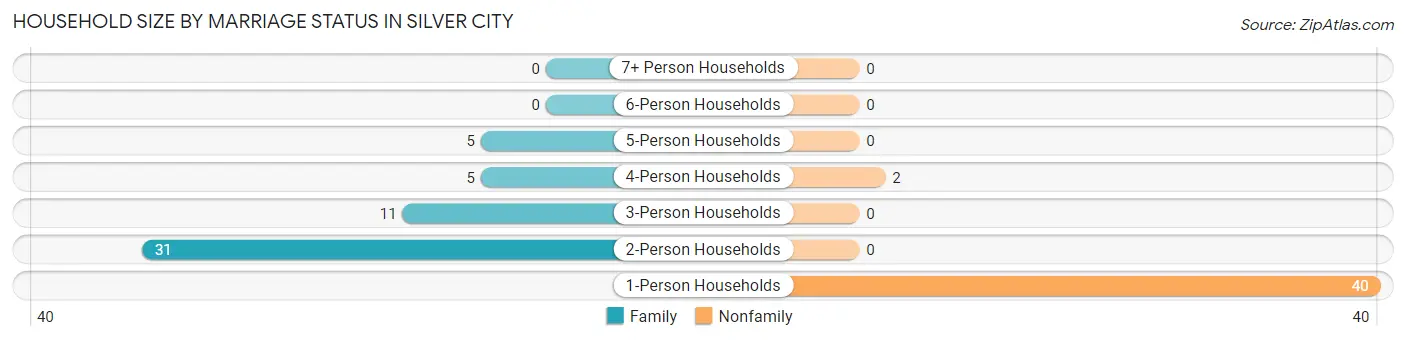
| Household Size | Family Households | Nonfamily Households |
| 1-Person Households | - | 40 (42.5%) |
| 2-Person Households | 31 (33.0%) | 0 (0.0%) |
| 3-Person Households | 11 (11.7%) | 0 (0.0%) |
| 4-Person Households | 5 (5.3%) | 2 (2.1%) |
| 5-Person Households | 5 (5.3%) | 0 (0.0%) |
| 6-Person Households | 0 (0.0%) | 0 (0.0%) |
| 7+ Person Households | 0 (0.0%) | 0 (0.0%) |
| Total | 52 (55.3%) | 42 (44.7%) |
Female Fertility in Silver City
Fertility by Age in Silver City
Average fertility rate in Silver City is 174.0 births per 1,000 women. Women in the age bracket of 35 to 50 years have the highest fertility rate with 500.0 births per 1,000 women. Women in the age bracket of 35 to 50 years acount for 75.0% of all women with births.
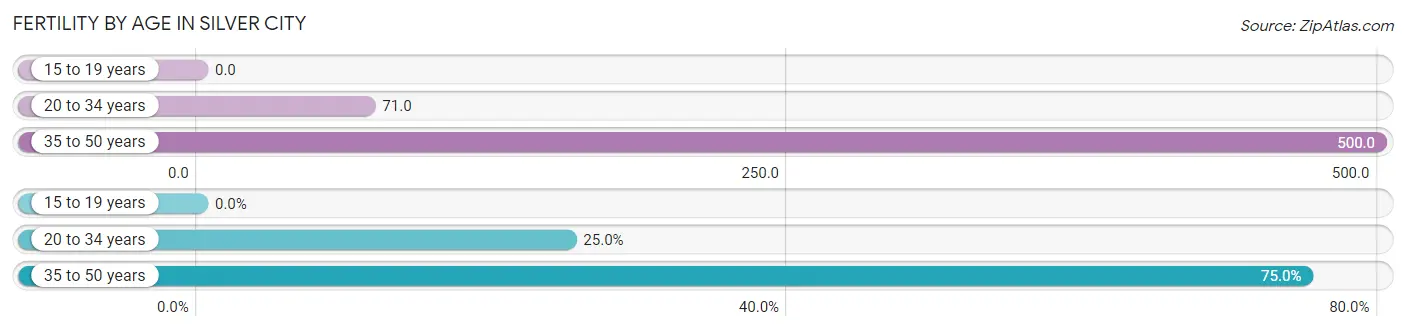
| Age Bracket | Women with Births | Births / 1,000 Women |
| 15 to 19 years | 0 (0.0%) | 0.0 |
| 20 to 34 years | 1 (25.0%) | 71.0 |
| 35 to 50 years | 3 (75.0%) | 500.0 |
| Total | 4 (100.0%) | 174.0 |
Fertility by Age by Marriage Status in Silver City
75.0% of women with births (4) in Silver City are married. The highest percentage of unmarried women with births falls into 20 to 34 years age bracket with 100.0% of them unmarried at the time of birth, while the lowest percentage of unmarried women with births belong to 35 to 50 years age bracket with 0.0% of them unmarried.
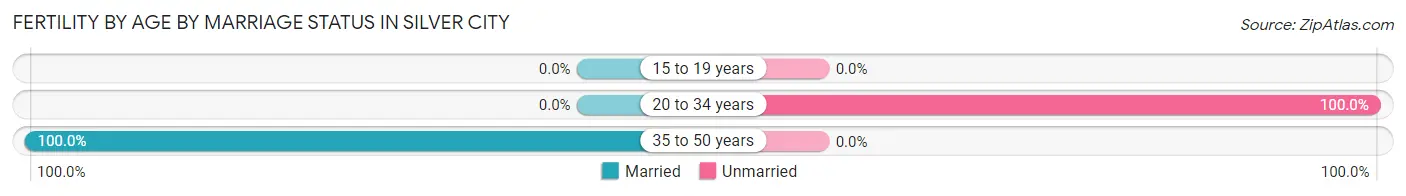
| Age Bracket | Married | Unmarried |
| 15 to 19 years | 0 (0.0%) | 0 (0.0%) |
| 20 to 34 years | 0 (0.0%) | 1 (100.0%) |
| 35 to 50 years | 3 (100.0%) | 0 (0.0%) |
| Total | 3 (75.0%) | 1 (25.0%) |
Fertility by Education in Silver City
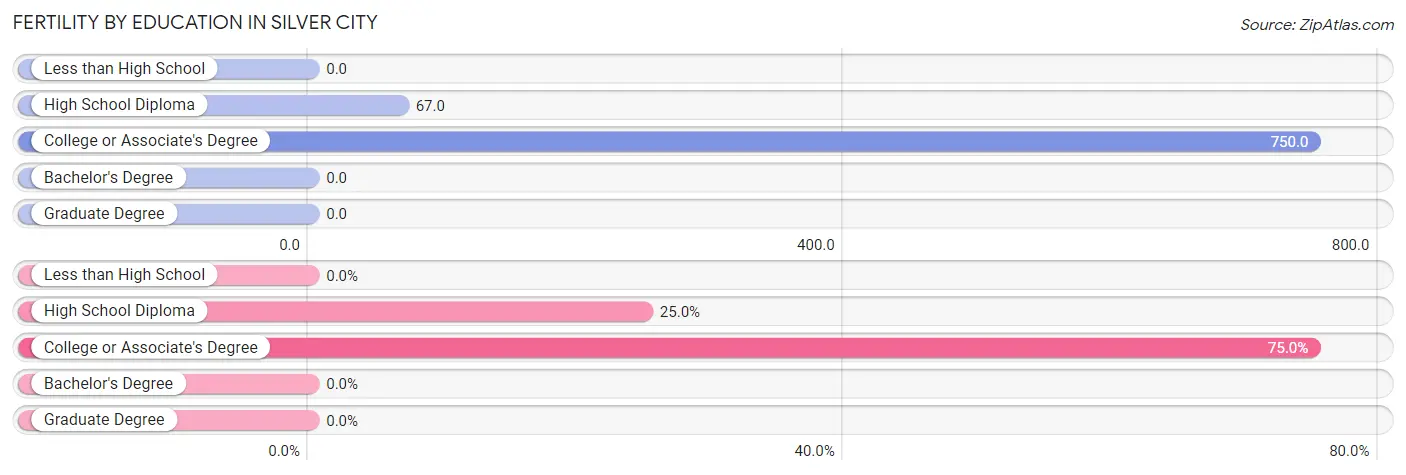
| Educational Attainment | Women with Births | Births / 1,000 Women |
| Less than High School | 0 (0.0%) | 0.0 |
| High School Diploma | 1 (25.0%) | 67.0 |
| College or Associate's Degree | 3 (75.0%) | 750.0 |
| Bachelor's Degree | 0 (0.0%) | 0.0 |
| Graduate Degree | 0 (0.0%) | 0.0 |
| Total | 4 (100.0%) | 174.0 |
Fertility by Education by Marriage Status in Silver City
25.0% of women with births in Silver City are unmarried. Women with the educational attainment of college or associate's degree are most likely to be married with 100.0% of them married at childbirth, while women with the educational attainment of high school diploma are least likely to be married with 100.0% of them unmarried at childbirth.
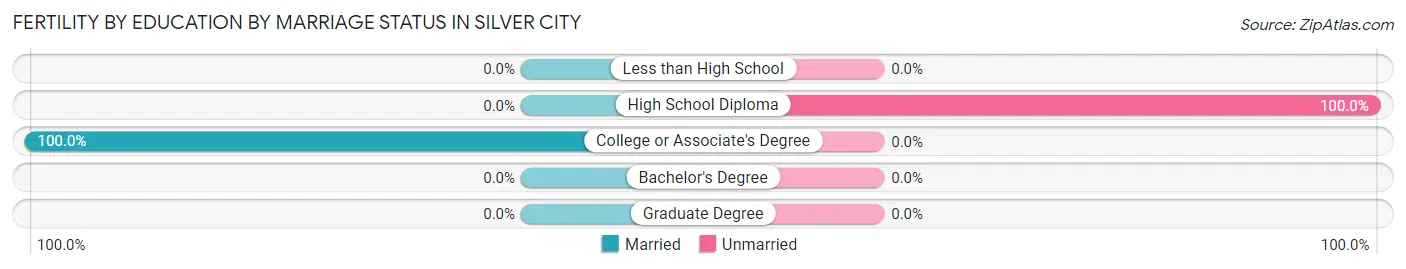
| Educational Attainment | Married | Unmarried |
| Less than High School | 0 (0.0%) | 0 (0.0%) |
| High School Diploma | 0 (0.0%) | 1 (100.0%) |
| College or Associate's Degree | 3 (100.0%) | 0 (0.0%) |
| Bachelor's Degree | 0 (0.0%) | 0 (0.0%) |
| Graduate Degree | 0 (0.0%) | 0 (0.0%) |
| Total | 3 (75.0%) | 1 (25.0%) |
Employment Characteristics in Silver City
Employment by Class of Employer in Silver City
Among the 73 employed individuals in Silver City, private company employees (45 | 61.6%), state government employees (15 | 20.5%), and self-employed (not incorporated) (8 | 11.0%) make up the most common classes of employment.
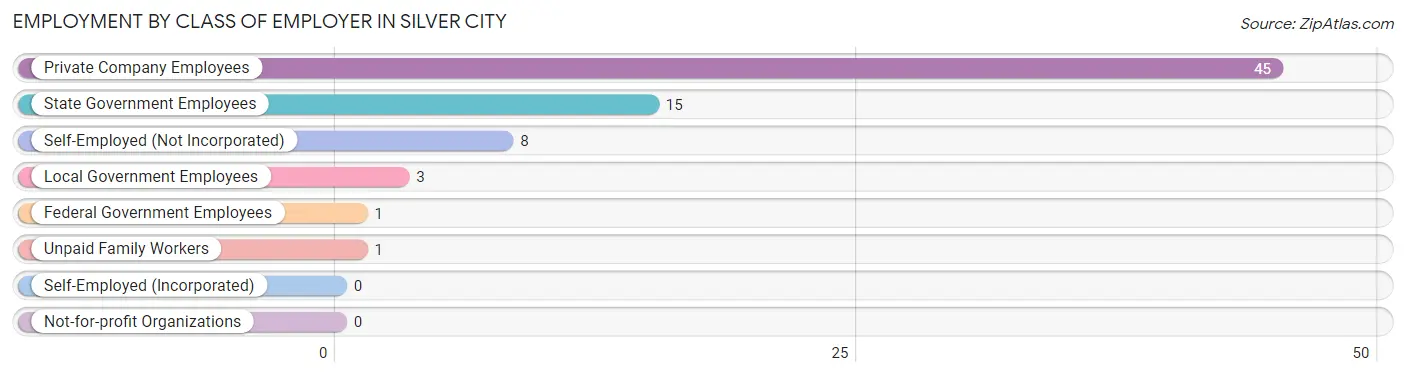
| Employer Class | # Employees | % Employees |
| Private Company Employees | 45 | 61.6% |
| Self-Employed (Incorporated) | 0 | 0.0% |
| Self-Employed (Not Incorporated) | 8 | 11.0% |
| Not-for-profit Organizations | 0 | 0.0% |
| Local Government Employees | 3 | 4.1% |
| State Government Employees | 15 | 20.5% |
| Federal Government Employees | 1 | 1.4% |
| Unpaid Family Workers | 1 | 1.4% |
| Total | 73 | 100.0% |
Employment Status by Age in Silver City
According to the labor force statistics for Silver City, out of the total population over 16 years of age (172), 47.1% or 81 individuals are in the labor force, with 2.5% or 2 of them unemployed. The age group with the highest labor force participation rate is 20 to 24 years, with 100.0% or 1 individuals in the labor force. Within the labor force, the 20 to 24 years age range has the highest percentage of unemployed individuals, with 100.0% or 1 of them being unemployed.
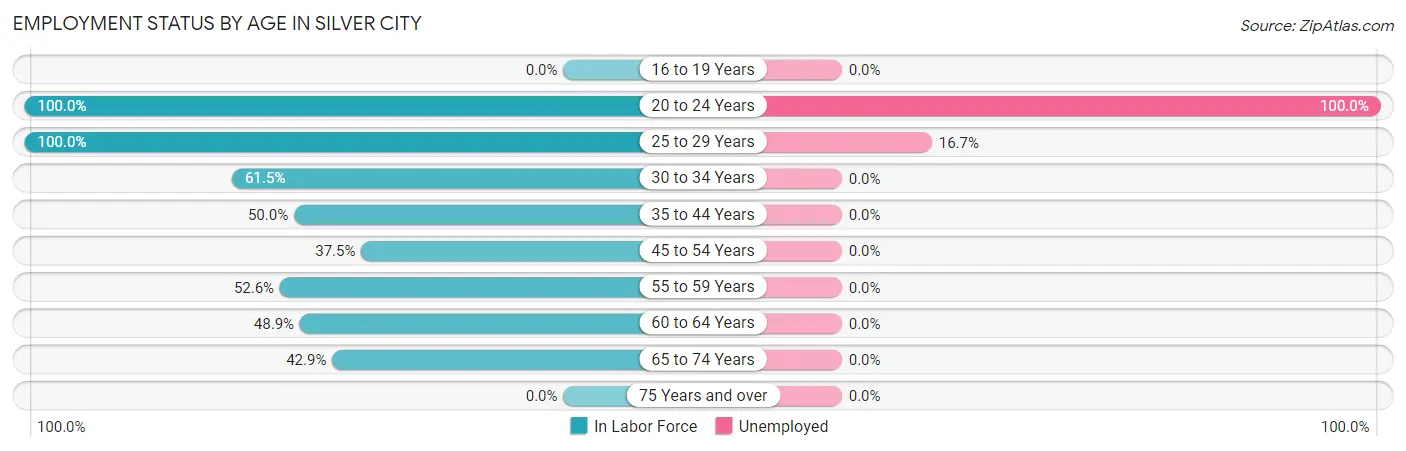
| Age Bracket | In Labor Force | Unemployed |
| 16 to 19 Years | 0 (0.0%) | 0 (0.0%) |
| 20 to 24 Years | 1 (100.0%) | 1 (100.0%) |
| 25 to 29 Years | 6 (100.0%) | 1 (16.7%) |
| 30 to 34 Years | 16 (61.5%) | 0 (0.0%) |
| 35 to 44 Years | 4 (50.0%) | 0 (0.0%) |
| 45 to 54 Years | 6 (37.5%) | 0 (0.0%) |
| 55 to 59 Years | 10 (52.6%) | 0 (0.0%) |
| 60 to 64 Years | 23 (48.9%) | 0 (0.0%) |
| 65 to 74 Years | 15 (42.9%) | 0 (0.0%) |
| 75 Years and over | 0 (0.0%) | 0 (0.0%) |
| Total | 81 (47.1%) | 2 (2.5%) |
Employment Status by Educational Attainment in Silver City
According to labor force statistics for Silver City, 53.3% of individuals (65) out of the total population between 25 and 64 years of age (122) are in the labor force, with 1.5% or 1 of them being unemployed. The group with the highest labor force participation rate are those with the educational attainment of bachelor's degree or higher, with 100.0% or 16 individuals in the labor force. Within the labor force, individuals with high school diploma education have the highest percentage of unemployment, with 5.3% or 1 of them being unemployed.
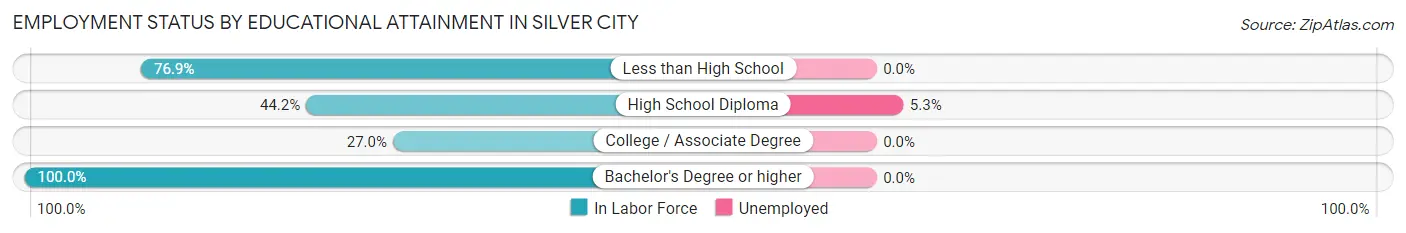
| Educational Attainment | In Labor Force | Unemployed |
| Less than High School | 20 (76.9%) | 0 (0.0%) |
| High School Diploma | 19 (44.2%) | 2 (5.3%) |
| College / Associate Degree | 10 (27.0%) | 0 (0.0%) |
| Bachelor's Degree or higher | 16 (100.0%) | 0 (0.0%) |
| Total | 65 (53.3%) | 2 (1.5%) |
Employment Occupations by Sex in Silver City
Management, Business, Science and Arts Occupations
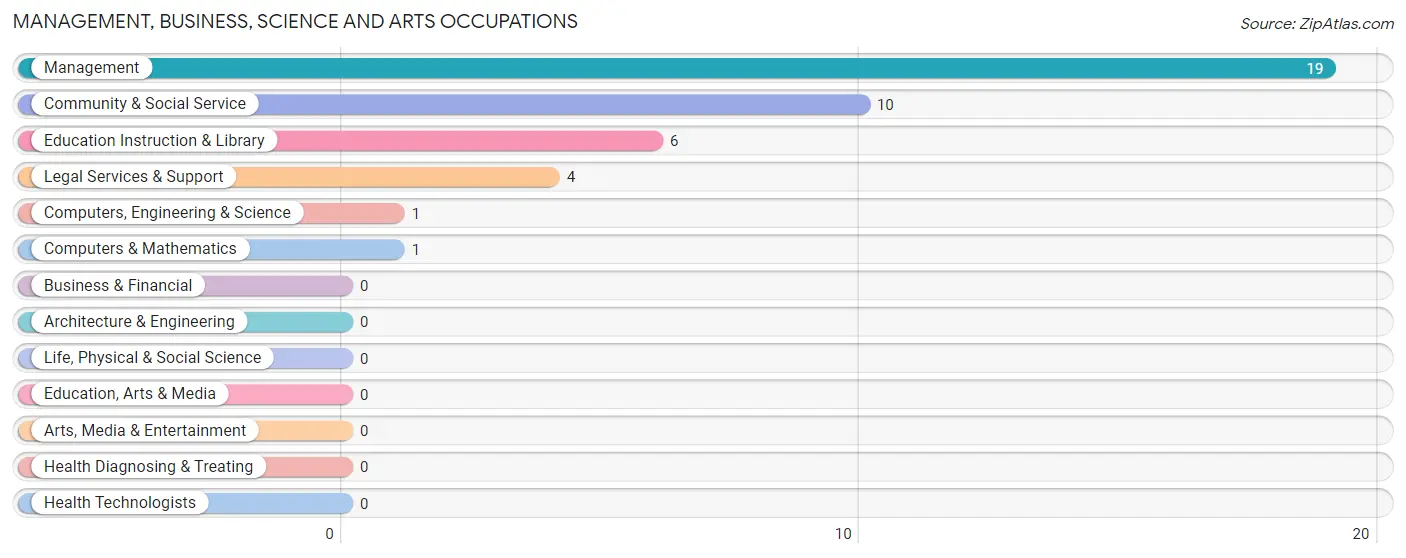
The most common Management, Business, Science and Arts occupations in Silver City are Management (19 | 24.0%), Community & Social Service (10 | 12.7%), Education Instruction & Library (6 | 7.6%), Legal Services & Support (4 | 5.1%), and Computers, Engineering & Science (1 | 1.3%).
Management, Business, Science and Arts Occupations by Sex
Within the Management, Business, Science and Arts occupations in Silver City, the most male-oriented occupations are Computers, Engineering & Science (100.0%), Computers & Mathematics (100.0%), and Legal Services & Support (50.0%), while the most female-oriented occupations are Education Instruction & Library (100.0%), Community & Social Service (80.0%), and Management (78.9%).
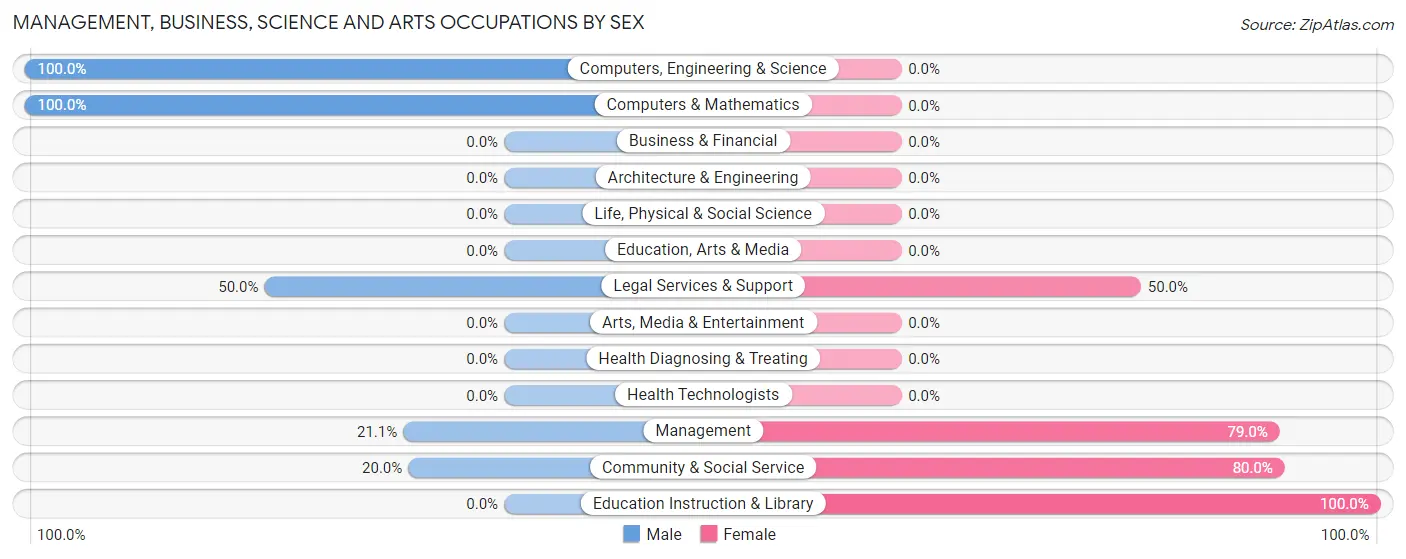
| Occupation | Male | Female |
| Management | 4 (21.0%) | 15 (78.9%) |
| Business & Financial | 0 (0.0%) | 0 (0.0%) |
| Computers, Engineering & Science | 1 (100.0%) | 0 (0.0%) |
| Computers & Mathematics | 1 (100.0%) | 0 (0.0%) |
| Architecture & Engineering | 0 (0.0%) | 0 (0.0%) |
| Life, Physical & Social Science | 0 (0.0%) | 0 (0.0%) |
| Community & Social Service | 2 (20.0%) | 8 (80.0%) |
| Education, Arts & Media | 0 (0.0%) | 0 (0.0%) |
| Legal Services & Support | 2 (50.0%) | 2 (50.0%) |
| Education Instruction & Library | 0 (0.0%) | 6 (100.0%) |
| Arts, Media & Entertainment | 0 (0.0%) | 0 (0.0%) |
| Health Diagnosing & Treating | 0 (0.0%) | 0 (0.0%) |
| Health Technologists | 0 (0.0%) | 0 (0.0%) |
| Total (Category) | 7 (23.3%) | 23 (76.7%) |
| Total (Overall) | 42 (53.2%) | 37 (46.8%) |
Services Occupations
The most common Services occupations in Silver City are , and Cleaning & Maintenance (3 | 3.8%).
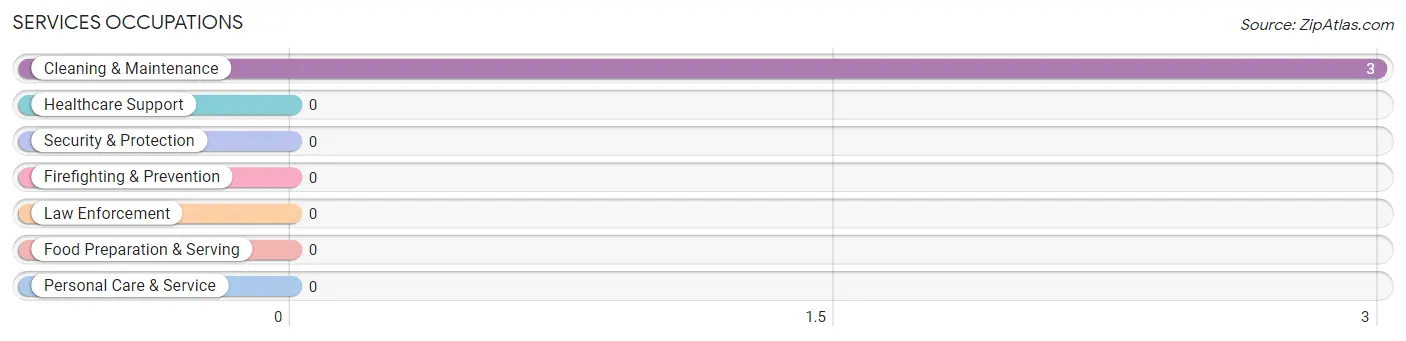
Services Occupations by Sex
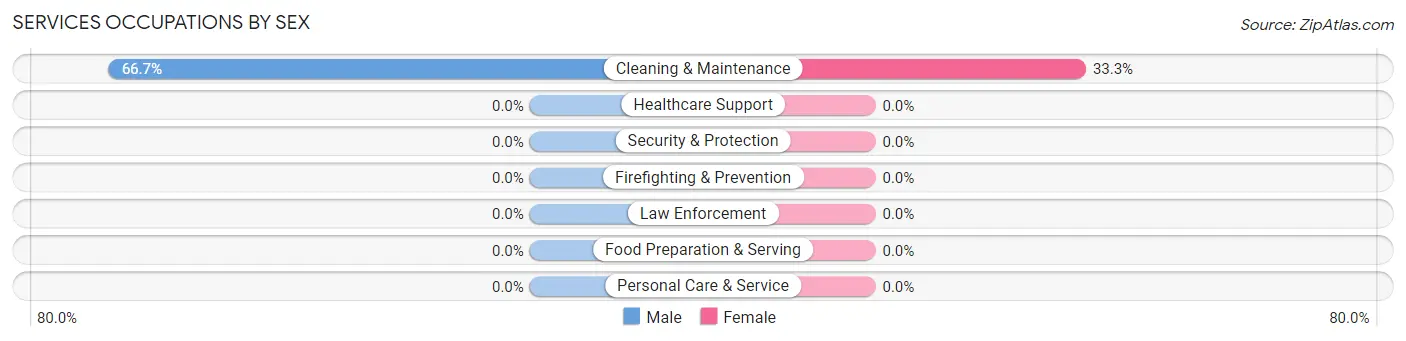
| Occupation | Male | Female |
| Healthcare Support | 0 (0.0%) | 0 (0.0%) |
| Security & Protection | 0 (0.0%) | 0 (0.0%) |
| Firefighting & Prevention | 0 (0.0%) | 0 (0.0%) |
| Law Enforcement | 0 (0.0%) | 0 (0.0%) |
| Food Preparation & Serving | 0 (0.0%) | 0 (0.0%) |
| Cleaning & Maintenance | 2 (66.7%) | 1 (33.3%) |
| Personal Care & Service | 0 (0.0%) | 0 (0.0%) |
| Total (Category) | 2 (66.7%) | 1 (33.3%) |
| Total (Overall) | 42 (53.2%) | 37 (46.8%) |
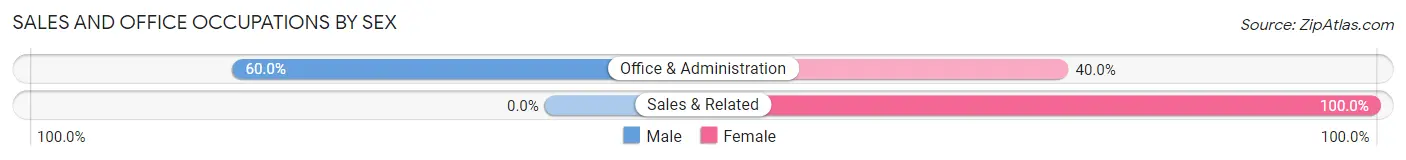
Sales and Office Occupations
The most common Sales and Office occupations in Silver City are Office & Administration (5 | 6.3%), and Sales & Related (2 | 2.5%).
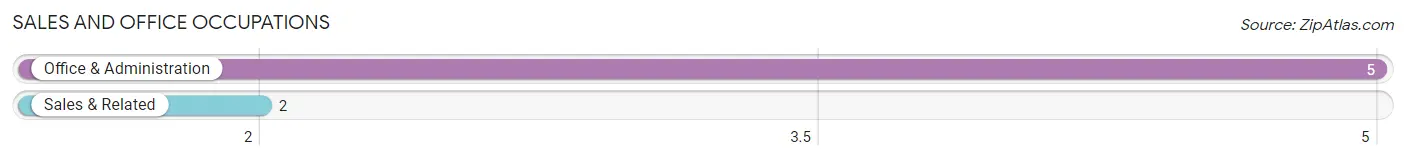
Sales and Office Occupations by Sex
| Occupation | Male | Female |
| Sales & Related | 0 (0.0%) | 2 (100.0%) |
| Office & Administration | 3 (60.0%) | 2 (40.0%) |
| Total (Category) | 3 (42.9%) | 4 (57.1%) |
| Total (Overall) | 42 (53.2%) | 37 (46.8%) |
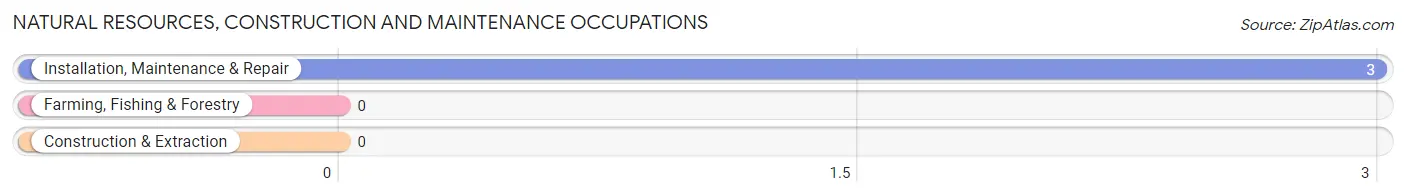
Natural Resources, Construction and Maintenance Occupations
The most common Natural Resources, Construction and Maintenance occupations in Silver City are , and Installation, Maintenance & Repair (3 | 3.8%).
Natural Resources, Construction and Maintenance Occupations by Sex
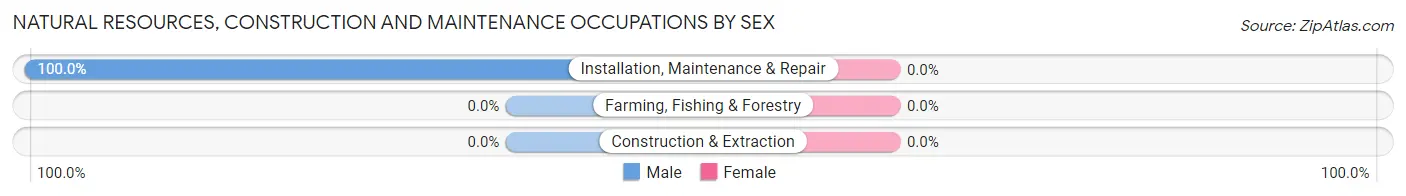
| Occupation | Male | Female |
| Farming, Fishing & Forestry | 0 (0.0%) | 0 (0.0%) |
| Construction & Extraction | 0 (0.0%) | 0 (0.0%) |
| Installation, Maintenance & Repair | 3 (100.0%) | 0 (0.0%) |
| Total (Category) | 3 (100.0%) | 0 (0.0%) |
| Total (Overall) | 42 (53.2%) | 37 (46.8%) |
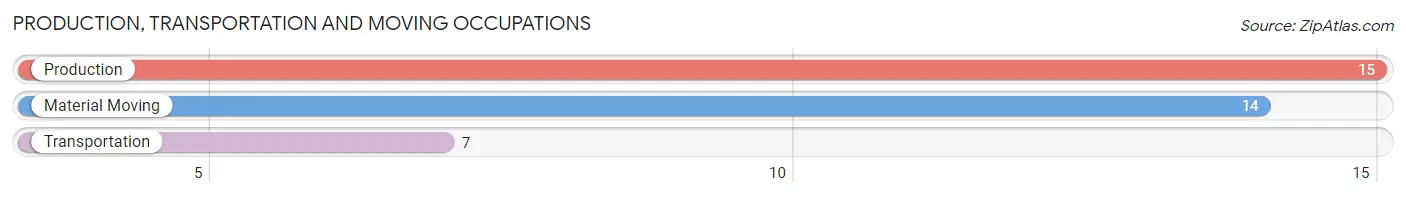
Production, Transportation and Moving Occupations
The most common Production, Transportation and Moving occupations in Silver City are Production (15 | 19.0%), Material Moving (14 | 17.7%), and Transportation (7 | 8.9%).
Production, Transportation and Moving Occupations by Sex
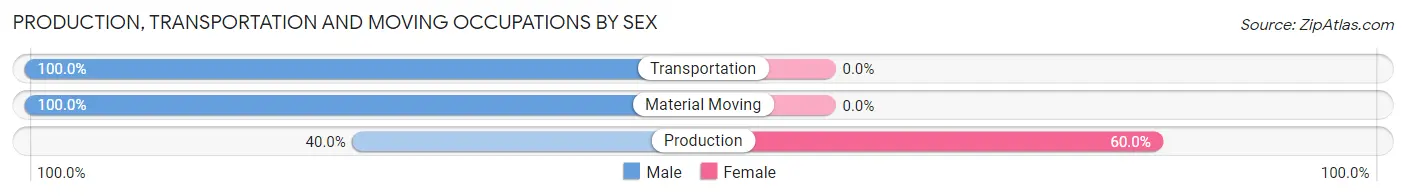
| Occupation | Male | Female |
| Production | 6 (40.0%) | 9 (60.0%) |
| Transportation | 7 (100.0%) | 0 (0.0%) |
| Material Moving | 14 (100.0%) | 0 (0.0%) |
| Total (Category) | 27 (75.0%) | 9 (25.0%) |
| Total (Overall) | 42 (53.2%) | 37 (46.8%) |
Employment Industries by Sex in Silver City
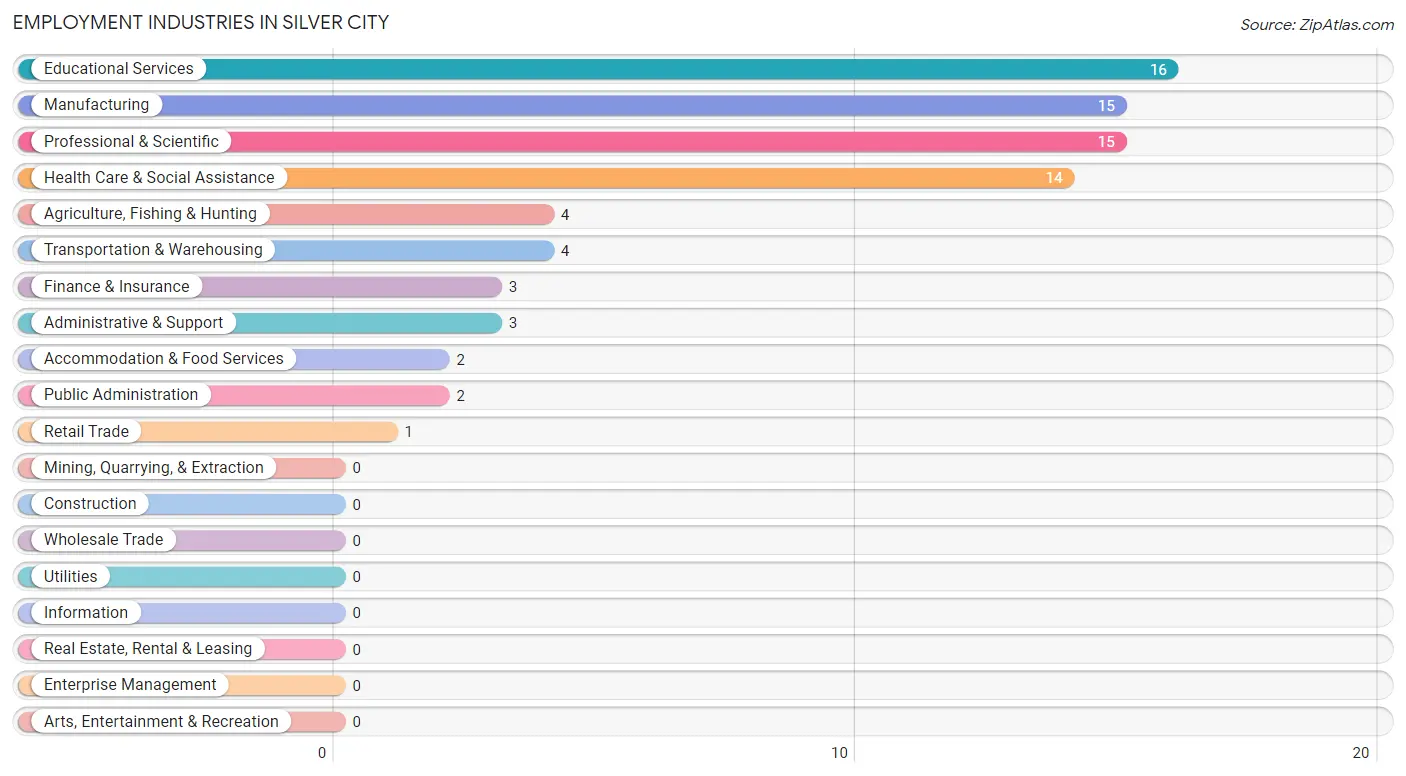
Employment Industries in Silver City
The major employment industries in Silver City include Educational Services (16 | 20.3%), Manufacturing (15 | 19.0%), Professional & Scientific (15 | 19.0%), Health Care & Social Assistance (14 | 17.7%), and Agriculture, Fishing & Hunting (4 | 5.1%).
Employment Industries by Sex in Silver City
The Silver City industries that see more men than women are Agriculture, Fishing & Hunting (100.0%), Retail Trade (100.0%), and Professional & Scientific (100.0%), whereas the industries that tend to have a higher number of women are Health Care & Social Assistance (100.0%), Accommodation & Food Services (100.0%), and Public Administration (100.0%).
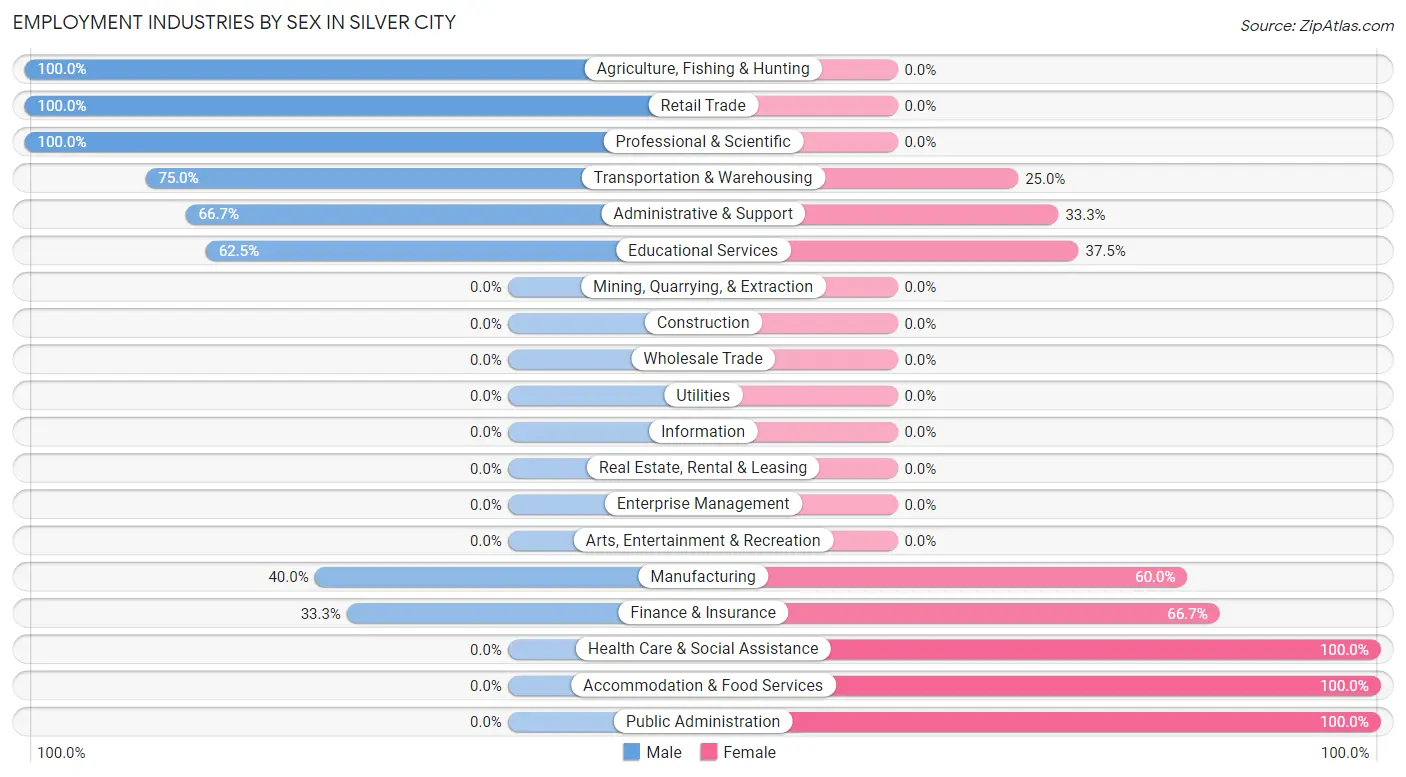
| Industry | Male | Female |
| Agriculture, Fishing & Hunting | 4 (100.0%) | 0 (0.0%) |
| Mining, Quarrying, & Extraction | 0 (0.0%) | 0 (0.0%) |
| Construction | 0 (0.0%) | 0 (0.0%) |
| Manufacturing | 6 (40.0%) | 9 (60.0%) |
| Wholesale Trade | 0 (0.0%) | 0 (0.0%) |
| Retail Trade | 1 (100.0%) | 0 (0.0%) |
| Transportation & Warehousing | 3 (75.0%) | 1 (25.0%) |
| Utilities | 0 (0.0%) | 0 (0.0%) |
| Information | 0 (0.0%) | 0 (0.0%) |
| Finance & Insurance | 1 (33.3%) | 2 (66.7%) |
| Real Estate, Rental & Leasing | 0 (0.0%) | 0 (0.0%) |
| Professional & Scientific | 15 (100.0%) | 0 (0.0%) |
| Enterprise Management | 0 (0.0%) | 0 (0.0%) |
| Administrative & Support | 2 (66.7%) | 1 (33.3%) |
| Educational Services | 10 (62.5%) | 6 (37.5%) |
| Health Care & Social Assistance | 0 (0.0%) | 14 (100.0%) |
| Arts, Entertainment & Recreation | 0 (0.0%) | 0 (0.0%) |
| Accommodation & Food Services | 0 (0.0%) | 2 (100.0%) |
| Public Administration | 0 (0.0%) | 2 (100.0%) |
| Total | 42 (53.2%) | 37 (46.8%) |
Education in Silver City
School Enrollment in Silver City
The most common levels of schooling among the 27 students in Silver City are middle school (13 | 48.1%), nursery / preschool (7 | 25.9%), and college / undergraduate (4 | 14.8%).
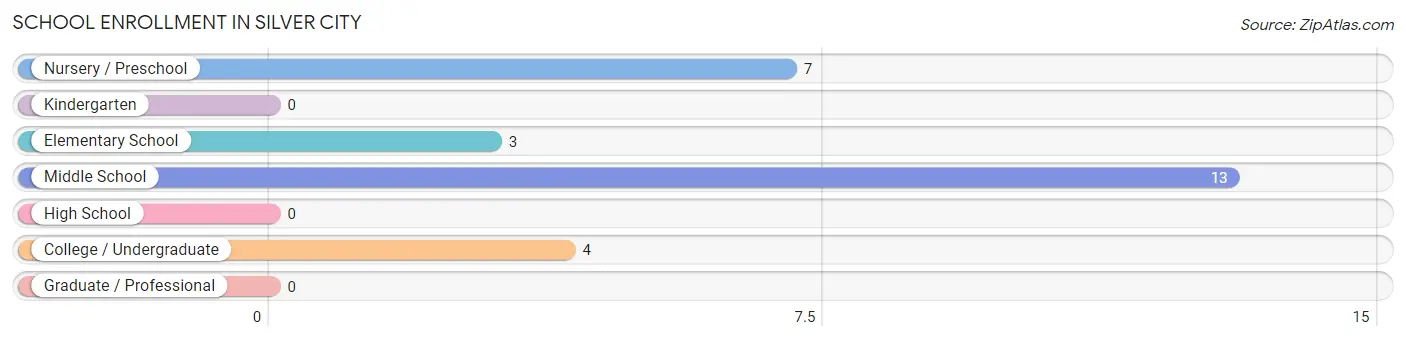
| School Level | # Students | % Students |
| Nursery / Preschool | 7 | 25.9% |
| Kindergarten | 0 | 0.0% |
| Elementary School | 3 | 11.1% |
| Middle School | 13 | 48.1% |
| High School | 0 | 0.0% |
| College / Undergraduate | 4 | 14.8% |
| Graduate / Professional | 0 | 0.0% |
| Total | 27 | 100.0% |
School Enrollment by Age by Funding Source in Silver City
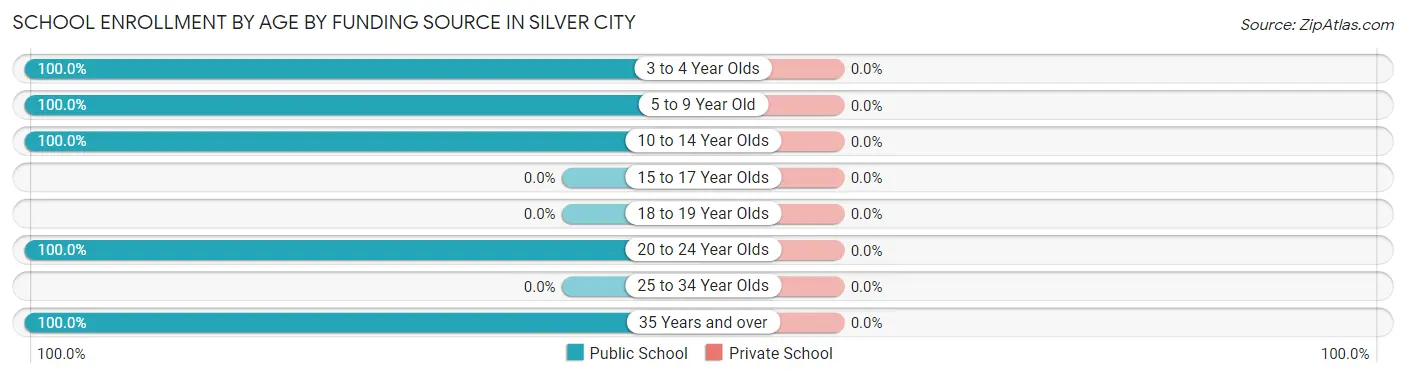
| Age Bracket | Public School | Private School |
| 3 to 4 Year Olds | 7 (100.0%) | 0 (0.0%) |
| 5 to 9 Year Old | 3 (100.0%) | 0 (0.0%) |
| 10 to 14 Year Olds | 13 (100.0%) | 0 (0.0%) |
| 15 to 17 Year Olds | 0 (0.0%) | 0 (0.0%) |
| 18 to 19 Year Olds | 0 (0.0%) | 0 (0.0%) |
| 20 to 24 Year Olds | 1 (100.0%) | 0 (0.0%) |
| 25 to 34 Year Olds | 0 (0.0%) | 0 (0.0%) |
| 35 Years and over | 3 (100.0%) | 0 (0.0%) |
| Total | 27 (100.0%) | 0 (0.0%) |
Educational Attainment by Field of Study in Silver City
Business (24 | 63.2%), education (10 | 26.3%), social sciences (2 | 5.3%), and literature & languages (2 | 5.3%) are the most common fields of study among 38 individuals in Silver City who have obtained a bachelor's degree or higher.
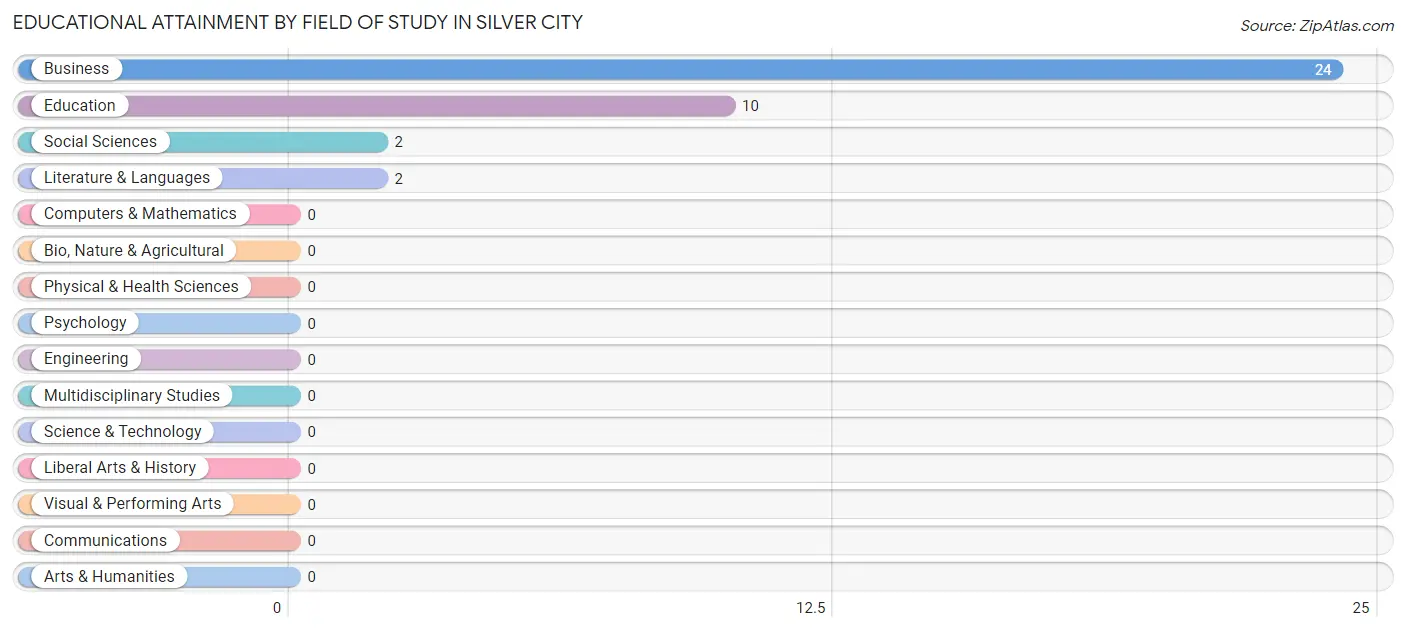
| Field of Study | # Graduates | % Graduates |
| Computers & Mathematics | 0 | 0.0% |
| Bio, Nature & Agricultural | 0 | 0.0% |
| Physical & Health Sciences | 0 | 0.0% |
| Psychology | 0 | 0.0% |
| Social Sciences | 2 | 5.3% |
| Engineering | 0 | 0.0% |
| Multidisciplinary Studies | 0 | 0.0% |
| Science & Technology | 0 | 0.0% |
| Business | 24 | 63.2% |
| Education | 10 | 26.3% |
| Literature & Languages | 2 | 5.3% |
| Liberal Arts & History | 0 | 0.0% |
| Visual & Performing Arts | 0 | 0.0% |
| Communications | 0 | 0.0% |
| Arts & Humanities | 0 | 0.0% |
| Total | 38 | 100.0% |
Transportation & Commute in Silver City
Vehicle Availability by Sex in Silver City
The most prevalent vehicle ownership categories in Silver City are males with 3 vehicles (16, accounting for 44.4%) and females with 3 vehicles (11, making up 43.2%).
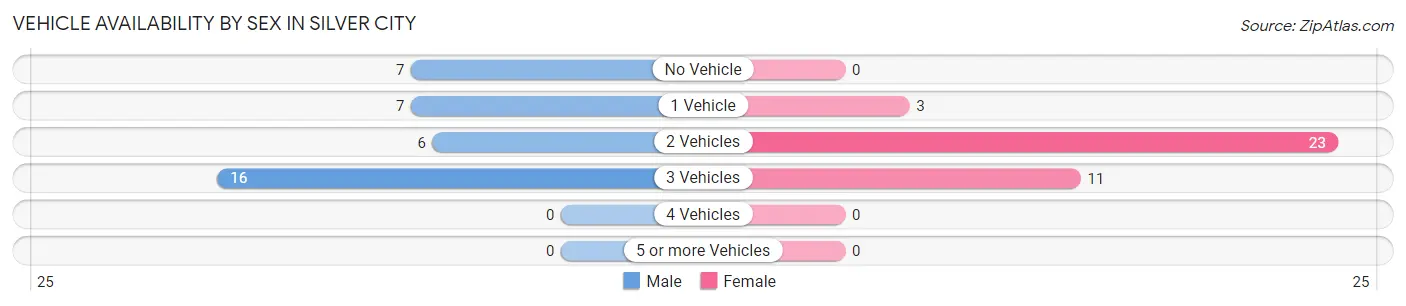
| Vehicles Available | Male | Female |
| No Vehicle | 7 (19.4%) | 0 (0.0%) |
| 1 Vehicle | 7 (19.4%) | 3 (8.1%) |
| 2 Vehicles | 6 (16.7%) | 23 (62.2%) |
| 3 Vehicles | 16 (44.4%) | 11 (29.7%) |
| 4 Vehicles | 0 (0.0%) | 0 (0.0%) |
| 5 or more Vehicles | 0 (0.0%) | 0 (0.0%) |
| Total | 36 (100.0%) | 37 (100.0%) |
Commute Time in Silver City
The most frequently occuring commute durations in Silver City are 5 to 9 minutes (18 commuters, 25.0%), 15 to 19 minutes (16 commuters, 22.2%), and 60 to 89 minutes (13 commuters, 18.1%).
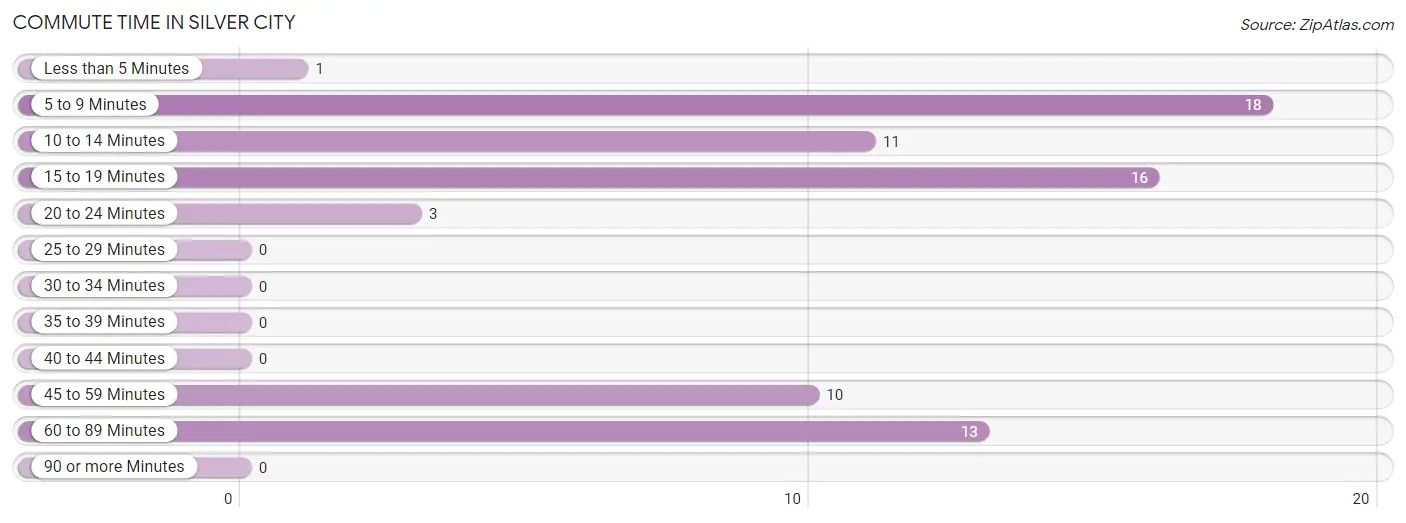
| Commute Time | # Commuters | % Commuters |
| Less than 5 Minutes | 1 | 1.4% |
| 5 to 9 Minutes | 18 | 25.0% |
| 10 to 14 Minutes | 11 | 15.3% |
| 15 to 19 Minutes | 16 | 22.2% |
| 20 to 24 Minutes | 3 | 4.2% |
| 25 to 29 Minutes | 0 | 0.0% |
| 30 to 34 Minutes | 0 | 0.0% |
| 35 to 39 Minutes | 0 | 0.0% |
| 40 to 44 Minutes | 0 | 0.0% |
| 45 to 59 Minutes | 10 | 13.9% |
| 60 to 89 Minutes | 13 | 18.1% |
| 90 or more Minutes | 0 | 0.0% |
Commute Time by Sex in Silver City
The most common commute times in Silver City are 60 to 89 minutes (13 commuters, 36.1%) for males and 5 to 9 minutes (17 commuters, 47.2%) for females.
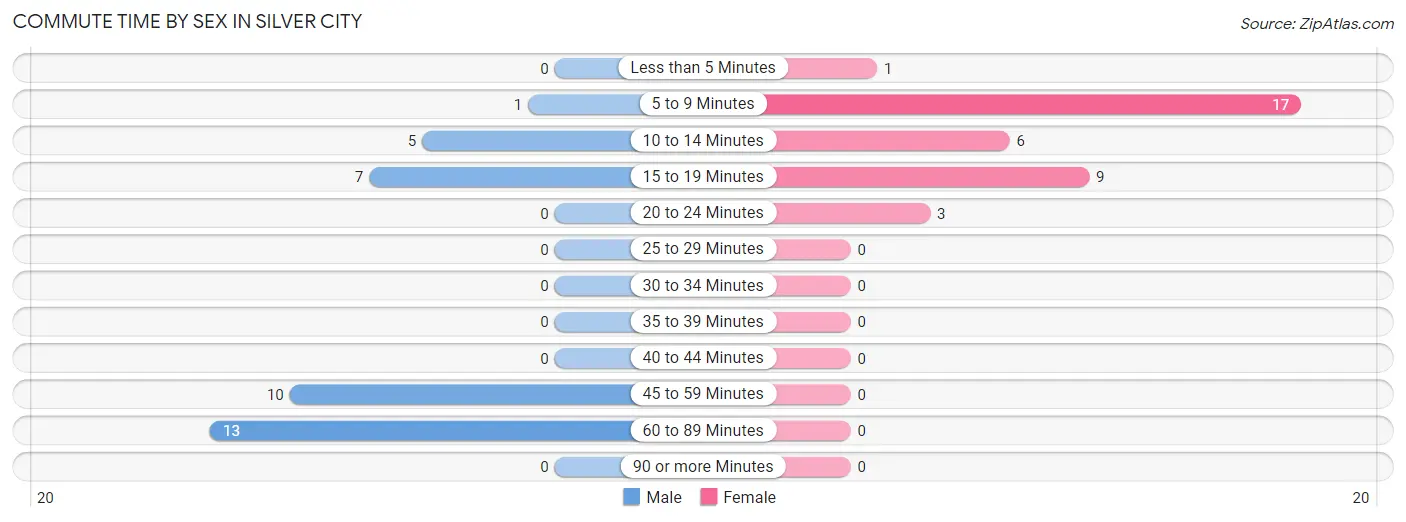
| Commute Time | Male | Female |
| Less than 5 Minutes | 0 (0.0%) | 1 (2.8%) |
| 5 to 9 Minutes | 1 (2.8%) | 17 (47.2%) |
| 10 to 14 Minutes | 5 (13.9%) | 6 (16.7%) |
| 15 to 19 Minutes | 7 (19.4%) | 9 (25.0%) |
| 20 to 24 Minutes | 0 (0.0%) | 3 (8.3%) |
| 25 to 29 Minutes | 0 (0.0%) | 0 (0.0%) |
| 30 to 34 Minutes | 0 (0.0%) | 0 (0.0%) |
| 35 to 39 Minutes | 0 (0.0%) | 0 (0.0%) |
| 40 to 44 Minutes | 0 (0.0%) | 0 (0.0%) |
| 45 to 59 Minutes | 10 (27.8%) | 0 (0.0%) |
| 60 to 89 Minutes | 13 (36.1%) | 0 (0.0%) |
| 90 or more Minutes | 0 (0.0%) | 0 (0.0%) |
Time of Departure to Work by Sex in Silver City
The most frequent times of departure to work in Silver City are 12:00 PM to 3:59 PM (14, 38.9%) for males and 7:30 AM to 7:59 AM (18, 50.0%) for females.
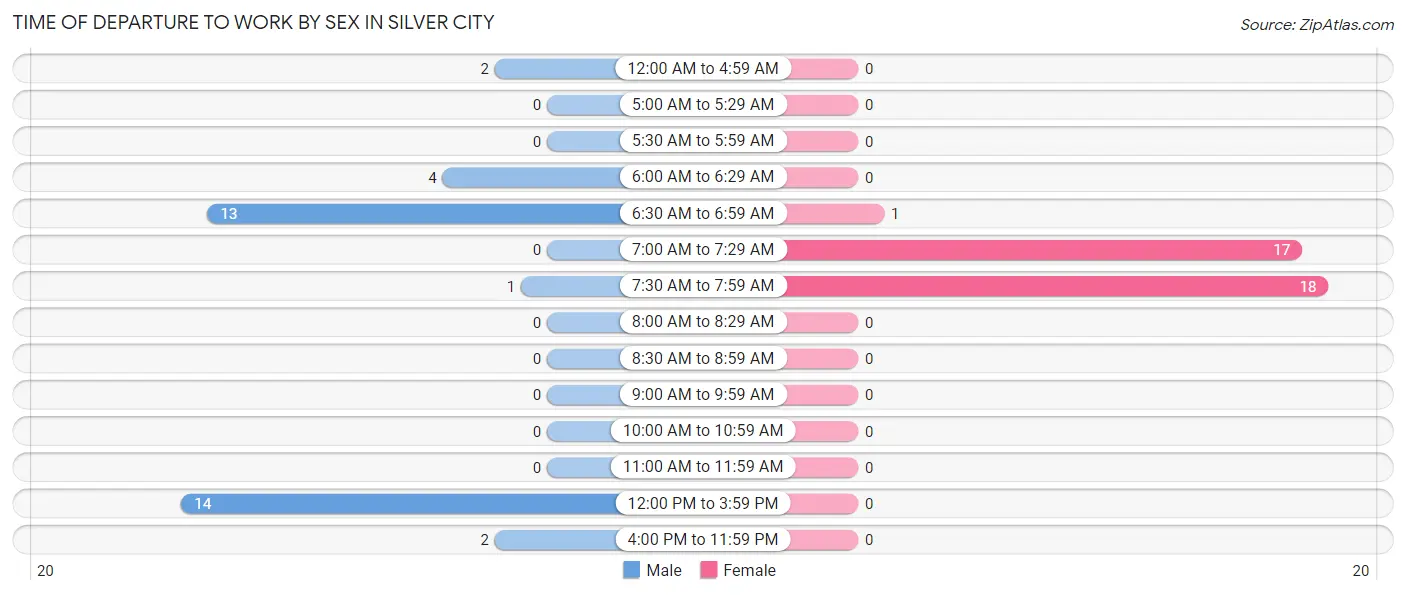
| Time of Departure | Male | Female |
| 12:00 AM to 4:59 AM | 2 (5.6%) | 0 (0.0%) |
| 5:00 AM to 5:29 AM | 0 (0.0%) | 0 (0.0%) |
| 5:30 AM to 5:59 AM | 0 (0.0%) | 0 (0.0%) |
| 6:00 AM to 6:29 AM | 4 (11.1%) | 0 (0.0%) |
| 6:30 AM to 6:59 AM | 13 (36.1%) | 1 (2.8%) |
| 7:00 AM to 7:29 AM | 0 (0.0%) | 17 (47.2%) |
| 7:30 AM to 7:59 AM | 1 (2.8%) | 18 (50.0%) |
| 8:00 AM to 8:29 AM | 0 (0.0%) | 0 (0.0%) |
| 8:30 AM to 8:59 AM | 0 (0.0%) | 0 (0.0%) |
| 9:00 AM to 9:59 AM | 0 (0.0%) | 0 (0.0%) |
| 10:00 AM to 10:59 AM | 0 (0.0%) | 0 (0.0%) |
| 11:00 AM to 11:59 AM | 0 (0.0%) | 0 (0.0%) |
| 12:00 PM to 3:59 PM | 14 (38.9%) | 0 (0.0%) |
| 4:00 PM to 11:59 PM | 2 (5.6%) | 0 (0.0%) |
| Total | 36 (100.0%) | 36 (100.0%) |
Housing Occupancy in Silver City
Occupancy by Ownership in Silver City
Of the total 94 dwellings in Silver City, owner-occupied units account for 47 (50.0%), while renter-occupied units make up 47 (50.0%).
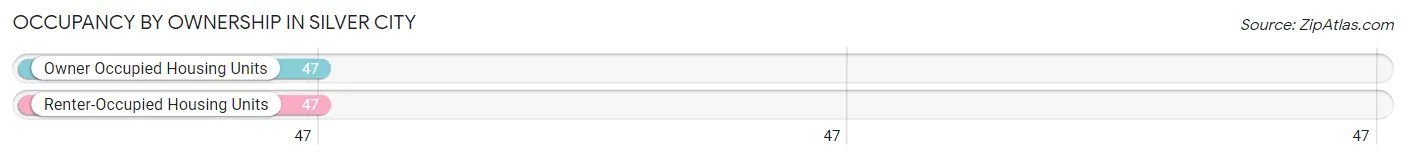
| Occupancy | # Housing Units | % Housing Units |
| Owner Occupied Housing Units | 47 | 50.0% |
| Renter-Occupied Housing Units | 47 | 50.0% |
| Total Occupied Housing Units | 94 | 100.0% |
Occupancy by Household Size in Silver City
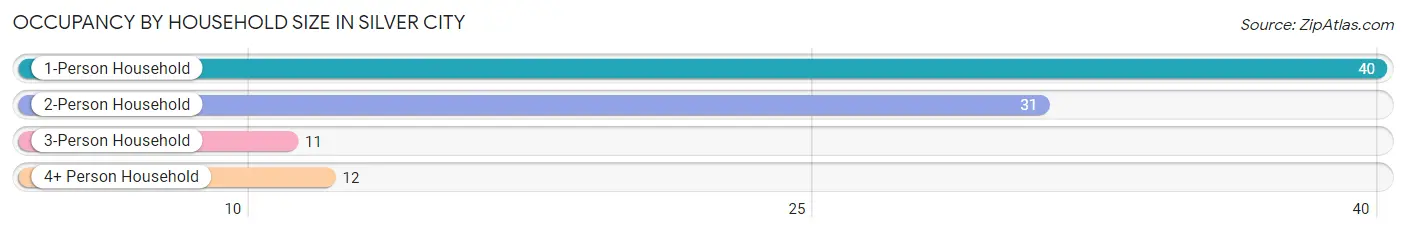
| Household Size | # Housing Units | % Housing Units |
| 1-Person Household | 40 | 42.5% |
| 2-Person Household | 31 | 33.0% |
| 3-Person Household | 11 | 11.7% |
| 4+ Person Household | 12 | 12.8% |
| Total Housing Units | 94 | 100.0% |
Occupancy by Ownership by Household Size in Silver City
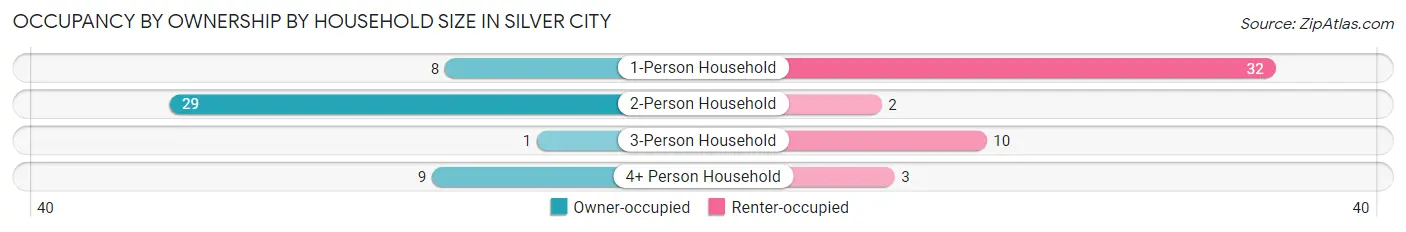
| Household Size | Owner-occupied | Renter-occupied |
| 1-Person Household | 8 (20.0%) | 32 (80.0%) |
| 2-Person Household | 29 (93.5%) | 2 (6.5%) |
| 3-Person Household | 1 (9.1%) | 10 (90.9%) |
| 4+ Person Household | 9 (75.0%) | 3 (25.0%) |
| Total Housing Units | 47 (50.0%) | 47 (50.0%) |
Occupancy by Educational Attainment in Silver City
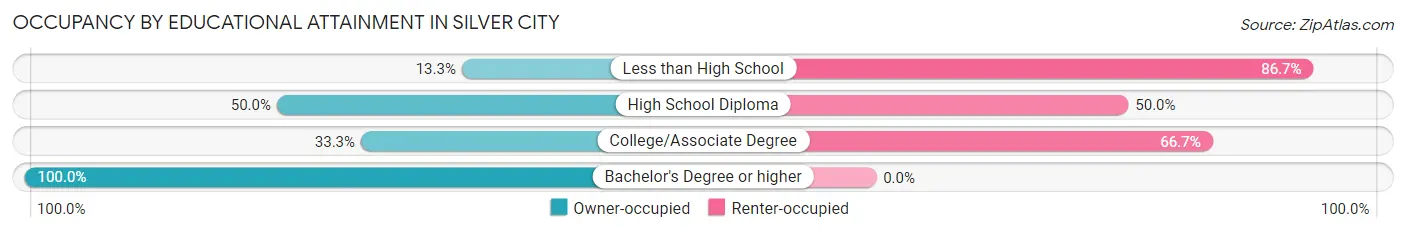
| Household Size | Owner-occupied | Renter-occupied |
| Less than High School | 2 (13.3%) | 13 (86.7%) |
| High School Diploma | 20 (50.0%) | 20 (50.0%) |
| College/Associate Degree | 7 (33.3%) | 14 (66.7%) |
| Bachelor's Degree or higher | 18 (100.0%) | 0 (0.0%) |
Occupancy by Age of Householder in Silver City
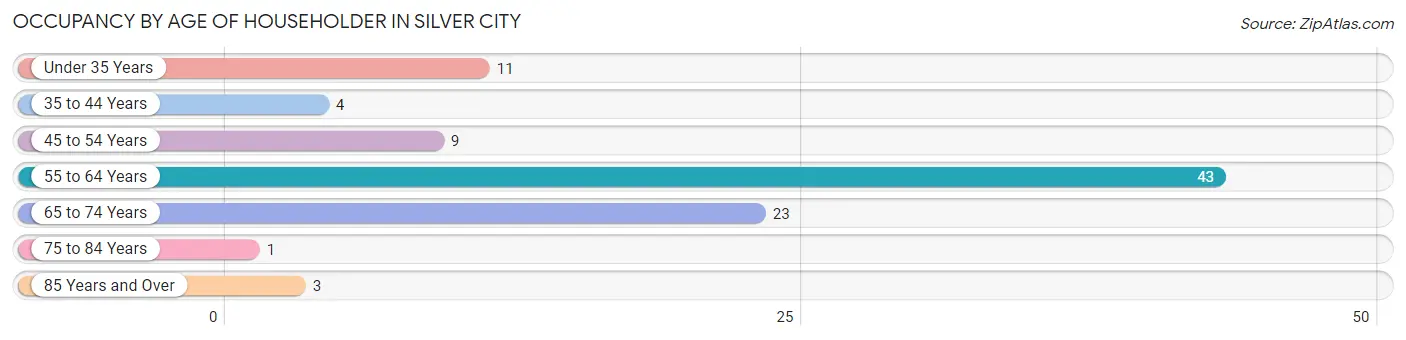
| Age Bracket | # Households | % Households |
| Under 35 Years | 11 | 11.7% |
| 35 to 44 Years | 4 | 4.3% |
| 45 to 54 Years | 9 | 9.6% |
| 55 to 64 Years | 43 | 45.7% |
| 65 to 74 Years | 23 | 24.5% |
| 75 to 84 Years | 1 | 1.1% |
| 85 Years and Over | 3 | 3.2% |
| Total | 94 | 100.0% |
Housing Finances in Silver City
Median Income by Occupancy in Silver City
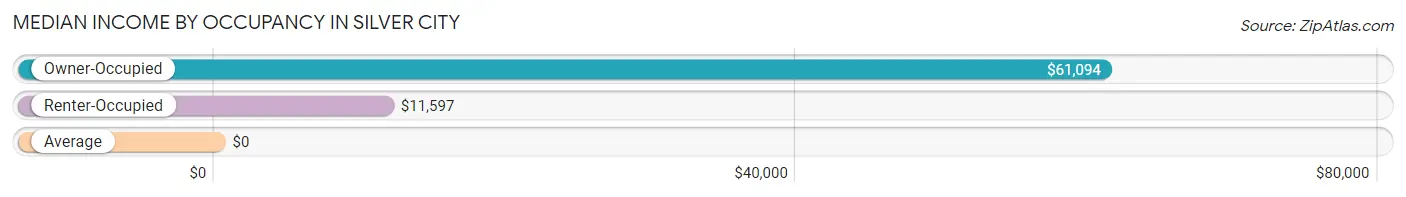
| Occupancy Type | # Households | Median Income |
| Owner-Occupied | 47 (50.0%) | $61,094 |
| Renter-Occupied | 47 (50.0%) | $11,597 |
| Average | 94 (100.0%) | $0 |
Occupancy by Householder Income Bracket in Silver City
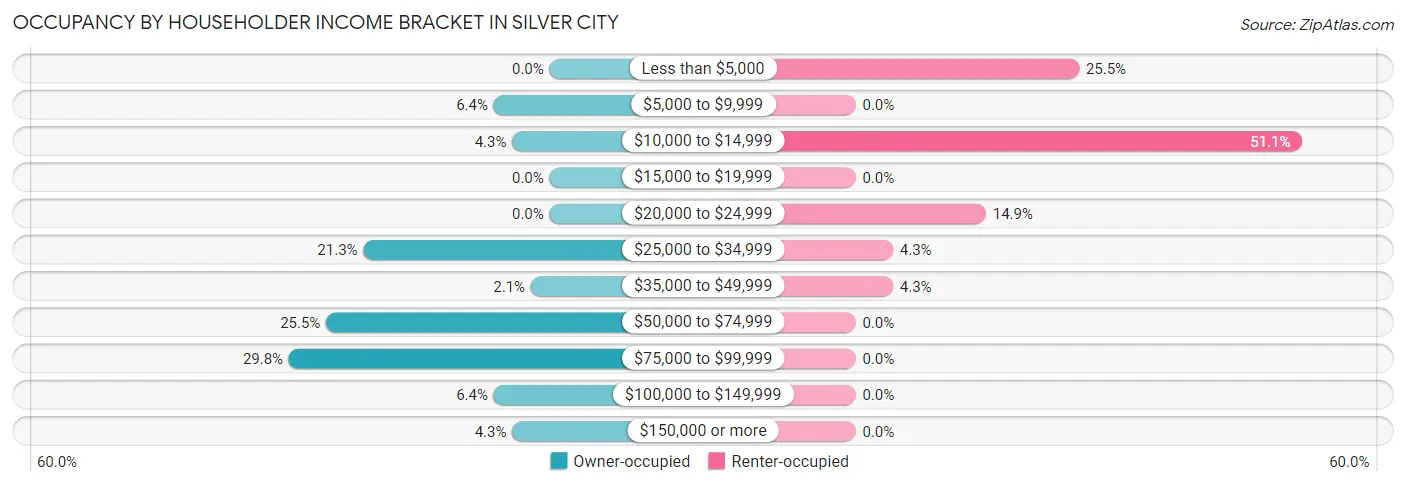
| Income Bracket | Owner-occupied | Renter-occupied |
| Less than $5,000 | 0 (0.0%) | 12 (25.5%) |
| $5,000 to $9,999 | 3 (6.4%) | 0 (0.0%) |
| $10,000 to $14,999 | 2 (4.3%) | 24 (51.1%) |
| $15,000 to $19,999 | 0 (0.0%) | 0 (0.0%) |
| $20,000 to $24,999 | 0 (0.0%) | 7 (14.9%) |
| $25,000 to $34,999 | 10 (21.3%) | 2 (4.3%) |
| $35,000 to $49,999 | 1 (2.1%) | 2 (4.3%) |
| $50,000 to $74,999 | 12 (25.5%) | 0 (0.0%) |
| $75,000 to $99,999 | 14 (29.8%) | 0 (0.0%) |
| $100,000 to $149,999 | 3 (6.4%) | 0 (0.0%) |
| $150,000 or more | 2 (4.3%) | 0 (0.0%) |
| Total | 47 (100.0%) | 47 (100.0%) |
Monthly Housing Cost Tiers in Silver City
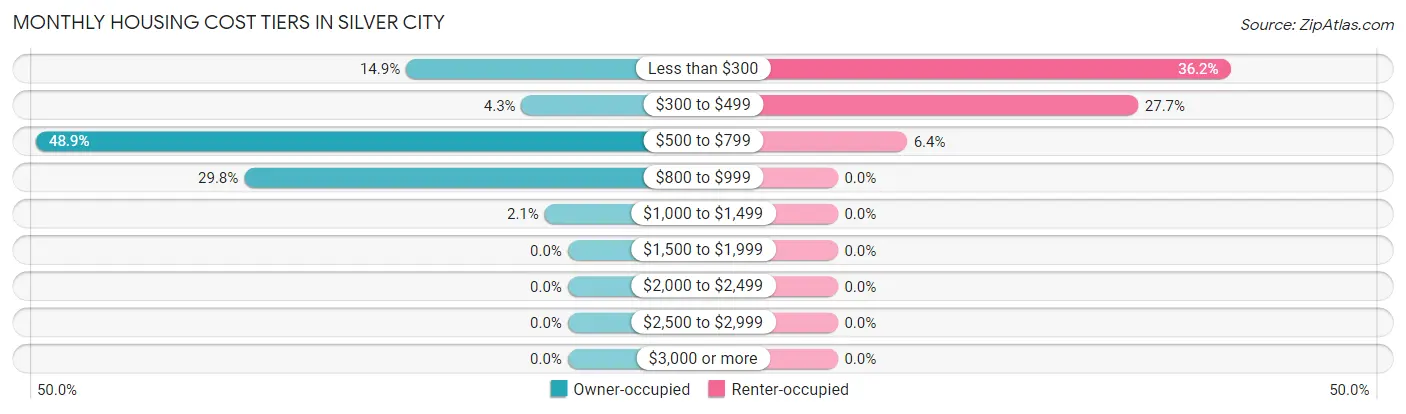
| Monthly Cost | Owner-occupied | Renter-occupied |
| Less than $300 | 7 (14.9%) | 17 (36.2%) |
| $300 to $499 | 2 (4.3%) | 13 (27.7%) |
| $500 to $799 | 23 (48.9%) | 3 (6.4%) |
| $800 to $999 | 14 (29.8%) | 0 (0.0%) |
| $1,000 to $1,499 | 1 (2.1%) | 0 (0.0%) |
| $1,500 to $1,999 | 0 (0.0%) | 0 (0.0%) |
| $2,000 to $2,499 | 0 (0.0%) | 0 (0.0%) |
| $2,500 to $2,999 | 0 (0.0%) | 0 (0.0%) |
| $3,000 or more | 0 (0.0%) | 0 (0.0%) |
| Total | 47 (100.0%) | 47 (100.0%) |
Physical Housing Characteristics in Silver City
Housing Structures in Silver City
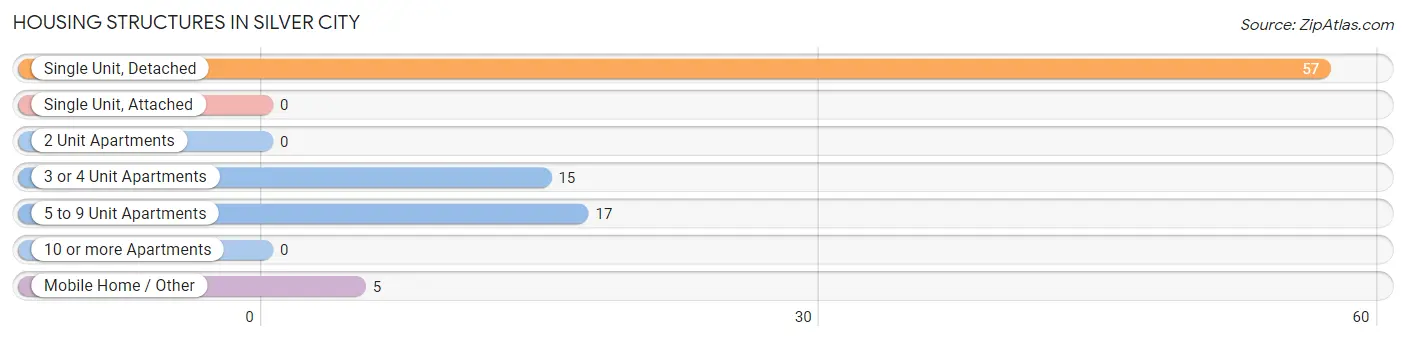
| Structure Type | # Housing Units | % Housing Units |
| Single Unit, Detached | 57 | 60.6% |
| Single Unit, Attached | 0 | 0.0% |
| 2 Unit Apartments | 0 | 0.0% |
| 3 or 4 Unit Apartments | 15 | 16.0% |
| 5 to 9 Unit Apartments | 17 | 18.1% |
| 10 or more Apartments | 0 | 0.0% |
| Mobile Home / Other | 5 | 5.3% |
| Total | 94 | 100.0% |
Housing Structures by Occupancy in Silver City
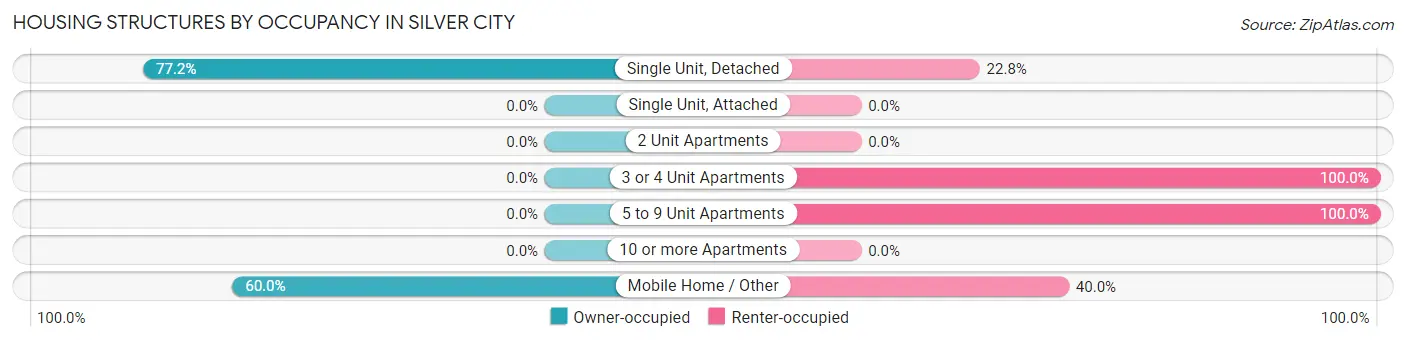
| Structure Type | Owner-occupied | Renter-occupied |
| Single Unit, Detached | 44 (77.2%) | 13 (22.8%) |
| Single Unit, Attached | 0 (0.0%) | 0 (0.0%) |
| 2 Unit Apartments | 0 (0.0%) | 0 (0.0%) |
| 3 or 4 Unit Apartments | 0 (0.0%) | 15 (100.0%) |
| 5 to 9 Unit Apartments | 0 (0.0%) | 17 (100.0%) |
| 10 or more Apartments | 0 (0.0%) | 0 (0.0%) |
| Mobile Home / Other | 3 (60.0%) | 2 (40.0%) |
| Total | 47 (50.0%) | 47 (50.0%) |
Housing Structures by Number of Rooms in Silver City
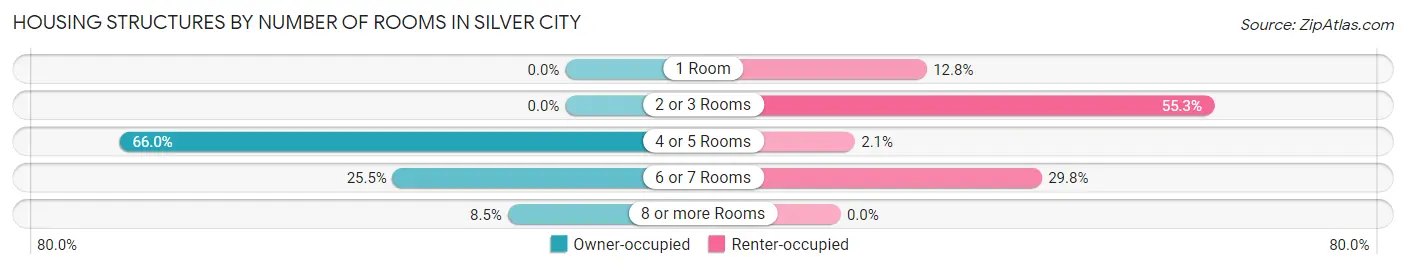
| Number of Rooms | Owner-occupied | Renter-occupied |
| 1 Room | 0 (0.0%) | 6 (12.8%) |
| 2 or 3 Rooms | 0 (0.0%) | 26 (55.3%) |
| 4 or 5 Rooms | 31 (66.0%) | 1 (2.1%) |
| 6 or 7 Rooms | 12 (25.5%) | 14 (29.8%) |
| 8 or more Rooms | 4 (8.5%) | 0 (0.0%) |
| Total | 47 (100.0%) | 47 (100.0%) |
Housing Structure by Heating Type in Silver City
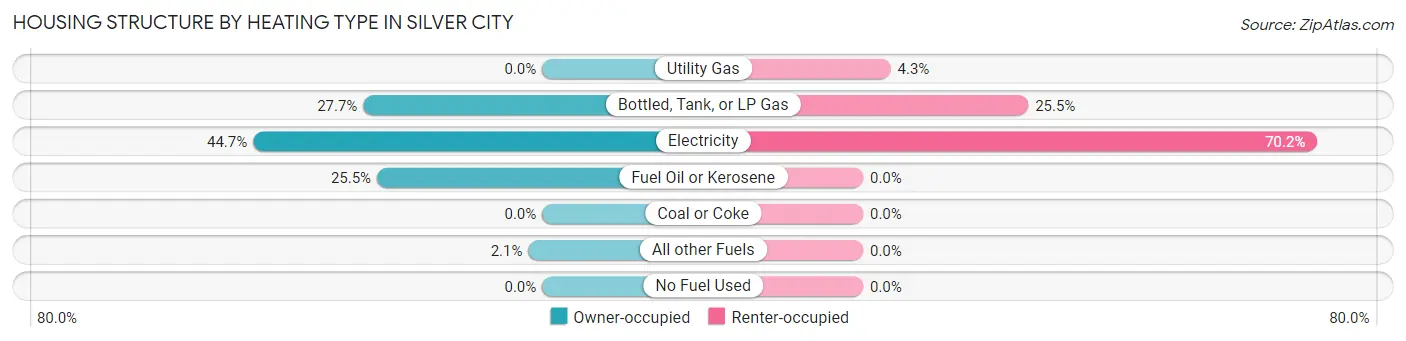
| Heating Type | Owner-occupied | Renter-occupied |
| Utility Gas | 0 (0.0%) | 2 (4.3%) |
| Bottled, Tank, or LP Gas | 13 (27.7%) | 12 (25.5%) |
| Electricity | 21 (44.7%) | 33 (70.2%) |
| Fuel Oil or Kerosene | 12 (25.5%) | 0 (0.0%) |
| Coal or Coke | 0 (0.0%) | 0 (0.0%) |
| All other Fuels | 1 (2.1%) | 0 (0.0%) |
| No Fuel Used | 0 (0.0%) | 0 (0.0%) |
| Total | 47 (100.0%) | 47 (100.0%) |
Household Vehicle Usage in Silver City
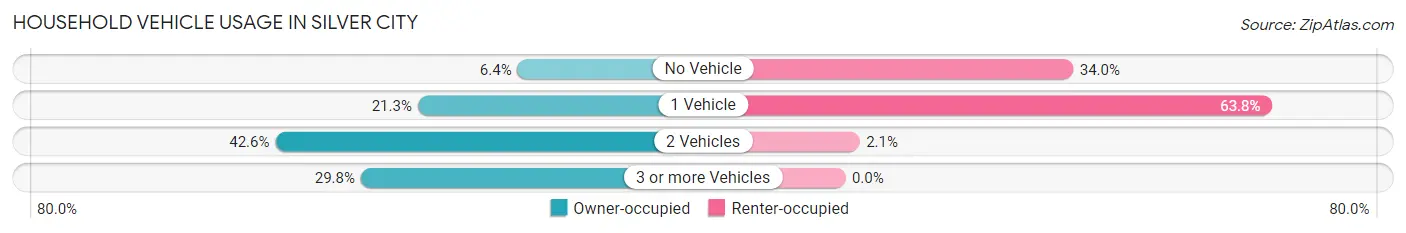
| Vehicles per Household | Owner-occupied | Renter-occupied |
| No Vehicle | 3 (6.4%) | 16 (34.0%) |
| 1 Vehicle | 10 (21.3%) | 30 (63.8%) |
| 2 Vehicles | 20 (42.5%) | 1 (2.1%) |
| 3 or more Vehicles | 14 (29.8%) | 0 (0.0%) |
| Total | 47 (100.0%) | 47 (100.0%) |
Real Estate & Mortgages in Silver City
Real Estate and Mortgage Overview in Silver City
| Characteristic | Without Mortgage | With Mortgage |
| Housing Units | 32 | 15 |
| Median Property Value | $102,800 | $85,500 |
| Median Household Income | $90,556 | $0 |
| Monthly Housing Costs | $554 | $0 |
| Real Estate Taxes | - | - |
Property Value by Mortgage Status in Silver City
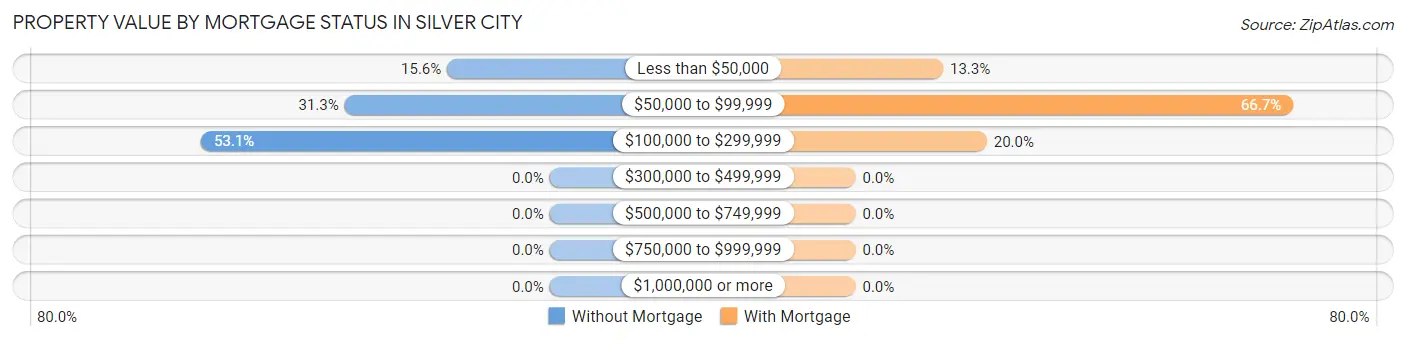
| Property Value | Without Mortgage | With Mortgage |
| Less than $50,000 | 5 (15.6%) | 2 (13.3%) |
| $50,000 to $99,999 | 10 (31.2%) | 10 (66.7%) |
| $100,000 to $299,999 | 17 (53.1%) | 3 (20.0%) |
| $300,000 to $499,999 | 0 (0.0%) | 0 (0.0%) |
| $500,000 to $749,999 | 0 (0.0%) | 0 (0.0%) |
| $750,000 to $999,999 | 0 (0.0%) | 0 (0.0%) |
| $1,000,000 or more | 0 (0.0%) | 0 (0.0%) |
| Total | 32 (100.0%) | 15 (100.0%) |
Household Income by Mortgage Status in Silver City
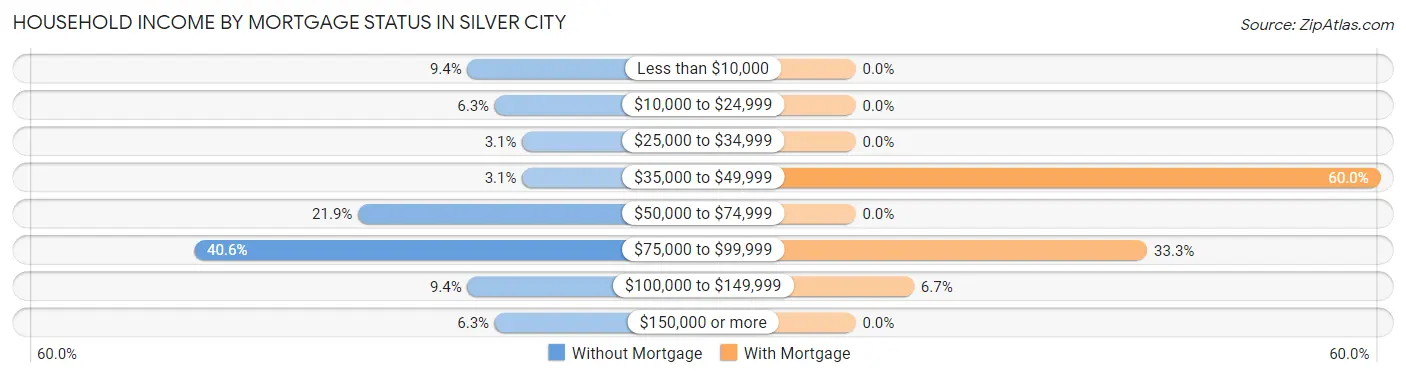
| Household Income | Without Mortgage | With Mortgage |
| Less than $10,000 | 3 (9.4%) | 0 (0.0%) |
| $10,000 to $24,999 | 2 (6.2%) | 0 (0.0%) |
| $25,000 to $34,999 | 1 (3.1%) | 0 (0.0%) |
| $35,000 to $49,999 | 1 (3.1%) | 9 (60.0%) |
| $50,000 to $74,999 | 7 (21.9%) | 0 (0.0%) |
| $75,000 to $99,999 | 13 (40.6%) | 5 (33.3%) |
| $100,000 to $149,999 | 3 (9.4%) | 1 (6.7%) |
| $150,000 or more | 2 (6.2%) | 0 (0.0%) |
| Total | 32 (100.0%) | 15 (100.0%) |
Property Value to Household Income Ratio in Silver City
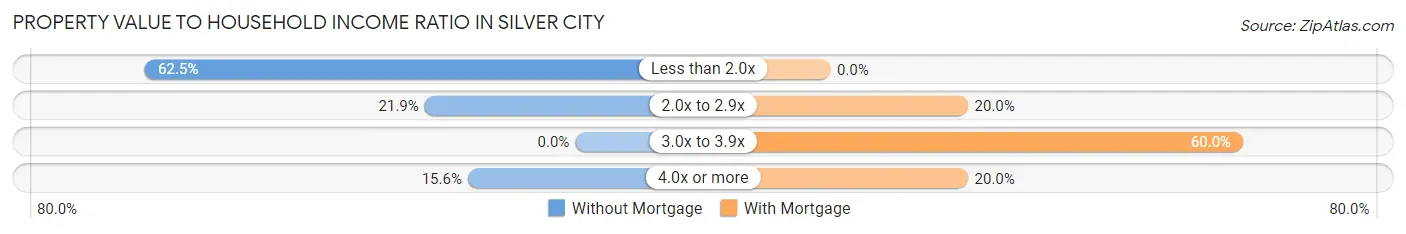
| Value-to-Income Ratio | Without Mortgage | With Mortgage |
| Less than 2.0x | 20 (62.5%) | 0 (0.0%) |
| 2.0x to 2.9x | 7 (21.9%) | 3 (20.0%) |
| 3.0x to 3.9x | 0 (0.0%) | 9 (60.0%) |
| 4.0x or more | 5 (15.6%) | 3 (20.0%) |
| Total | 32 (100.0%) | 15 (100.0%) |
Real Estate Taxes by Mortgage Status in Silver City
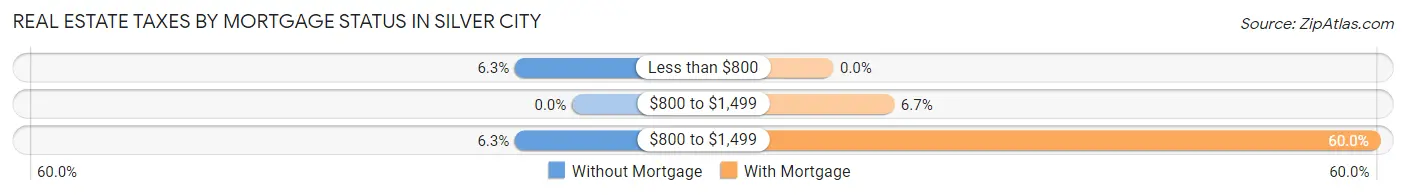
| Property Taxes | Without Mortgage | With Mortgage |
| Less than $800 | 2 (6.2%) | 0 (0.0%) |
| $800 to $1,499 | 0 (0.0%) | 1 (6.7%) |
| $800 to $1,499 | 2 (6.2%) | 9 (60.0%) |
| Total | 32 (100.0%) | 15 (100.0%) |
Health & Disability in Silver City
Health Insurance Coverage by Age in Silver City
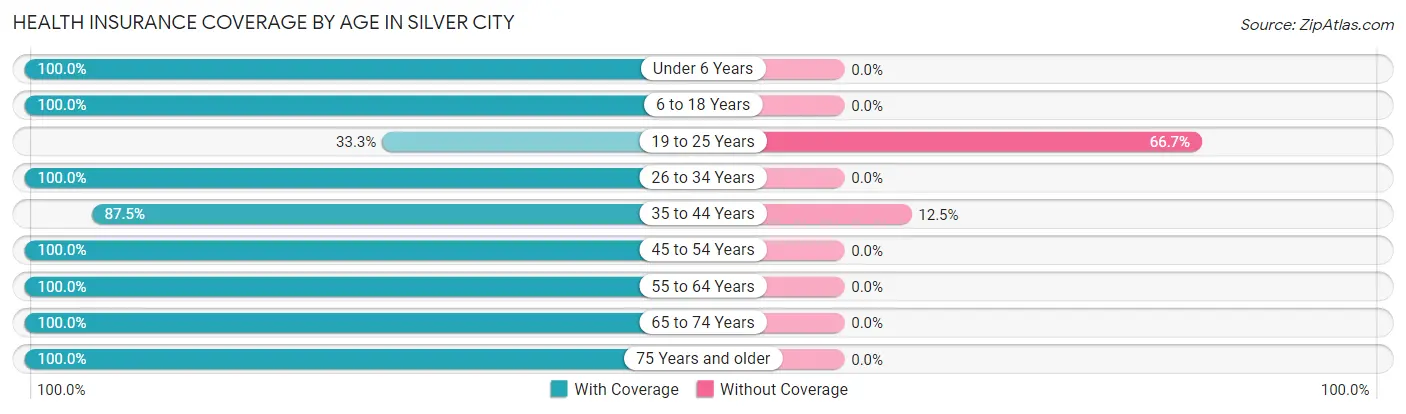
| Age Bracket | With Coverage | Without Coverage |
| Under 6 Years | 13 (100.0%) | 0 (0.0%) |
| 6 to 18 Years | 19 (100.0%) | 0 (0.0%) |
| 19 to 25 Years | 2 (33.3%) | 4 (66.7%) |
| 26 to 34 Years | 27 (100.0%) | 0 (0.0%) |
| 35 to 44 Years | 7 (87.5%) | 1 (12.5%) |
| 45 to 54 Years | 16 (100.0%) | 0 (0.0%) |
| 55 to 64 Years | 66 (100.0%) | 0 (0.0%) |
| 65 to 74 Years | 35 (100.0%) | 0 (0.0%) |
| 75 Years and older | 11 (100.0%) | 0 (0.0%) |
| Total | 196 (97.5%) | 5 (2.5%) |
Health Insurance Coverage by Citizenship Status in Silver City
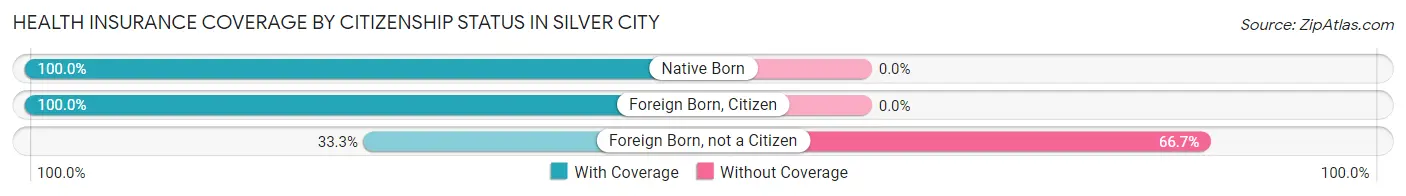
| Citizenship Status | With Coverage | Without Coverage |
| Native Born | 13 (100.0%) | 0 (0.0%) |
| Foreign Born, Citizen | 19 (100.0%) | 0 (0.0%) |
| Foreign Born, not a Citizen | 2 (33.3%) | 4 (66.7%) |
Health Insurance Coverage by Household Income in Silver City
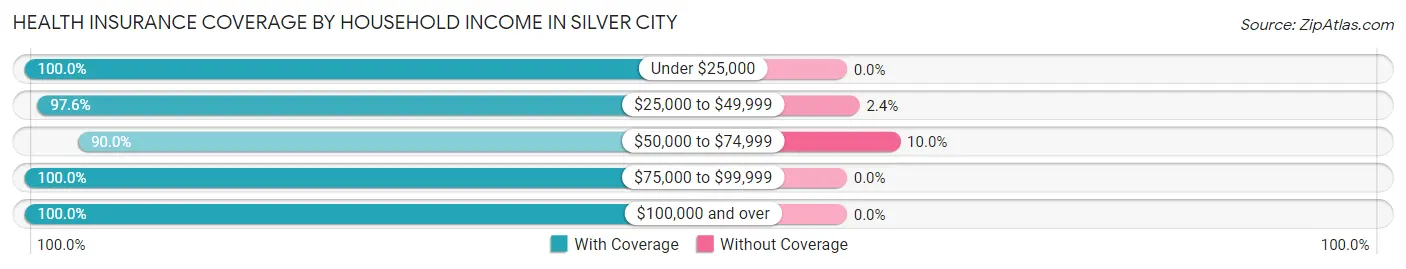
| Household Income | With Coverage | Without Coverage |
| Under $25,000 | 69 (100.0%) | 0 (0.0%) |
| $25,000 to $49,999 | 41 (97.6%) | 1 (2.4%) |
| $50,000 to $74,999 | 36 (90.0%) | 4 (10.0%) |
| $75,000 to $99,999 | 43 (100.0%) | 0 (0.0%) |
| $100,000 and over | 7 (100.0%) | 0 (0.0%) |
Public vs Private Health Insurance Coverage by Age in Silver City
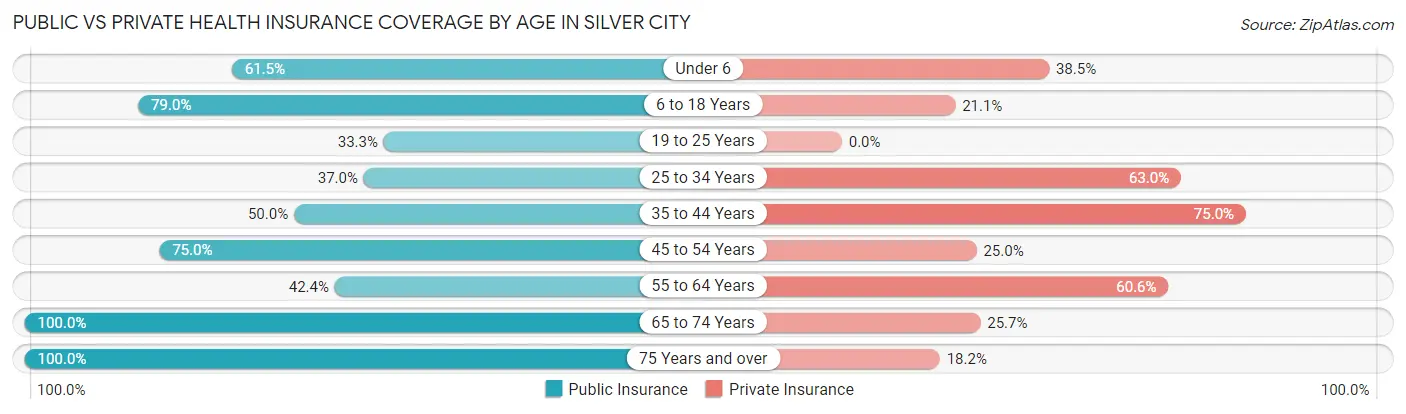
| Age Bracket | Public Insurance | Private Insurance |
| Under 6 | 8 (61.5%) | 5 (38.5%) |
| 6 to 18 Years | 15 (78.9%) | 4 (21.0%) |
| 19 to 25 Years | 2 (33.3%) | 0 (0.0%) |
| 25 to 34 Years | 10 (37.0%) | 17 (63.0%) |
| 35 to 44 Years | 4 (50.0%) | 6 (75.0%) |
| 45 to 54 Years | 12 (75.0%) | 4 (25.0%) |
| 55 to 64 Years | 28 (42.4%) | 40 (60.6%) |
| 65 to 74 Years | 35 (100.0%) | 9 (25.7%) |
| 75 Years and over | 11 (100.0%) | 2 (18.2%) |
| Total | 125 (62.2%) | 87 (43.3%) |
Disability Status by Sex by Age in Silver City
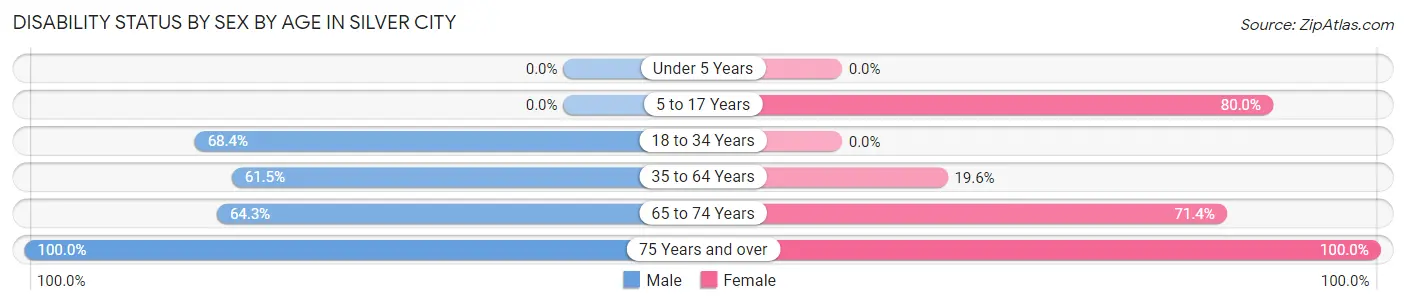
| Age Bracket | Male | Female |
| Under 5 Years | 0 (0.0%) | 0 (0.0%) |
| 5 to 17 Years | 0 (0.0%) | 12 (80.0%) |
| 18 to 34 Years | 13 (68.4%) | 0 (0.0%) |
| 35 to 64 Years | 24 (61.5%) | 10 (19.6%) |
| 65 to 74 Years | 9 (64.3%) | 15 (71.4%) |
| 75 Years and over | 8 (100.0%) | 3 (100.0%) |
Disability Class by Sex by Age in Silver City
Disability Class: Hearing Difficulty
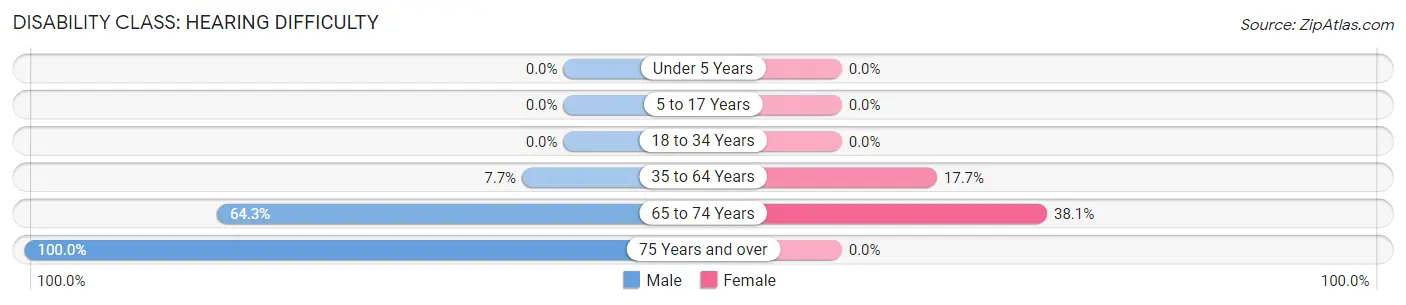
| Age Bracket | Male | Female |
| Under 5 Years | 0 (0.0%) | 0 (0.0%) |
| 5 to 17 Years | 0 (0.0%) | 0 (0.0%) |
| 18 to 34 Years | 0 (0.0%) | 0 (0.0%) |
| 35 to 64 Years | 3 (7.7%) | 9 (17.6%) |
| 65 to 74 Years | 9 (64.3%) | 8 (38.1%) |
| 75 Years and over | 8 (100.0%) | 0 (0.0%) |
Disability Class: Vision Difficulty
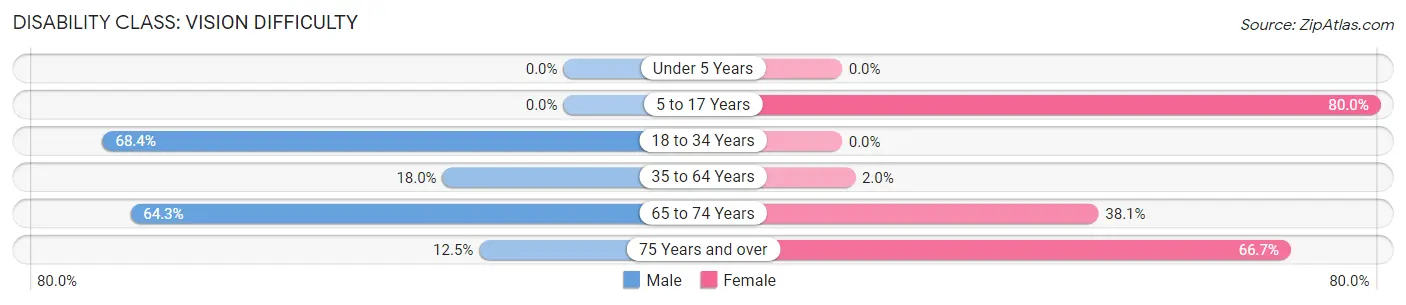
| Age Bracket | Male | Female |
| Under 5 Years | 0 (0.0%) | 0 (0.0%) |
| 5 to 17 Years | 0 (0.0%) | 12 (80.0%) |
| 18 to 34 Years | 13 (68.4%) | 0 (0.0%) |
| 35 to 64 Years | 7 (17.9%) | 1 (2.0%) |
| 65 to 74 Years | 9 (64.3%) | 8 (38.1%) |
| 75 Years and over | 1 (12.5%) | 2 (66.7%) |
Disability Class: Cognitive Difficulty
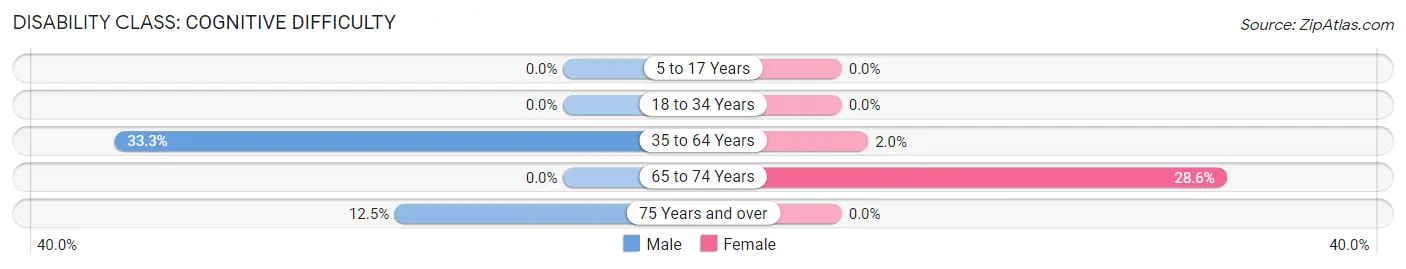
| Age Bracket | Male | Female |
| 5 to 17 Years | 0 (0.0%) | 0 (0.0%) |
| 18 to 34 Years | 0 (0.0%) | 0 (0.0%) |
| 35 to 64 Years | 13 (33.3%) | 1 (2.0%) |
| 65 to 74 Years | 0 (0.0%) | 6 (28.6%) |
| 75 Years and over | 1 (12.5%) | 0 (0.0%) |
Disability Class: Ambulatory Difficulty
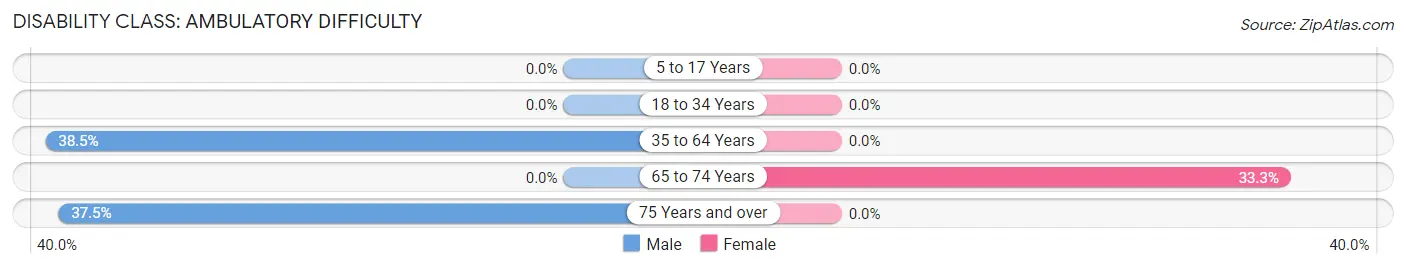
| Age Bracket | Male | Female |
| 5 to 17 Years | 0 (0.0%) | 0 (0.0%) |
| 18 to 34 Years | 0 (0.0%) | 0 (0.0%) |
| 35 to 64 Years | 15 (38.5%) | 0 (0.0%) |
| 65 to 74 Years | 0 (0.0%) | 7 (33.3%) |
| 75 Years and over | 3 (37.5%) | 0 (0.0%) |
Disability Class: Self-Care Difficulty
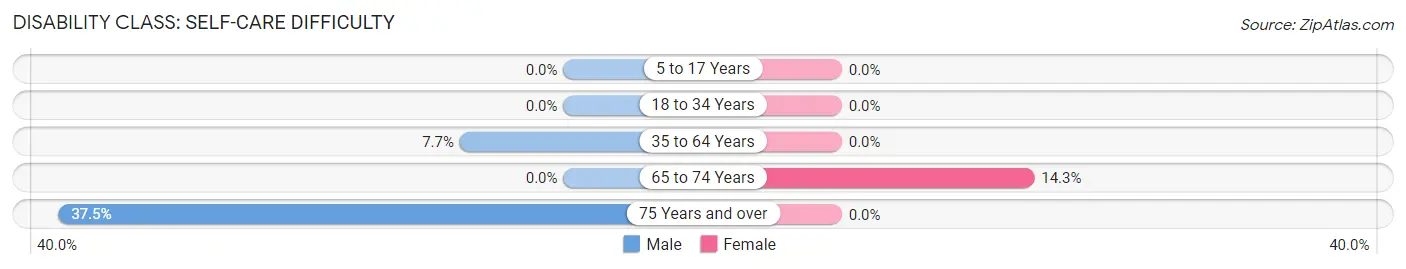
| Age Bracket | Male | Female |
| 5 to 17 Years | 0 (0.0%) | 0 (0.0%) |
| 18 to 34 Years | 0 (0.0%) | 0 (0.0%) |
| 35 to 64 Years | 3 (7.7%) | 0 (0.0%) |
| 65 to 74 Years | 0 (0.0%) | 3 (14.3%) |
| 75 Years and over | 3 (37.5%) | 0 (0.0%) |
Technology Access in Silver City
Computing Device Access in Silver City
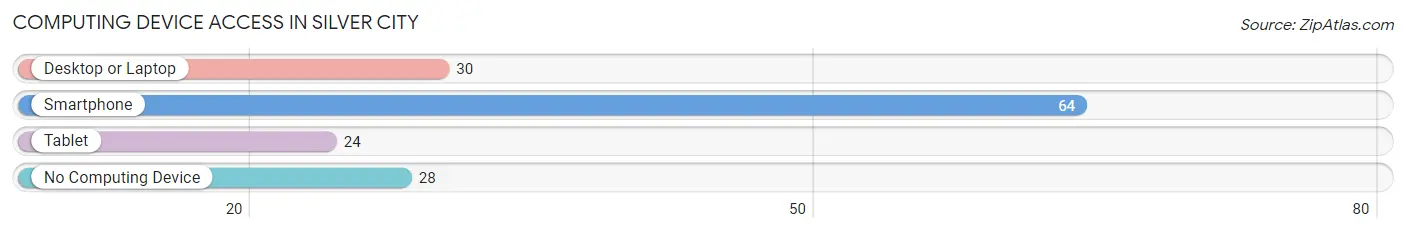
| Device Type | # Households | % Households |
| Desktop or Laptop | 30 | 31.9% |
| Smartphone | 64 | 68.1% |
| Tablet | 24 | 25.5% |
| No Computing Device | 28 | 29.8% |
| Total | 94 | 100.0% |
Internet Access in Silver City
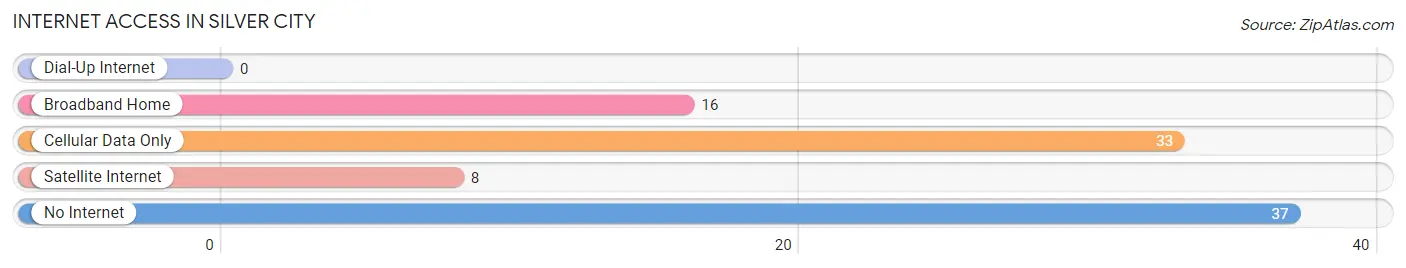
| Internet Type | # Households | % Households |
| Dial-Up Internet | 0 | 0.0% |
| Broadband Home | 16 | 17.0% |
| Cellular Data Only | 33 | 35.1% |
| Satellite Internet | 8 | 8.5% |
| No Internet | 37 | 39.4% |
| Total | 94 | 100.0% |
Silver City Summary
Silver City is a small town located in the state of Mississippi, in the United States of America. It is situated in the northern part of the state, in the county of Bolivar. The town has a population of approximately 1,000 people, and is located in the Mississippi Delta region.
History
Silver City was founded in 1883 by a group of African-American settlers who had been freed from slavery. The town was named after the silver coins that were used to purchase the land. The town was originally a farming community, and the settlers grew cotton, corn, and other crops.
In the early 1900s, the town began to grow and develop. The first school was built in 1906, and the first church was built in 1908. The town also had a post office, a general store, and a blacksmith shop.
In the 1920s, the town began to experience a period of growth and prosperity. The population increased, and new businesses opened. The town also had a movie theater, a library, and a hospital.
In the 1950s, the town began to decline. The population decreased, and many businesses closed. The town was also affected by the civil rights movement, and many African-Americans left the town in search of better opportunities.
Geography
Silver City is located in the northern part of the state of Mississippi, in the county of Bolivar. The town is situated in the Mississippi Delta region, and is surrounded by flat, fertile farmland. The town is located near the Mississippi River, and is about 30 miles south of Memphis, Tennessee.
The climate in Silver City is humid subtropical, with hot, humid summers and mild winters. The average annual temperature is around 70 degrees Fahrenheit, and the average annual precipitation is around 50 inches.
Economy
The economy of Silver City is largely based on agriculture. The town is surrounded by farmland, and the main crops grown in the area are cotton, corn, soybeans, and rice. The town also has a few small businesses, including a grocery store, a hardware store, and a few restaurants.
Demographics
As of the 2010 census, the population of Silver City was 1,000 people. The racial makeup of the town was 79.2% African-American, 19.2% White, and 1.6% other. The median household income was $25,000, and the median age was 37 years.
Conclusion
Silver City is a small town located in the state of Mississippi, in the United States of America. It was founded in 1883 by a group of African-American settlers, and has a population of approximately 1,000 people. The town is situated in the Mississippi Delta region, and is surrounded by flat, fertile farmland. The economy of Silver City is largely based on agriculture, and the town also has a few small businesses. The racial makeup of the town is 79.2% African-American, 19.2% White, and 1.6% other.
Common Questions
What is Per Capita Income in Silver City?
Per Capita income in Silver City is $24,288.
What is the Median Family Income in Silver City?
Median Family Income in Silver City is $53,750.
What is Inequality or Gini Index in Silver City?
Inequality or Gini Index in Silver City is 0.58.
What is the Total Population of Silver City?
Total Population of Silver City is 201.
What is the Total Male Population of Silver City?
Total Male Population of Silver City is 93.
What is the Total Female Population of Silver City?
Total Female Population of Silver City is 108.
What is the Ratio of Males per 100 Females in Silver City?
There are 86.11 Males per 100 Females in Silver City.
What is the Ratio of Females per 100 Males in Silver City?
There are 116.13 Females per 100 Males in Silver City.
What is the Median Population Age in Silver City?
Median Population Age in Silver City is 57.0 Years.
What is the Average Family Size in Silver City
Average Family Size in Silver City is 2.9 People.
What is the Average Household Size in Silver City
Average Household Size in Silver City is 2.1 People.
How Large is the Labor Force in Silver City?
There are 81 People in the Labor Forcein in Silver City.
What is the Percentage of People in the Labor Force in Silver City?
47.1% of People are in the Labor Force in Silver City.
What is the Unemployment Rate in Silver City?
Unemployment Rate in Silver City is 2.5%.