Louin, MS Map & Demographics
Louin Map
Louin Overview
$32,557
PER CAPITA INCOME
$110,167
AVG FAMILY INCOME
4.5%
WAGE / INCOME GAP [ % ]
95.5¢/ $1
WAGE / INCOME GAP [ $ ]
0.41
INEQUALITY / GINI INDEX
478
TOTAL POPULATION
255
MALE POPULATION
223
FEMALE POPULATION
114.35
MALES / 100 FEMALES
87.45
FEMALES / 100 MALES
48.4
MEDIAN AGE
2.6
AVG FAMILY SIZE
2.3
AVG HOUSEHOLD SIZE
235
LABOR FORCE [ PEOPLE ]
57.7%
PERCENT IN LABOR FORCE
4.3%
UNEMPLOYMENT RATE
Louin Zip Codes
Louin Area Codes
Income in Louin
Income Overview in Louin
| Characteristic | Number | Measure |
| Per Capita Income | 478 | $32,557 |
| Median Family Income | 166 | $110,167 |
| Mean Family Income | 166 | $89,289 |
| Median Household Income | 208 | $0 |
| Mean Household Income | 208 | $77,073 |
| Income Deficit | 166 | $0 |
| Wage / Income Gap (%) | 478 | 4.47% |
| Wage / Income Gap ($) | 478 | 95.53¢ per $1 |
| Gini / Inequality Index | 478 | 0.41 |
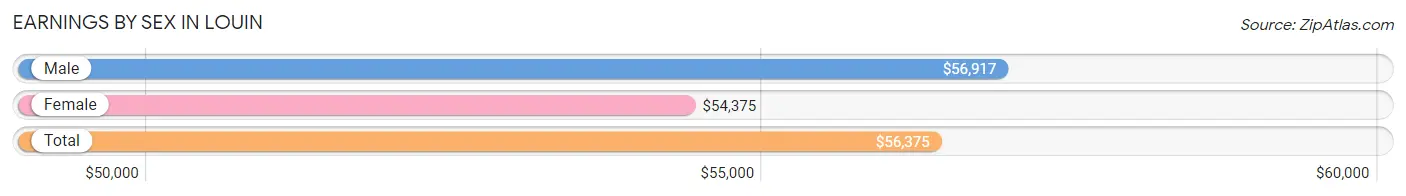
Earnings by Sex in Louin
Average Earnings in Louin are $56,375, $56,917 for men and $54,375 for women, a difference of 4.5%.
| Sex | Number | Average Earnings |
| Male | 117 (50.0%) | $56,917 |
| Female | 117 (50.0%) | $54,375 |
| Total | 234 (100.0%) | $56,375 |
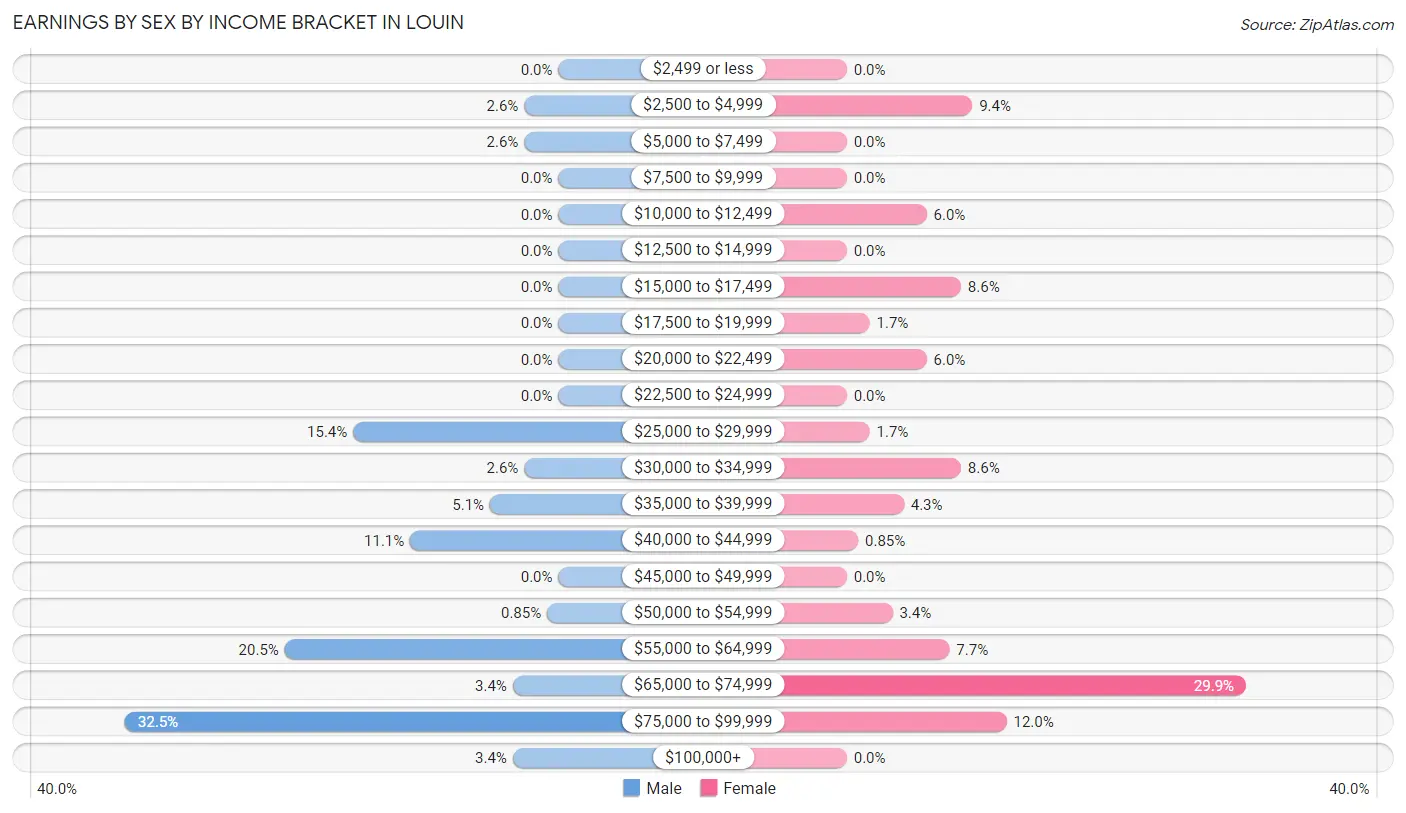
Earnings by Sex by Income Bracket in Louin
The most common earnings brackets in Louin are $75,000 to $99,999 for men (38 | 32.5%) and $65,000 to $74,999 for women (35 | 29.9%).
| Income | Male | Female |
| $2,499 or less | 0 (0.0%) | 0 (0.0%) |
| $2,500 to $4,999 | 3 (2.6%) | 11 (9.4%) |
| $5,000 to $7,499 | 3 (2.6%) | 0 (0.0%) |
| $7,500 to $9,999 | 0 (0.0%) | 0 (0.0%) |
| $10,000 to $12,499 | 0 (0.0%) | 7 (6.0%) |
| $12,500 to $14,999 | 0 (0.0%) | 0 (0.0%) |
| $15,000 to $17,499 | 0 (0.0%) | 10 (8.6%) |
| $17,500 to $19,999 | 0 (0.0%) | 2 (1.7%) |
| $20,000 to $22,499 | 0 (0.0%) | 7 (6.0%) |
| $22,500 to $24,999 | 0 (0.0%) | 0 (0.0%) |
| $25,000 to $29,999 | 18 (15.4%) | 2 (1.7%) |
| $30,000 to $34,999 | 3 (2.6%) | 10 (8.6%) |
| $35,000 to $39,999 | 6 (5.1%) | 5 (4.3%) |
| $40,000 to $44,999 | 13 (11.1%) | 1 (0.9%) |
| $45,000 to $49,999 | 0 (0.0%) | 0 (0.0%) |
| $50,000 to $54,999 | 1 (0.9%) | 4 (3.4%) |
| $55,000 to $64,999 | 24 (20.5%) | 9 (7.7%) |
| $65,000 to $74,999 | 4 (3.4%) | 35 (29.9%) |
| $75,000 to $99,999 | 38 (32.5%) | 14 (12.0%) |
| $100,000+ | 4 (3.4%) | 0 (0.0%) |
| Total | 117 (100.0%) | 117 (100.0%) |
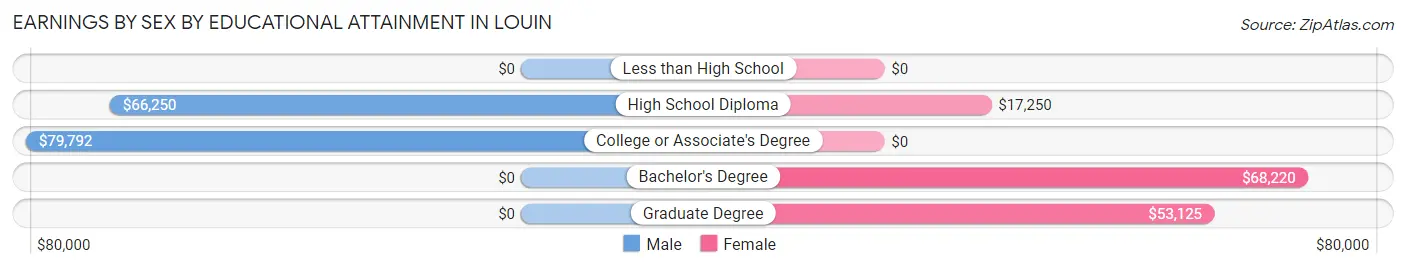
Earnings by Sex by Educational Attainment in Louin
Average earnings in Louin are $64,643 for men and $65,625 for women, a difference of 1.5%. Men with an educational attainment of college or associate's degree enjoy the highest average annual earnings of $79,792, while those with high school diploma education earn the least with $66,250. Women with an educational attainment of bachelor's degree earn the most with the average annual earnings of $68,220, while those with high school diploma education have the smallest earnings of $17,250.
| Educational Attainment | Male Income | Female Income |
| Less than High School | - | - |
| High School Diploma | $66,250 | $17,250 |
| College or Associate's Degree | $79,792 | $0 |
| Bachelor's Degree | - | - |
| Graduate Degree | - | - |
| Total | $64,643 | $65,625 |
Family Income in Louin
Family Income Brackets in Louin
According to the Louin family income data, there are 49 families falling into the $150,000 to $199,999 income range, which is the most common income bracket and makes up 29.5% of all families.
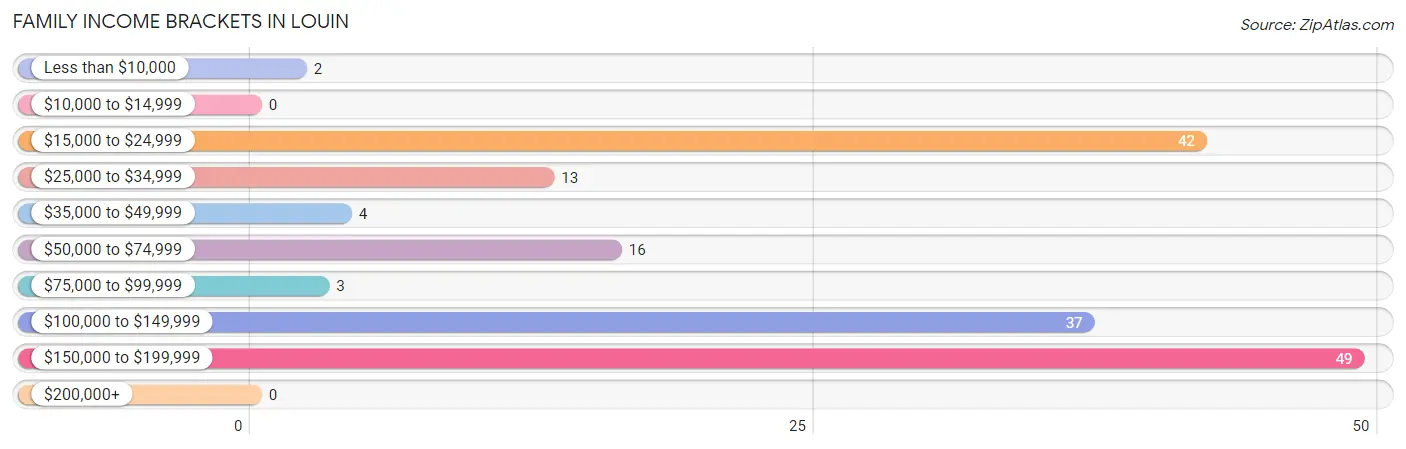
| Income Bracket | # Families | % Families |
| Less than $10,000 | 2 | 1.2% |
| $10,000 to $14,999 | 0 | 0.0% |
| $15,000 to $24,999 | 42 | 25.3% |
| $25,000 to $34,999 | 13 | 7.8% |
| $35,000 to $49,999 | 4 | 2.4% |
| $50,000 to $74,999 | 16 | 9.6% |
| $75,000 to $99,999 | 3 | 1.8% |
| $100,000 to $149,999 | 37 | 22.3% |
| $150,000 to $199,999 | 49 | 29.5% |
| $200,000+ | 0 | 0.0% |
Family Income by Famaliy Size in Louin
3-person families (65 | 39.2%) account for the highest median family income in Louin with $155,038 per family, while 3-person families (65 | 39.2%) have the highest median income of $51,679 per family member.
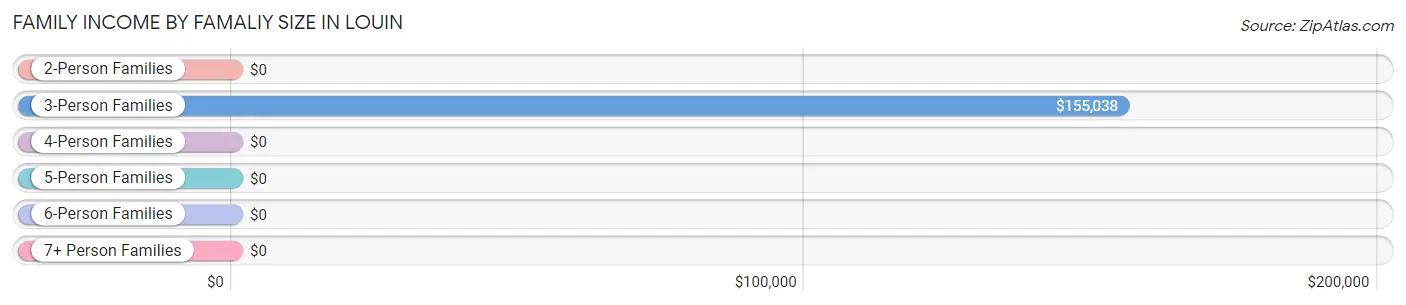
| Income Bracket | # Families | Median Income |
| 2-Person Families | 76 (45.8%) | $0 |
| 3-Person Families | 65 (39.2%) | $155,038 |
| 4-Person Families | 8 (4.8%) | $0 |
| 5-Person Families | 16 (9.6%) | $0 |
| 6-Person Families | 0 (0.0%) | $0 |
| 7+ Person Families | 1 (0.6%) | $0 |
| Total | 166 (100.0%) | $110,167 |
Family Income by Number of Earners in Louin
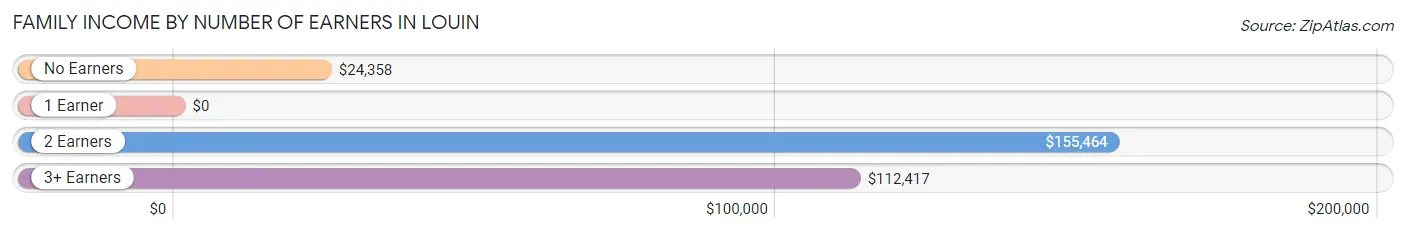
| Number of Earners | # Families | Median Income |
| No Earners | 59 (35.5%) | $24,358 |
| 1 Earner | 19 (11.5%) | $0 |
| 2 Earners | 57 (34.3%) | $155,464 |
| 3+ Earners | 31 (18.7%) | $112,417 |
| Total | 166 (100.0%) | $110,167 |
Household Income in Louin
Household Income Brackets in Louin
With 54 households falling in the category, the $15,000 to $24,999 income range is the most frequent in Louin, accounting for 26.0% of all households.
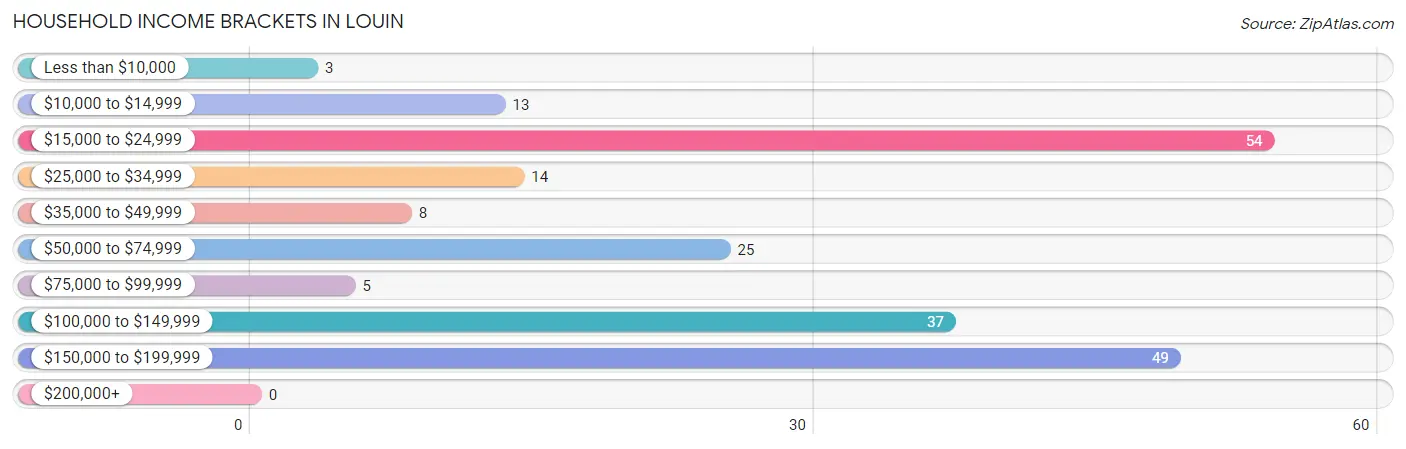
| Income Bracket | # Households | % Households |
| Less than $10,000 | 3 | 1.4% |
| $10,000 to $14,999 | 13 | 6.3% |
| $15,000 to $24,999 | 54 | 26.0% |
| $25,000 to $34,999 | 14 | 6.7% |
| $35,000 to $49,999 | 8 | 3.8% |
| $50,000 to $74,999 | 25 | 12.0% |
| $75,000 to $99,999 | 5 | 2.4% |
| $100,000 to $149,999 | 37 | 17.8% |
| $150,000 to $199,999 | 49 | 23.6% |
| $200,000+ | 0 | 0.0% |
Household Income by Householder Age in Louin
The median household income in Louin is $0, with the highest median household income of $112,333 found in the 45 to 64 years age bracket for the primary householder. A total of 114 households (54.8%) fall into this category.
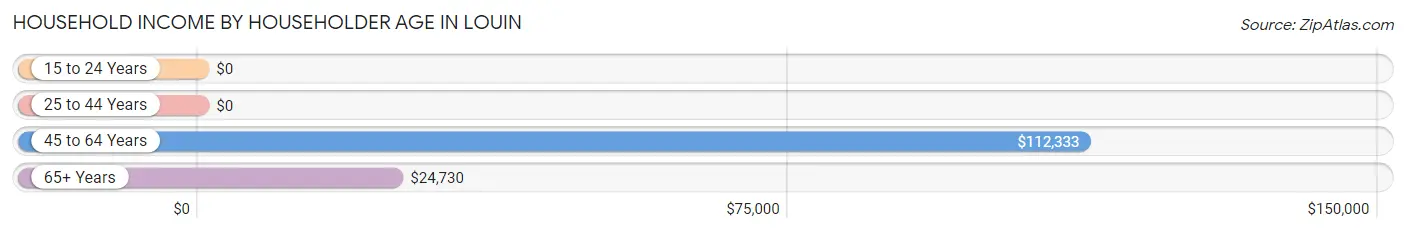
| Income Bracket | # Households | Median Income |
| 15 to 24 Years | 0 (0.0%) | $0 |
| 25 to 44 Years | 22 (10.6%) | $0 |
| 45 to 64 Years | 114 (54.8%) | $112,333 |
| 65+ Years | 72 (34.6%) | $24,730 |
| Total | 208 (100.0%) | $0 |
Poverty in Louin
Income Below Poverty by Sex and Age in Louin
With 11.4% poverty level for males and 5.4% for females among the residents of Louin, 12 to 14 year old males and 5 year old females are the most vulnerable to poverty, with 12 males (48.0%) and 2 females (100.0%) in their respective age groups living below the poverty level.
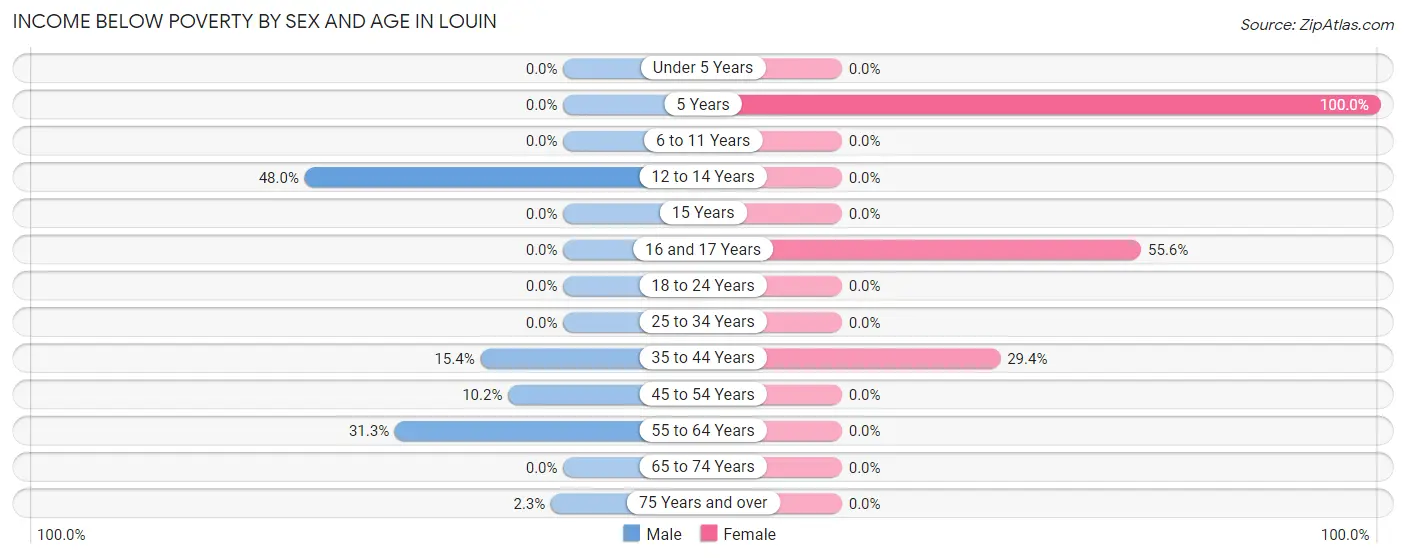
| Age Bracket | Male | Female |
| Under 5 Years | 0 (0.0%) | 0 (0.0%) |
| 5 Years | 0 (0.0%) | 2 (100.0%) |
| 6 to 11 Years | 0 (0.0%) | 0 (0.0%) |
| 12 to 14 Years | 12 (48.0%) | 0 (0.0%) |
| 15 Years | 0 (0.0%) | 0 (0.0%) |
| 16 and 17 Years | 0 (0.0%) | 5 (55.6%) |
| 18 to 24 Years | 0 (0.0%) | 0 (0.0%) |
| 25 to 34 Years | 0 (0.0%) | 0 (0.0%) |
| 35 to 44 Years | 2 (15.4%) | 5 (29.4%) |
| 45 to 54 Years | 9 (10.2%) | 0 (0.0%) |
| 55 to 64 Years | 5 (31.2%) | 0 (0.0%) |
| 65 to 74 Years | 0 (0.0%) | 0 (0.0%) |
| 75 Years and over | 1 (2.3%) | 0 (0.0%) |
| Total | 29 (11.4%) | 12 (5.4%) |
Income Above Poverty by Sex and Age in Louin
According to the poverty statistics in Louin, males aged under 5 years and females aged under 5 years are the age groups that are most secure financially, with 100.0% of males and 100.0% of females in these age groups living above the poverty line.
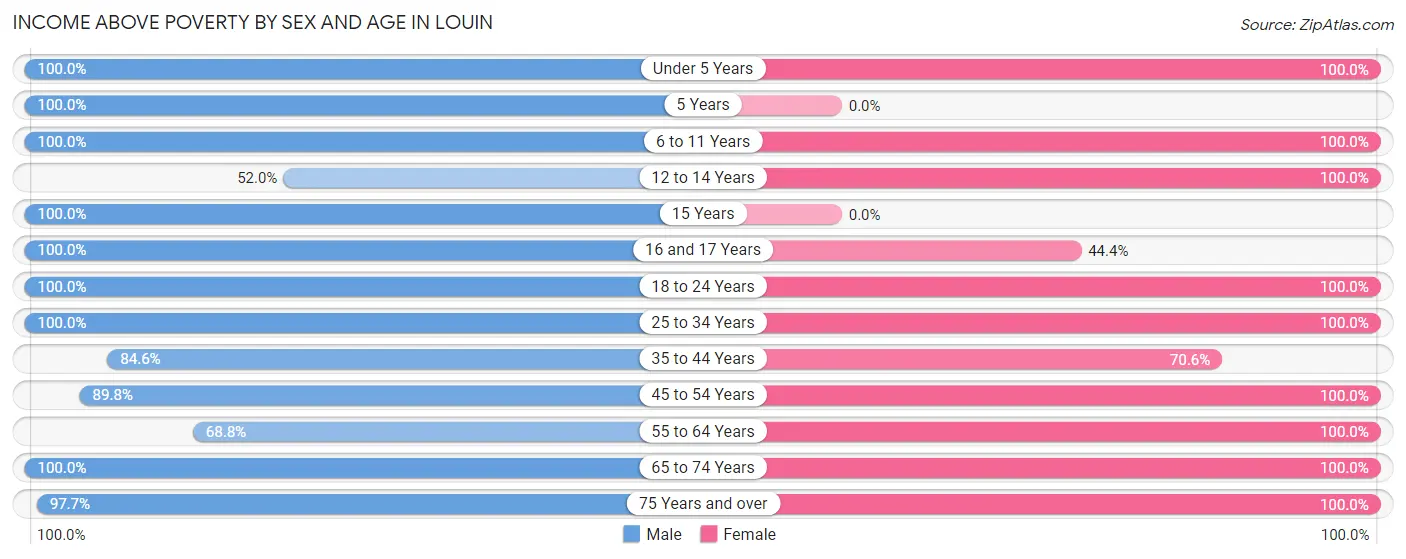
| Age Bracket | Male | Female |
| Under 5 Years | 5 (100.0%) | 2 (100.0%) |
| 5 Years | 1 (100.0%) | 0 (0.0%) |
| 6 to 11 Years | 4 (100.0%) | 6 (100.0%) |
| 12 to 14 Years | 13 (52.0%) | 18 (100.0%) |
| 15 Years | 8 (100.0%) | 0 (0.0%) |
| 16 and 17 Years | 4 (100.0%) | 4 (44.4%) |
| 18 to 24 Years | 21 (100.0%) | 20 (100.0%) |
| 25 to 34 Years | 7 (100.0%) | 4 (100.0%) |
| 35 to 44 Years | 11 (84.6%) | 12 (70.6%) |
| 45 to 54 Years | 79 (89.8%) | 93 (100.0%) |
| 55 to 64 Years | 11 (68.8%) | 13 (100.0%) |
| 65 to 74 Years | 19 (100.0%) | 21 (100.0%) |
| 75 Years and over | 43 (97.7%) | 18 (100.0%) |
| Total | 226 (88.6%) | 211 (94.6%) |
Income Below Poverty Among Married-Couple Families in Louin
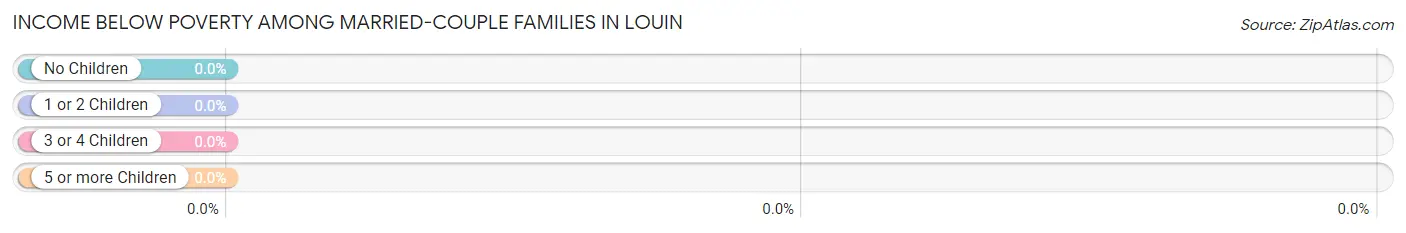
| Children | Above Poverty | Below Poverty |
| No Children | 80 (100.0%) | 0 (0.0%) |
| 1 or 2 Children | 55 (100.0%) | 0 (0.0%) |
| 3 or 4 Children | 2 (100.0%) | 0 (0.0%) |
| 5 or more Children | 0 (0.0%) | 0 (0.0%) |
| Total | 137 (100.0%) | 0 (0.0%) |
Income Below Poverty Among Single-Parent Households in Louin
According to the poverty data in Louin, 16.7% or 2 single-father households and 29.4% or 5 single-mother households are living below the poverty line. Among single-father households, those with 1 or 2 children have the highest poverty rate, with 2 households (20.0%) experiencing poverty. Likewise, among single-mother households, those with 1 or 2 children have the highest poverty rate, with 5 households (38.5%) falling below the poverty line.
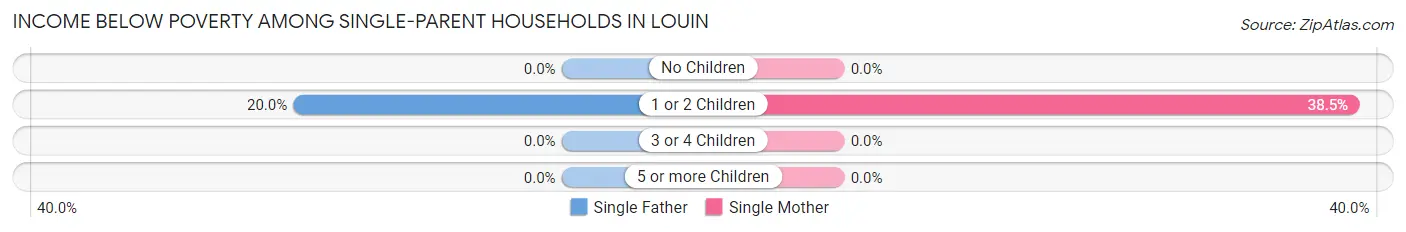
| Children | Single Father | Single Mother |
| No Children | 0 (0.0%) | 0 (0.0%) |
| 1 or 2 Children | 2 (20.0%) | 5 (38.5%) |
| 3 or 4 Children | 0 (0.0%) | 0 (0.0%) |
| 5 or more Children | 0 (0.0%) | 0 (0.0%) |
| Total | 2 (16.7%) | 5 (29.4%) |
Income Below Poverty Among Married-Couple vs Single-Parent Households in Louin
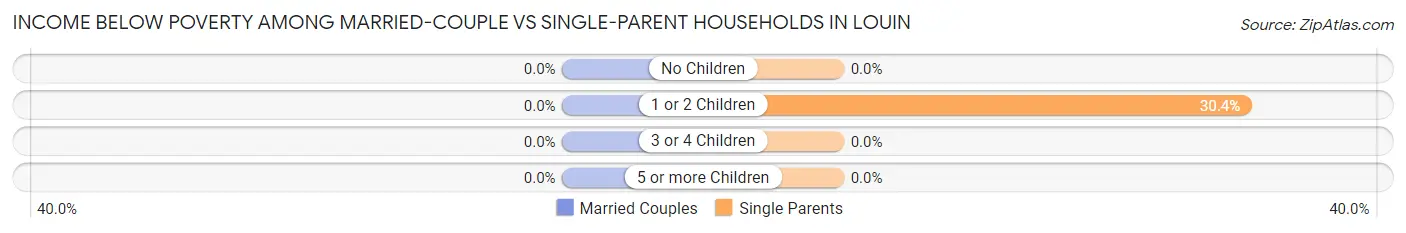
| Children | Married-Couple Families | Single-Parent Households |
| No Children | 0 (0.0%) | 0 (0.0%) |
| 1 or 2 Children | 0 (0.0%) | 7 (30.4%) |
| 3 or 4 Children | 0 (0.0%) | 0 (0.0%) |
| 5 or more Children | 0 (0.0%) | 0 (0.0%) |
| Total | 0 (0.0%) | 7 (24.1%) |
Race in Louin
The most populous races in Louin are White / Caucasian (325 | 68.0%), Black / African American (151 | 31.6%), and Two or more Races (2 | 0.4%).
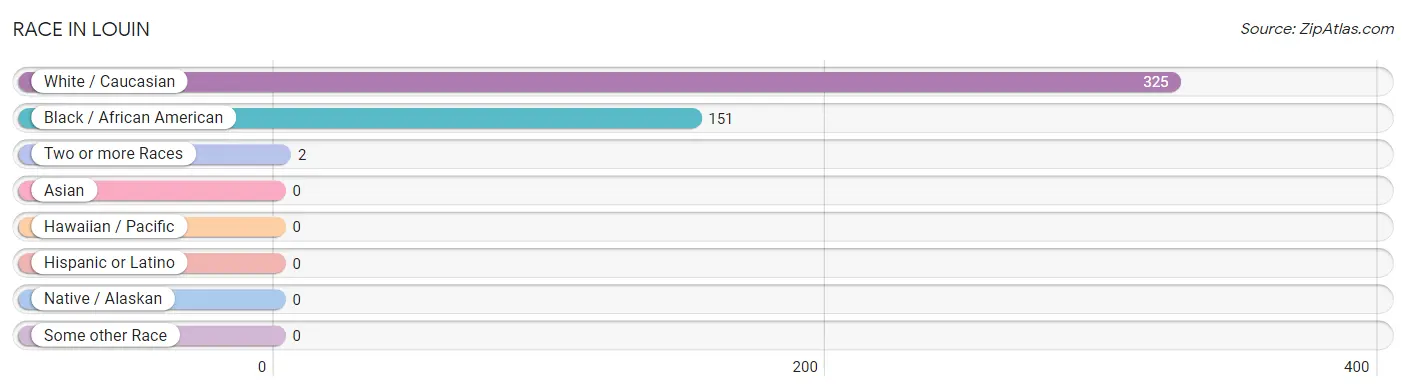
| Race | # Population | % Population |
| Asian | 0 | 0.0% |
| Black / African American | 151 | 31.6% |
| Hawaiian / Pacific | 0 | 0.0% |
| Hispanic or Latino | 0 | 0.0% |
| Native / Alaskan | 0 | 0.0% |
| White / Caucasian | 325 | 68.0% |
| Two or more Races | 2 | 0.4% |
| Some other Race | 0 | 0.0% |
| Total | 478 | 100.0% |
Ancestry in Louin
The most populous ancestries reported in Louin are American (371 | 77.6%), English (21 | 4.4%), Irish (16 | 3.4%), German (12 | 2.5%), and European (6 | 1.3%), together accounting for 89.1% of all Louin residents.
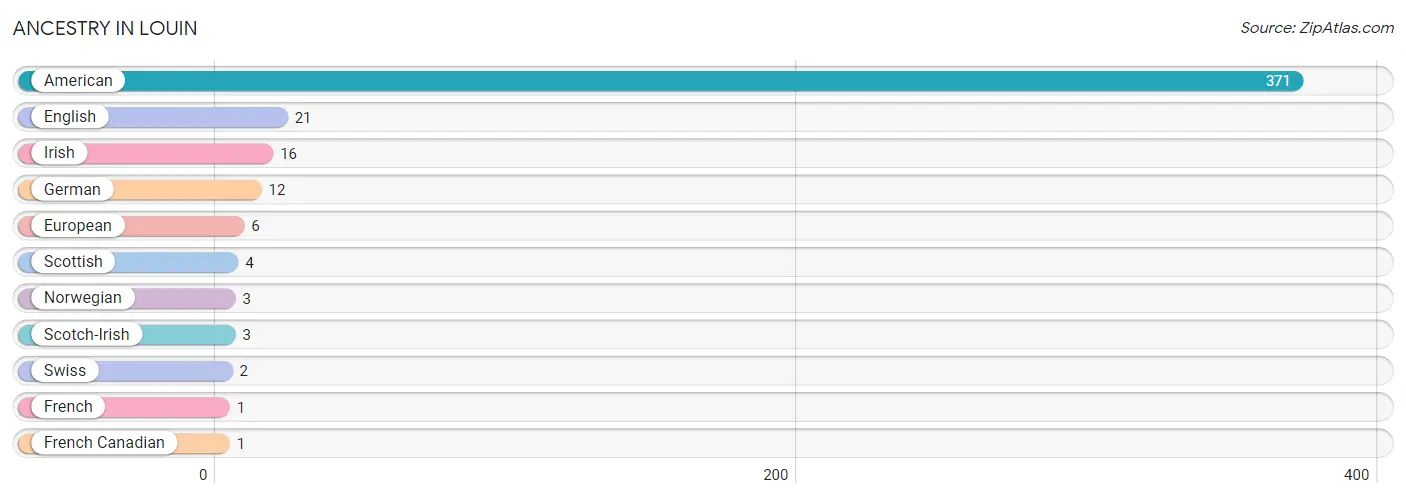
| Ancestry | # Population | % Population |
| American | 371 | 77.6% |
| English | 21 | 4.4% |
| European | 6 | 1.3% |
| French | 1 | 0.2% |
| French Canadian | 1 | 0.2% |
| German | 12 | 2.5% |
| Irish | 16 | 3.4% |
| Norwegian | 3 | 0.6% |
| Scotch-Irish | 3 | 0.6% |
| Scottish | 4 | 0.8% |
| Swiss | 2 | 0.4% | View All 11 Rows |
Immigrants in Louin

| Immigration Origin | # Population | % Population | View All 0 Rows |
Sex and Age in Louin
Sex and Age in Louin
The most populous age groups in Louin are 45 to 49 Years (81 | 31.8%) for men and 45 to 49 Years (89 | 39.9%) for women.
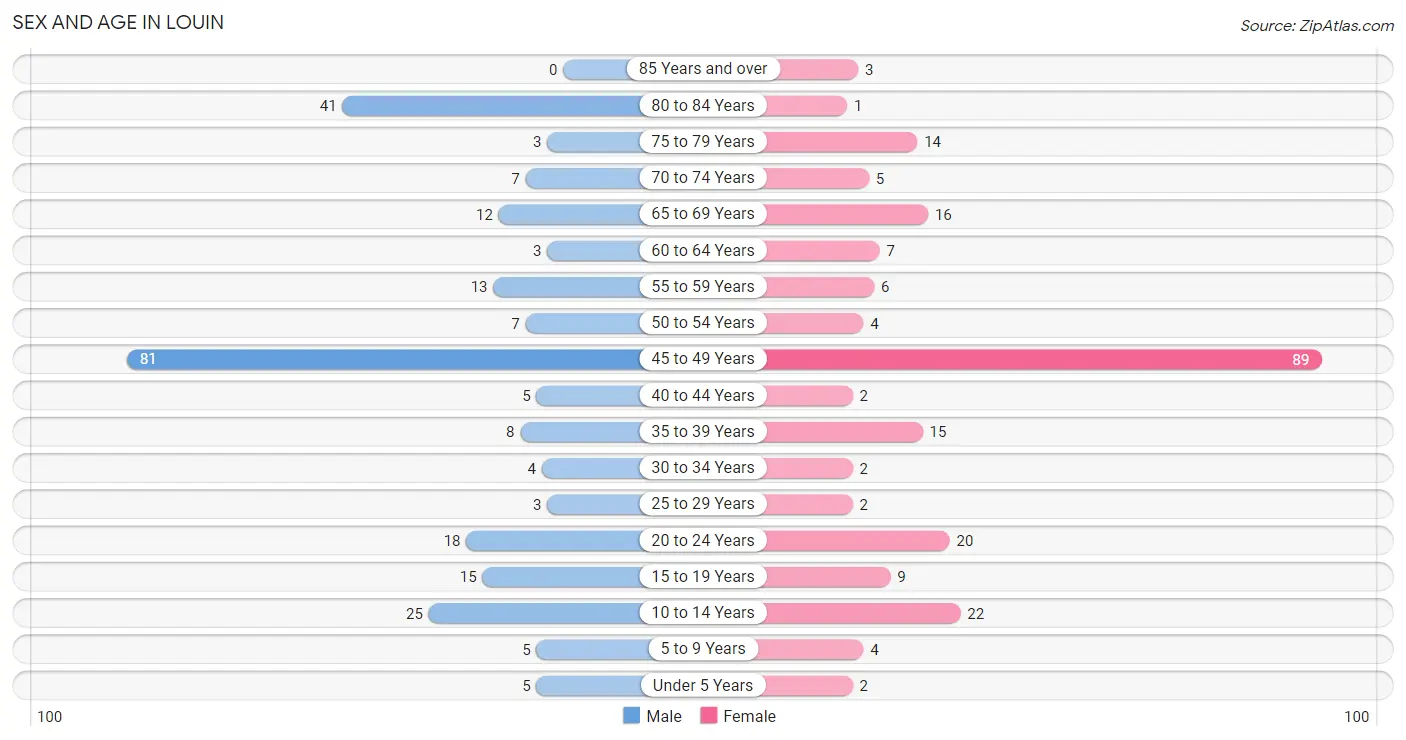
| Age Bracket | Male | Female |
| Under 5 Years | 5 (2.0%) | 2 (0.9%) |
| 5 to 9 Years | 5 (2.0%) | 4 (1.8%) |
| 10 to 14 Years | 25 (9.8%) | 22 (9.9%) |
| 15 to 19 Years | 15 (5.9%) | 9 (4.0%) |
| 20 to 24 Years | 18 (7.1%) | 20 (9.0%) |
| 25 to 29 Years | 3 (1.2%) | 2 (0.9%) |
| 30 to 34 Years | 4 (1.6%) | 2 (0.9%) |
| 35 to 39 Years | 8 (3.1%) | 15 (6.7%) |
| 40 to 44 Years | 5 (2.0%) | 2 (0.9%) |
| 45 to 49 Years | 81 (31.8%) | 89 (39.9%) |
| 50 to 54 Years | 7 (2.8%) | 4 (1.8%) |
| 55 to 59 Years | 13 (5.1%) | 6 (2.7%) |
| 60 to 64 Years | 3 (1.2%) | 7 (3.1%) |
| 65 to 69 Years | 12 (4.7%) | 16 (7.2%) |
| 70 to 74 Years | 7 (2.8%) | 5 (2.2%) |
| 75 to 79 Years | 3 (1.2%) | 14 (6.3%) |
| 80 to 84 Years | 41 (16.1%) | 1 (0.4%) |
| 85 Years and over | 0 (0.0%) | 3 (1.3%) |
| Total | 255 (100.0%) | 223 (100.0%) |
Families and Households in Louin
Median Family Size in Louin
The median family size in Louin is 2.60 persons per family, with single female/mother families (17 | 10.2%) accounting for the largest median family size of 4.35 persons per family. On the other hand, married-couple families (137 | 82.5%) represent the smallest median family size with 2.29 persons per family.
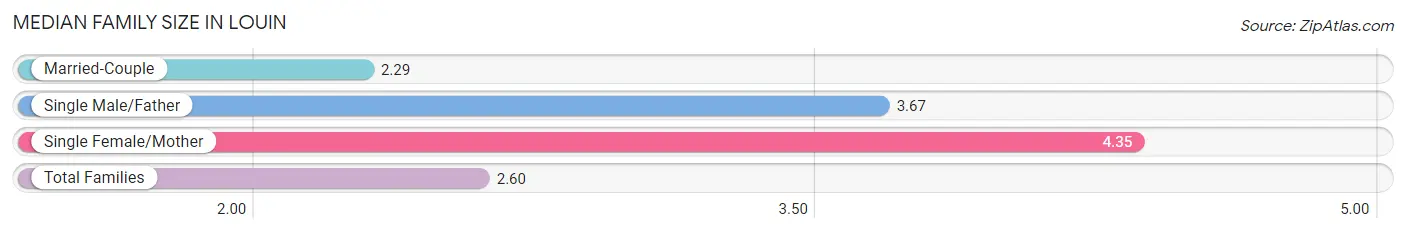
| Family Type | # Families | Family Size |
| Married-Couple | 137 (82.5%) | 2.29 |
| Single Male/Father | 12 (7.2%) | 3.67 |
| Single Female/Mother | 17 (10.2%) | 4.35 |
| Total Families | 166 (100.0%) | 2.60 |
Median Household Size in Louin
The median household size in Louin is 2.30 persons per household, with single female/mother households (17 | 8.2%) accounting for the largest median household size of 4.35 persons per household. non-family households (42 | 20.2%) represent the smallest median household size with 1.10 persons per household.
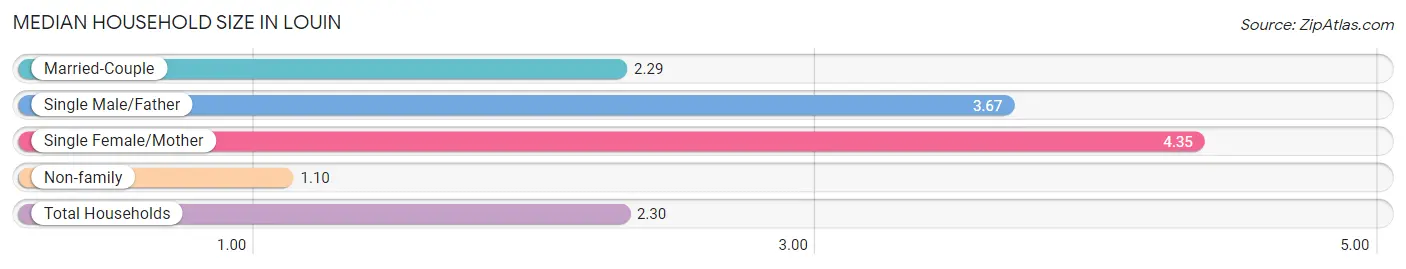
| Household Type | # Households | Household Size |
| Married-Couple | 137 (65.9%) | 2.29 |
| Single Male/Father | 12 (5.8%) | 3.67 |
| Single Female/Mother | 17 (8.2%) | 4.35 |
| Non-family | 42 (20.2%) | 1.10 |
| Total Households | 208 (100.0%) | 2.30 |
Household Size by Marriage Status in Louin
Out of a total of 208 households in Louin, 166 (79.8%) are family households, while 42 (20.2%) are nonfamily households. The most numerous type of family households are 2-person households, comprising 76, and the most common type of nonfamily households are 1-person households, comprising 40.
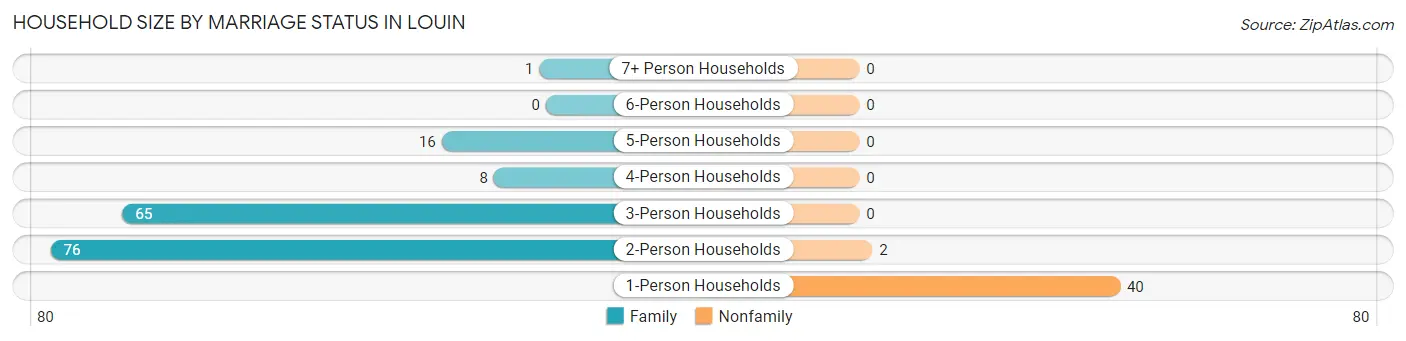
| Household Size | Family Households | Nonfamily Households |
| 1-Person Households | - | 40 (19.2%) |
| 2-Person Households | 76 (36.5%) | 2 (1.0%) |
| 3-Person Households | 65 (31.2%) | 0 (0.0%) |
| 4-Person Households | 8 (3.8%) | 0 (0.0%) |
| 5-Person Households | 16 (7.7%) | 0 (0.0%) |
| 6-Person Households | 0 (0.0%) | 0 (0.0%) |
| 7+ Person Households | 1 (0.5%) | 0 (0.0%) |
| Total | 166 (79.8%) | 42 (20.2%) |
Female Fertility in Louin
Fertility by Age in Louin
Average fertility rate in Louin is 21.0 births per 1,000 women. Women in the age bracket of 20 to 34 years have the highest fertility rate with 83.0 births per 1,000 women. Women in the age bracket of 20 to 34 years acount for 66.7% of all women with births.
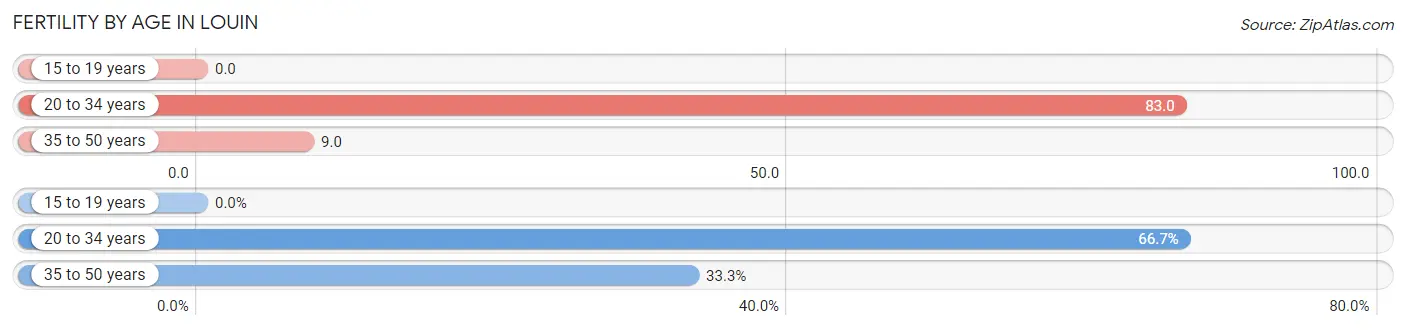
| Age Bracket | Women with Births | Births / 1,000 Women |
| 15 to 19 years | 0 (0.0%) | 0.0 |
| 20 to 34 years | 2 (66.7%) | 83.0 |
| 35 to 50 years | 1 (33.3%) | 9.0 |
| Total | 3 (100.0%) | 21.0 |
Fertility by Age by Marriage Status in Louin
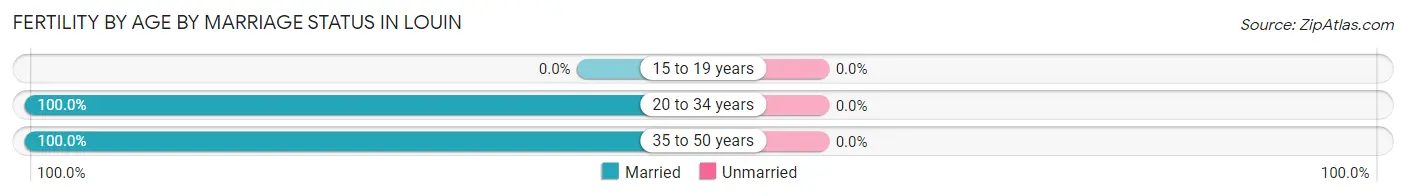
| Age Bracket | Married | Unmarried |
| 15 to 19 years | 0 (0.0%) | 0 (0.0%) |
| 20 to 34 years | 2 (100.0%) | 0 (0.0%) |
| 35 to 50 years | 1 (100.0%) | 0 (0.0%) |
| Total | 3 (100.0%) | 0 (0.0%) |
Fertility by Education in Louin
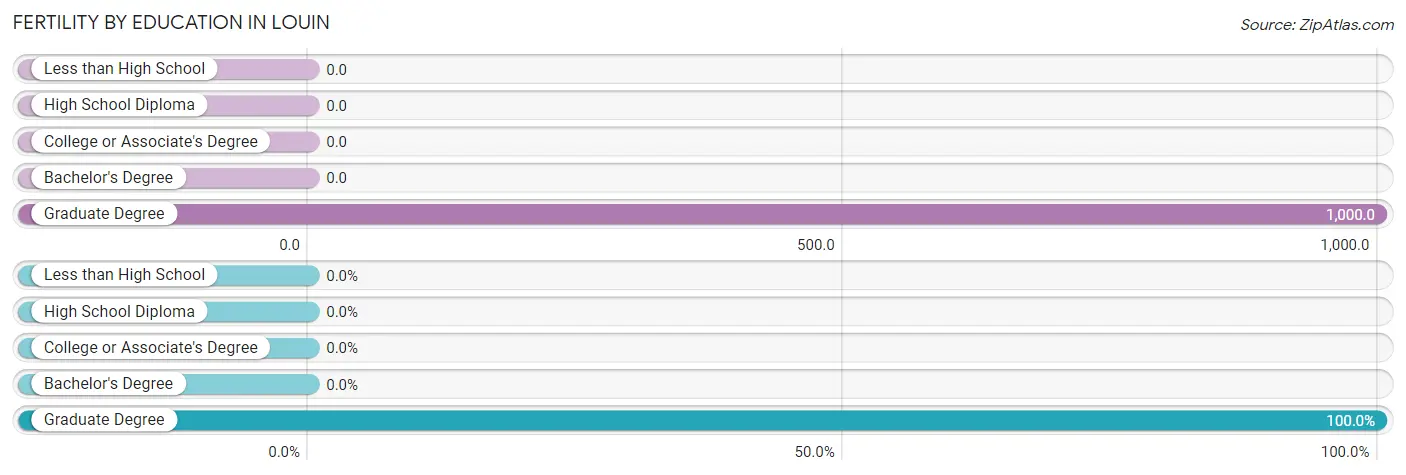
| Educational Attainment | Women with Births | Births / 1,000 Women |
| Less than High School | 0 (0.0%) | 0.0 |
| High School Diploma | 0 (0.0%) | 0.0 |
| College or Associate's Degree | 0 (0.0%) | 0.0 |
| Bachelor's Degree | 0 (0.0%) | 0.0 |
| Graduate Degree | 3 (100.0%) | 1,000.0 |
| Total | 3 (100.0%) | 21.0 |
Fertility by Education by Marriage Status in Louin
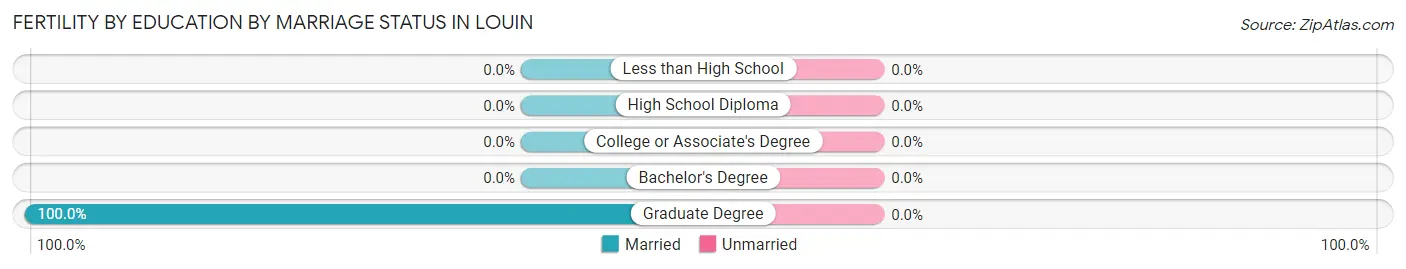
| Educational Attainment | Married | Unmarried |
| Less than High School | 0 (0.0%) | 0 (0.0%) |
| High School Diploma | 0 (0.0%) | 0 (0.0%) |
| College or Associate's Degree | 0 (0.0%) | 0 (0.0%) |
| Bachelor's Degree | 0 (0.0%) | 0 (0.0%) |
| Graduate Degree | 3 (100.0%) | 0 (0.0%) |
| Total | 3 (100.0%) | 0 (0.0%) |
Employment Characteristics in Louin
Employment by Class of Employer in Louin
Among the 225 employed individuals in Louin, private company employees (112 | 49.8%), state government employees (50 | 22.2%), and self-employed (not incorporated) (35 | 15.6%) make up the most common classes of employment.
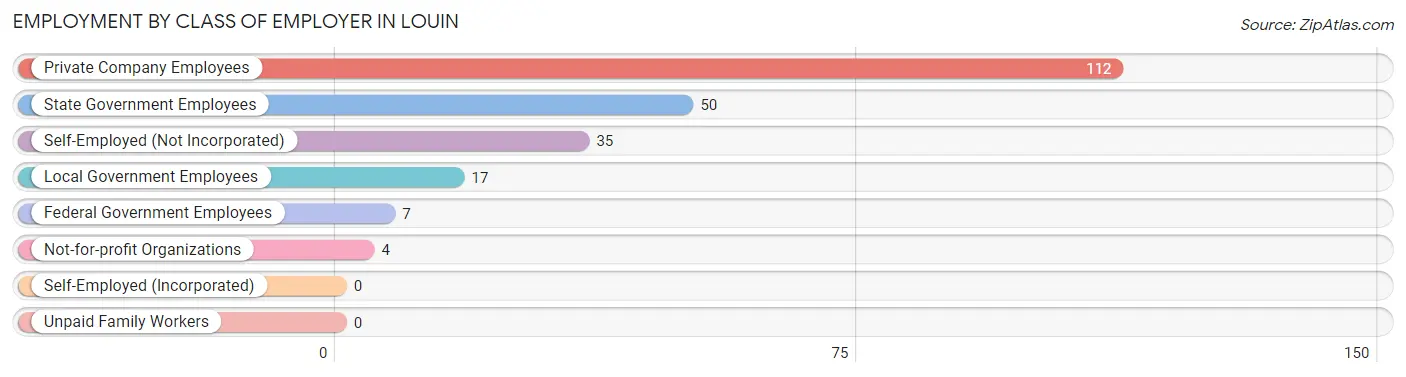
| Employer Class | # Employees | % Employees |
| Private Company Employees | 112 | 49.8% |
| Self-Employed (Incorporated) | 0 | 0.0% |
| Self-Employed (Not Incorporated) | 35 | 15.6% |
| Not-for-profit Organizations | 4 | 1.8% |
| Local Government Employees | 17 | 7.6% |
| State Government Employees | 50 | 22.2% |
| Federal Government Employees | 7 | 3.1% |
| Unpaid Family Workers | 0 | 0.0% |
| Total | 225 | 100.0% |
Employment Status by Age in Louin
According to the labor force statistics for Louin, out of the total population over 16 years of age (407), 57.7% or 235 individuals are in the labor force, with 4.3% or 10 of them unemployed. The age group with the highest labor force participation rate is 20 to 24 years, with 100.0% or 38 individuals in the labor force. Within the labor force, the 30 to 34 years age range has the highest percentage of unemployed individuals, with 16.7% or 1 of them being unemployed.
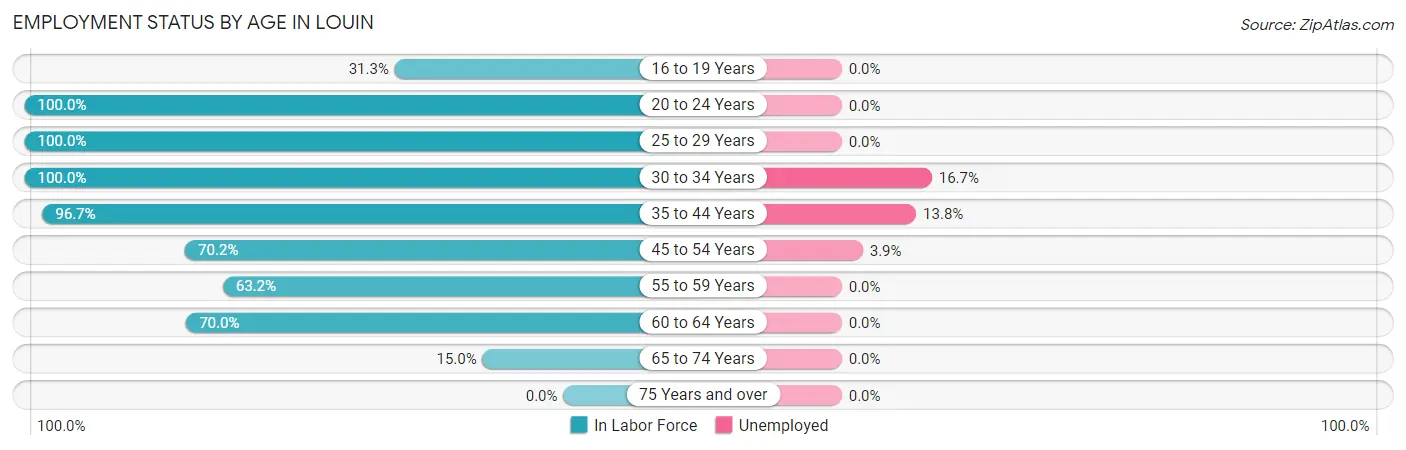
| Age Bracket | In Labor Force | Unemployed |
| 16 to 19 Years | 5 (31.3%) | 0 (0.0%) |
| 20 to 24 Years | 38 (100.0%) | 0 (0.0%) |
| 25 to 29 Years | 5 (100.0%) | 0 (0.0%) |
| 30 to 34 Years | 6 (100.0%) | 1 (16.7%) |
| 35 to 44 Years | 29 (96.7%) | 4 (13.8%) |
| 45 to 54 Years | 127 (70.2%) | 5 (3.9%) |
| 55 to 59 Years | 12 (63.2%) | 0 (0.0%) |
| 60 to 64 Years | 7 (70.0%) | 0 (0.0%) |
| 65 to 74 Years | 6 (15.0%) | 0 (0.0%) |
| 75 Years and over | 0 (0.0%) | 0 (0.0%) |
| Total | 235 (57.7%) | 10 (4.3%) |
Employment Status by Educational Attainment in Louin
According to labor force statistics for Louin, 74.1% of individuals (186) out of the total population between 25 and 64 years of age (251) are in the labor force, with 5.4% or 10 of them being unemployed. The group with the highest labor force participation rate are those with the educational attainment of less than high school, with 100.0% or 20 individuals in the labor force. Within the labor force, individuals with high school diploma education have the highest percentage of unemployment, with 40.0% or 8 of them being unemployed.
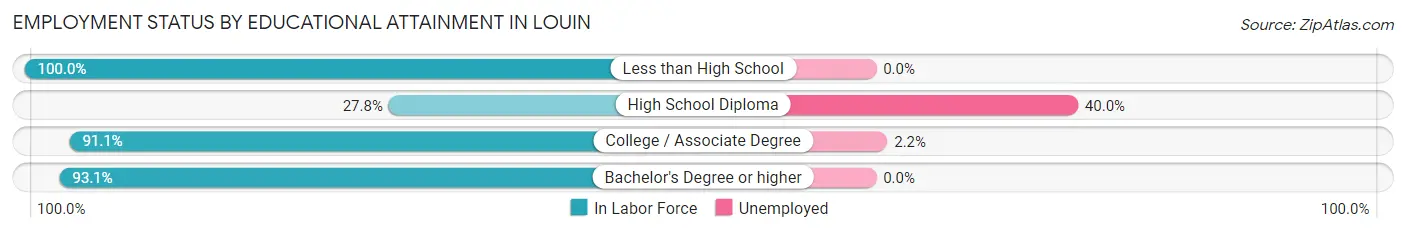
| Educational Attainment | In Labor Force | Unemployed |
| Less than High School | 20 (100.0%) | 0 (0.0%) |
| High School Diploma | 20 (27.8%) | 29 (40.0%) |
| College / Associate Degree | 92 (91.1%) | 2 (2.2%) |
| Bachelor's Degree or higher | 54 (93.1%) | 0 (0.0%) |
| Total | 186 (74.1%) | 14 (5.4%) |
Employment Occupations by Sex in Louin
Management, Business, Science and Arts Occupations
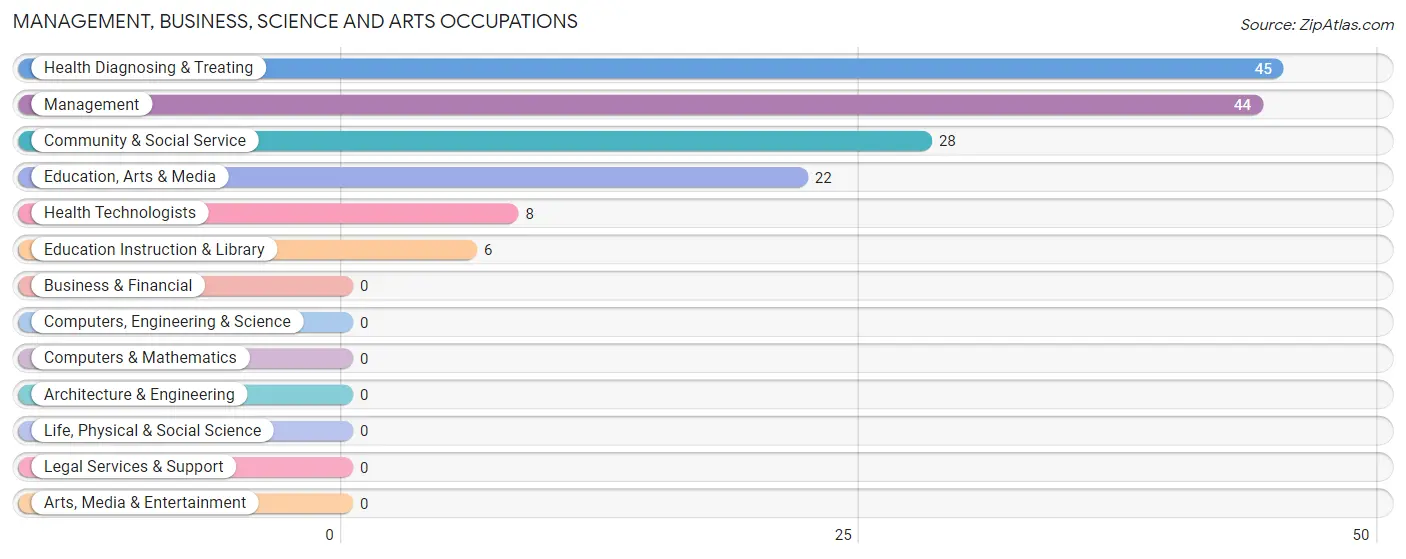
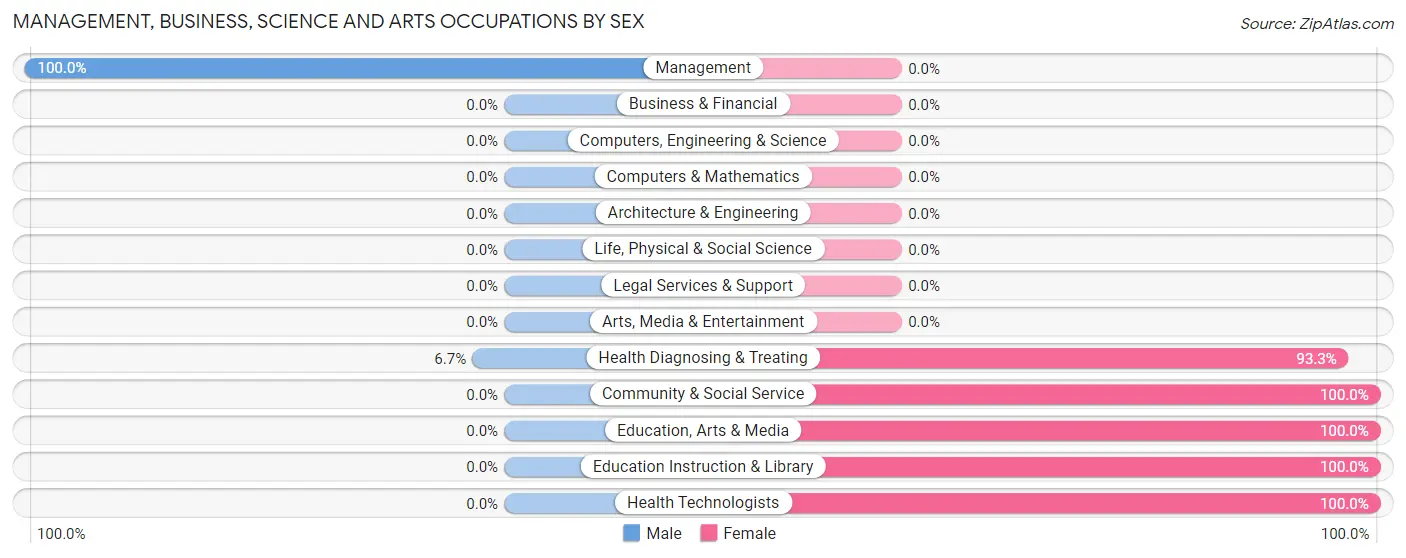
The most common Management, Business, Science and Arts occupations in Louin are Health Diagnosing & Treating (45 | 20.0%), Management (44 | 19.6%), Community & Social Service (28 | 12.4%), Education, Arts & Media (22 | 9.8%), and Health Technologists (8 | 3.6%).
Management, Business, Science and Arts Occupations by Sex
Within the Management, Business, Science and Arts occupations in Louin, the most male-oriented occupations are Management (100.0%), and Health Diagnosing & Treating (6.7%), while the most female-oriented occupations are Community & Social Service (100.0%), Education, Arts & Media (100.0%), and Education Instruction & Library (100.0%).
| Occupation | Male | Female |
| Management | 44 (100.0%) | 0 (0.0%) |
| Business & Financial | 0 (0.0%) | 0 (0.0%) |
| Computers, Engineering & Science | 0 (0.0%) | 0 (0.0%) |
| Computers & Mathematics | 0 (0.0%) | 0 (0.0%) |
| Architecture & Engineering | 0 (0.0%) | 0 (0.0%) |
| Life, Physical & Social Science | 0 (0.0%) | 0 (0.0%) |
| Community & Social Service | 0 (0.0%) | 28 (100.0%) |
| Education, Arts & Media | 0 (0.0%) | 22 (100.0%) |
| Legal Services & Support | 0 (0.0%) | 0 (0.0%) |
| Education Instruction & Library | 0 (0.0%) | 6 (100.0%) |
| Arts, Media & Entertainment | 0 (0.0%) | 0 (0.0%) |
| Health Diagnosing & Treating | 3 (6.7%) | 42 (93.3%) |
| Health Technologists | 0 (0.0%) | 8 (100.0%) |
| Total (Category) | 47 (40.2%) | 70 (59.8%) |
| Total (Overall) | 112 (49.8%) | 113 (50.2%) |
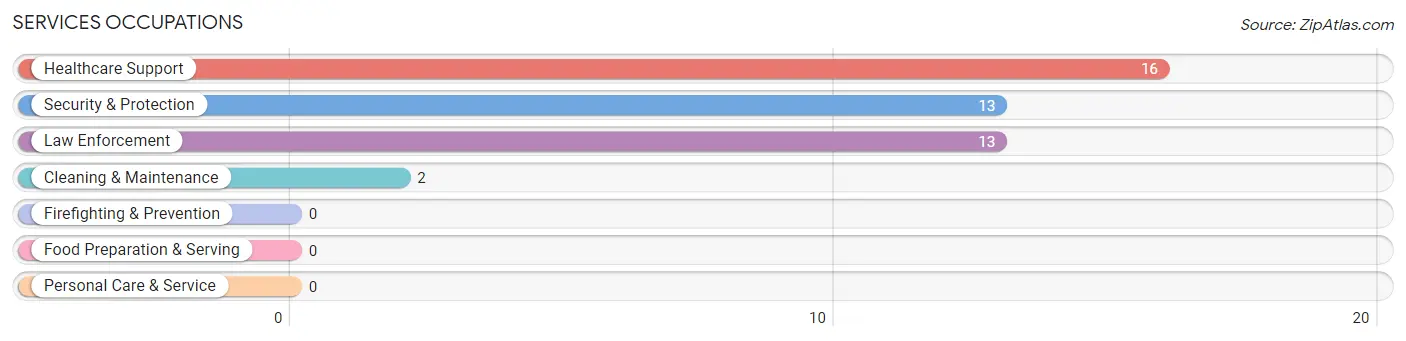
Services Occupations
The most common Services occupations in Louin are Healthcare Support (16 | 7.1%), Security & Protection (13 | 5.8%), Law Enforcement (13 | 5.8%), and Cleaning & Maintenance (2 | 0.9%).
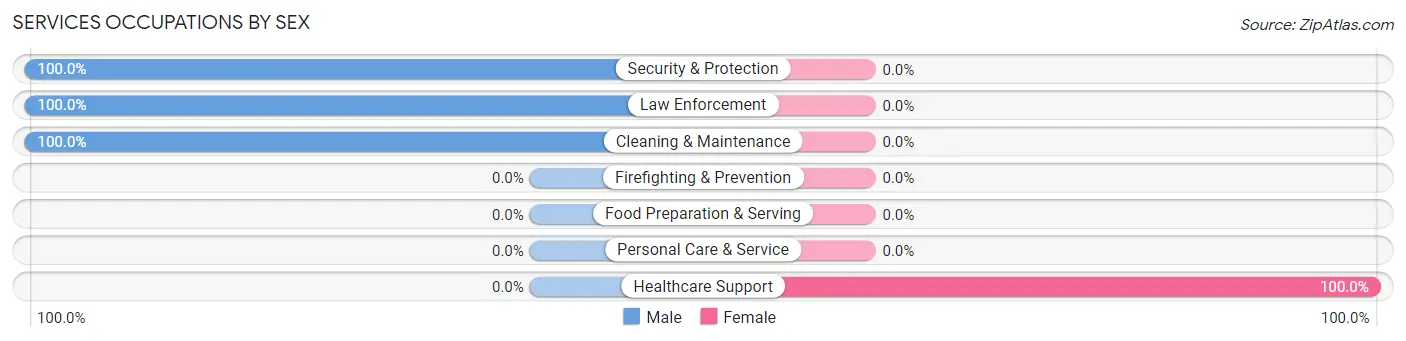
Services Occupations by Sex
| Occupation | Male | Female |
| Healthcare Support | 0 (0.0%) | 16 (100.0%) |
| Security & Protection | 13 (100.0%) | 0 (0.0%) |
| Firefighting & Prevention | 0 (0.0%) | 0 (0.0%) |
| Law Enforcement | 13 (100.0%) | 0 (0.0%) |
| Food Preparation & Serving | 0 (0.0%) | 0 (0.0%) |
| Cleaning & Maintenance | 2 (100.0%) | 0 (0.0%) |
| Personal Care & Service | 0 (0.0%) | 0 (0.0%) |
| Total (Category) | 15 (48.4%) | 16 (51.6%) |
| Total (Overall) | 112 (49.8%) | 113 (50.2%) |
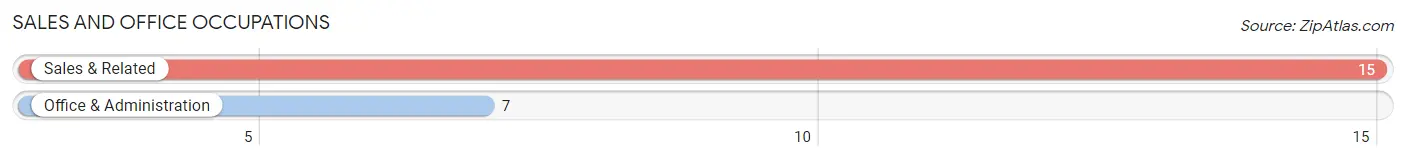
Sales and Office Occupations
The most common Sales and Office occupations in Louin are Sales & Related (15 | 6.7%), and Office & Administration (7 | 3.1%).
Sales and Office Occupations by Sex
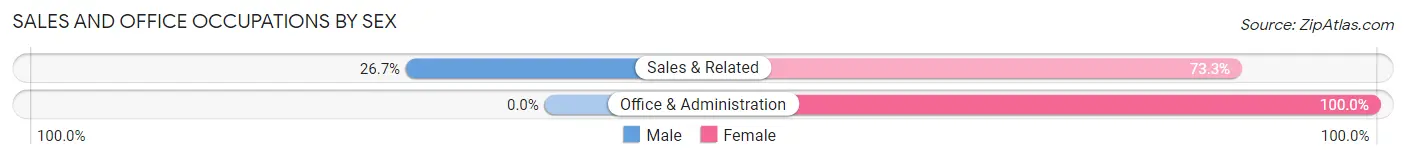
| Occupation | Male | Female |
| Sales & Related | 4 (26.7%) | 11 (73.3%) |
| Office & Administration | 0 (0.0%) | 7 (100.0%) |
| Total (Category) | 4 (18.2%) | 18 (81.8%) |
| Total (Overall) | 112 (49.8%) | 113 (50.2%) |
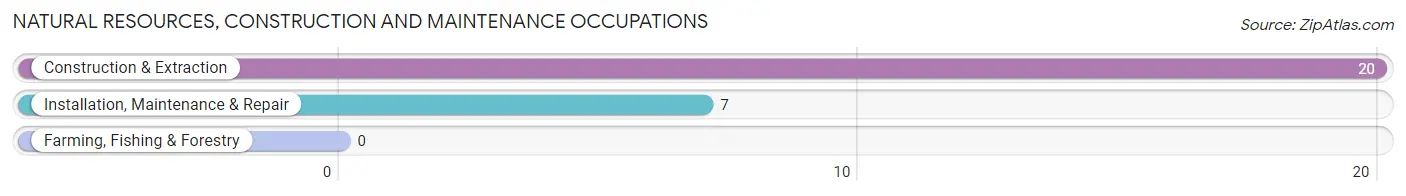
Natural Resources, Construction and Maintenance Occupations
The most common Natural Resources, Construction and Maintenance occupations in Louin are Construction & Extraction (20 | 8.9%), and Installation, Maintenance & Repair (7 | 3.1%).
Natural Resources, Construction and Maintenance Occupations by Sex
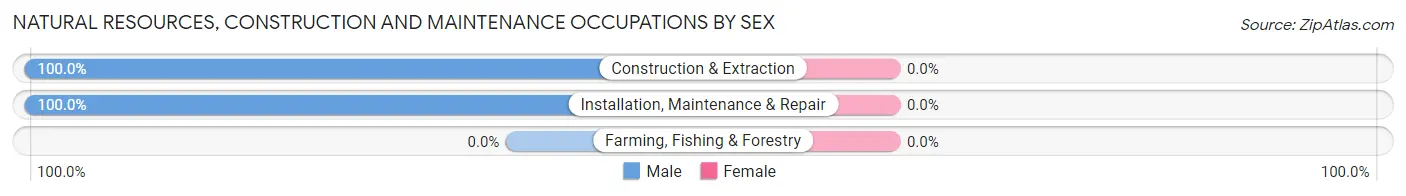
| Occupation | Male | Female |
| Farming, Fishing & Forestry | 0 (0.0%) | 0 (0.0%) |
| Construction & Extraction | 20 (100.0%) | 0 (0.0%) |
| Installation, Maintenance & Repair | 7 (100.0%) | 0 (0.0%) |
| Total (Category) | 27 (100.0%) | 0 (0.0%) |
| Total (Overall) | 112 (49.8%) | 113 (50.2%) |
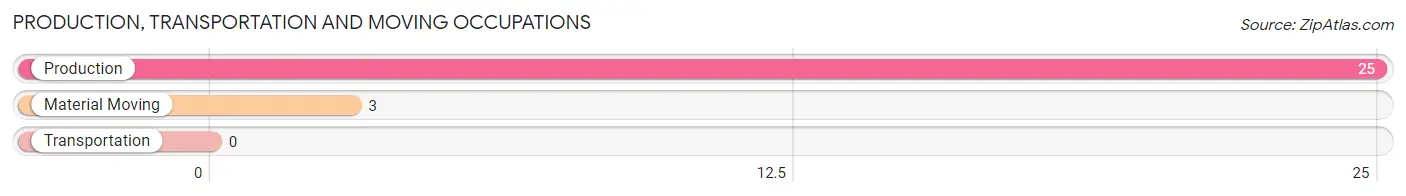
Production, Transportation and Moving Occupations
The most common Production, Transportation and Moving occupations in Louin are Production (25 | 11.1%), and Material Moving (3 | 1.3%).
Production, Transportation and Moving Occupations by Sex
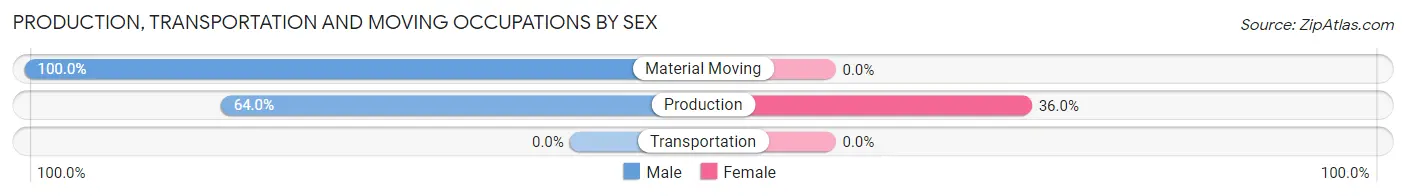
| Occupation | Male | Female |
| Production | 16 (64.0%) | 9 (36.0%) |
| Transportation | 0 (0.0%) | 0 (0.0%) |
| Material Moving | 3 (100.0%) | 0 (0.0%) |
| Total (Category) | 19 (67.9%) | 9 (32.1%) |
| Total (Overall) | 112 (49.8%) | 113 (50.2%) |
Employment Industries by Sex in Louin
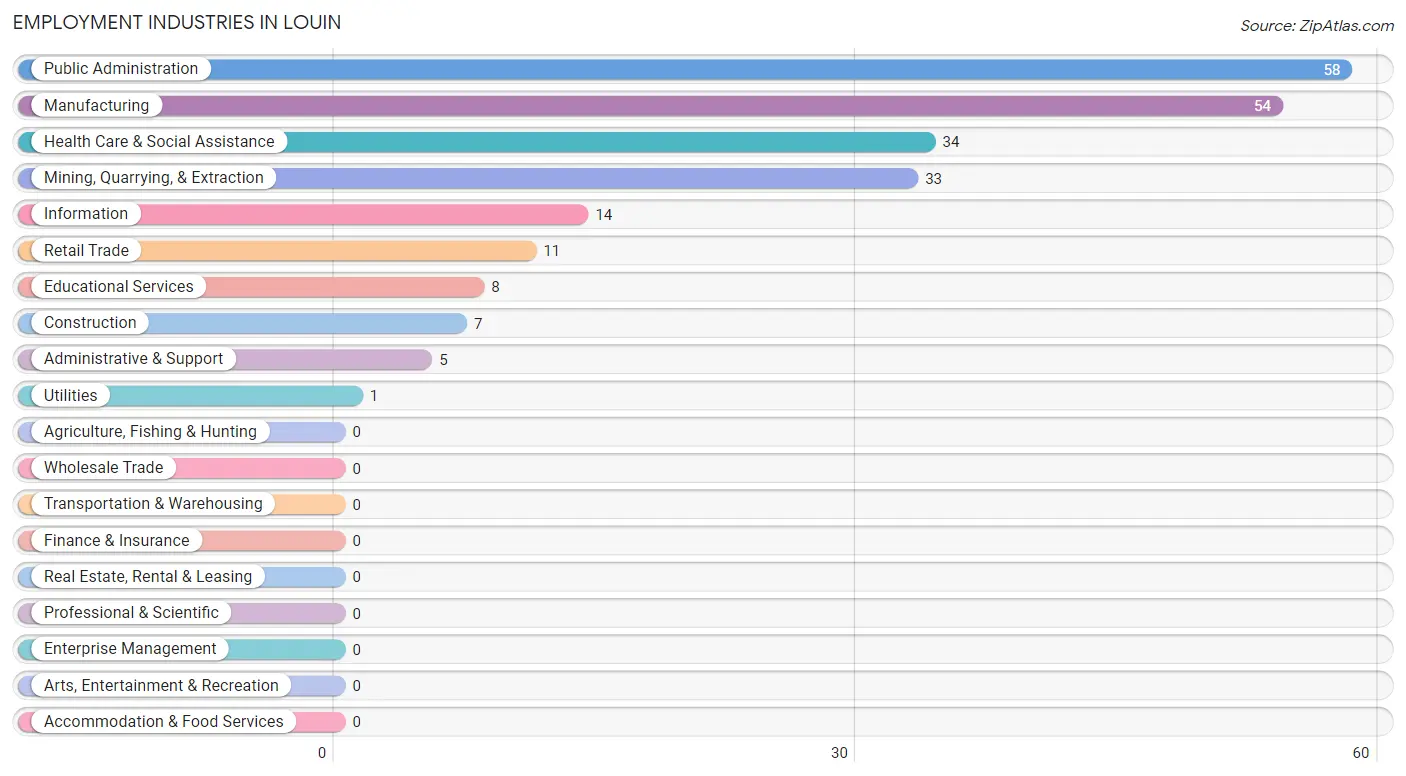
Employment Industries in Louin
The major employment industries in Louin include Public Administration (58 | 25.8%), Manufacturing (54 | 24.0%), Health Care & Social Assistance (34 | 15.1%), Mining, Quarrying, & Extraction (33 | 14.7%), and Information (14 | 6.2%).
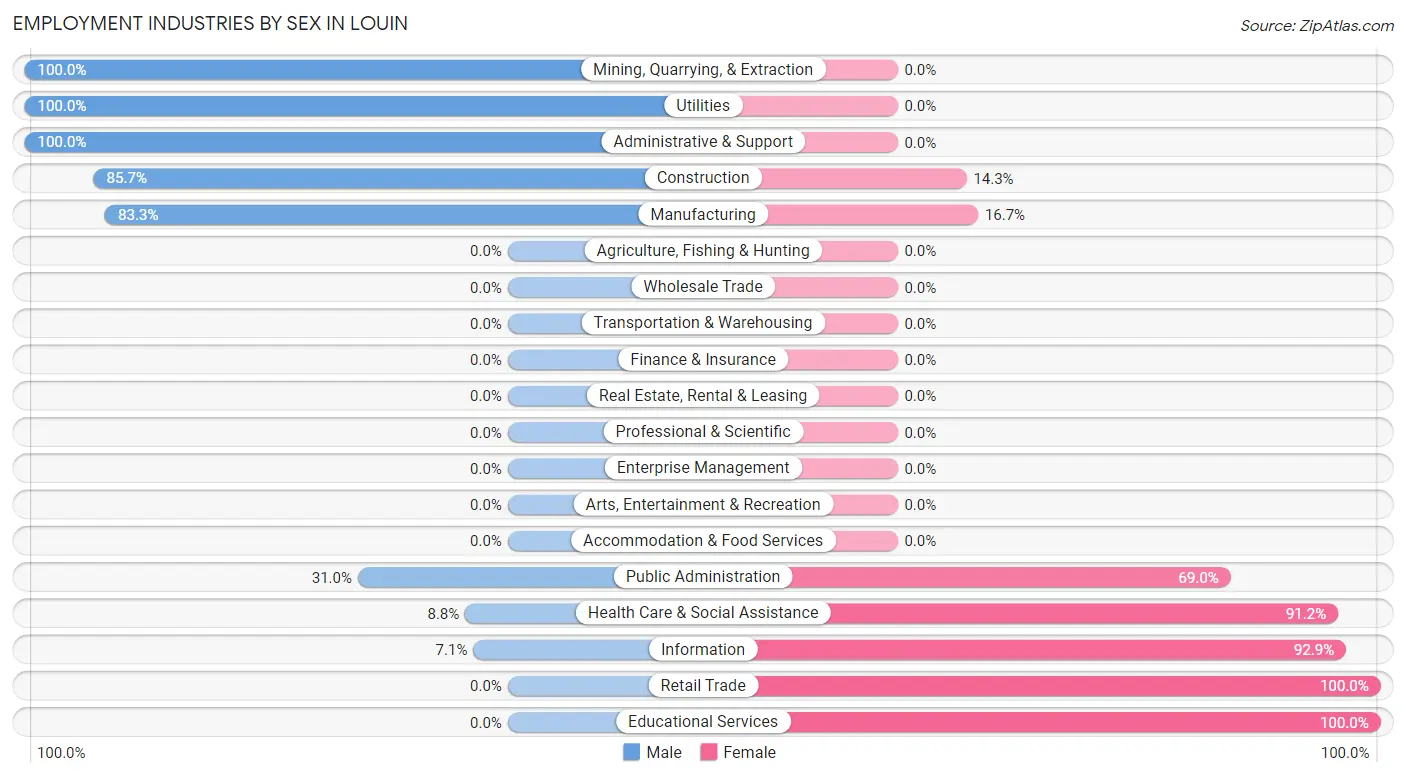
Employment Industries by Sex in Louin
The Louin industries that see more men than women are Mining, Quarrying, & Extraction (100.0%), Utilities (100.0%), and Administrative & Support (100.0%), whereas the industries that tend to have a higher number of women are Retail Trade (100.0%), Educational Services (100.0%), and Information (92.9%).
| Industry | Male | Female |
| Agriculture, Fishing & Hunting | 0 (0.0%) | 0 (0.0%) |
| Mining, Quarrying, & Extraction | 33 (100.0%) | 0 (0.0%) |
| Construction | 6 (85.7%) | 1 (14.3%) |
| Manufacturing | 45 (83.3%) | 9 (16.7%) |
| Wholesale Trade | 0 (0.0%) | 0 (0.0%) |
| Retail Trade | 0 (0.0%) | 11 (100.0%) |
| Transportation & Warehousing | 0 (0.0%) | 0 (0.0%) |
| Utilities | 1 (100.0%) | 0 (0.0%) |
| Information | 1 (7.1%) | 13 (92.9%) |
| Finance & Insurance | 0 (0.0%) | 0 (0.0%) |
| Real Estate, Rental & Leasing | 0 (0.0%) | 0 (0.0%) |
| Professional & Scientific | 0 (0.0%) | 0 (0.0%) |
| Enterprise Management | 0 (0.0%) | 0 (0.0%) |
| Administrative & Support | 5 (100.0%) | 0 (0.0%) |
| Educational Services | 0 (0.0%) | 8 (100.0%) |
| Health Care & Social Assistance | 3 (8.8%) | 31 (91.2%) |
| Arts, Entertainment & Recreation | 0 (0.0%) | 0 (0.0%) |
| Accommodation & Food Services | 0 (0.0%) | 0 (0.0%) |
| Public Administration | 18 (31.0%) | 40 (69.0%) |
| Total | 112 (49.8%) | 113 (50.2%) |
Education in Louin
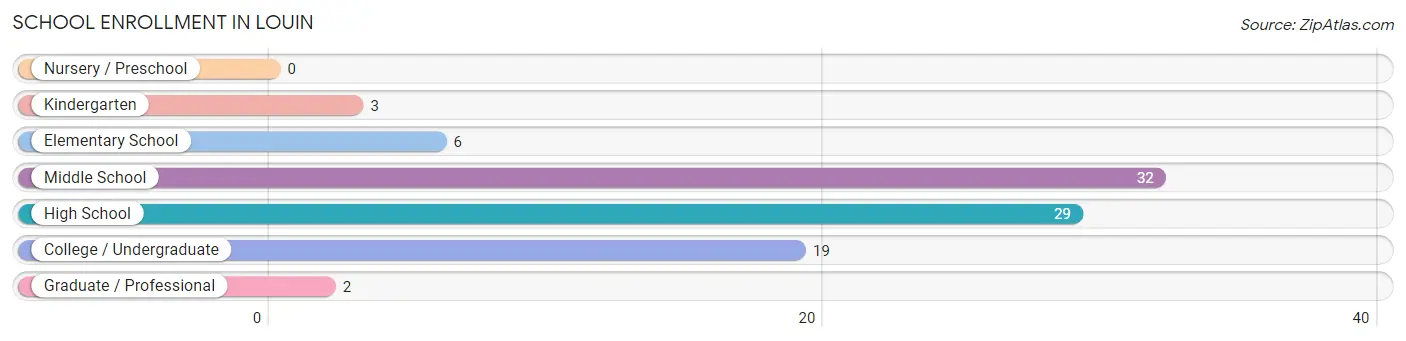
School Enrollment in Louin
The most common levels of schooling among the 91 students in Louin are middle school (32 | 35.2%), high school (29 | 31.9%), and college / undergraduate (19 | 20.9%).
| School Level | # Students | % Students |
| Nursery / Preschool | 0 | 0.0% |
| Kindergarten | 3 | 3.3% |
| Elementary School | 6 | 6.6% |
| Middle School | 32 | 35.2% |
| High School | 29 | 31.9% |
| College / Undergraduate | 19 | 20.9% |
| Graduate / Professional | 2 | 2.2% |
| Total | 91 | 100.0% |
School Enrollment by Age by Funding Source in Louin
Out of a total of 91 students who are enrolled in schools in Louin, 22 (24.2%) attend a private institution, while the remaining 69 (75.8%) are enrolled in public schools. The age group of 25 to 34 year olds has the highest likelihood of being enrolled in private schools, with 2 (100.0% in the age bracket) enrolled. Conversely, the age group of 20 to 24 year olds has the lowest likelihood of being enrolled in a private school, with 18 (100.0% in the age bracket) attending a public institution.
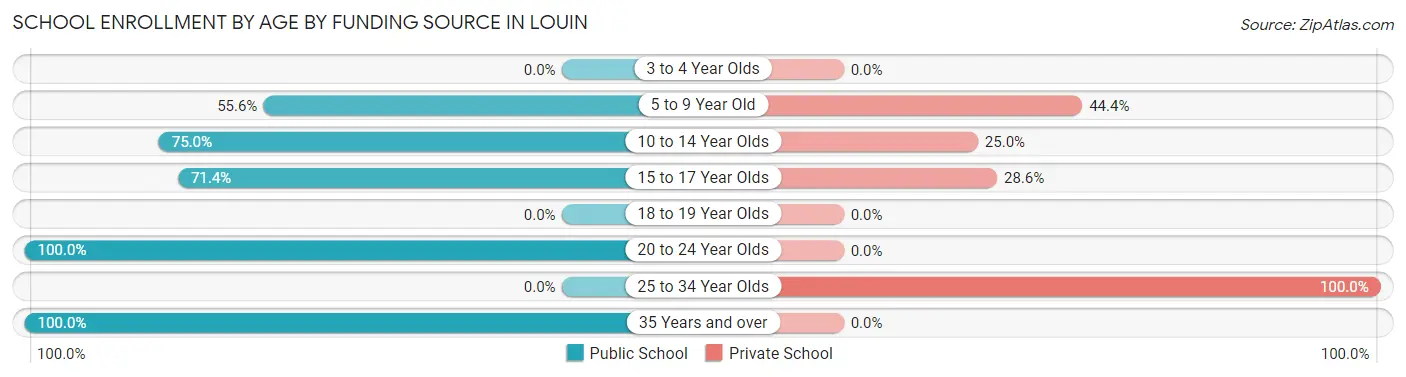
| Age Bracket | Public School | Private School |
| 3 to 4 Year Olds | 0 (0.0%) | 0 (0.0%) |
| 5 to 9 Year Old | 5 (55.6%) | 4 (44.4%) |
| 10 to 14 Year Olds | 30 (75.0%) | 10 (25.0%) |
| 15 to 17 Year Olds | 15 (71.4%) | 6 (28.6%) |
| 18 to 19 Year Olds | 0 (0.0%) | 0 (0.0%) |
| 20 to 24 Year Olds | 18 (100.0%) | 0 (0.0%) |
| 25 to 34 Year Olds | 0 (0.0%) | 2 (100.0%) |
| 35 Years and over | 1 (100.0%) | 0 (0.0%) |
| Total | 69 (75.8%) | 22 (24.2%) |
Educational Attainment by Field of Study in Louin
Science & technology (40 | 52.6%), education (16 | 21.0%), bio, nature & agricultural (9 | 11.8%), arts & humanities (5 | 6.6%), and engineering (2 | 2.6%) are the most common fields of study among 76 individuals in Louin who have obtained a bachelor's degree or higher.
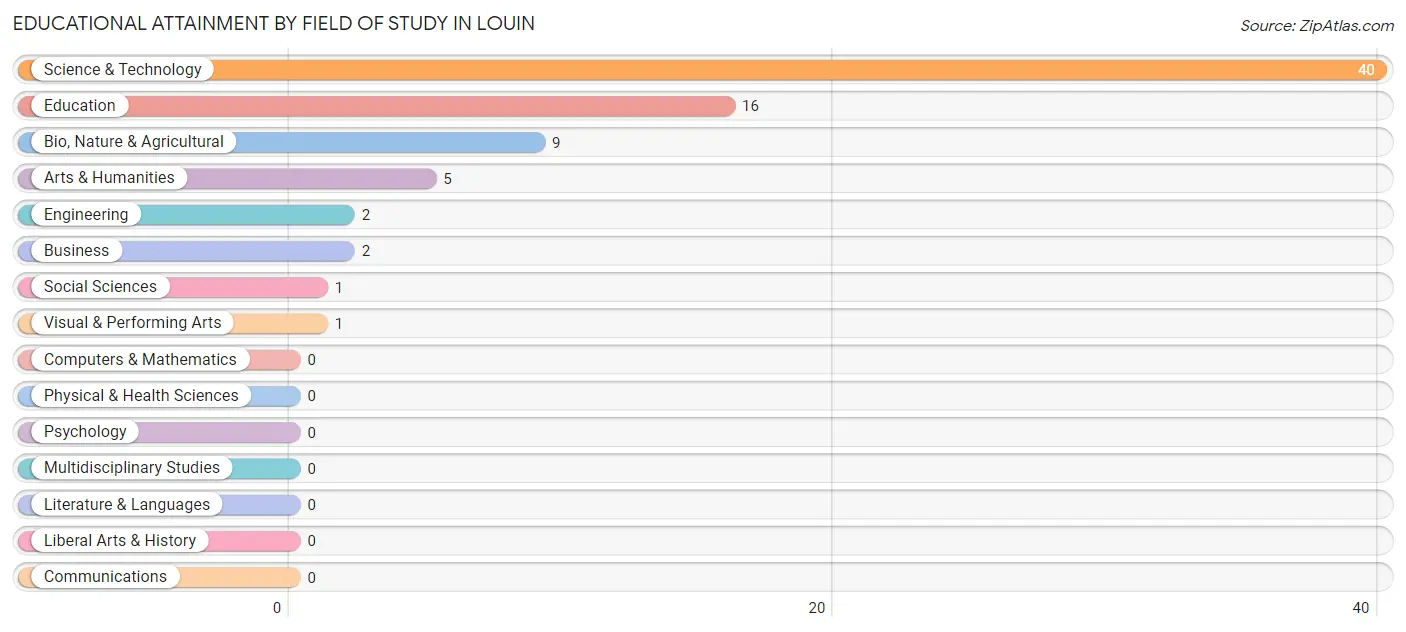
| Field of Study | # Graduates | % Graduates |
| Computers & Mathematics | 0 | 0.0% |
| Bio, Nature & Agricultural | 9 | 11.8% |
| Physical & Health Sciences | 0 | 0.0% |
| Psychology | 0 | 0.0% |
| Social Sciences | 1 | 1.3% |
| Engineering | 2 | 2.6% |
| Multidisciplinary Studies | 0 | 0.0% |
| Science & Technology | 40 | 52.6% |
| Business | 2 | 2.6% |
| Education | 16 | 21.0% |
| Literature & Languages | 0 | 0.0% |
| Liberal Arts & History | 0 | 0.0% |
| Visual & Performing Arts | 1 | 1.3% |
| Communications | 0 | 0.0% |
| Arts & Humanities | 5 | 6.6% |
| Total | 76 | 100.0% |
Transportation & Commute in Louin
Vehicle Availability by Sex in Louin
The most prevalent vehicle ownership categories in Louin are males with 3 vehicles (89, accounting for 79.5%) and females with 3 vehicles (65, making up 78.8%).
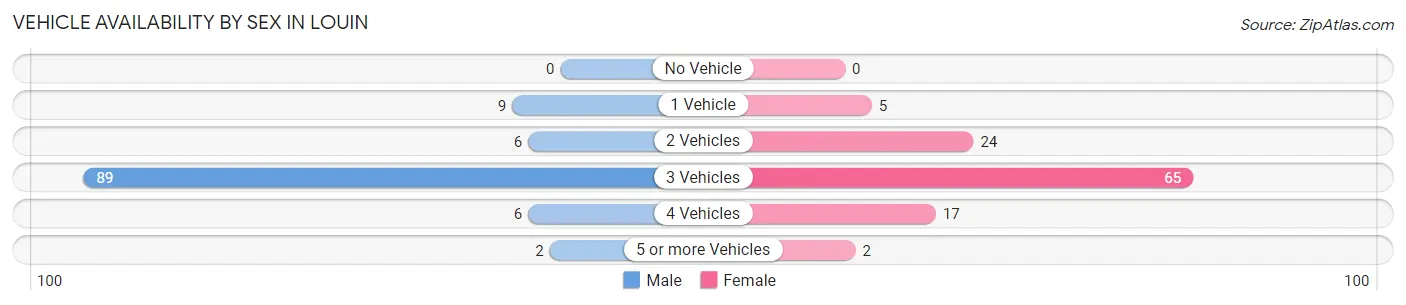
| Vehicles Available | Male | Female |
| No Vehicle | 0 (0.0%) | 0 (0.0%) |
| 1 Vehicle | 9 (8.0%) | 5 (4.4%) |
| 2 Vehicles | 6 (5.4%) | 24 (21.2%) |
| 3 Vehicles | 89 (79.5%) | 65 (57.5%) |
| 4 Vehicles | 6 (5.4%) | 17 (15.0%) |
| 5 or more Vehicles | 2 (1.8%) | 2 (1.8%) |
| Total | 112 (100.0%) | 113 (100.0%) |
Commute Time in Louin
The most frequently occuring commute durations in Louin are 20 to 24 minutes (46 commuters, 20.5%), 60 to 89 minutes (44 commuters, 19.6%), and 10 to 14 minutes (43 commuters, 19.2%).
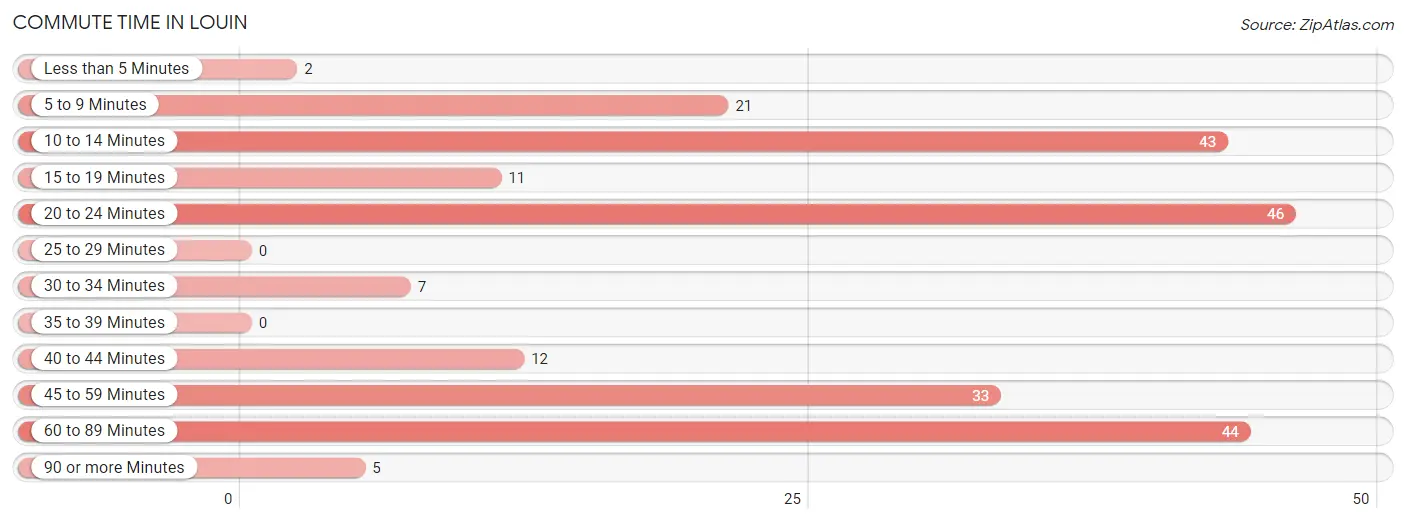
| Commute Time | # Commuters | % Commuters |
| Less than 5 Minutes | 2 | 0.9% |
| 5 to 9 Minutes | 21 | 9.4% |
| 10 to 14 Minutes | 43 | 19.2% |
| 15 to 19 Minutes | 11 | 4.9% |
| 20 to 24 Minutes | 46 | 20.5% |
| 25 to 29 Minutes | 0 | 0.0% |
| 30 to 34 Minutes | 7 | 3.1% |
| 35 to 39 Minutes | 0 | 0.0% |
| 40 to 44 Minutes | 12 | 5.4% |
| 45 to 59 Minutes | 33 | 14.7% |
| 60 to 89 Minutes | 44 | 19.6% |
| 90 or more Minutes | 5 | 2.2% |
Commute Time by Sex in Louin
The most common commute times in Louin are 20 to 24 minutes (42 commuters, 37.5%) for males and 60 to 89 minutes (38 commuters, 33.9%) for females.
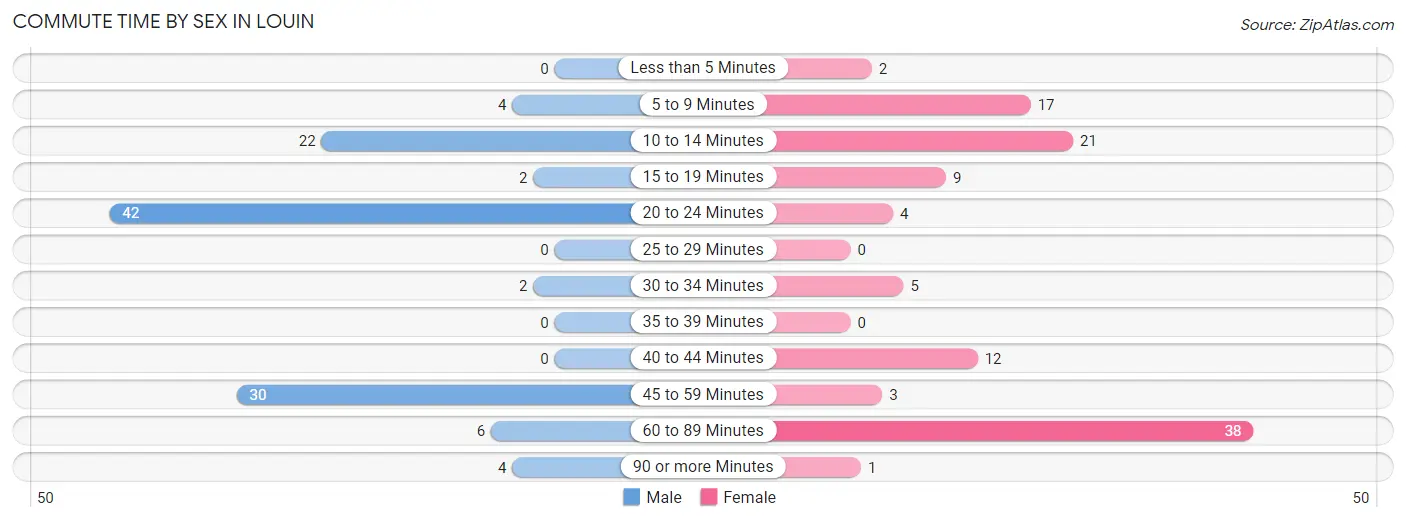
| Commute Time | Male | Female |
| Less than 5 Minutes | 0 (0.0%) | 2 (1.8%) |
| 5 to 9 Minutes | 4 (3.6%) | 17 (15.2%) |
| 10 to 14 Minutes | 22 (19.6%) | 21 (18.8%) |
| 15 to 19 Minutes | 2 (1.8%) | 9 (8.0%) |
| 20 to 24 Minutes | 42 (37.5%) | 4 (3.6%) |
| 25 to 29 Minutes | 0 (0.0%) | 0 (0.0%) |
| 30 to 34 Minutes | 2 (1.8%) | 5 (4.5%) |
| 35 to 39 Minutes | 0 (0.0%) | 0 (0.0%) |
| 40 to 44 Minutes | 0 (0.0%) | 12 (10.7%) |
| 45 to 59 Minutes | 30 (26.8%) | 3 (2.7%) |
| 60 to 89 Minutes | 6 (5.4%) | 38 (33.9%) |
| 90 or more Minutes | 4 (3.6%) | 1 (0.9%) |
Time of Departure to Work by Sex in Louin
The most frequent times of departure to work in Louin are 6:30 AM to 6:59 AM (78, 69.6%) for males and 7:00 AM to 7:29 AM (47, 42.0%) for females.
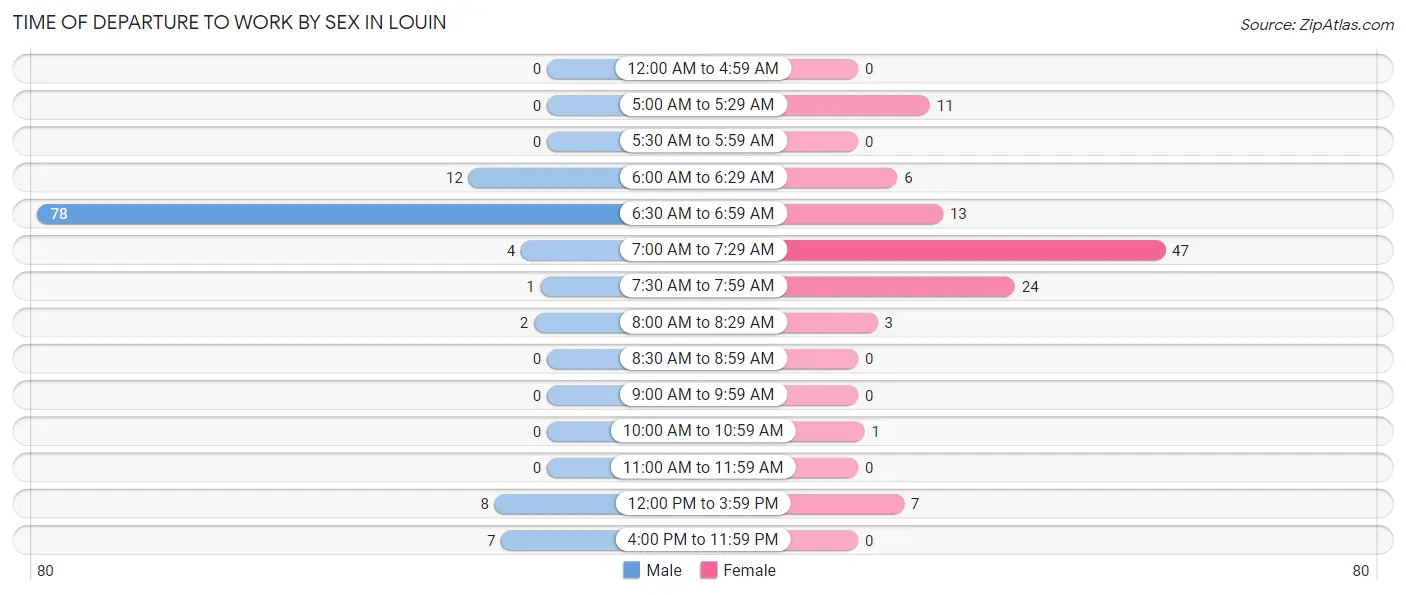
| Time of Departure | Male | Female |
| 12:00 AM to 4:59 AM | 0 (0.0%) | 0 (0.0%) |
| 5:00 AM to 5:29 AM | 0 (0.0%) | 11 (9.8%) |
| 5:30 AM to 5:59 AM | 0 (0.0%) | 0 (0.0%) |
| 6:00 AM to 6:29 AM | 12 (10.7%) | 6 (5.4%) |
| 6:30 AM to 6:59 AM | 78 (69.6%) | 13 (11.6%) |
| 7:00 AM to 7:29 AM | 4 (3.6%) | 47 (42.0%) |
| 7:30 AM to 7:59 AM | 1 (0.9%) | 24 (21.4%) |
| 8:00 AM to 8:29 AM | 2 (1.8%) | 3 (2.7%) |
| 8:30 AM to 8:59 AM | 0 (0.0%) | 0 (0.0%) |
| 9:00 AM to 9:59 AM | 0 (0.0%) | 0 (0.0%) |
| 10:00 AM to 10:59 AM | 0 (0.0%) | 1 (0.9%) |
| 11:00 AM to 11:59 AM | 0 (0.0%) | 0 (0.0%) |
| 12:00 PM to 3:59 PM | 8 (7.1%) | 7 (6.2%) |
| 4:00 PM to 11:59 PM | 7 (6.2%) | 0 (0.0%) |
| Total | 112 (100.0%) | 112 (100.0%) |
Housing Occupancy in Louin
Occupancy by Ownership in Louin
Of the total 208 dwellings in Louin, owner-occupied units account for 186 (89.4%), while renter-occupied units make up 22 (10.6%).
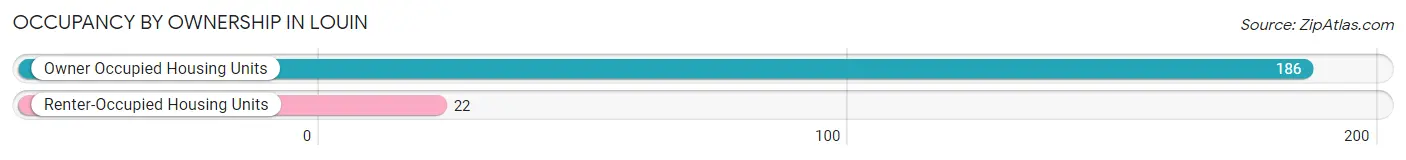
| Occupancy | # Housing Units | % Housing Units |
| Owner Occupied Housing Units | 186 | 89.4% |
| Renter-Occupied Housing Units | 22 | 10.6% |
| Total Occupied Housing Units | 208 | 100.0% |
Occupancy by Household Size in Louin
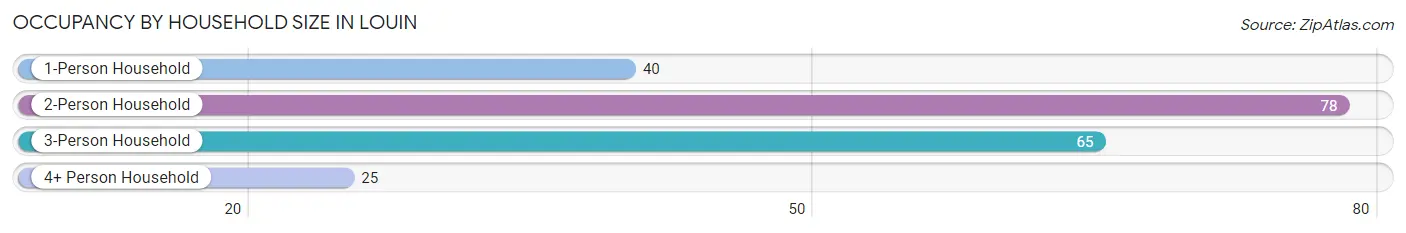
| Household Size | # Housing Units | % Housing Units |
| 1-Person Household | 40 | 19.2% |
| 2-Person Household | 78 | 37.5% |
| 3-Person Household | 65 | 31.2% |
| 4+ Person Household | 25 | 12.0% |
| Total Housing Units | 208 | 100.0% |
Occupancy by Ownership by Household Size in Louin
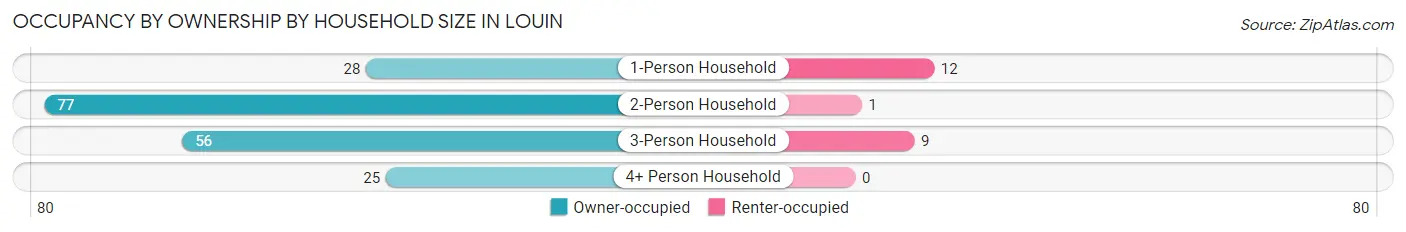
| Household Size | Owner-occupied | Renter-occupied |
| 1-Person Household | 28 (70.0%) | 12 (30.0%) |
| 2-Person Household | 77 (98.7%) | 1 (1.3%) |
| 3-Person Household | 56 (86.2%) | 9 (13.9%) |
| 4+ Person Household | 25 (100.0%) | 0 (0.0%) |
| Total Housing Units | 186 (89.4%) | 22 (10.6%) |
Occupancy by Educational Attainment in Louin
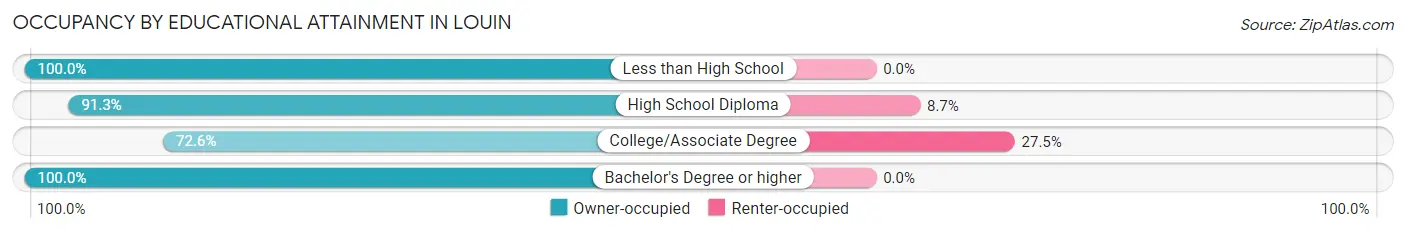
| Household Size | Owner-occupied | Renter-occupied |
| Less than High School | 5 (100.0%) | 0 (0.0%) |
| High School Diploma | 84 (91.3%) | 8 (8.7%) |
| College/Associate Degree | 37 (72.6%) | 14 (27.5%) |
| Bachelor's Degree or higher | 60 (100.0%) | 0 (0.0%) |
Occupancy by Age of Householder in Louin
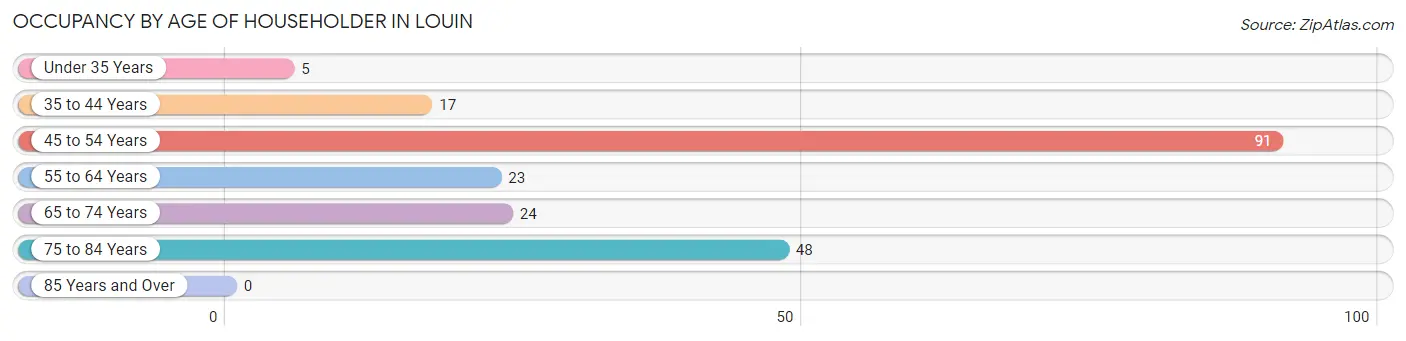
| Age Bracket | # Households | % Households |
| Under 35 Years | 5 | 2.4% |
| 35 to 44 Years | 17 | 8.2% |
| 45 to 54 Years | 91 | 43.8% |
| 55 to 64 Years | 23 | 11.1% |
| 65 to 74 Years | 24 | 11.5% |
| 75 to 84 Years | 48 | 23.1% |
| 85 Years and Over | 0 | 0.0% |
| Total | 208 | 100.0% |
Housing Finances in Louin
Median Income by Occupancy in Louin
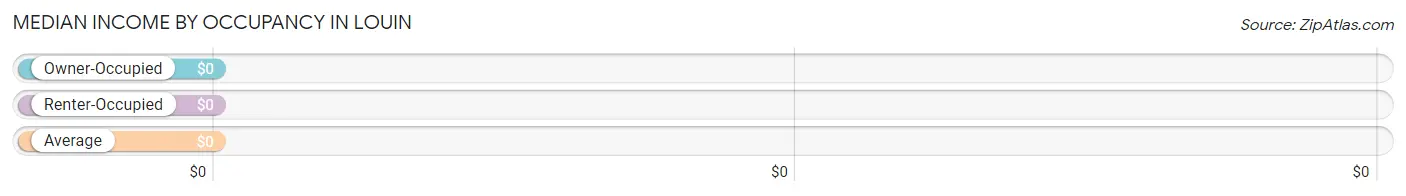
| Occupancy Type | # Households | Median Income |
| Owner-Occupied | 186 (89.4%) | $0 |
| Renter-Occupied | 22 (10.6%) | $0 |
| Average | 208 (100.0%) | $0 |
Occupancy by Householder Income Bracket in Louin
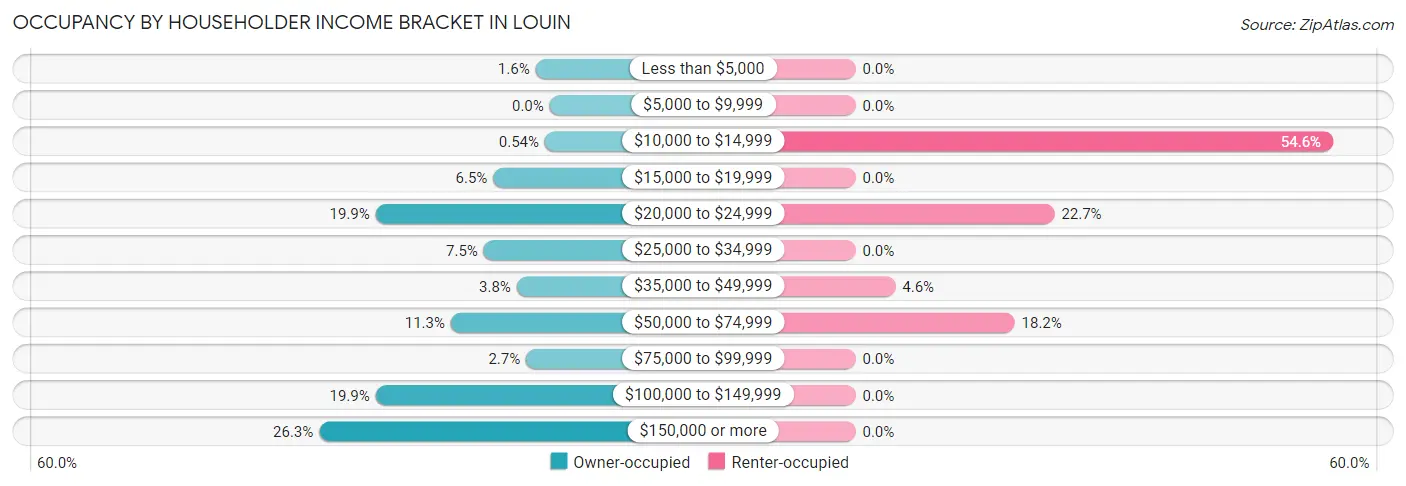
| Income Bracket | Owner-occupied | Renter-occupied |
| Less than $5,000 | 3 (1.6%) | 0 (0.0%) |
| $5,000 to $9,999 | 0 (0.0%) | 0 (0.0%) |
| $10,000 to $14,999 | 1 (0.5%) | 12 (54.5%) |
| $15,000 to $19,999 | 12 (6.5%) | 0 (0.0%) |
| $20,000 to $24,999 | 37 (19.9%) | 5 (22.7%) |
| $25,000 to $34,999 | 14 (7.5%) | 0 (0.0%) |
| $35,000 to $49,999 | 7 (3.8%) | 1 (4.5%) |
| $50,000 to $74,999 | 21 (11.3%) | 4 (18.2%) |
| $75,000 to $99,999 | 5 (2.7%) | 0 (0.0%) |
| $100,000 to $149,999 | 37 (19.9%) | 0 (0.0%) |
| $150,000 or more | 49 (26.3%) | 0 (0.0%) |
| Total | 186 (100.0%) | 22 (100.0%) |
Monthly Housing Cost Tiers in Louin
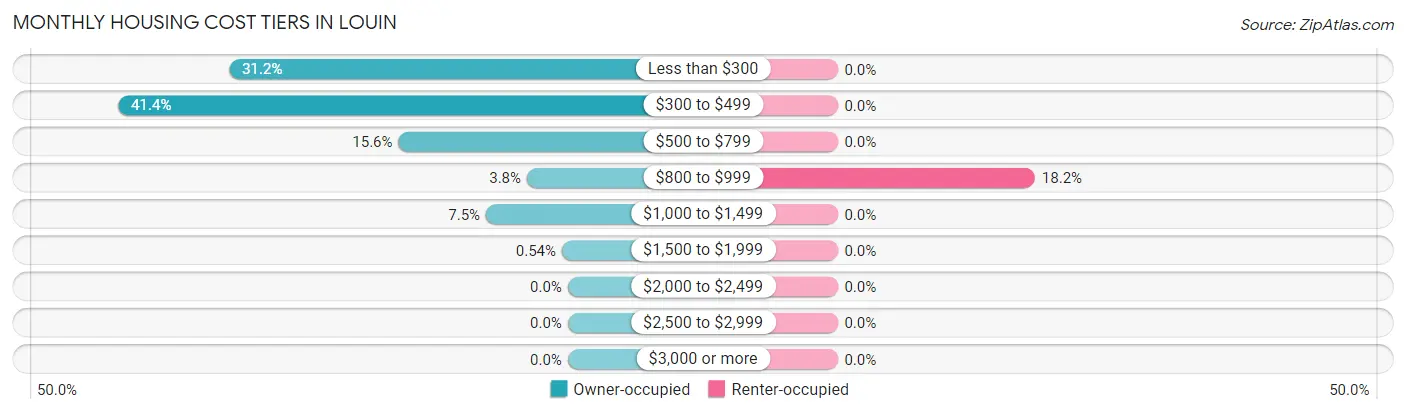
| Monthly Cost | Owner-occupied | Renter-occupied |
| Less than $300 | 58 (31.2%) | 0 (0.0%) |
| $300 to $499 | 77 (41.4%) | 0 (0.0%) |
| $500 to $799 | 29 (15.6%) | 0 (0.0%) |
| $800 to $999 | 7 (3.8%) | 4 (18.2%) |
| $1,000 to $1,499 | 14 (7.5%) | 0 (0.0%) |
| $1,500 to $1,999 | 1 (0.5%) | 0 (0.0%) |
| $2,000 to $2,499 | 0 (0.0%) | 0 (0.0%) |
| $2,500 to $2,999 | 0 (0.0%) | 0 (0.0%) |
| $3,000 or more | 0 (0.0%) | 0 (0.0%) |
| Total | 186 (100.0%) | 22 (100.0%) |
Physical Housing Characteristics in Louin
Housing Structures in Louin
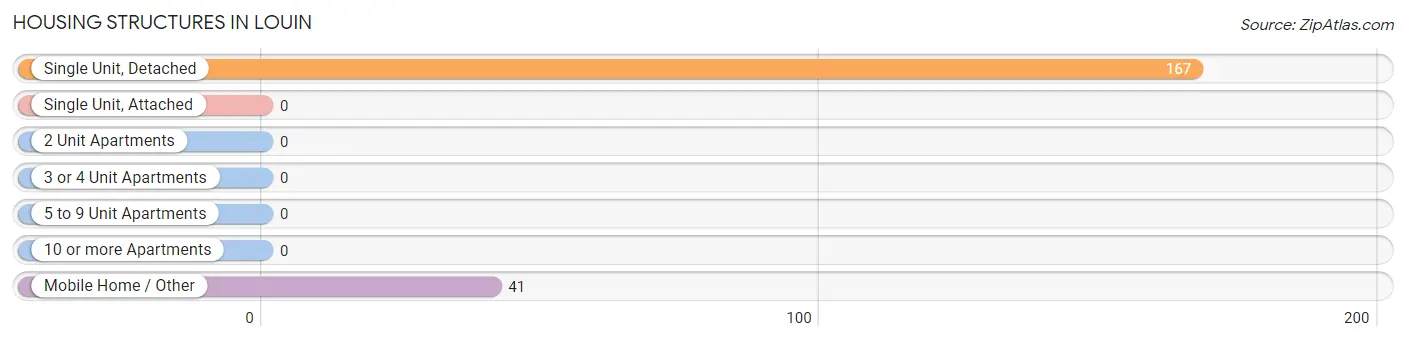
| Structure Type | # Housing Units | % Housing Units |
| Single Unit, Detached | 167 | 80.3% |
| Single Unit, Attached | 0 | 0.0% |
| 2 Unit Apartments | 0 | 0.0% |
| 3 or 4 Unit Apartments | 0 | 0.0% |
| 5 to 9 Unit Apartments | 0 | 0.0% |
| 10 or more Apartments | 0 | 0.0% |
| Mobile Home / Other | 41 | 19.7% |
| Total | 208 | 100.0% |
Housing Structures by Occupancy in Louin
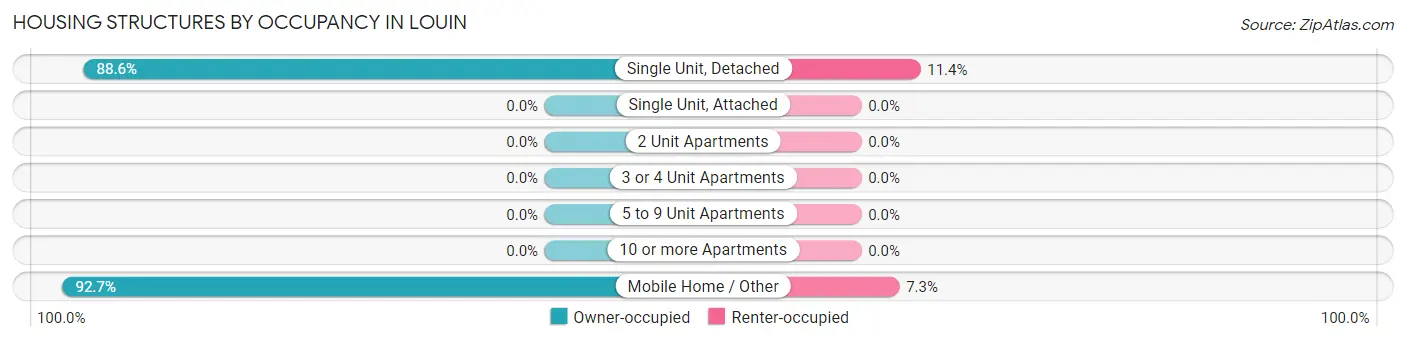
| Structure Type | Owner-occupied | Renter-occupied |
| Single Unit, Detached | 148 (88.6%) | 19 (11.4%) |
| Single Unit, Attached | 0 (0.0%) | 0 (0.0%) |
| 2 Unit Apartments | 0 (0.0%) | 0 (0.0%) |
| 3 or 4 Unit Apartments | 0 (0.0%) | 0 (0.0%) |
| 5 to 9 Unit Apartments | 0 (0.0%) | 0 (0.0%) |
| 10 or more Apartments | 0 (0.0%) | 0 (0.0%) |
| Mobile Home / Other | 38 (92.7%) | 3 (7.3%) |
| Total | 186 (89.4%) | 22 (10.6%) |
Housing Structures by Number of Rooms in Louin
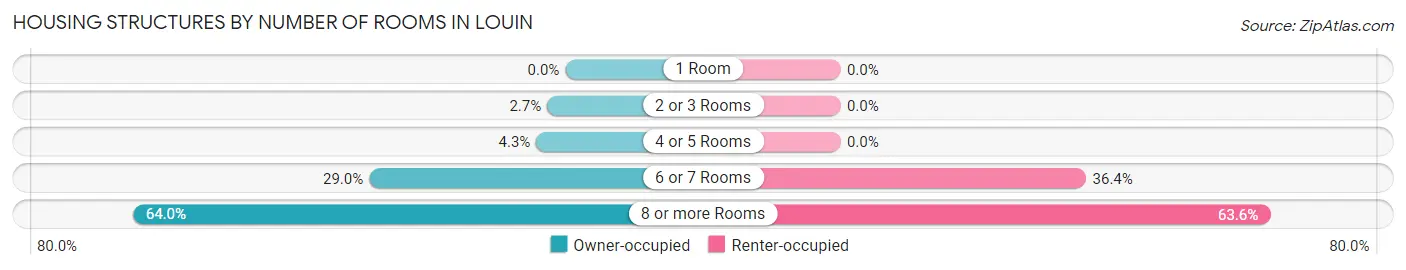
| Number of Rooms | Owner-occupied | Renter-occupied |
| 1 Room | 0 (0.0%) | 0 (0.0%) |
| 2 or 3 Rooms | 5 (2.7%) | 0 (0.0%) |
| 4 or 5 Rooms | 8 (4.3%) | 0 (0.0%) |
| 6 or 7 Rooms | 54 (29.0%) | 8 (36.4%) |
| 8 or more Rooms | 119 (64.0%) | 14 (63.6%) |
| Total | 186 (100.0%) | 22 (100.0%) |
Housing Structure by Heating Type in Louin
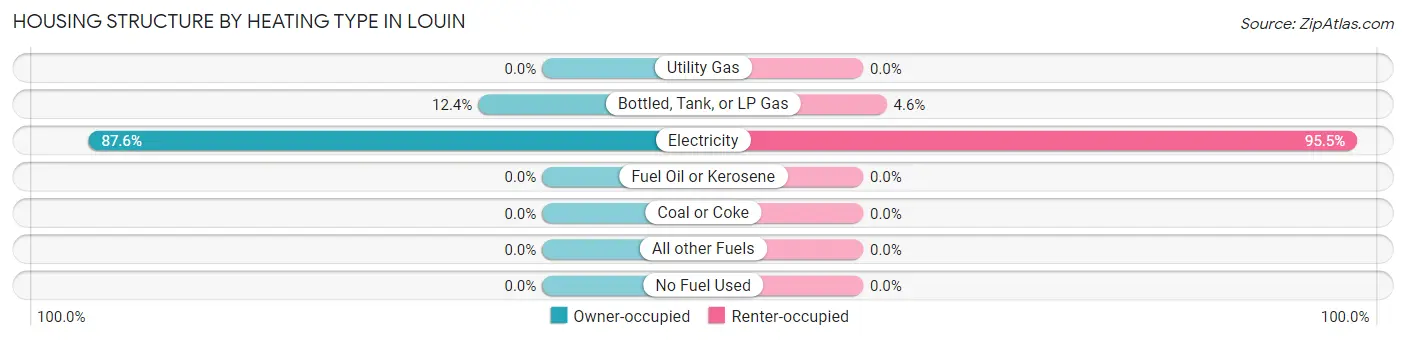
| Heating Type | Owner-occupied | Renter-occupied |
| Utility Gas | 0 (0.0%) | 0 (0.0%) |
| Bottled, Tank, or LP Gas | 23 (12.4%) | 1 (4.5%) |
| Electricity | 163 (87.6%) | 21 (95.5%) |
| Fuel Oil or Kerosene | 0 (0.0%) | 0 (0.0%) |
| Coal or Coke | 0 (0.0%) | 0 (0.0%) |
| All other Fuels | 0 (0.0%) | 0 (0.0%) |
| No Fuel Used | 0 (0.0%) | 0 (0.0%) |
| Total | 186 (100.0%) | 22 (100.0%) |
Household Vehicle Usage in Louin
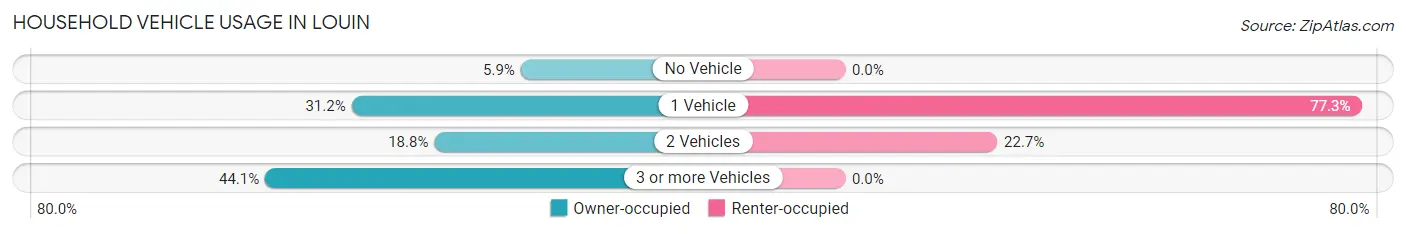
| Vehicles per Household | Owner-occupied | Renter-occupied |
| No Vehicle | 11 (5.9%) | 0 (0.0%) |
| 1 Vehicle | 58 (31.2%) | 17 (77.3%) |
| 2 Vehicles | 35 (18.8%) | 5 (22.7%) |
| 3 or more Vehicles | 82 (44.1%) | 0 (0.0%) |
| Total | 186 (100.0%) | 22 (100.0%) |
Real Estate & Mortgages in Louin
Real Estate and Mortgage Overview in Louin
| Characteristic | Without Mortgage | With Mortgage |
| Housing Units | 164 | 22 |
| Median Property Value | $170,600 | $183,300 |
| Median Household Income | - | - |
| Monthly Housing Costs | $410 | $0 |
| Real Estate Taxes | $1,119 | $6 |
Property Value by Mortgage Status in Louin
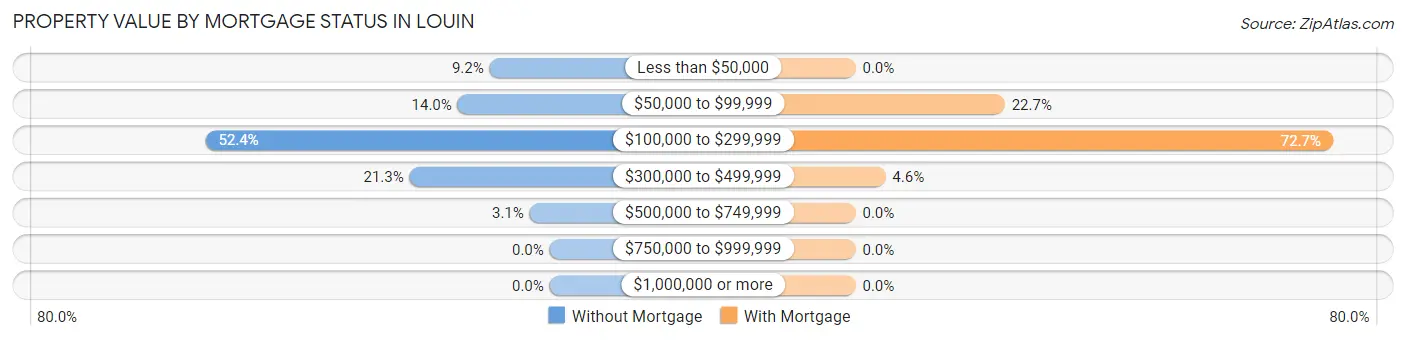
| Property Value | Without Mortgage | With Mortgage |
| Less than $50,000 | 15 (9.1%) | 0 (0.0%) |
| $50,000 to $99,999 | 23 (14.0%) | 5 (22.7%) |
| $100,000 to $299,999 | 86 (52.4%) | 16 (72.7%) |
| $300,000 to $499,999 | 35 (21.3%) | 1 (4.5%) |
| $500,000 to $749,999 | 5 (3.0%) | 0 (0.0%) |
| $750,000 to $999,999 | 0 (0.0%) | 0 (0.0%) |
| $1,000,000 or more | 0 (0.0%) | 0 (0.0%) |
| Total | 164 (100.0%) | 22 (100.0%) |
Household Income by Mortgage Status in Louin
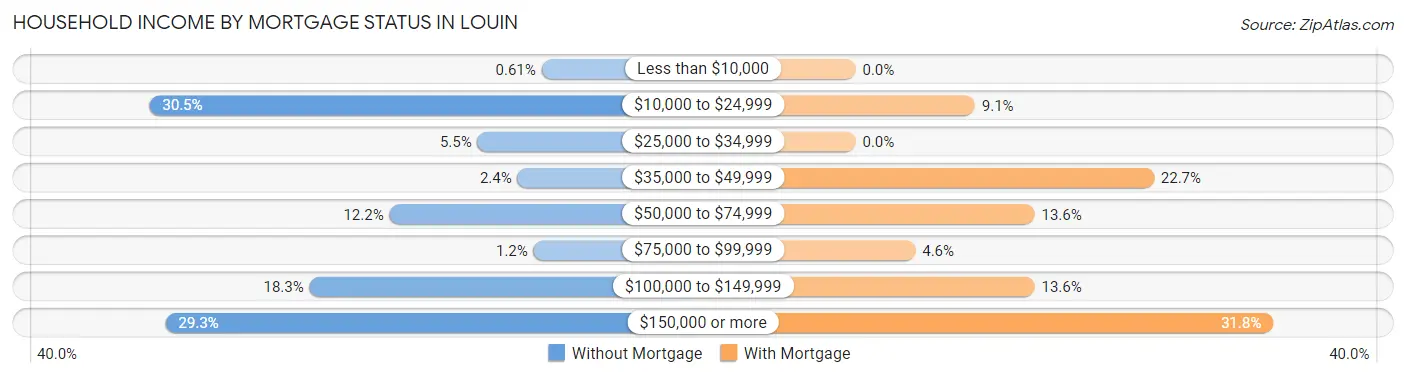
| Household Income | Without Mortgage | With Mortgage |
| Less than $10,000 | 1 (0.6%) | 0 (0.0%) |
| $10,000 to $24,999 | 50 (30.5%) | 2 (9.1%) |
| $25,000 to $34,999 | 9 (5.5%) | 0 (0.0%) |
| $35,000 to $49,999 | 4 (2.4%) | 5 (22.7%) |
| $50,000 to $74,999 | 20 (12.2%) | 3 (13.6%) |
| $75,000 to $99,999 | 2 (1.2%) | 1 (4.5%) |
| $100,000 to $149,999 | 30 (18.3%) | 3 (13.6%) |
| $150,000 or more | 48 (29.3%) | 7 (31.8%) |
| Total | 164 (100.0%) | 22 (100.0%) |
Property Value to Household Income Ratio in Louin
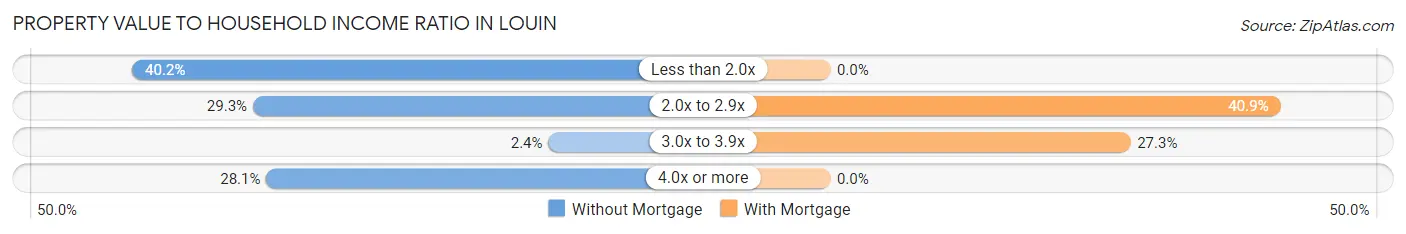
| Value-to-Income Ratio | Without Mortgage | With Mortgage |
| Less than 2.0x | 66 (40.2%) | 0 (0.0%) |
| 2.0x to 2.9x | 48 (29.3%) | 9 (40.9%) |
| 3.0x to 3.9x | 4 (2.4%) | 6 (27.3%) |
| 4.0x or more | 46 (28.1%) | 0 (0.0%) |
| Total | 164 (100.0%) | 22 (100.0%) |
Real Estate Taxes by Mortgage Status in Louin
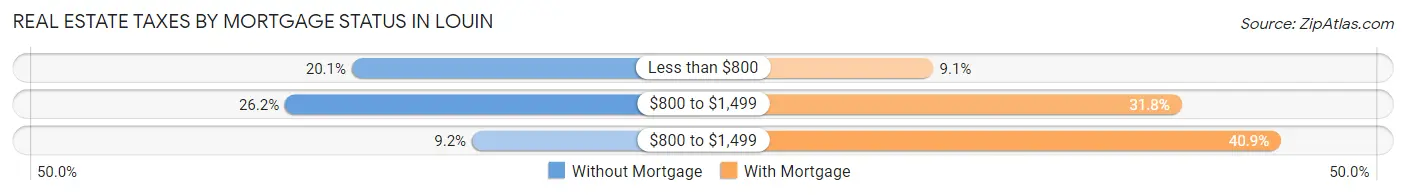
| Property Taxes | Without Mortgage | With Mortgage |
| Less than $800 | 33 (20.1%) | 2 (9.1%) |
| $800 to $1,499 | 43 (26.2%) | 7 (31.8%) |
| $800 to $1,499 | 15 (9.1%) | 9 (40.9%) |
| Total | 164 (100.0%) | 22 (100.0%) |
Health & Disability in Louin
Health Insurance Coverage by Age in Louin
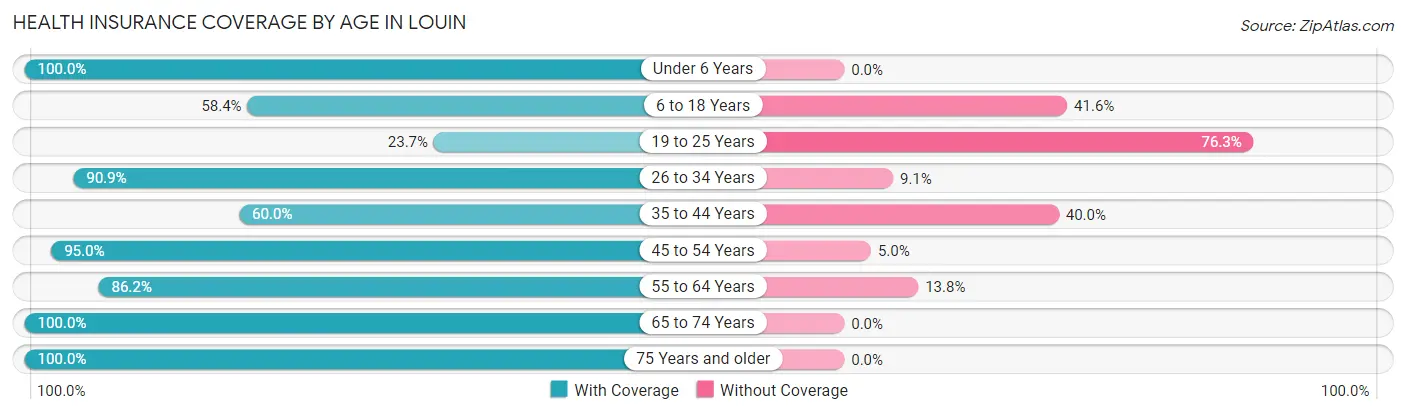
| Age Bracket | With Coverage | Without Coverage |
| Under 6 Years | 10 (100.0%) | 0 (0.0%) |
| 6 to 18 Years | 45 (58.4%) | 32 (41.6%) |
| 19 to 25 Years | 9 (23.7%) | 29 (76.3%) |
| 26 to 34 Years | 10 (90.9%) | 1 (9.1%) |
| 35 to 44 Years | 18 (60.0%) | 12 (40.0%) |
| 45 to 54 Years | 172 (95.0%) | 9 (5.0%) |
| 55 to 64 Years | 25 (86.2%) | 4 (13.8%) |
| 65 to 74 Years | 40 (100.0%) | 0 (0.0%) |
| 75 Years and older | 62 (100.0%) | 0 (0.0%) |
| Total | 391 (81.8%) | 87 (18.2%) |
Health Insurance Coverage by Citizenship Status in Louin
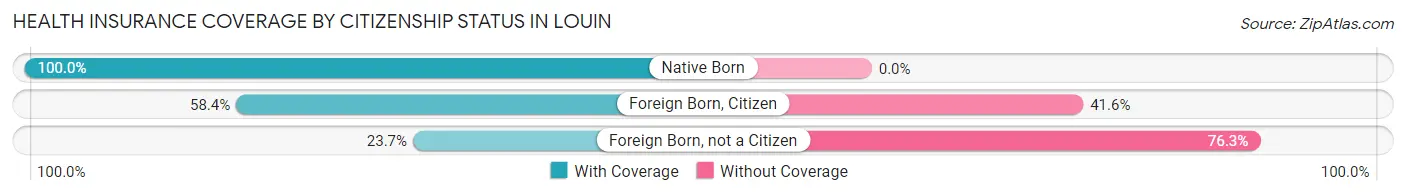
| Citizenship Status | With Coverage | Without Coverage |
| Native Born | 10 (100.0%) | 0 (0.0%) |
| Foreign Born, Citizen | 45 (58.4%) | 32 (41.6%) |
| Foreign Born, not a Citizen | 9 (23.7%) | 29 (76.3%) |
Health Insurance Coverage by Household Income in Louin
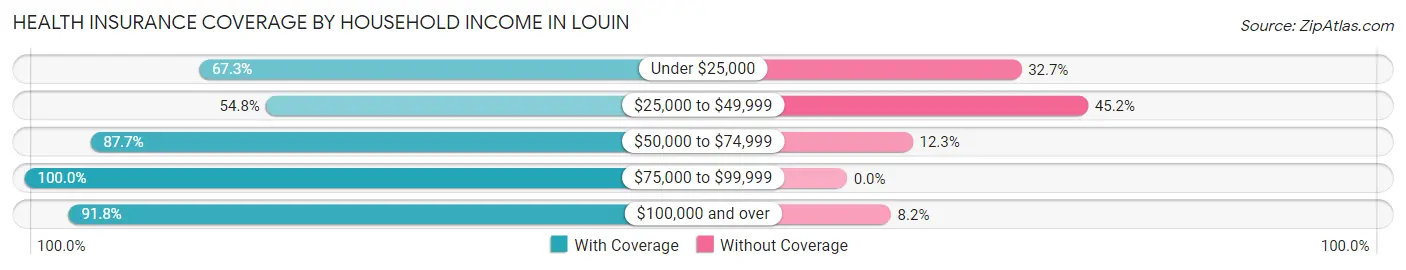
| Household Income | With Coverage | Without Coverage |
| Under $25,000 | 68 (67.3%) | 33 (32.7%) |
| $25,000 to $49,999 | 34 (54.8%) | 28 (45.2%) |
| $50,000 to $74,999 | 57 (87.7%) | 8 (12.3%) |
| $75,000 to $99,999 | 31 (100.0%) | 0 (0.0%) |
| $100,000 and over | 201 (91.8%) | 18 (8.2%) |
Public vs Private Health Insurance Coverage by Age in Louin
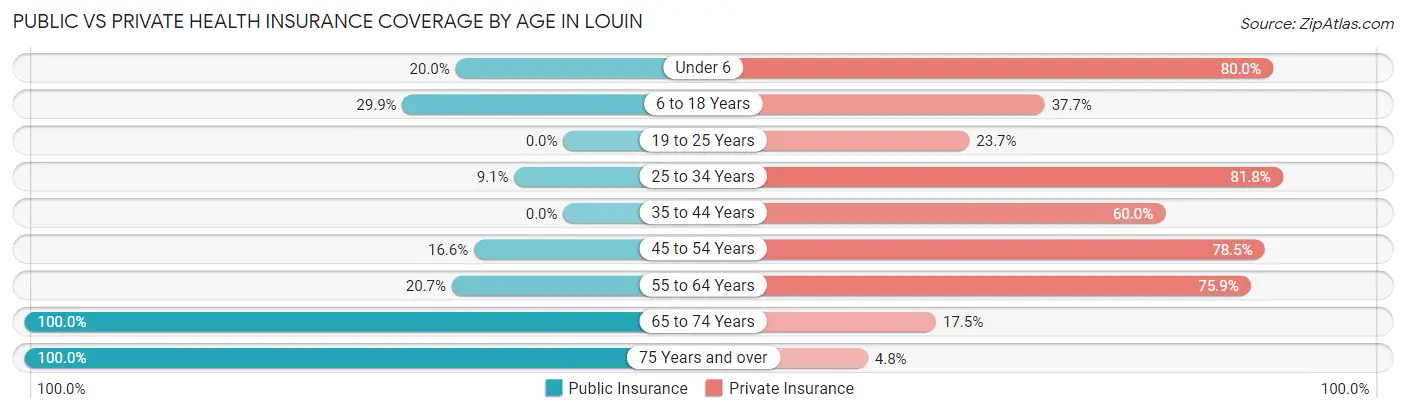
| Age Bracket | Public Insurance | Private Insurance |
| Under 6 | 2 (20.0%) | 8 (80.0%) |
| 6 to 18 Years | 23 (29.9%) | 29 (37.7%) |
| 19 to 25 Years | 0 (0.0%) | 9 (23.7%) |
| 25 to 34 Years | 1 (9.1%) | 9 (81.8%) |
| 35 to 44 Years | 0 (0.0%) | 18 (60.0%) |
| 45 to 54 Years | 30 (16.6%) | 142 (78.4%) |
| 55 to 64 Years | 6 (20.7%) | 22 (75.9%) |
| 65 to 74 Years | 40 (100.0%) | 7 (17.5%) |
| 75 Years and over | 62 (100.0%) | 3 (4.8%) |
| Total | 164 (34.3%) | 247 (51.7%) |
Disability Status by Sex by Age in Louin
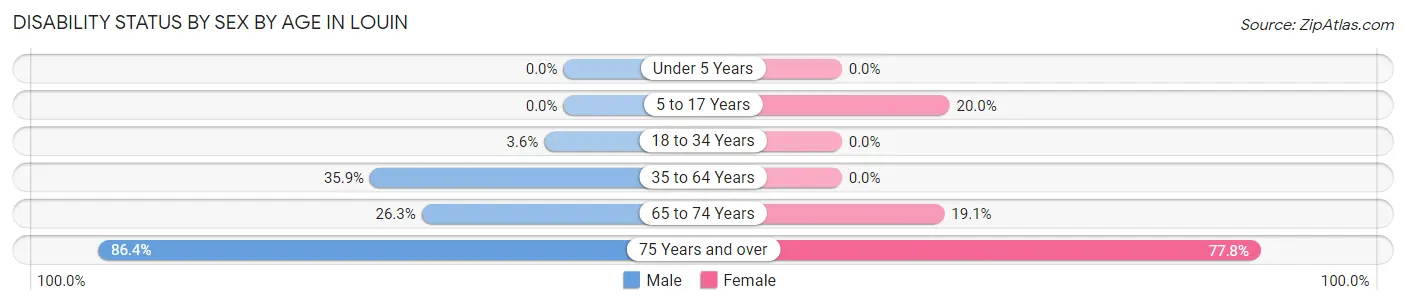
| Age Bracket | Male | Female |
| Under 5 Years | 0 (0.0%) | 0 (0.0%) |
| 5 to 17 Years | 0 (0.0%) | 7 (20.0%) |
| 18 to 34 Years | 1 (3.6%) | 0 (0.0%) |
| 35 to 64 Years | 42 (35.9%) | 0 (0.0%) |
| 65 to 74 Years | 5 (26.3%) | 4 (19.1%) |
| 75 Years and over | 38 (86.4%) | 14 (77.8%) |
Disability Class by Sex by Age in Louin
Disability Class: Hearing Difficulty
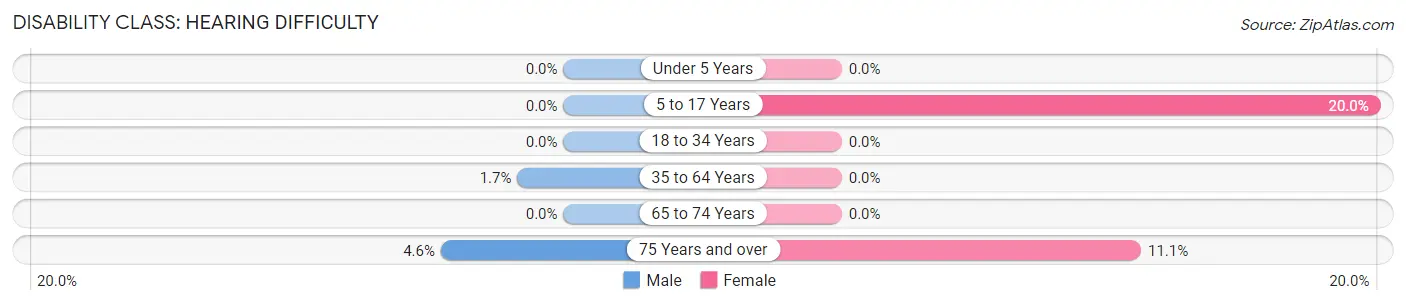
| Age Bracket | Male | Female |
| Under 5 Years | 0 (0.0%) | 0 (0.0%) |
| 5 to 17 Years | 0 (0.0%) | 7 (20.0%) |
| 18 to 34 Years | 0 (0.0%) | 0 (0.0%) |
| 35 to 64 Years | 2 (1.7%) | 0 (0.0%) |
| 65 to 74 Years | 0 (0.0%) | 0 (0.0%) |
| 75 Years and over | 2 (4.5%) | 2 (11.1%) |
Disability Class: Vision Difficulty
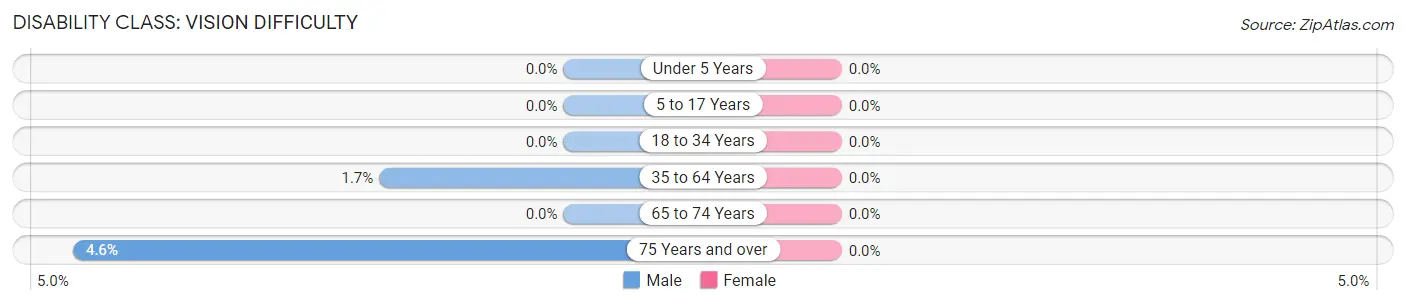
| Age Bracket | Male | Female |
| Under 5 Years | 0 (0.0%) | 0 (0.0%) |
| 5 to 17 Years | 0 (0.0%) | 0 (0.0%) |
| 18 to 34 Years | 0 (0.0%) | 0 (0.0%) |
| 35 to 64 Years | 2 (1.7%) | 0 (0.0%) |
| 65 to 74 Years | 0 (0.0%) | 0 (0.0%) |
| 75 Years and over | 2 (4.5%) | 0 (0.0%) |
Disability Class: Cognitive Difficulty
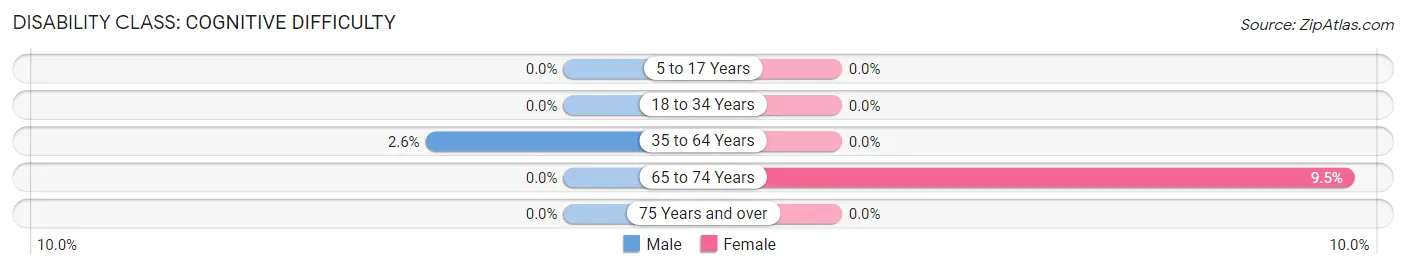
| Age Bracket | Male | Female |
| 5 to 17 Years | 0 (0.0%) | 0 (0.0%) |
| 18 to 34 Years | 0 (0.0%) | 0 (0.0%) |
| 35 to 64 Years | 3 (2.6%) | 0 (0.0%) |
| 65 to 74 Years | 0 (0.0%) | 2 (9.5%) |
| 75 Years and over | 0 (0.0%) | 0 (0.0%) |
Disability Class: Ambulatory Difficulty
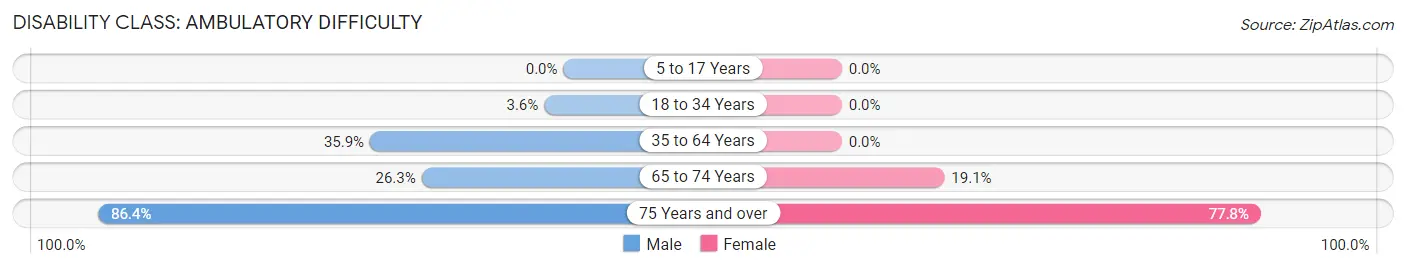
| Age Bracket | Male | Female |
| 5 to 17 Years | 0 (0.0%) | 0 (0.0%) |
| 18 to 34 Years | 1 (3.6%) | 0 (0.0%) |
| 35 to 64 Years | 42 (35.9%) | 0 (0.0%) |
| 65 to 74 Years | 5 (26.3%) | 4 (19.1%) |
| 75 Years and over | 38 (86.4%) | 14 (77.8%) |
Disability Class: Self-Care Difficulty
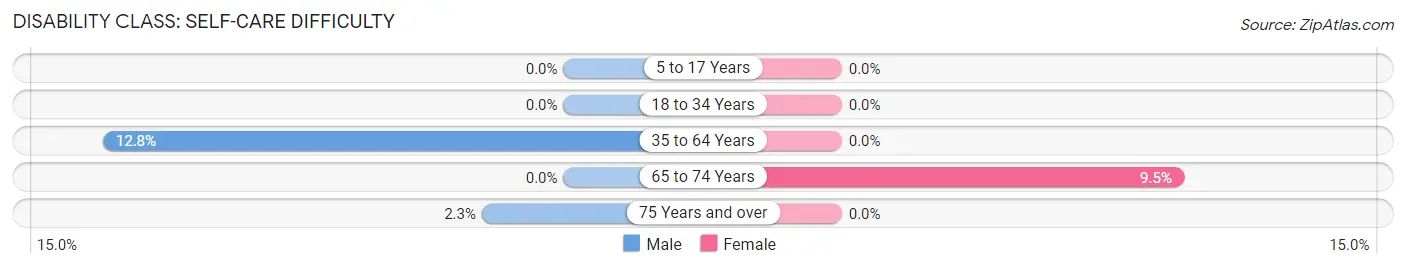
| Age Bracket | Male | Female |
| 5 to 17 Years | 0 (0.0%) | 0 (0.0%) |
| 18 to 34 Years | 0 (0.0%) | 0 (0.0%) |
| 35 to 64 Years | 15 (12.8%) | 0 (0.0%) |
| 65 to 74 Years | 0 (0.0%) | 2 (9.5%) |
| 75 Years and over | 1 (2.3%) | 0 (0.0%) |
Technology Access in Louin
Computing Device Access in Louin
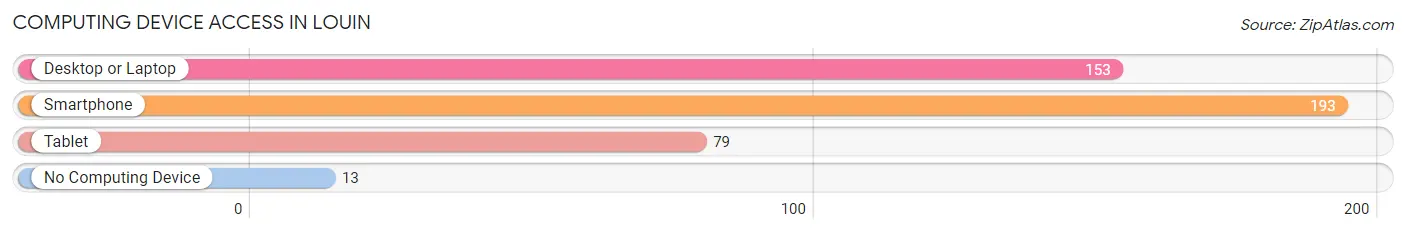
| Device Type | # Households | % Households |
| Desktop or Laptop | 153 | 73.6% |
| Smartphone | 193 | 92.8% |
| Tablet | 79 | 38.0% |
| No Computing Device | 13 | 6.2% |
| Total | 208 | 100.0% |
Internet Access in Louin
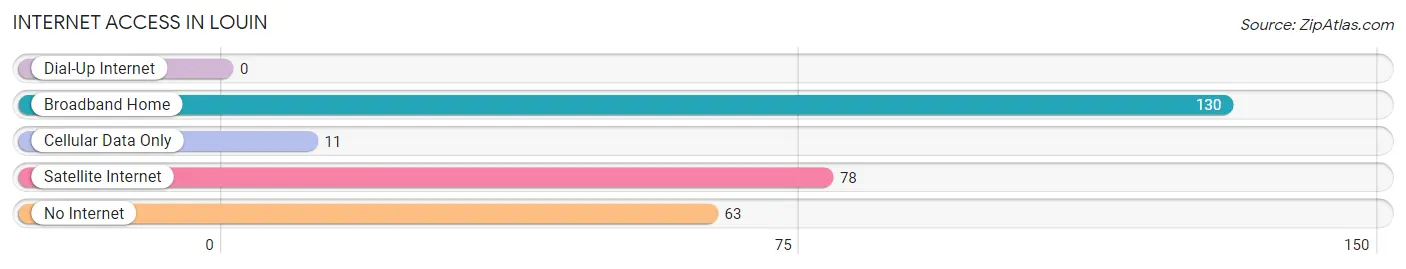
| Internet Type | # Households | % Households |
| Dial-Up Internet | 0 | 0.0% |
| Broadband Home | 130 | 62.5% |
| Cellular Data Only | 11 | 5.3% |
| Satellite Internet | 78 | 37.5% |
| No Internet | 63 | 30.3% |
| Total | 208 | 100.0% |
Louin Summary
Louin is a small town located in Jones County, Mississippi. It is situated in the southeastern part of the state, approximately 20 miles south of the state capital, Jackson. The town has a population of approximately 1,000 people and is part of the Laurel Micropolitan Statistical Area.
History
Louin was founded in 1883 by the Louin family, who had moved to the area from Georgia. The town was named after the family’s patriarch, John Louin. The town was originally a small farming community, but it soon grew to include a post office, a general store, and a cotton gin.
In the early 1900s, the town began to experience a period of growth and development. The Louin family opened a sawmill and a gristmill, and the town was incorporated in 1906. The town also had a school, a bank, and a hotel.
In the 1920s, the town experienced a period of decline due to the Great Depression. Many of the businesses in the town closed, and the population decreased. However, the town was able to recover in the 1940s and 1950s, and the population began to grow again.
Geography
Louin is located in the southeastern part of Mississippi, approximately 20 miles south of the state capital, Jackson. The town is situated in Jones County, which is part of the Pine Belt region of the state. The town is located in a rural area, and the surrounding landscape is mostly flat. The town is located near the Leaf River, which is a tributary of the Pearl River.
Economy
The economy of Louin is largely based on agriculture. The town is home to several farms, which produce a variety of crops, including cotton, corn, soybeans, and peanuts. The town also has a few small businesses, including a grocery store, a hardware store, and a few restaurants.
Demographics
As of the 2010 census, the population of Louin was 1,000 people. The racial makeup of the town was 79.2% White, 18.2% African American, 0.7% Native American, 0.3% Asian, and 1.6% from other races. The median household income in the town was $30,000, and the median age was 37.
Conclusion
Louin is a small town located in Jones County, Mississippi. It has a population of approximately 1,000 people and is part of the Laurel Micropolitan Statistical Area. The town was founded in 1883 by the Louin family, and it has experienced periods of growth and decline throughout its history. The economy of the town is largely based on agriculture, and the population is mostly White and African American.
Common Questions
What is Per Capita Income in Louin?
Per Capita income in Louin is $32,557.
What is the Median Family Income in Louin?
Median Family Income in Louin is $110,167.
What is Income or Wage Gap in Louin?
Income or Wage Gap in Louin is 4.5%.
Women in Louin earn 95.5 cents for every dollar earned by a man.
What is Inequality or Gini Index in Louin?
Inequality or Gini Index in Louin is 0.41.
What is the Total Population of Louin?
Total Population of Louin is 478.
What is the Total Male Population of Louin?
Total Male Population of Louin is 255.
What is the Total Female Population of Louin?
Total Female Population of Louin is 223.
What is the Ratio of Males per 100 Females in Louin?
There are 114.35 Males per 100 Females in Louin.
What is the Ratio of Females per 100 Males in Louin?
There are 87.45 Females per 100 Males in Louin.
What is the Median Population Age in Louin?
Median Population Age in Louin is 48.4 Years.
What is the Average Family Size in Louin
Average Family Size in Louin is 2.6 People.
What is the Average Household Size in Louin
Average Household Size in Louin is 2.3 People.
How Large is the Labor Force in Louin?
There are 235 People in the Labor Forcein in Louin.
What is the Percentage of People in the Labor Force in Louin?
57.7% of People are in the Labor Force in Louin.
What is the Unemployment Rate in Louin?
Unemployment Rate in Louin is 4.3%.