Shelby, MS Map & Demographics
Shelby Map
Shelby Overview
$14,020
PER CAPITA INCOME
$28,487
AVG FAMILY INCOME
$28,827
AVG HOUSEHOLD INCOME
40.8%
WAGE / INCOME GAP [ % ]
59.2¢/ $1
WAGE / INCOME GAP [ $ ]
$12,788
FAMILY INCOME DEFICIT
0.42
INEQUALITY / GINI INDEX
1,751
TOTAL POPULATION
780
MALE POPULATION
971
FEMALE POPULATION
80.33
MALES / 100 FEMALES
124.49
FEMALES / 100 MALES
42.1
MEDIAN AGE
3.0
AVG FAMILY SIZE
2.4
AVG HOUSEHOLD SIZE
408
LABOR FORCE [ PEOPLE ]
27.4%
PERCENT IN LABOR FORCE
16.8%
UNEMPLOYMENT RATE
Shelby Zip Codes
Shelby Area Codes
Income in Shelby
Income Overview in Shelby
Per Capita Income in Shelby is $14,020, while median incomes of families and households are $28,487 and $28,827 respectively.
| Characteristic | Number | Measure |
| Per Capita Income | 1,751 | $14,020 |
| Median Family Income | 438 | $28,487 |
| Mean Family Income | 438 | $35,710 |
| Median Household Income | 717 | $28,827 |
| Mean Household Income | 717 | $32,295 |
| Income Deficit | 438 | $12,788 |
| Wage / Income Gap (%) | 1,751 | 40.79% |
| Wage / Income Gap ($) | 1,751 | 59.21¢ per $1 |
| Gini / Inequality Index | 1,751 | 0.42 |
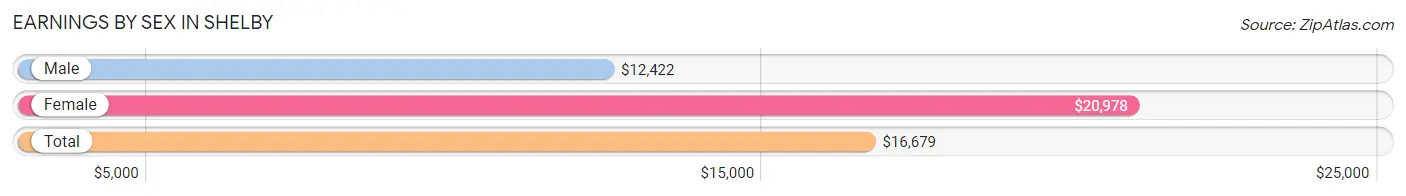
Earnings by Sex in Shelby
Average Earnings in Shelby are $16,679, $12,422 for men and $20,978 for women, a difference of 40.8%.
| Sex | Number | Average Earnings |
| Male | 169 (34.7%) | $12,422 |
| Female | 318 (65.3%) | $20,978 |
| Total | 487 (100.0%) | $16,679 |
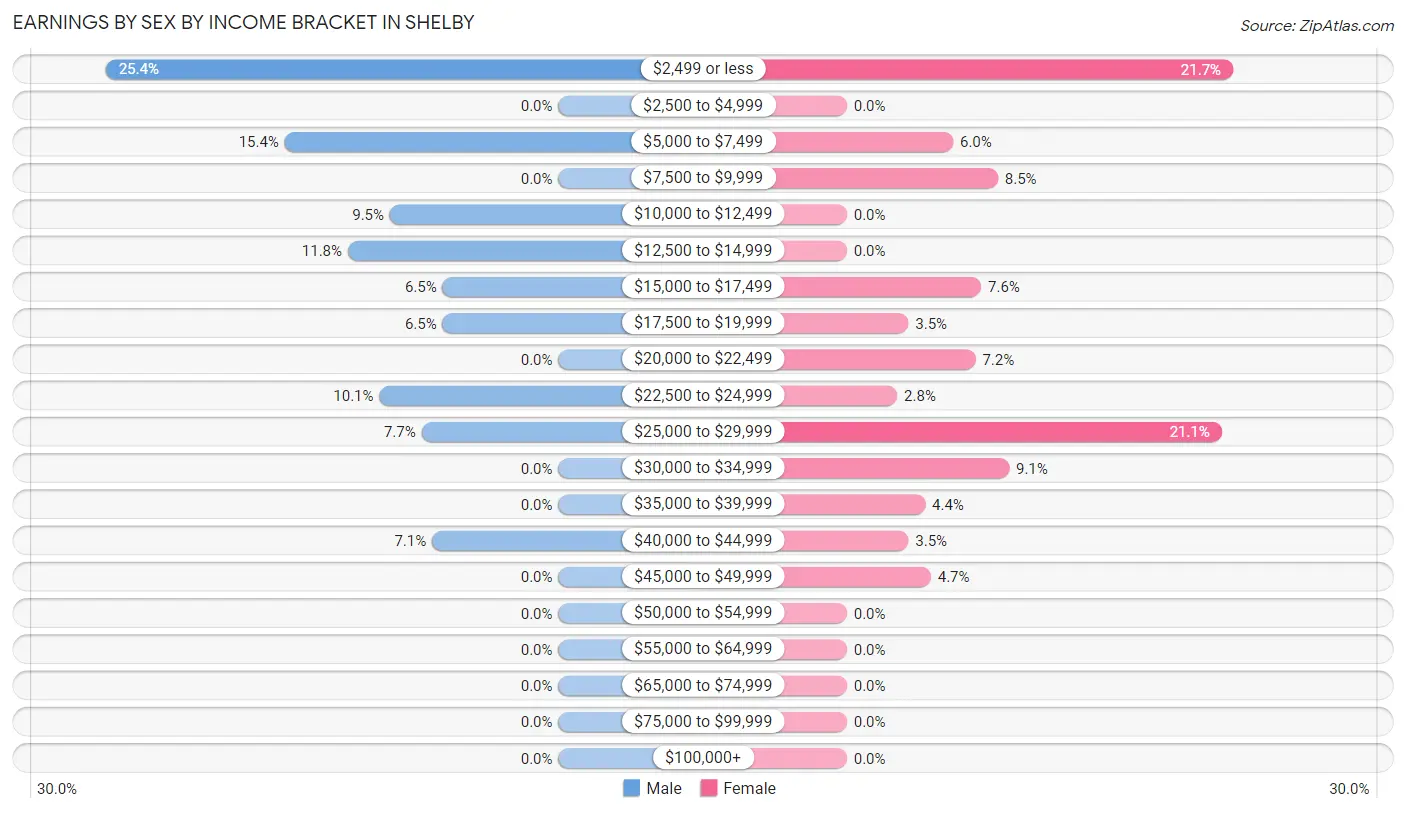
Earnings by Sex by Income Bracket in Shelby
The most common earnings brackets in Shelby are $2,499 or less for men (43 | 25.4%) and $2,499 or less for women (69 | 21.7%).
| Income | Male | Female |
| $2,499 or less | 43 (25.4%) | 69 (21.7%) |
| $2,500 to $4,999 | 0 (0.0%) | 0 (0.0%) |
| $5,000 to $7,499 | 26 (15.4%) | 19 (6.0%) |
| $7,500 to $9,999 | 0 (0.0%) | 27 (8.5%) |
| $10,000 to $12,499 | 16 (9.5%) | 0 (0.0%) |
| $12,500 to $14,999 | 20 (11.8%) | 0 (0.0%) |
| $15,000 to $17,499 | 11 (6.5%) | 24 (7.5%) |
| $17,500 to $19,999 | 11 (6.5%) | 11 (3.5%) |
| $20,000 to $22,499 | 0 (0.0%) | 23 (7.2%) |
| $22,500 to $24,999 | 17 (10.1%) | 9 (2.8%) |
| $25,000 to $29,999 | 13 (7.7%) | 67 (21.1%) |
| $30,000 to $34,999 | 0 (0.0%) | 29 (9.1%) |
| $35,000 to $39,999 | 0 (0.0%) | 14 (4.4%) |
| $40,000 to $44,999 | 12 (7.1%) | 11 (3.5%) |
| $45,000 to $49,999 | 0 (0.0%) | 15 (4.7%) |
| $50,000 to $54,999 | 0 (0.0%) | 0 (0.0%) |
| $55,000 to $64,999 | 0 (0.0%) | 0 (0.0%) |
| $65,000 to $74,999 | 0 (0.0%) | 0 (0.0%) |
| $75,000 to $99,999 | 0 (0.0%) | 0 (0.0%) |
| $100,000+ | 0 (0.0%) | 0 (0.0%) |
| Total | 169 (100.0%) | 318 (100.0%) |
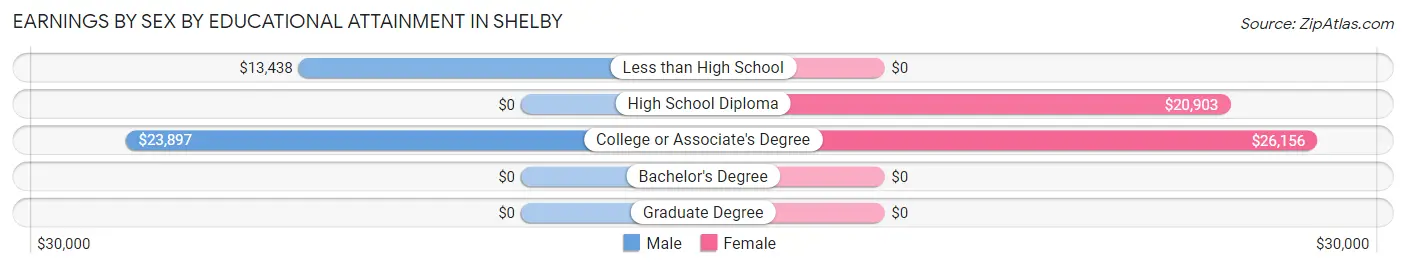
Earnings by Sex by Educational Attainment in Shelby
Average earnings in Shelby are $18,182 for men and $20,978 for women, a difference of 13.3%. Men with an educational attainment of college or associate's degree enjoy the highest average annual earnings of $23,897, while those with less than high school education earn the least with $13,438. Women with an educational attainment of college or associate's degree earn the most with the average annual earnings of $26,156, while those with high school diploma education have the smallest earnings of $20,903.
| Educational Attainment | Male Income | Female Income |
| Less than High School | $13,438 | $0 |
| High School Diploma | - | - |
| College or Associate's Degree | $23,897 | $26,156 |
| Bachelor's Degree | - | - |
| Graduate Degree | - | - |
| Total | $18,182 | $20,978 |
Family Income in Shelby
Family Income Brackets in Shelby
According to the Shelby family income data, there are 169 families falling into the $25,000 to $34,999 income range, which is the most common income bracket and makes up 38.6% of all families.
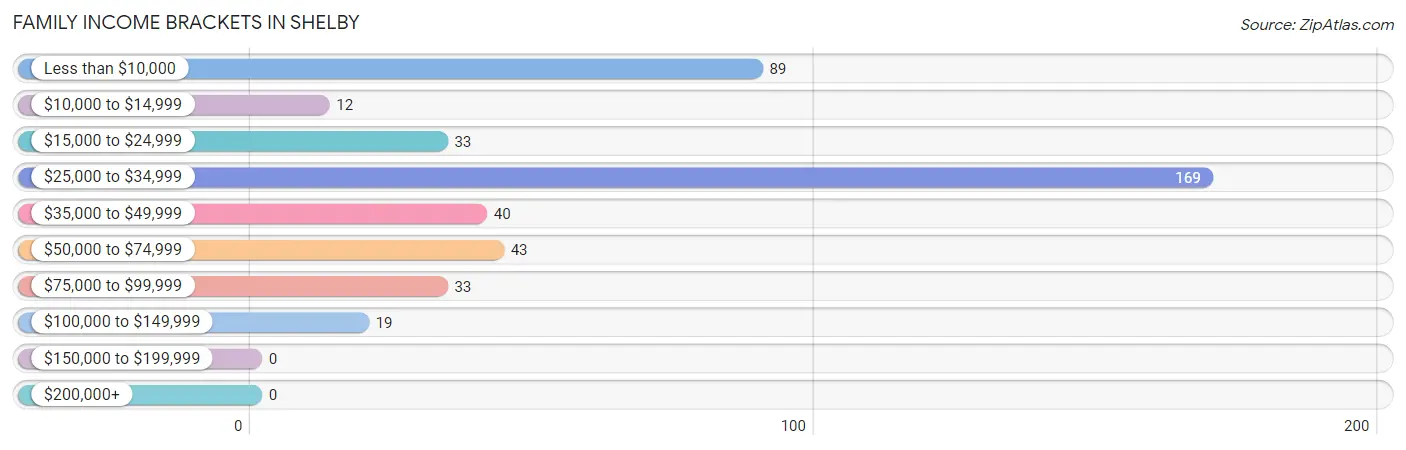
| Income Bracket | # Families | % Families |
| Less than $10,000 | 89 | 20.3% |
| $10,000 to $14,999 | 12 | 2.7% |
| $15,000 to $24,999 | 33 | 7.5% |
| $25,000 to $34,999 | 169 | 38.6% |
| $35,000 to $49,999 | 40 | 9.1% |
| $50,000 to $74,999 | 43 | 9.8% |
| $75,000 to $99,999 | 33 | 7.5% |
| $100,000 to $149,999 | 19 | 4.3% |
| $150,000 to $199,999 | 0 | 0.0% |
| $200,000+ | 0 | 0.0% |
Family Income by Famaliy Size in Shelby
2-person families (290 | 66.2%) account for the highest median family income in Shelby with $29,069 per family, while 2-person families (290 | 66.2%) have the highest median income of $14,534 per family member.
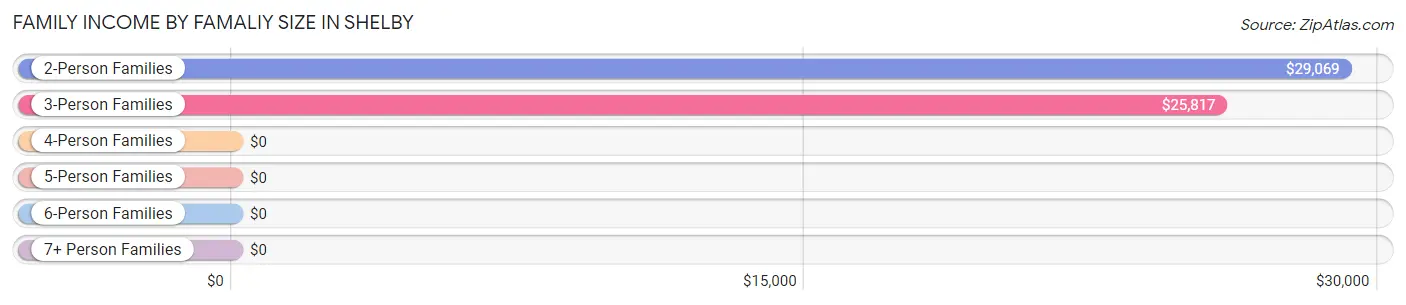
| Income Bracket | # Families | Median Income |
| 2-Person Families | 290 (66.2%) | $29,069 |
| 3-Person Families | 71 (16.2%) | $25,817 |
| 4-Person Families | 29 (6.6%) | $0 |
| 5-Person Families | 31 (7.1%) | $0 |
| 6-Person Families | 17 (3.9%) | $0 |
| 7+ Person Families | 0 (0.0%) | $0 |
| Total | 438 (100.0%) | $28,487 |
Family Income by Number of Earners in Shelby
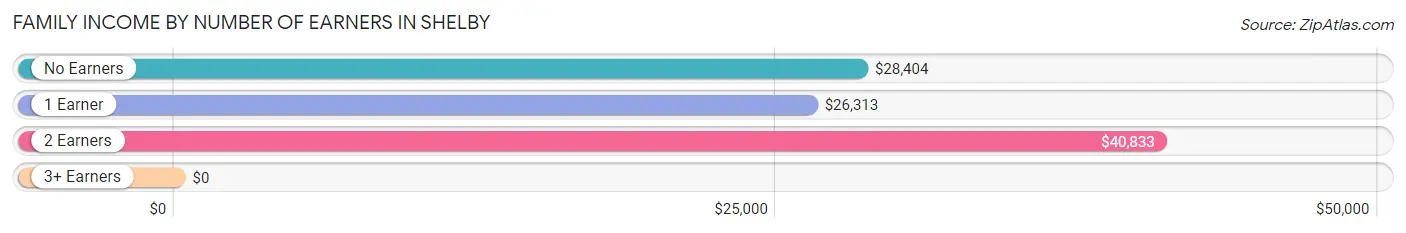
| Number of Earners | # Families | Median Income |
| No Earners | 162 (37.0%) | $28,404 |
| 1 Earner | 192 (43.8%) | $26,313 |
| 2 Earners | 84 (19.2%) | $40,833 |
| 3+ Earners | 0 (0.0%) | $0 |
| Total | 438 (100.0%) | $28,487 |
Household Income in Shelby
Household Income Brackets in Shelby
With 177 households falling in the category, the $25,000 to $34,999 income range is the most frequent in Shelby, accounting for 24.7% of all households.
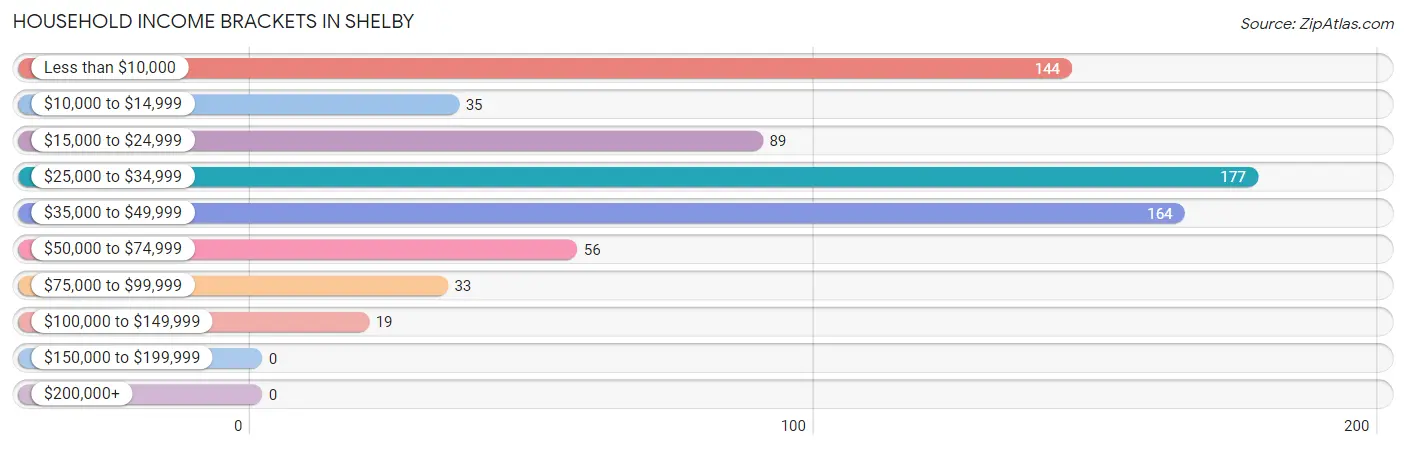
| Income Bracket | # Households | % Households |
| Less than $10,000 | 144 | 20.1% |
| $10,000 to $14,999 | 35 | 4.9% |
| $15,000 to $24,999 | 89 | 12.4% |
| $25,000 to $34,999 | 177 | 24.7% |
| $35,000 to $49,999 | 164 | 22.9% |
| $50,000 to $74,999 | 56 | 7.8% |
| $75,000 to $99,999 | 33 | 4.6% |
| $100,000 to $149,999 | 19 | 2.6% |
| $150,000 to $199,999 | 0 | 0.0% |
| $200,000+ | 0 | 0.0% |
Household Income by Householder Age in Shelby
The median household income in Shelby is $28,827, with the highest median household income of $37,153 found in the 65+ years age bracket for the primary householder. A total of 231 households (32.2%) fall into this category.
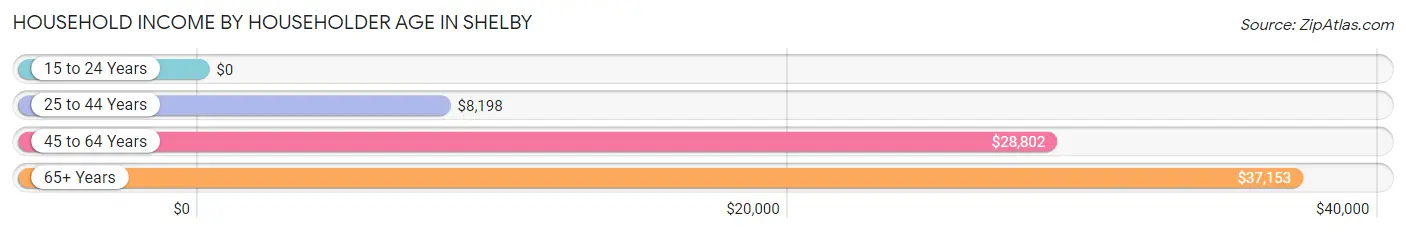
| Income Bracket | # Households | Median Income |
| 15 to 24 Years | 0 (0.0%) | $0 |
| 25 to 44 Years | 186 (25.9%) | $8,198 |
| 45 to 64 Years | 300 (41.8%) | $28,802 |
| 65+ Years | 231 (32.2%) | $37,153 |
| Total | 717 (100.0%) | $28,827 |
Poverty in Shelby
Income Below Poverty by Sex and Age in Shelby
With 56.6% poverty level for males and 41.6% for females among the residents of Shelby, 5 year old males and 6 to 11 year old females are the most vulnerable to poverty, with 7 males (100.0%) and 23 females (100.0%) in their respective age groups living below the poverty level.
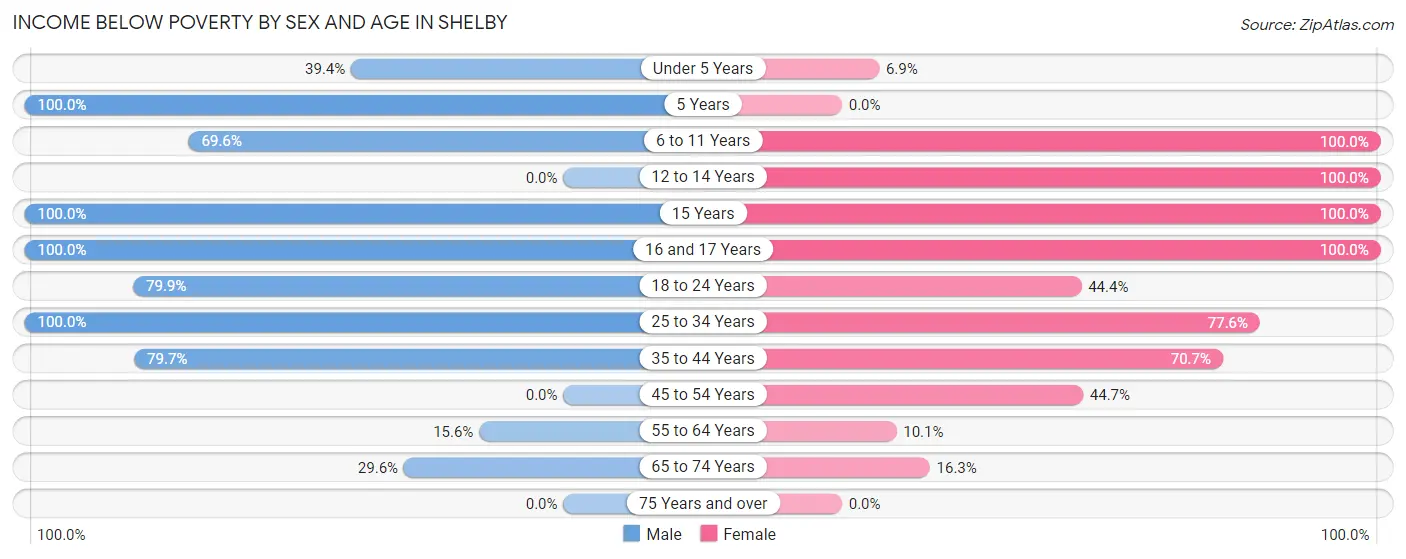
| Age Bracket | Male | Female |
| Under 5 Years | 13 (39.4%) | 4 (6.9%) |
| 5 Years | 7 (100.0%) | 0 (0.0%) |
| 6 to 11 Years | 48 (69.6%) | 23 (100.0%) |
| 12 to 14 Years | 0 (0.0%) | 28 (100.0%) |
| 15 Years | 6 (100.0%) | 12 (100.0%) |
| 16 and 17 Years | 43 (100.0%) | 34 (100.0%) |
| 18 to 24 Years | 127 (79.9%) | 28 (44.4%) |
| 25 to 34 Years | 87 (100.0%) | 90 (77.6%) |
| 35 to 44 Years | 47 (79.7%) | 70 (70.7%) |
| 45 to 54 Years | 0 (0.0%) | 68 (44.7%) |
| 55 to 64 Years | 20 (15.6%) | 17 (10.1%) |
| 65 to 74 Years | 29 (29.6%) | 15 (16.3%) |
| 75 Years and over | 0 (0.0%) | 0 (0.0%) |
| Total | 427 (56.6%) | 389 (41.6%) |
Income Above Poverty by Sex and Age in Shelby
According to the poverty statistics in Shelby, males aged 45 to 54 years and females aged 5 years are the age groups that are most secure financially, with 100.0% of males and 100.0% of females in these age groups living above the poverty line.
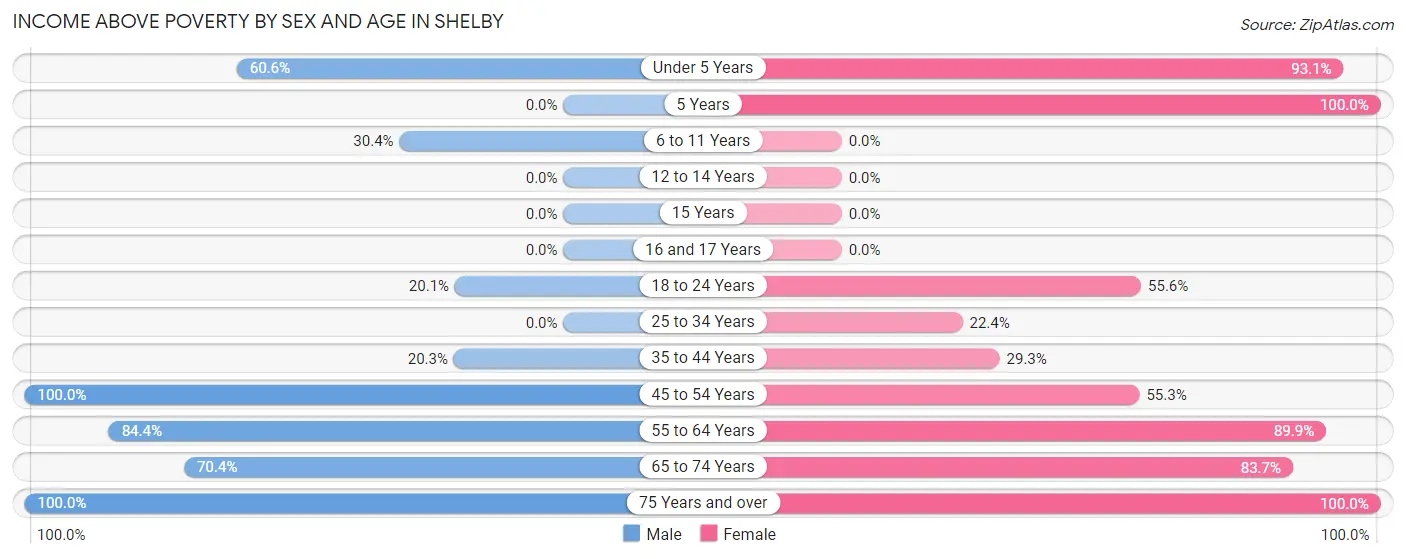
| Age Bracket | Male | Female |
| Under 5 Years | 20 (60.6%) | 54 (93.1%) |
| 5 Years | 0 (0.0%) | 25 (100.0%) |
| 6 to 11 Years | 21 (30.4%) | 0 (0.0%) |
| 12 to 14 Years | 0 (0.0%) | 0 (0.0%) |
| 15 Years | 0 (0.0%) | 0 (0.0%) |
| 16 and 17 Years | 0 (0.0%) | 0 (0.0%) |
| 18 to 24 Years | 32 (20.1%) | 35 (55.6%) |
| 25 to 34 Years | 0 (0.0%) | 26 (22.4%) |
| 35 to 44 Years | 12 (20.3%) | 29 (29.3%) |
| 45 to 54 Years | 37 (100.0%) | 84 (55.3%) |
| 55 to 64 Years | 108 (84.4%) | 151 (89.9%) |
| 65 to 74 Years | 69 (70.4%) | 77 (83.7%) |
| 75 Years and over | 28 (100.0%) | 66 (100.0%) |
| Total | 327 (43.4%) | 547 (58.4%) |
Income Below Poverty Among Married-Couple Families in Shelby
The poverty statistics for married-couple families in Shelby show that 23.3% or 48 of the total 206 families live below the poverty line. Families with 1 or 2 children have the highest poverty rate of 100.0%, comprising of 48 families. On the other hand, families with no children have the lowest poverty rate of 0.0%, which includes 0 families.
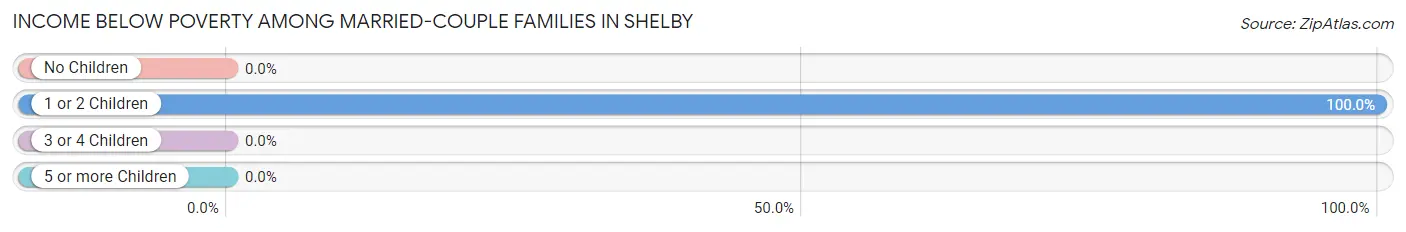
| Children | Above Poverty | Below Poverty |
| No Children | 158 (100.0%) | 0 (0.0%) |
| 1 or 2 Children | 0 (0.0%) | 48 (100.0%) |
| 3 or 4 Children | 0 (0.0%) | 0 (0.0%) |
| 5 or more Children | 0 (0.0%) | 0 (0.0%) |
| Total | 158 (76.7%) | 48 (23.3%) |
Income Below Poverty Among Single-Parent Households in Shelby
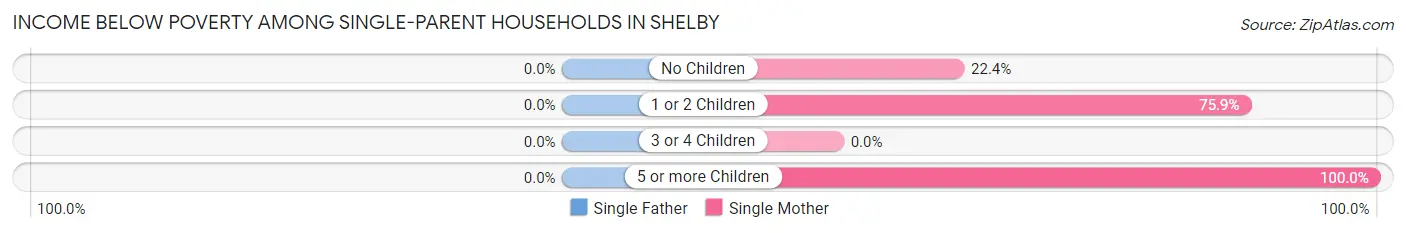
| Children | Single Father | Single Mother |
| No Children | 0 (0.0%) | 24 (22.4%) |
| 1 or 2 Children | 0 (0.0%) | 82 (75.9%) |
| 3 or 4 Children | 0 (0.0%) | 0 (0.0%) |
| 5 or more Children | 0 (0.0%) | 6 (100.0%) |
| Total | 0 (0.0%) | 112 (48.3%) |
Income Below Poverty Among Married-Couple vs Single-Parent Households in Shelby
The poverty data for Shelby shows that 48 of the married-couple family households (23.3%) and 112 of the single-parent households (48.3%) are living below the poverty level. Within the married-couple family households, those with 1 or 2 children have the highest poverty rate, with 48 households (100.0%) falling below the poverty line. Among the single-parent households, those with 5 or more children have the highest poverty rate, with 6 household (100.0%) living below poverty.
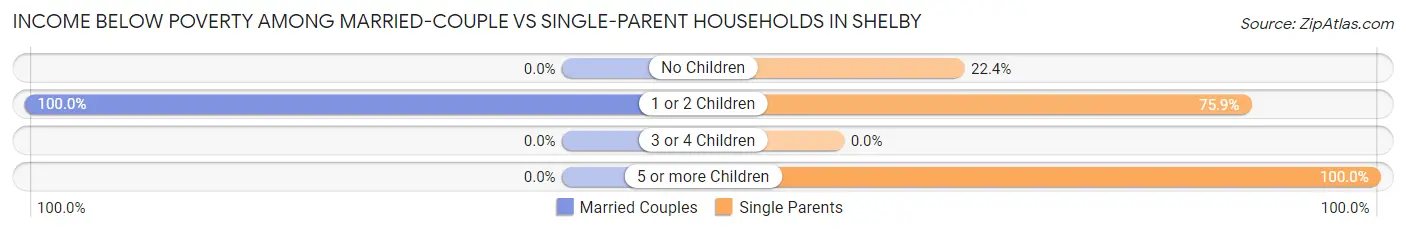
| Children | Married-Couple Families | Single-Parent Households |
| No Children | 0 (0.0%) | 24 (22.4%) |
| 1 or 2 Children | 48 (100.0%) | 82 (75.9%) |
| 3 or 4 Children | 0 (0.0%) | 0 (0.0%) |
| 5 or more Children | 0 (0.0%) | 6 (100.0%) |
| Total | 48 (23.3%) | 112 (48.3%) |
Race in Shelby
The most populous races in Shelby are Black / African American (1,700 | 97.1%), White / Caucasian (27 | 1.5%), and Two or more Races (24 | 1.4%).
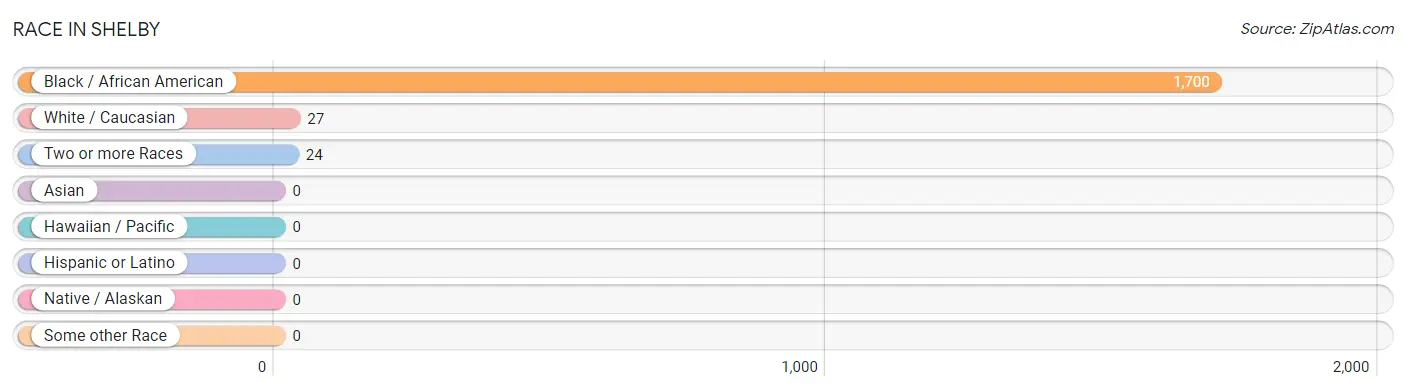
| Race | # Population | % Population |
| Asian | 0 | 0.0% |
| Black / African American | 1,700 | 97.1% |
| Hawaiian / Pacific | 0 | 0.0% |
| Hispanic or Latino | 0 | 0.0% |
| Native / Alaskan | 0 | 0.0% |
| White / Caucasian | 27 | 1.5% |
| Two or more Races | 24 | 1.4% |
| Some other Race | 0 | 0.0% |
| Total | 1,751 | 100.0% |
Ancestry in Shelby
The most populous ancestries reported in Shelby are American (31 | 1.8%), African (29 | 1.7%), Subsaharan African (29 | 1.7%), and Italian (16 | 0.9%), together accounting for 6.0% of all Shelby residents.
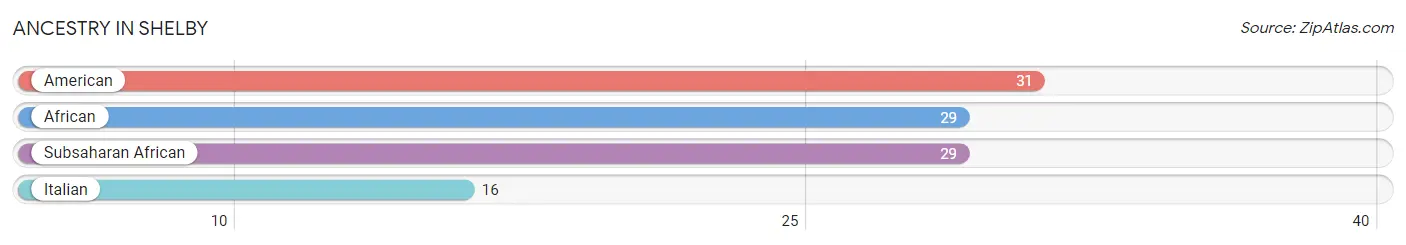
| Ancestry | # Population | % Population |
| African | 29 | 1.7% |
| American | 31 | 1.8% |
| Italian | 16 | 0.9% |
| Subsaharan African | 29 | 1.7% | View All 4 Rows |
Immigrants in Shelby

| Immigration Origin | # Population | % Population | View All 0 Rows |
Sex and Age in Shelby
Sex and Age in Shelby
The most populous age groups in Shelby are 20 to 24 Years (132 | 16.9%) for men and 60 to 64 Years (180 | 18.5%) for women.
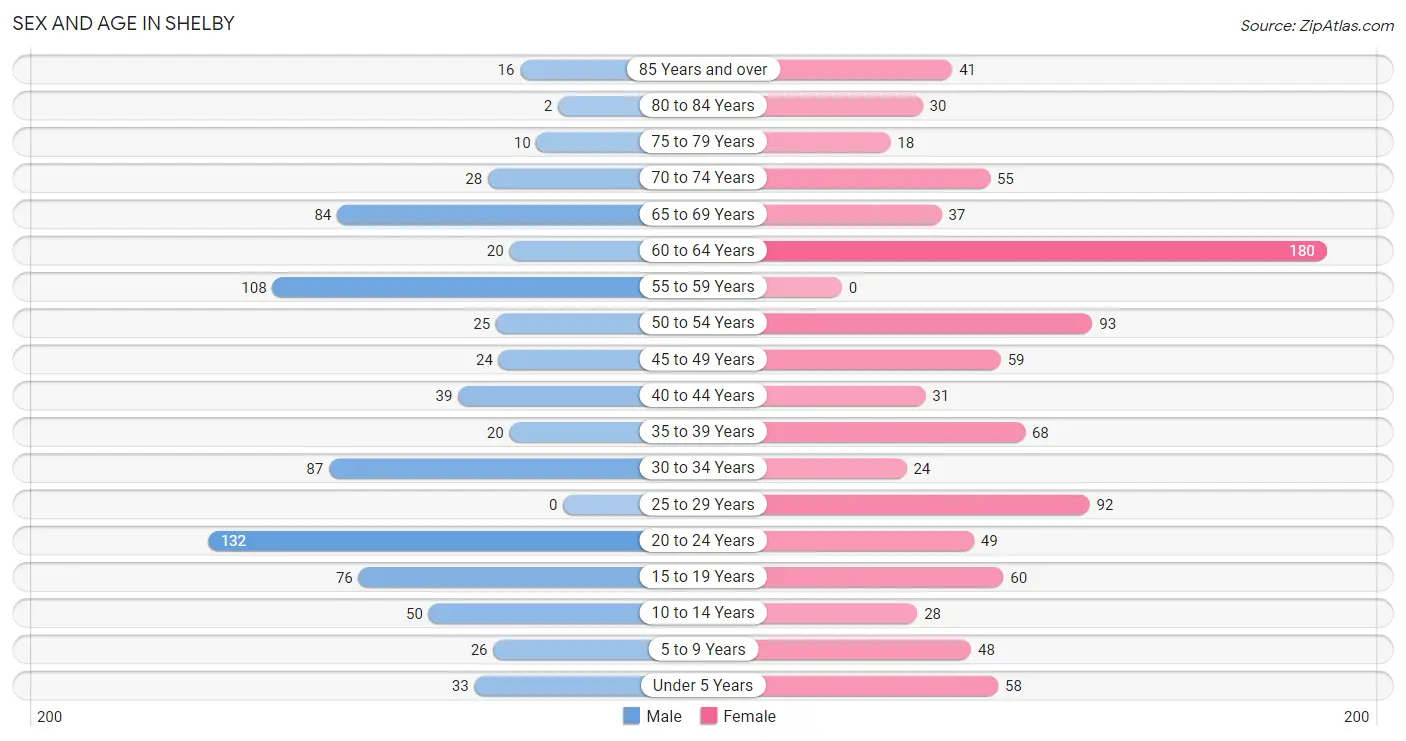
| Age Bracket | Male | Female |
| Under 5 Years | 33 (4.2%) | 58 (6.0%) |
| 5 to 9 Years | 26 (3.3%) | 48 (4.9%) |
| 10 to 14 Years | 50 (6.4%) | 28 (2.9%) |
| 15 to 19 Years | 76 (9.7%) | 60 (6.2%) |
| 20 to 24 Years | 132 (16.9%) | 49 (5.1%) |
| 25 to 29 Years | 0 (0.0%) | 92 (9.5%) |
| 30 to 34 Years | 87 (11.2%) | 24 (2.5%) |
| 35 to 39 Years | 20 (2.6%) | 68 (7.0%) |
| 40 to 44 Years | 39 (5.0%) | 31 (3.2%) |
| 45 to 49 Years | 24 (3.1%) | 59 (6.1%) |
| 50 to 54 Years | 25 (3.2%) | 93 (9.6%) |
| 55 to 59 Years | 108 (13.9%) | 0 (0.0%) |
| 60 to 64 Years | 20 (2.6%) | 180 (18.5%) |
| 65 to 69 Years | 84 (10.8%) | 37 (3.8%) |
| 70 to 74 Years | 28 (3.6%) | 55 (5.7%) |
| 75 to 79 Years | 10 (1.3%) | 18 (1.8%) |
| 80 to 84 Years | 2 (0.3%) | 30 (3.1%) |
| 85 Years and over | 16 (2.1%) | 41 (4.2%) |
| Total | 780 (100.0%) | 971 (100.0%) |
Families and Households in Shelby
Median Family Size in Shelby
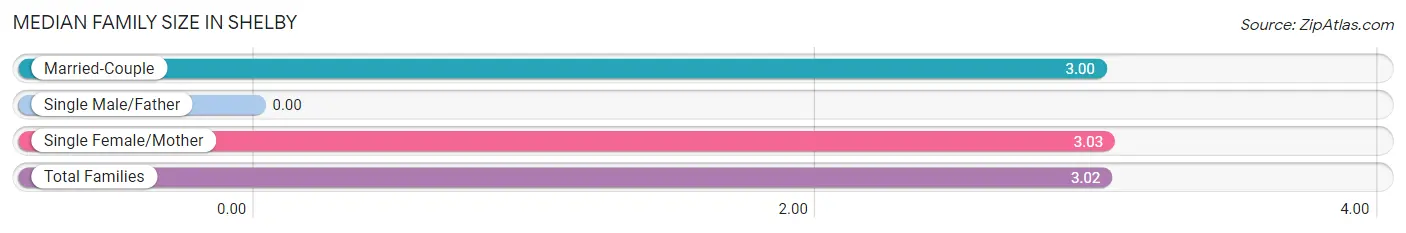
| Family Type | # Families | Family Size |
| Married-Couple | 206 (47.0%) | 3.00 |
| Single Male/Father | 0 (0.0%) | - |
| Single Female/Mother | 232 (53.0%) | 3.03 |
| Total Families | 438 (100.0%) | 3.02 |
Median Household Size in Shelby
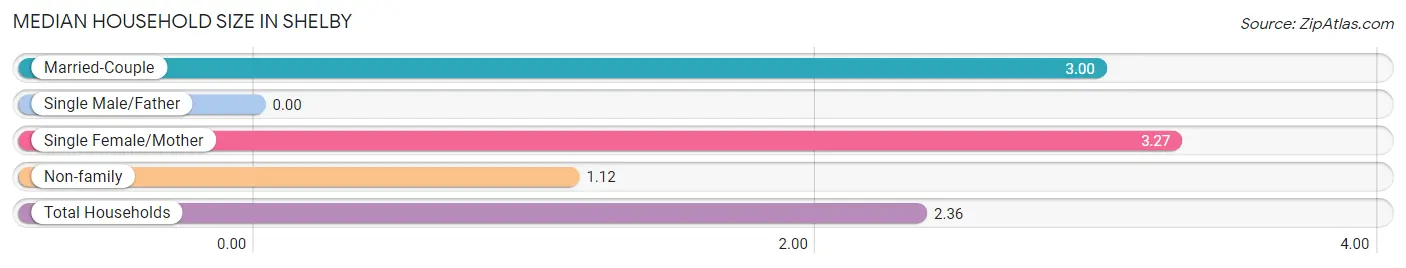
| Household Type | # Households | Household Size |
| Married-Couple | 206 (28.7%) | 3.00 |
| Single Male/Father | 0 (0.0%) | - |
| Single Female/Mother | 232 (32.4%) | 3.27 |
| Non-family | 279 (38.9%) | 1.12 |
| Total Households | 717 (100.0%) | 2.36 |
Household Size by Marriage Status in Shelby
Out of a total of 717 households in Shelby, 438 (61.1%) are family households, while 279 (38.9%) are nonfamily households. The most numerous type of family households are 2-person households, comprising 277, and the most common type of nonfamily households are 1-person households, comprising 243.
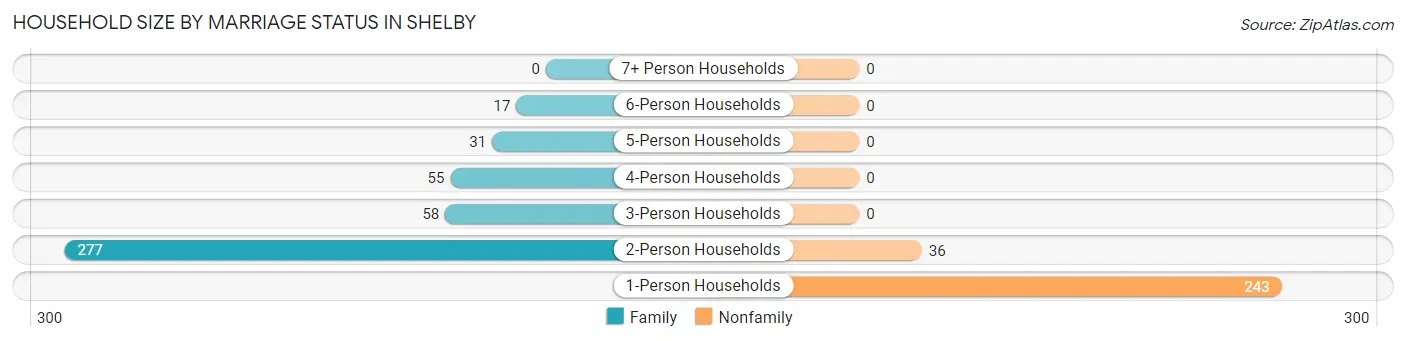
| Household Size | Family Households | Nonfamily Households |
| 1-Person Households | - | 243 (33.9%) |
| 2-Person Households | 277 (38.6%) | 36 (5.0%) |
| 3-Person Households | 58 (8.1%) | 0 (0.0%) |
| 4-Person Households | 55 (7.7%) | 0 (0.0%) |
| 5-Person Households | 31 (4.3%) | 0 (0.0%) |
| 6-Person Households | 17 (2.4%) | 0 (0.0%) |
| 7+ Person Households | 0 (0.0%) | 0 (0.0%) |
| Total | 438 (61.1%) | 279 (38.9%) |
Female Fertility in Shelby
Fertility by Age in Shelby
Average fertility rate in Shelby is 94.0 births per 1,000 women. Women in the age bracket of 20 to 34 years have the highest fertility rate with 182.0 births per 1,000 women. Women in the age bracket of 20 to 34 years acount for 83.3% of all women with births.
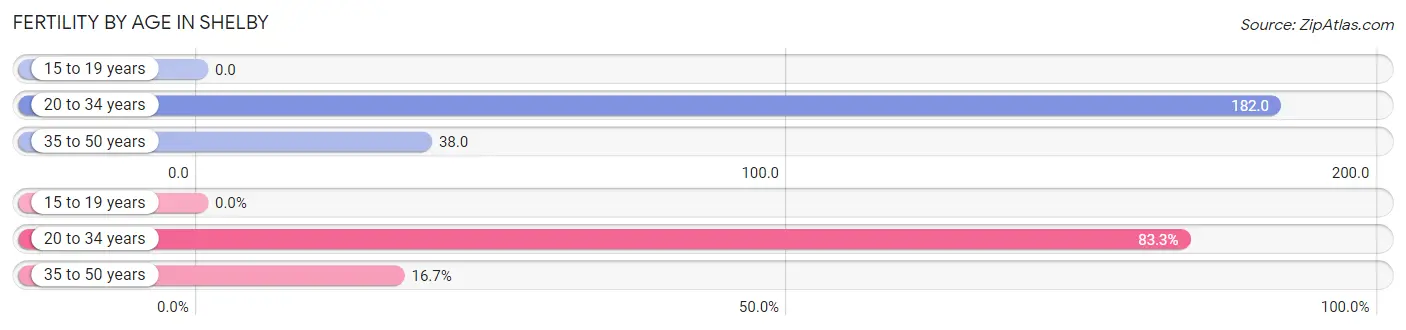
| Age Bracket | Women with Births | Births / 1,000 Women |
| 15 to 19 years | 0 (0.0%) | 0.0 |
| 20 to 34 years | 30 (83.3%) | 182.0 |
| 35 to 50 years | 6 (16.7%) | 38.0 |
| Total | 36 (100.0%) | 94.0 |
Fertility by Age by Marriage Status in Shelby
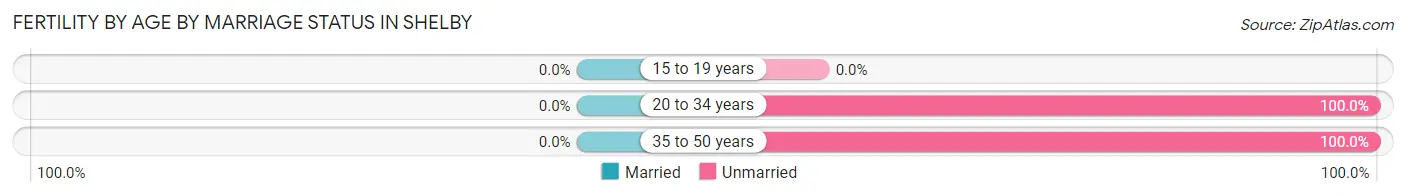
| Age Bracket | Married | Unmarried |
| 15 to 19 years | 0 (0.0%) | 0 (0.0%) |
| 20 to 34 years | 0 (0.0%) | 30 (100.0%) |
| 35 to 50 years | 0 (0.0%) | 6 (100.0%) |
| Total | 0 (0.0%) | 36 (100.0%) |
Fertility by Education in Shelby
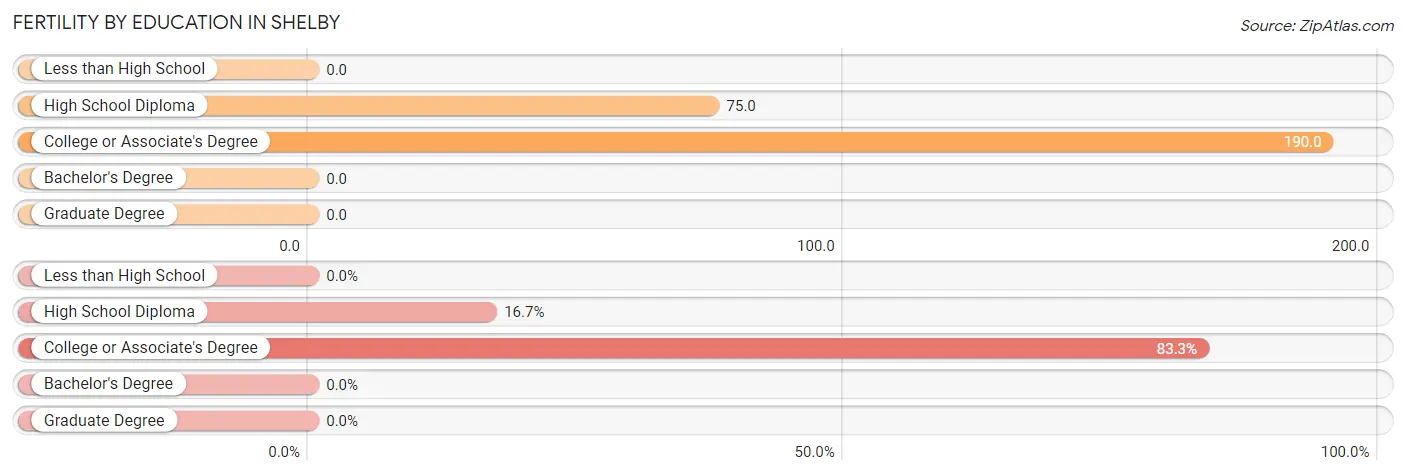
| Educational Attainment | Women with Births | Births / 1,000 Women |
| Less than High School | 0 (0.0%) | 0.0 |
| High School Diploma | 6 (16.7%) | 75.0 |
| College or Associate's Degree | 30 (83.3%) | 190.0 |
| Bachelor's Degree | 0 (0.0%) | 0.0 |
| Graduate Degree | 0 (0.0%) | 0.0 |
| Total | 36 (100.0%) | 94.0 |
Fertility by Education by Marriage Status in Shelby
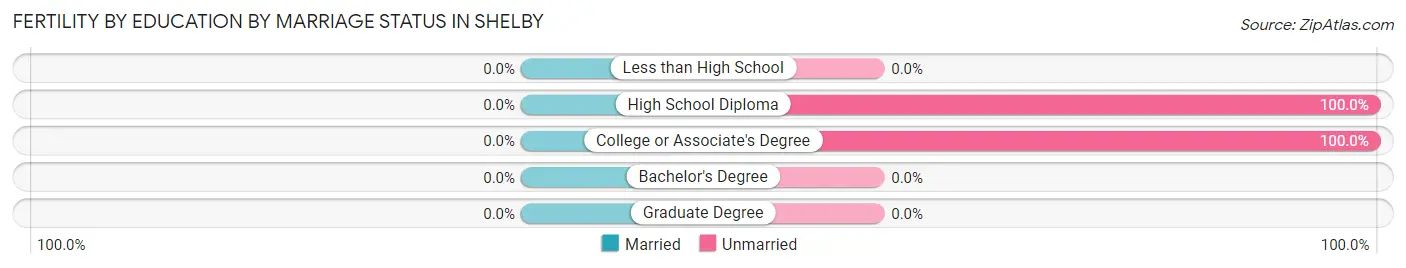
| Educational Attainment | Married | Unmarried |
| Less than High School | 0 (0.0%) | 0 (0.0%) |
| High School Diploma | 0 (0.0%) | 6 (100.0%) |
| College or Associate's Degree | 0 (0.0%) | 30 (100.0%) |
| Bachelor's Degree | 0 (0.0%) | 0 (0.0%) |
| Graduate Degree | 0 (0.0%) | 0 (0.0%) |
| Total | 0 (0.0%) | 36 (100.0%) |
Employment Characteristics in Shelby
Employment by Class of Employer in Shelby
Among the 344 employed individuals in Shelby, state government employees (139 | 40.4%), private company employees (131 | 38.1%), and federal government employees (31 | 9.0%) make up the most common classes of employment.
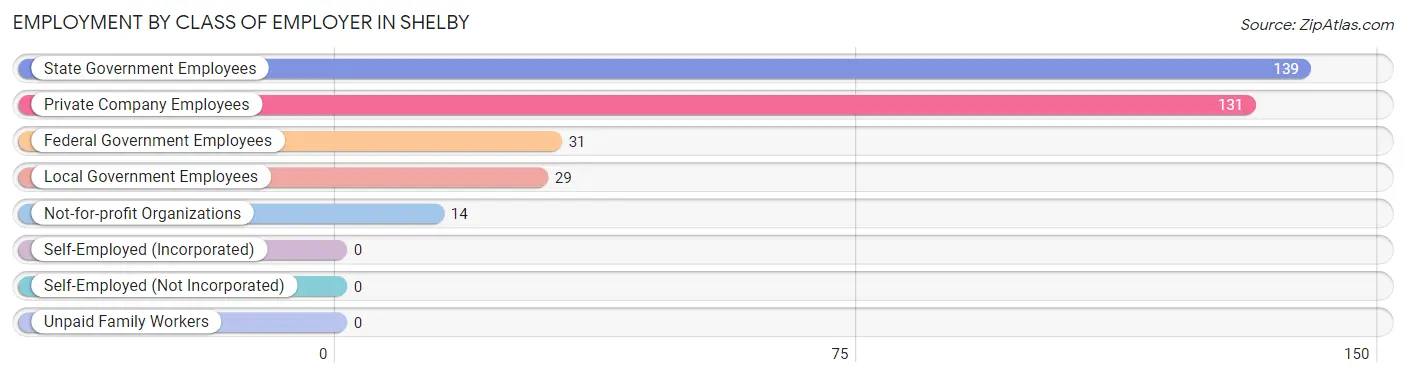
| Employer Class | # Employees | % Employees |
| Private Company Employees | 131 | 38.1% |
| Self-Employed (Incorporated) | 0 | 0.0% |
| Self-Employed (Not Incorporated) | 0 | 0.0% |
| Not-for-profit Organizations | 14 | 4.1% |
| Local Government Employees | 29 | 8.4% |
| State Government Employees | 139 | 40.4% |
| Federal Government Employees | 31 | 9.0% |
| Unpaid Family Workers | 0 | 0.0% |
| Total | 344 | 100.0% |
Employment Status by Age in Shelby
According to the labor force statistics for Shelby, out of the total population over 16 years of age (1,490), 27.4% or 408 individuals are in the labor force, with 16.8% or 69 of them unemployed. The age group with the highest labor force participation rate is 45 to 54 years, with 45.3% or 91 individuals in the labor force. Within the labor force, the 20 to 24 years age range has the highest percentage of unemployed individuals, with 100.0% or 61 of them being unemployed.
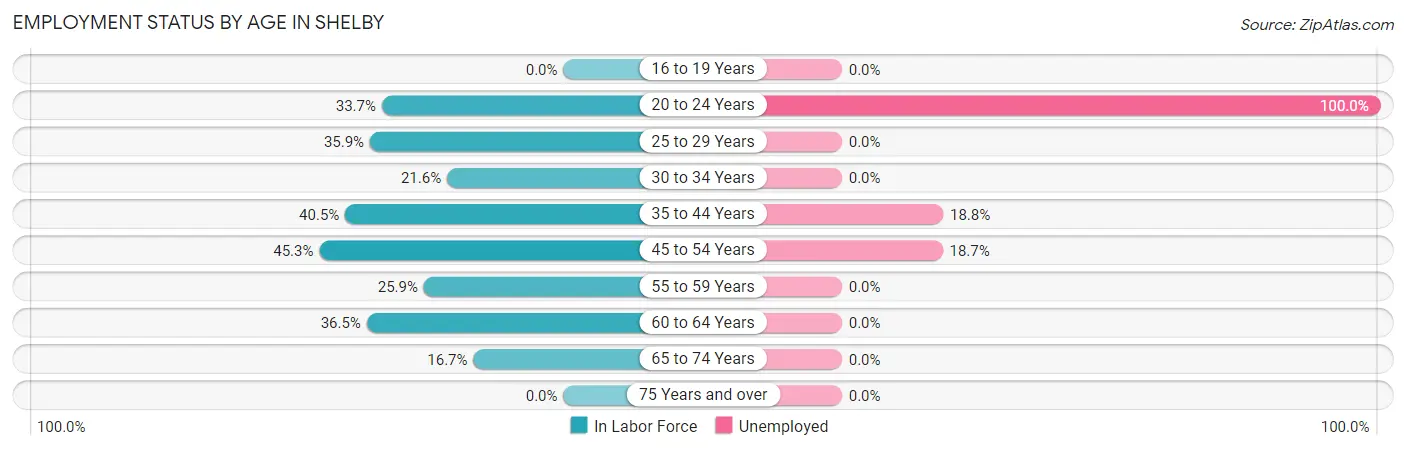
| Age Bracket | In Labor Force | Unemployed |
| 16 to 19 Years | 0 (0.0%) | 0 (0.0%) |
| 20 to 24 Years | 61 (33.7%) | 61 (100.0%) |
| 25 to 29 Years | 33 (35.9%) | 0 (0.0%) |
| 30 to 34 Years | 24 (21.6%) | 0 (0.0%) |
| 35 to 44 Years | 64 (40.5%) | 12 (18.8%) |
| 45 to 54 Years | 91 (45.3%) | 17 (18.7%) |
| 55 to 59 Years | 28 (25.9%) | 0 (0.0%) |
| 60 to 64 Years | 73 (36.5%) | 0 (0.0%) |
| 65 to 74 Years | 34 (16.7%) | 0 (0.0%) |
| 75 Years and over | 0 (0.0%) | 0 (0.0%) |
| Total | 408 (27.4%) | 69 (16.8%) |
Employment Status by Educational Attainment in Shelby
According to labor force statistics for Shelby, 36.0% of individuals (313) out of the total population between 25 and 64 years of age (870) are in the labor force, with 9.3% or 29 of them being unemployed. The group with the highest labor force participation rate are those with the educational attainment of bachelor's degree or higher, with 62.6% or 67 individuals in the labor force. Within the labor force, individuals with less than high school education have the highest percentage of unemployment, with 22.2% or 12 of them being unemployed.
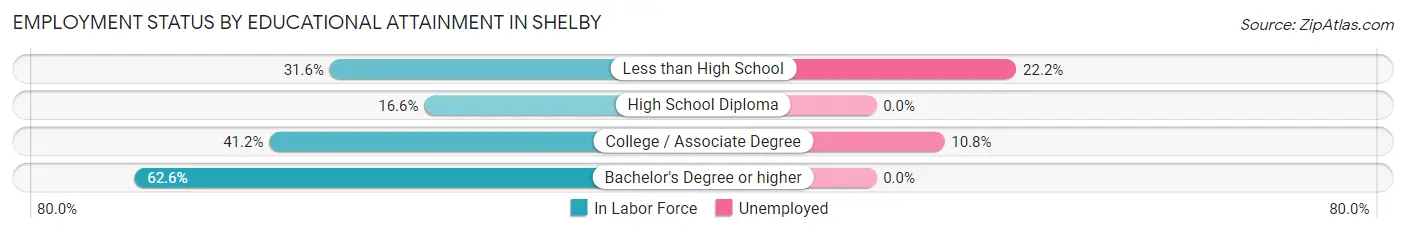
| Educational Attainment | In Labor Force | Unemployed |
| Less than High School | 54 (31.6%) | 38 (22.2%) |
| High School Diploma | 35 (16.6%) | 0 (0.0%) |
| College / Associate Degree | 157 (41.2%) | 41 (10.8%) |
| Bachelor's Degree or higher | 67 (62.6%) | 0 (0.0%) |
| Total | 313 (36.0%) | 81 (9.3%) |
Employment Occupations by Sex in Shelby
Management, Business, Science and Arts Occupations
The most common Management, Business, Science and Arts occupations in Shelby are Community & Social Service (78 | 24.5%), Education Instruction & Library (78 | 24.5%), Health Diagnosing & Treating (29 | 9.1%), and Management (11 | 3.5%).
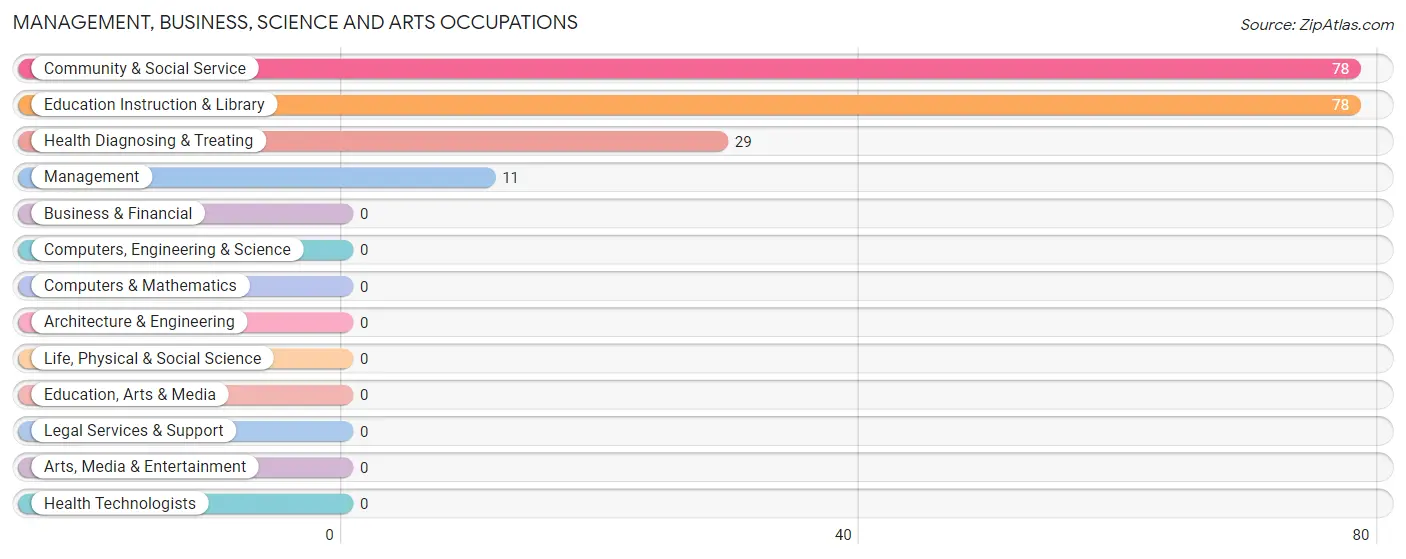
Management, Business, Science and Arts Occupations by Sex
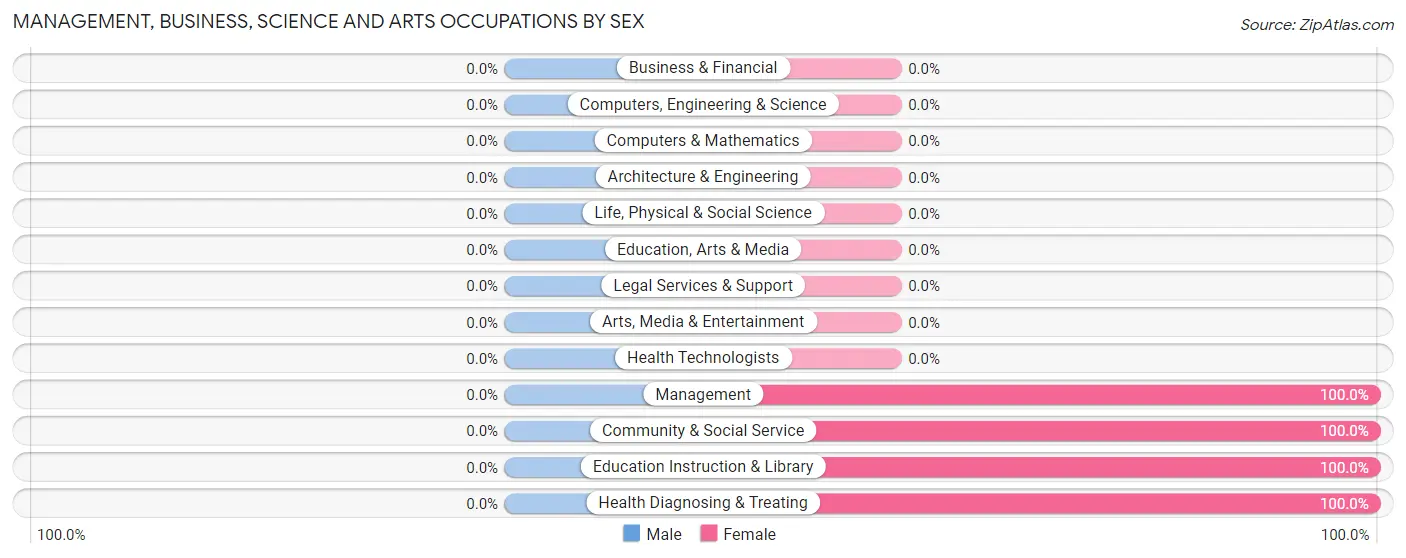
| Occupation | Male | Female |
| Management | 0 (0.0%) | 11 (100.0%) |
| Business & Financial | 0 (0.0%) | 0 (0.0%) |
| Computers, Engineering & Science | 0 (0.0%) | 0 (0.0%) |
| Computers & Mathematics | 0 (0.0%) | 0 (0.0%) |
| Architecture & Engineering | 0 (0.0%) | 0 (0.0%) |
| Life, Physical & Social Science | 0 (0.0%) | 0 (0.0%) |
| Community & Social Service | 0 (0.0%) | 78 (100.0%) |
| Education, Arts & Media | 0 (0.0%) | 0 (0.0%) |
| Legal Services & Support | 0 (0.0%) | 0 (0.0%) |
| Education Instruction & Library | 0 (0.0%) | 78 (100.0%) |
| Arts, Media & Entertainment | 0 (0.0%) | 0 (0.0%) |
| Health Diagnosing & Treating | 0 (0.0%) | 29 (100.0%) |
| Health Technologists | 0 (0.0%) | 0 (0.0%) |
| Total (Category) | 0 (0.0%) | 118 (100.0%) |
| Total (Overall) | 100 (31.5%) | 218 (68.5%) |
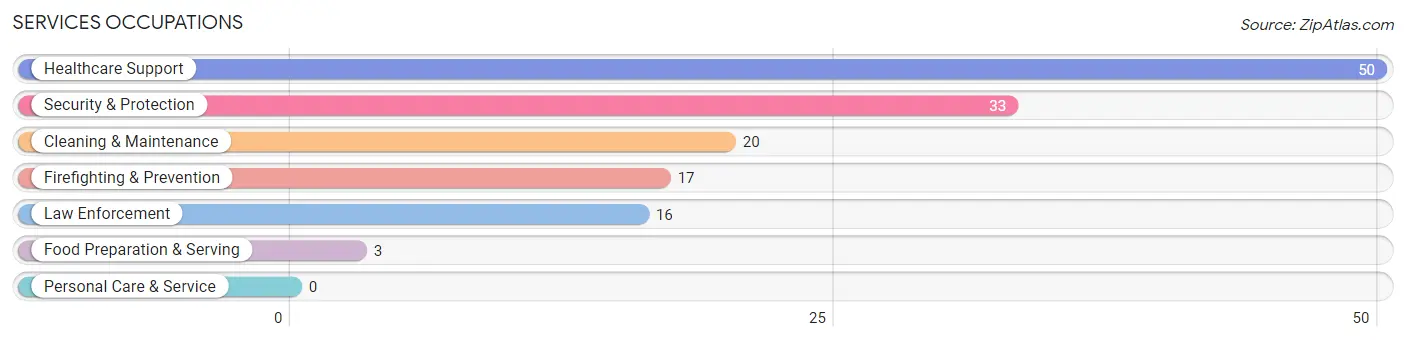
Services Occupations
The most common Services occupations in Shelby are Healthcare Support (50 | 15.7%), Security & Protection (33 | 10.4%), Cleaning & Maintenance (20 | 6.3%), Firefighting & Prevention (17 | 5.3%), and Law Enforcement (16 | 5.0%).
Services Occupations by Sex
Within the Services occupations in Shelby, the most male-oriented occupations are Security & Protection (100.0%), Firefighting & Prevention (100.0%), and Law Enforcement (100.0%), while the most female-oriented occupations are Food Preparation & Serving (100.0%), Healthcare Support (78.0%), and Cleaning & Maintenance (45.0%).
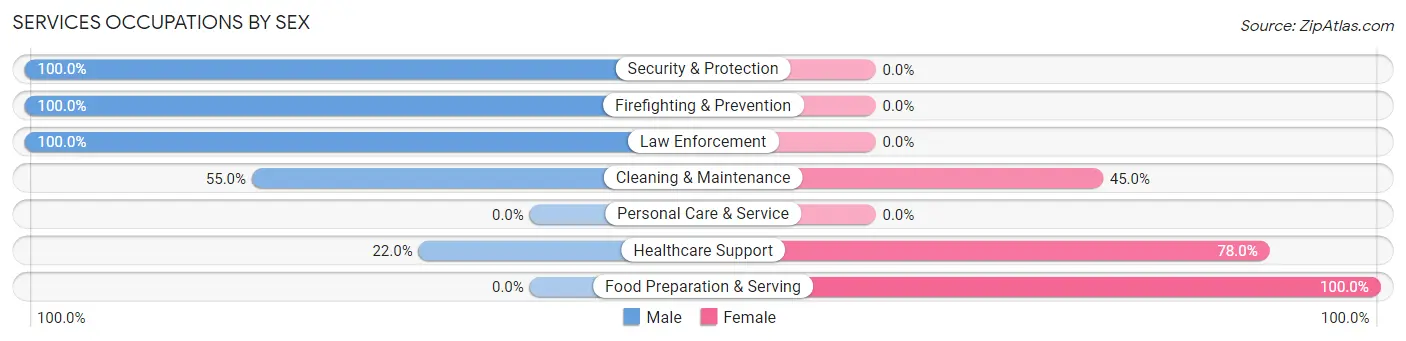
| Occupation | Male | Female |
| Healthcare Support | 11 (22.0%) | 39 (78.0%) |
| Security & Protection | 33 (100.0%) | 0 (0.0%) |
| Firefighting & Prevention | 17 (100.0%) | 0 (0.0%) |
| Law Enforcement | 16 (100.0%) | 0 (0.0%) |
| Food Preparation & Serving | 0 (0.0%) | 3 (100.0%) |
| Cleaning & Maintenance | 11 (55.0%) | 9 (45.0%) |
| Personal Care & Service | 0 (0.0%) | 0 (0.0%) |
| Total (Category) | 55 (51.9%) | 51 (48.1%) |
| Total (Overall) | 100 (31.5%) | 218 (68.5%) |
Sales and Office Occupations
The most common Sales and Office occupations in Shelby are Sales & Related (31 | 9.8%), and Office & Administration (18 | 5.7%).

Sales and Office Occupations by Sex
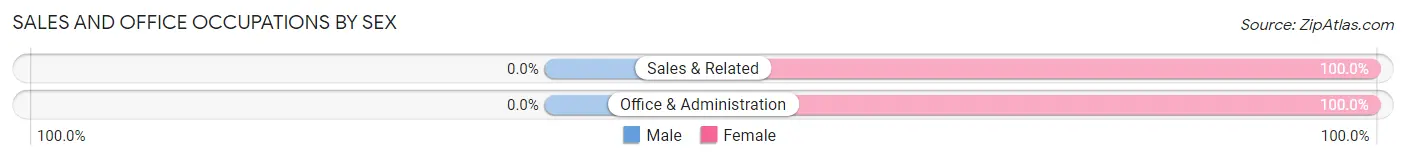
| Occupation | Male | Female |
| Sales & Related | 0 (0.0%) | 31 (100.0%) |
| Office & Administration | 0 (0.0%) | 18 (100.0%) |
| Total (Category) | 0 (0.0%) | 49 (100.0%) |
| Total (Overall) | 100 (31.5%) | 218 (68.5%) |
Natural Resources, Construction and Maintenance Occupations
The most common Natural Resources, Construction and Maintenance occupations in Shelby are Installation, Maintenance & Repair (20 | 6.3%), and Construction & Extraction (13 | 4.1%).
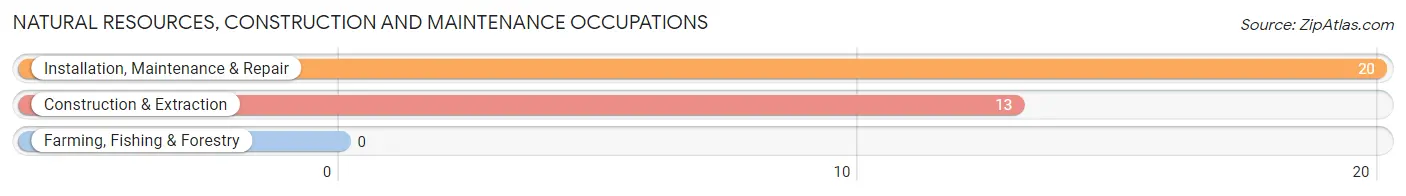
Natural Resources, Construction and Maintenance Occupations by Sex
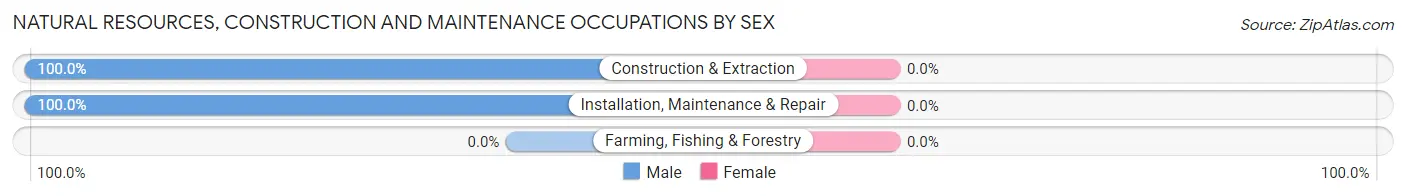
| Occupation | Male | Female |
| Farming, Fishing & Forestry | 0 (0.0%) | 0 (0.0%) |
| Construction & Extraction | 13 (100.0%) | 0 (0.0%) |
| Installation, Maintenance & Repair | 20 (100.0%) | 0 (0.0%) |
| Total (Category) | 33 (100.0%) | 0 (0.0%) |
| Total (Overall) | 100 (31.5%) | 218 (68.5%) |
Production, Transportation and Moving Occupations
The most common Production, Transportation and Moving occupations in Shelby are , and Transportation (12 | 3.8%).
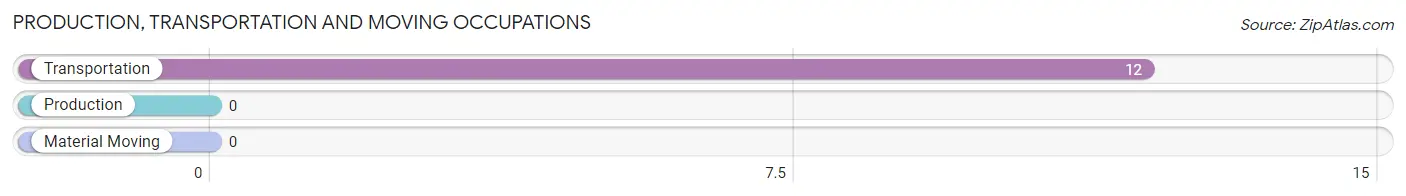
Production, Transportation and Moving Occupations by Sex
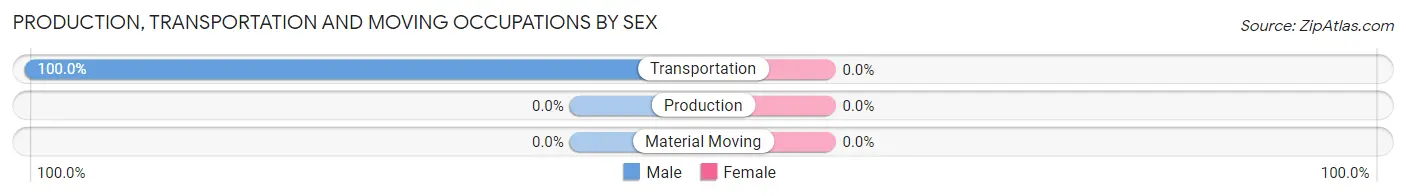
| Occupation | Male | Female |
| Production | 0 (0.0%) | 0 (0.0%) |
| Transportation | 12 (100.0%) | 0 (0.0%) |
| Material Moving | 0 (0.0%) | 0 (0.0%) |
| Total (Category) | 12 (100.0%) | 0 (0.0%) |
| Total (Overall) | 100 (31.5%) | 218 (68.5%) |
Employment Industries by Sex in Shelby
Employment Industries in Shelby
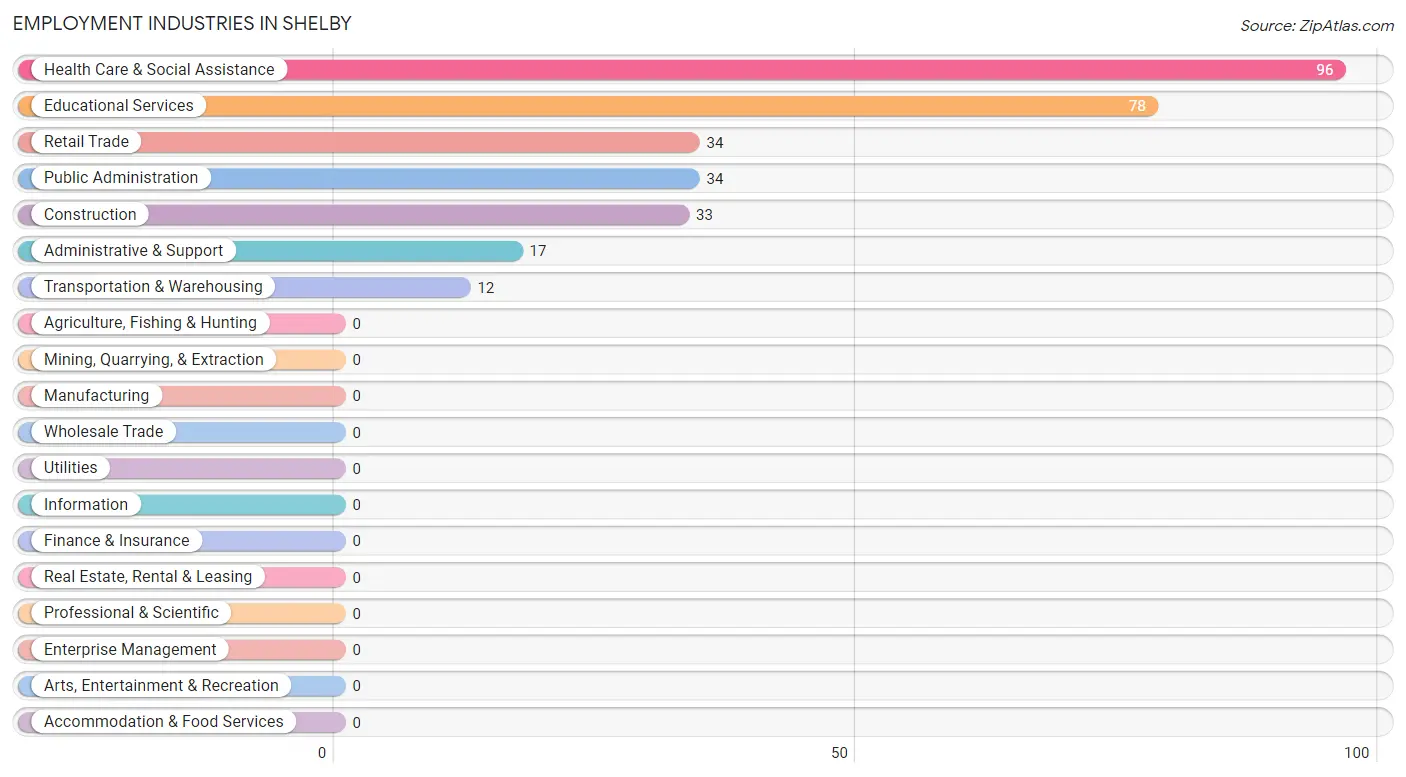
The major employment industries in Shelby include Health Care & Social Assistance (96 | 30.2%), Educational Services (78 | 24.5%), Retail Trade (34 | 10.7%), Public Administration (34 | 10.7%), and Construction (33 | 10.4%).
Employment Industries by Sex in Shelby
The Shelby industries that see more men than women are Construction (100.0%), Transportation & Warehousing (100.0%), and Administrative & Support (100.0%), whereas the industries that tend to have a higher number of women are Retail Trade (100.0%), Health Care & Social Assistance (88.5%), and Educational Services (85.9%).
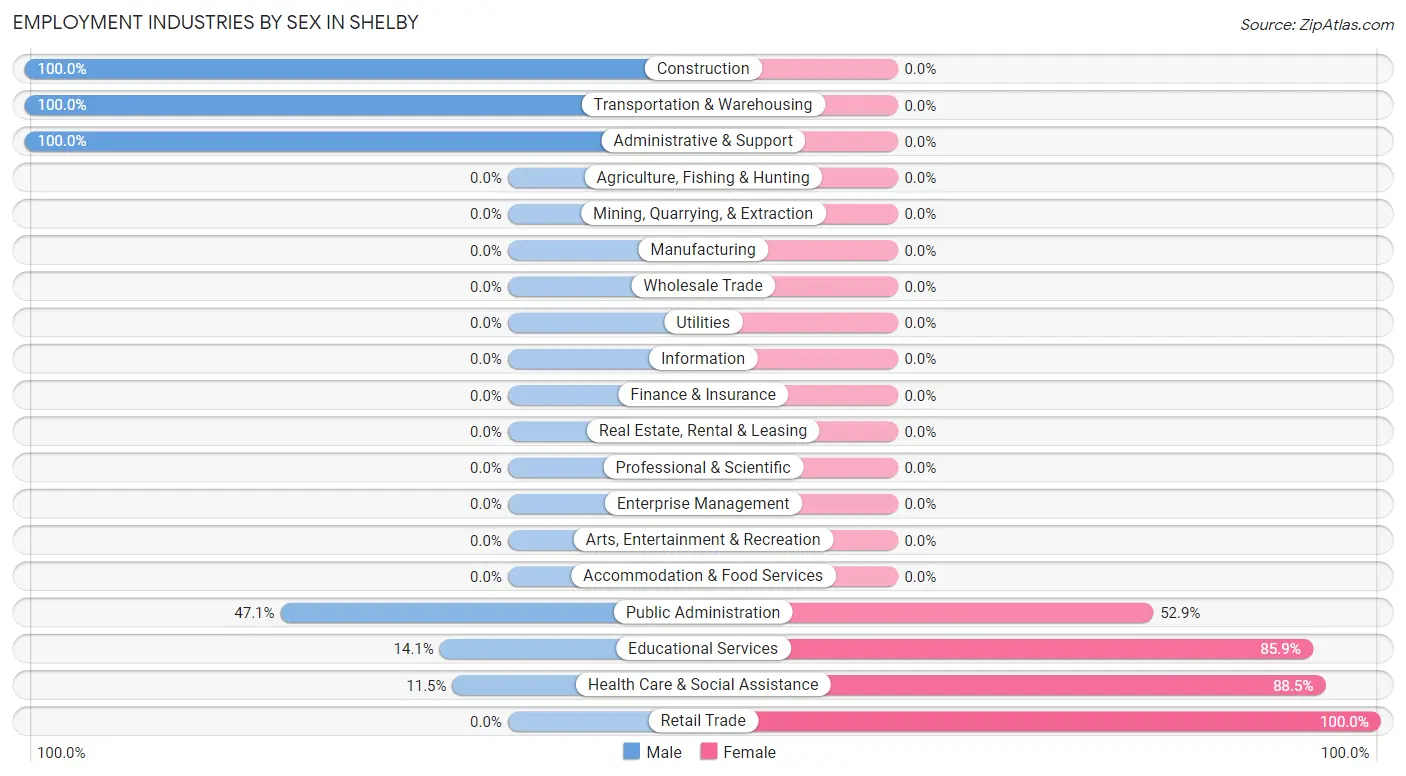
| Industry | Male | Female |
| Agriculture, Fishing & Hunting | 0 (0.0%) | 0 (0.0%) |
| Mining, Quarrying, & Extraction | 0 (0.0%) | 0 (0.0%) |
| Construction | 33 (100.0%) | 0 (0.0%) |
| Manufacturing | 0 (0.0%) | 0 (0.0%) |
| Wholesale Trade | 0 (0.0%) | 0 (0.0%) |
| Retail Trade | 0 (0.0%) | 34 (100.0%) |
| Transportation & Warehousing | 12 (100.0%) | 0 (0.0%) |
| Utilities | 0 (0.0%) | 0 (0.0%) |
| Information | 0 (0.0%) | 0 (0.0%) |
| Finance & Insurance | 0 (0.0%) | 0 (0.0%) |
| Real Estate, Rental & Leasing | 0 (0.0%) | 0 (0.0%) |
| Professional & Scientific | 0 (0.0%) | 0 (0.0%) |
| Enterprise Management | 0 (0.0%) | 0 (0.0%) |
| Administrative & Support | 17 (100.0%) | 0 (0.0%) |
| Educational Services | 11 (14.1%) | 67 (85.9%) |
| Health Care & Social Assistance | 11 (11.5%) | 85 (88.5%) |
| Arts, Entertainment & Recreation | 0 (0.0%) | 0 (0.0%) |
| Accommodation & Food Services | 0 (0.0%) | 0 (0.0%) |
| Public Administration | 16 (47.1%) | 18 (52.9%) |
| Total | 100 (31.5%) | 218 (68.5%) |
Education in Shelby
School Enrollment in Shelby
The most common levels of schooling among the 372 students in Shelby are high school (108 | 29.0%), elementary school (88 | 23.7%), and college / undergraduate (77 | 20.7%).
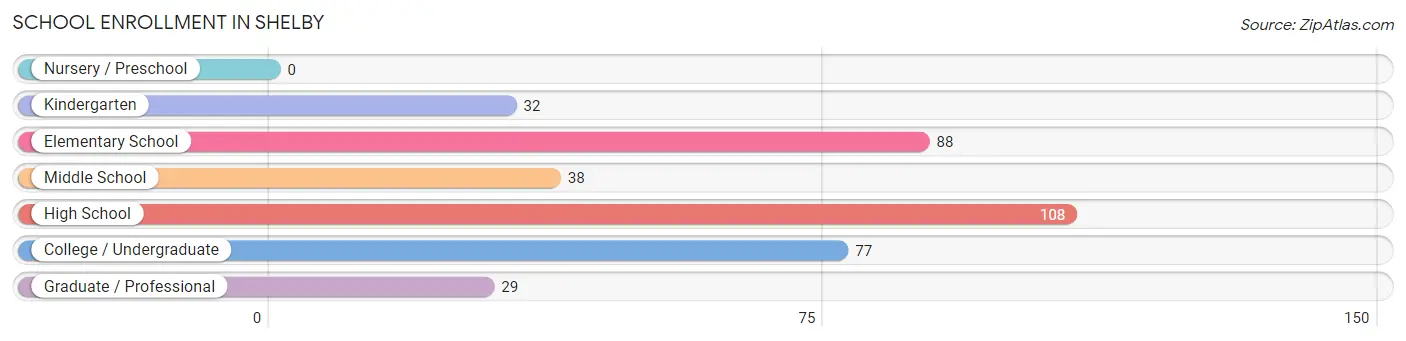
| School Level | # Students | % Students |
| Nursery / Preschool | 0 | 0.0% |
| Kindergarten | 32 | 8.6% |
| Elementary School | 88 | 23.7% |
| Middle School | 38 | 10.2% |
| High School | 108 | 29.0% |
| College / Undergraduate | 77 | 20.7% |
| Graduate / Professional | 29 | 7.8% |
| Total | 372 | 100.0% |
School Enrollment by Age by Funding Source in Shelby
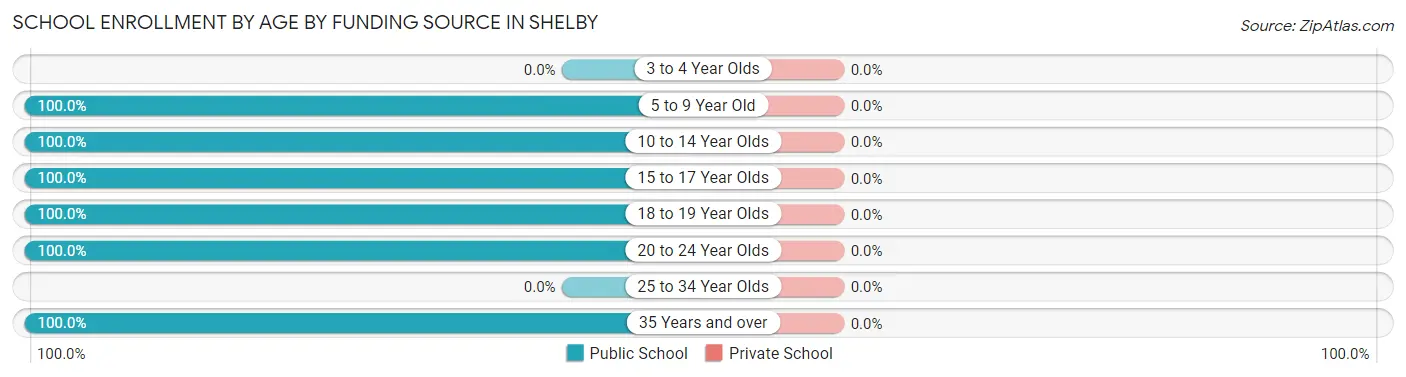
| Age Bracket | Public School | Private School |
| 3 to 4 Year Olds | 0 (0.0%) | 0 (0.0%) |
| 5 to 9 Year Old | 74 (100.0%) | 0 (0.0%) |
| 10 to 14 Year Olds | 78 (100.0%) | 0 (0.0%) |
| 15 to 17 Year Olds | 95 (100.0%) | 0 (0.0%) |
| 18 to 19 Year Olds | 34 (100.0%) | 0 (0.0%) |
| 20 to 24 Year Olds | 62 (100.0%) | 0 (0.0%) |
| 25 to 34 Year Olds | 0 (0.0%) | 0 (0.0%) |
| 35 Years and over | 29 (100.0%) | 0 (0.0%) |
| Total | 372 (100.0%) | 0 (0.0%) |
Educational Attainment by Field of Study in Shelby
Education (133 | 57.1%), social sciences (29 | 12.4%), bio, nature & agricultural (19 | 8.2%), science & technology (18 | 7.7%), and physical & health sciences (16 | 6.9%) are the most common fields of study among 233 individuals in Shelby who have obtained a bachelor's degree or higher.
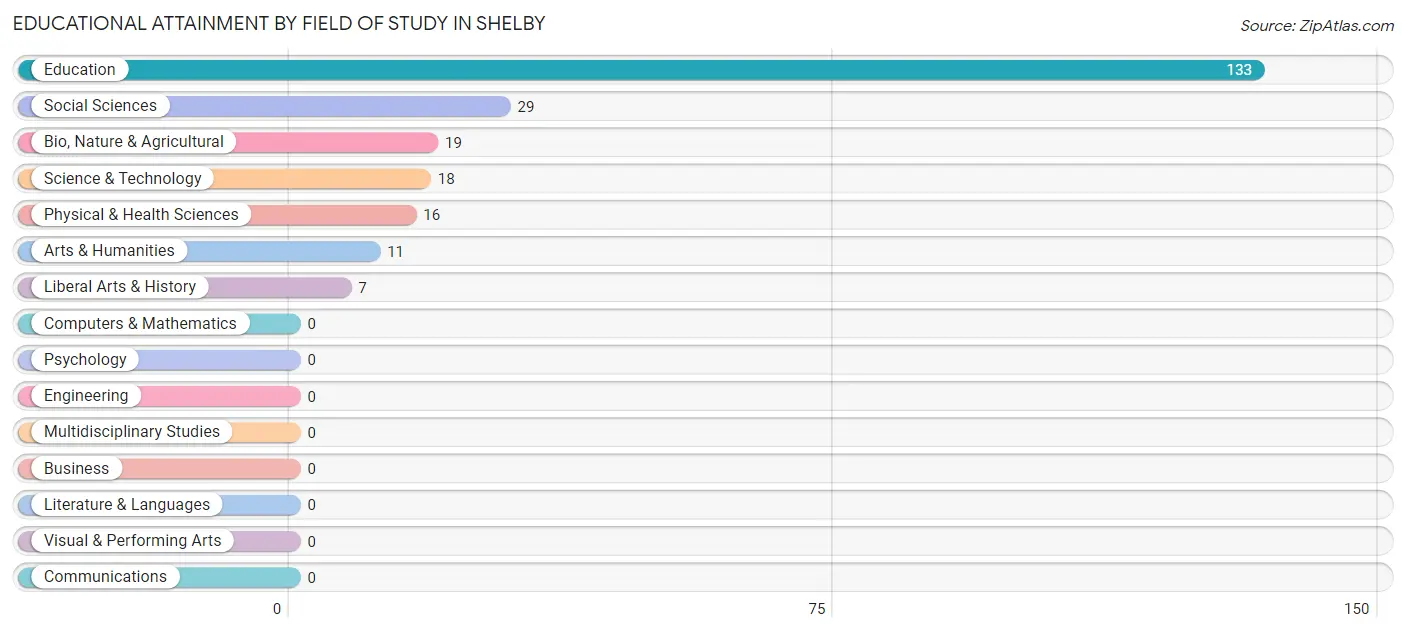
| Field of Study | # Graduates | % Graduates |
| Computers & Mathematics | 0 | 0.0% |
| Bio, Nature & Agricultural | 19 | 8.2% |
| Physical & Health Sciences | 16 | 6.9% |
| Psychology | 0 | 0.0% |
| Social Sciences | 29 | 12.4% |
| Engineering | 0 | 0.0% |
| Multidisciplinary Studies | 0 | 0.0% |
| Science & Technology | 18 | 7.7% |
| Business | 0 | 0.0% |
| Education | 133 | 57.1% |
| Literature & Languages | 0 | 0.0% |
| Liberal Arts & History | 7 | 3.0% |
| Visual & Performing Arts | 0 | 0.0% |
| Communications | 0 | 0.0% |
| Arts & Humanities | 11 | 4.7% |
| Total | 233 | 100.0% |
Transportation & Commute in Shelby
Vehicle Availability by Sex in Shelby
The most prevalent vehicle ownership categories in Shelby are males with 2 vehicles (49, accounting for 38.9%) and females with 2 vehicles (108, making up 22.5%).
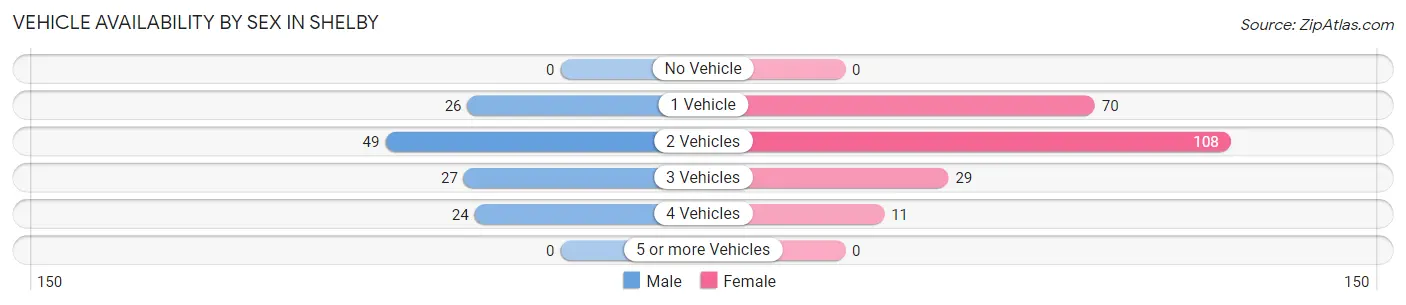
| Vehicles Available | Male | Female |
| No Vehicle | 0 (0.0%) | 0 (0.0%) |
| 1 Vehicle | 26 (20.6%) | 70 (32.1%) |
| 2 Vehicles | 49 (38.9%) | 108 (49.5%) |
| 3 Vehicles | 27 (21.4%) | 29 (13.3%) |
| 4 Vehicles | 24 (19.1%) | 11 (5.1%) |
| 5 or more Vehicles | 0 (0.0%) | 0 (0.0%) |
| Total | 126 (100.0%) | 218 (100.0%) |
Commute Time in Shelby
The most frequently occuring commute durations in Shelby are 20 to 24 minutes (75 commuters, 21.8%), 90 or more minutes (73 commuters, 21.2%), and 5 to 9 minutes (70 commuters, 20.3%).
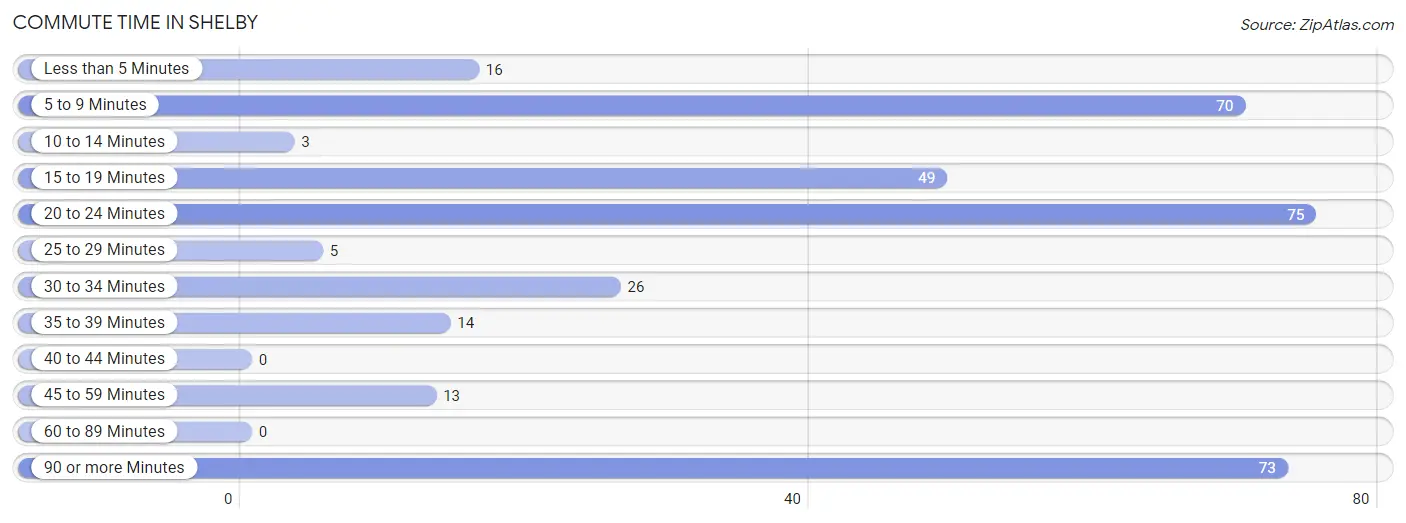
| Commute Time | # Commuters | % Commuters |
| Less than 5 Minutes | 16 | 4.6% |
| 5 to 9 Minutes | 70 | 20.3% |
| 10 to 14 Minutes | 3 | 0.9% |
| 15 to 19 Minutes | 49 | 14.2% |
| 20 to 24 Minutes | 75 | 21.8% |
| 25 to 29 Minutes | 5 | 1.5% |
| 30 to 34 Minutes | 26 | 7.6% |
| 35 to 39 Minutes | 14 | 4.1% |
| 40 to 44 Minutes | 0 | 0.0% |
| 45 to 59 Minutes | 13 | 3.8% |
| 60 to 89 Minutes | 0 | 0.0% |
| 90 or more Minutes | 73 | 21.2% |
Commute Time by Sex in Shelby
The most common commute times in Shelby are 20 to 24 minutes (37 commuters, 29.4%) for males and 15 to 19 minutes (49 commuters, 22.5%) for females.
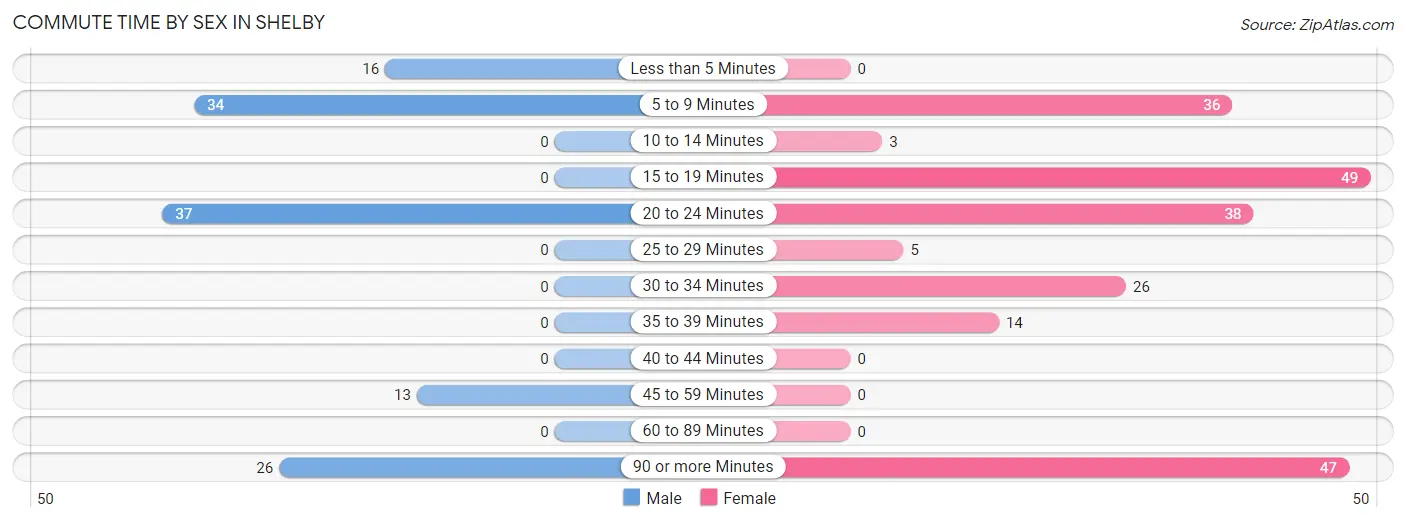
| Commute Time | Male | Female |
| Less than 5 Minutes | 16 (12.7%) | 0 (0.0%) |
| 5 to 9 Minutes | 34 (27.0%) | 36 (16.5%) |
| 10 to 14 Minutes | 0 (0.0%) | 3 (1.4%) |
| 15 to 19 Minutes | 0 (0.0%) | 49 (22.5%) |
| 20 to 24 Minutes | 37 (29.4%) | 38 (17.4%) |
| 25 to 29 Minutes | 0 (0.0%) | 5 (2.3%) |
| 30 to 34 Minutes | 0 (0.0%) | 26 (11.9%) |
| 35 to 39 Minutes | 0 (0.0%) | 14 (6.4%) |
| 40 to 44 Minutes | 0 (0.0%) | 0 (0.0%) |
| 45 to 59 Minutes | 13 (10.3%) | 0 (0.0%) |
| 60 to 89 Minutes | 0 (0.0%) | 0 (0.0%) |
| 90 or more Minutes | 26 (20.6%) | 47 (21.6%) |
Time of Departure to Work by Sex in Shelby
The most frequent times of departure to work in Shelby are 6:30 AM to 6:59 AM (48, 38.1%) for males and 7:00 AM to 7:29 AM (76, 34.9%) for females.
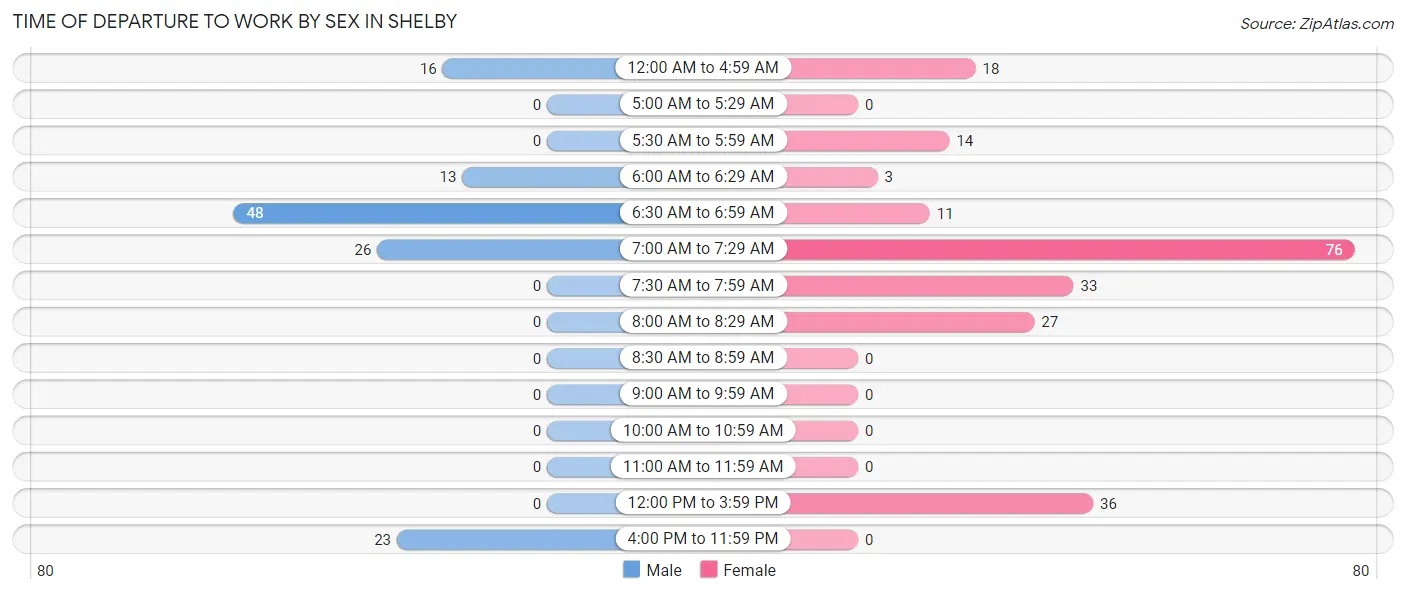
| Time of Departure | Male | Female |
| 12:00 AM to 4:59 AM | 16 (12.7%) | 18 (8.3%) |
| 5:00 AM to 5:29 AM | 0 (0.0%) | 0 (0.0%) |
| 5:30 AM to 5:59 AM | 0 (0.0%) | 14 (6.4%) |
| 6:00 AM to 6:29 AM | 13 (10.3%) | 3 (1.4%) |
| 6:30 AM to 6:59 AM | 48 (38.1%) | 11 (5.1%) |
| 7:00 AM to 7:29 AM | 26 (20.6%) | 76 (34.9%) |
| 7:30 AM to 7:59 AM | 0 (0.0%) | 33 (15.1%) |
| 8:00 AM to 8:29 AM | 0 (0.0%) | 27 (12.4%) |
| 8:30 AM to 8:59 AM | 0 (0.0%) | 0 (0.0%) |
| 9:00 AM to 9:59 AM | 0 (0.0%) | 0 (0.0%) |
| 10:00 AM to 10:59 AM | 0 (0.0%) | 0 (0.0%) |
| 11:00 AM to 11:59 AM | 0 (0.0%) | 0 (0.0%) |
| 12:00 PM to 3:59 PM | 0 (0.0%) | 36 (16.5%) |
| 4:00 PM to 11:59 PM | 23 (18.2%) | 0 (0.0%) |
| Total | 126 (100.0%) | 218 (100.0%) |
Housing Occupancy in Shelby
Occupancy by Ownership in Shelby
Of the total 717 dwellings in Shelby, owner-occupied units account for 445 (62.1%), while renter-occupied units make up 272 (37.9%).
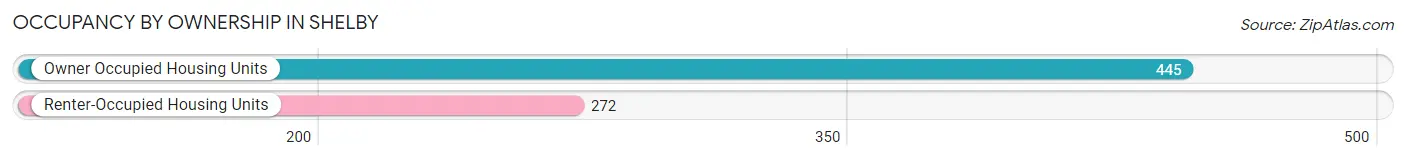
| Occupancy | # Housing Units | % Housing Units |
| Owner Occupied Housing Units | 445 | 62.1% |
| Renter-Occupied Housing Units | 272 | 37.9% |
| Total Occupied Housing Units | 717 | 100.0% |
Occupancy by Household Size in Shelby
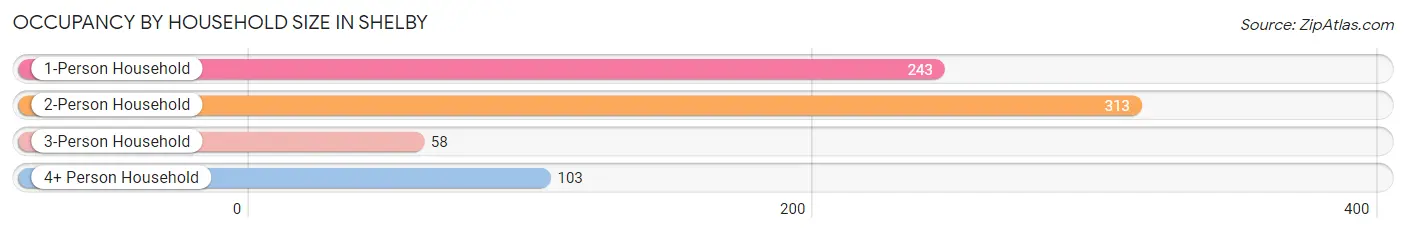
| Household Size | # Housing Units | % Housing Units |
| 1-Person Household | 243 | 33.9% |
| 2-Person Household | 313 | 43.6% |
| 3-Person Household | 58 | 8.1% |
| 4+ Person Household | 103 | 14.4% |
| Total Housing Units | 717 | 100.0% |
Occupancy by Ownership by Household Size in Shelby
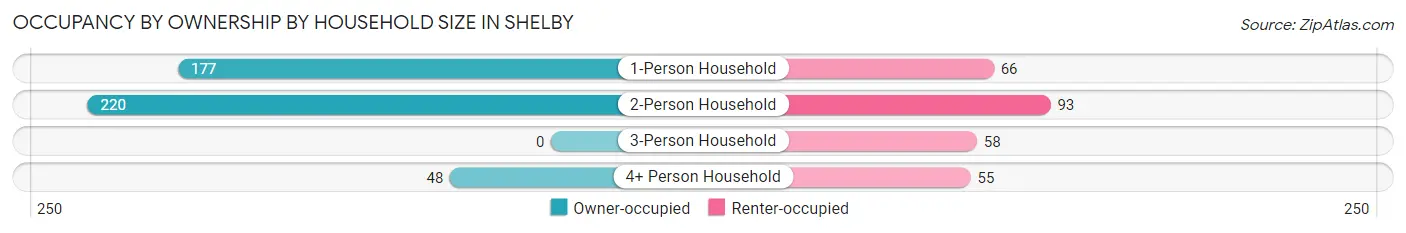
| Household Size | Owner-occupied | Renter-occupied |
| 1-Person Household | 177 (72.8%) | 66 (27.2%) |
| 2-Person Household | 220 (70.3%) | 93 (29.7%) |
| 3-Person Household | 0 (0.0%) | 58 (100.0%) |
| 4+ Person Household | 48 (46.6%) | 55 (53.4%) |
| Total Housing Units | 445 (62.1%) | 272 (37.9%) |
Occupancy by Educational Attainment in Shelby
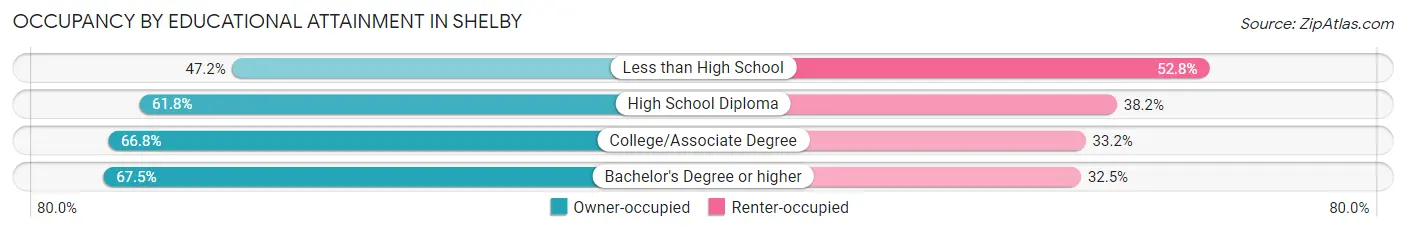
| Household Size | Owner-occupied | Renter-occupied |
| Less than High School | 75 (47.2%) | 84 (52.8%) |
| High School Diploma | 47 (61.8%) | 29 (38.2%) |
| College/Associate Degree | 217 (66.8%) | 108 (33.2%) |
| Bachelor's Degree or higher | 106 (67.5%) | 51 (32.5%) |
Occupancy by Age of Householder in Shelby
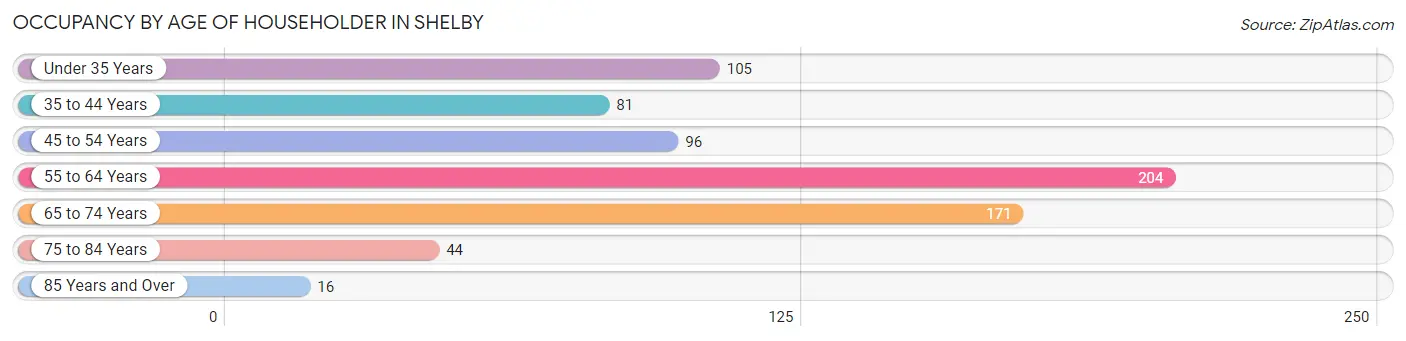
| Age Bracket | # Households | % Households |
| Under 35 Years | 105 | 14.6% |
| 35 to 44 Years | 81 | 11.3% |
| 45 to 54 Years | 96 | 13.4% |
| 55 to 64 Years | 204 | 28.4% |
| 65 to 74 Years | 171 | 23.8% |
| 75 to 84 Years | 44 | 6.1% |
| 85 Years and Over | 16 | 2.2% |
| Total | 717 | 100.0% |
Housing Finances in Shelby
Median Income by Occupancy in Shelby
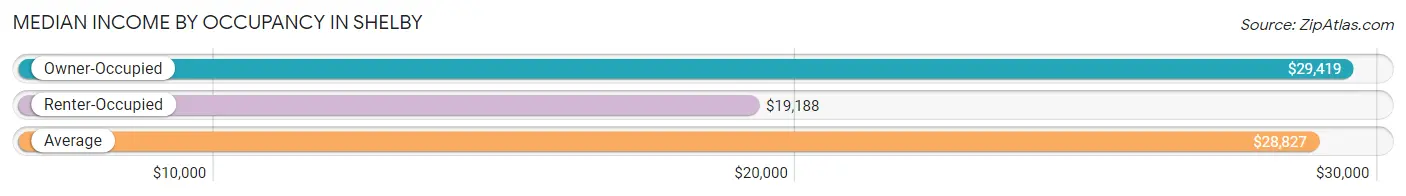
| Occupancy Type | # Households | Median Income |
| Owner-Occupied | 445 (62.1%) | $29,419 |
| Renter-Occupied | 272 (37.9%) | $19,188 |
| Average | 717 (100.0%) | $28,827 |
Occupancy by Householder Income Bracket in Shelby
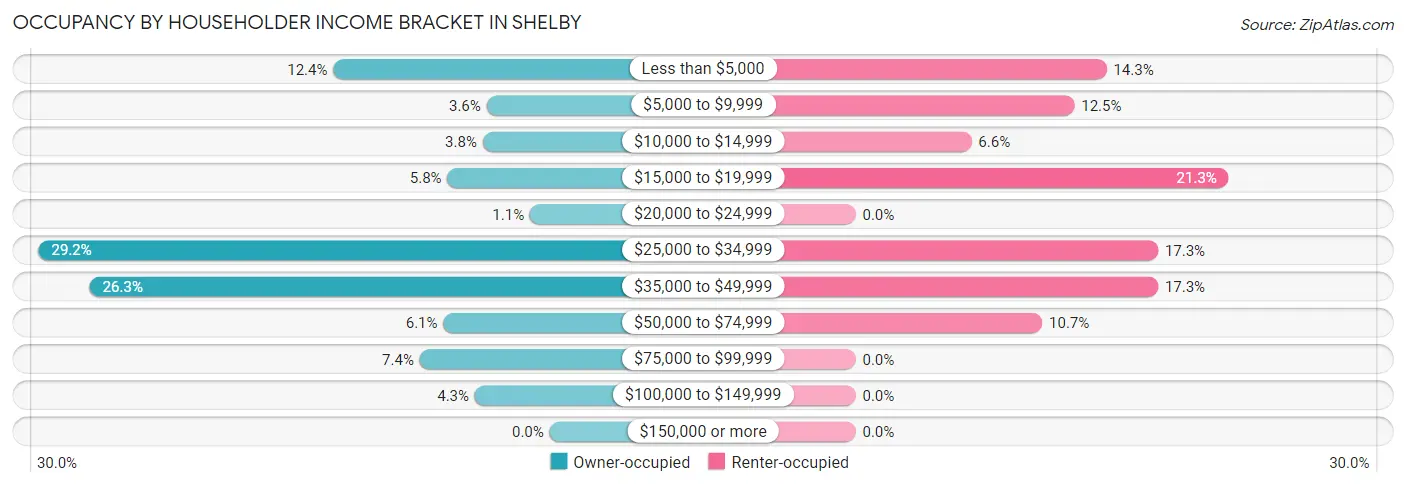
| Income Bracket | Owner-occupied | Renter-occupied |
| Less than $5,000 | 55 (12.4%) | 39 (14.3%) |
| $5,000 to $9,999 | 16 (3.6%) | 34 (12.5%) |
| $10,000 to $14,999 | 17 (3.8%) | 18 (6.6%) |
| $15,000 to $19,999 | 26 (5.8%) | 58 (21.3%) |
| $20,000 to $24,999 | 5 (1.1%) | 0 (0.0%) |
| $25,000 to $34,999 | 130 (29.2%) | 47 (17.3%) |
| $35,000 to $49,999 | 117 (26.3%) | 47 (17.3%) |
| $50,000 to $74,999 | 27 (6.1%) | 29 (10.7%) |
| $75,000 to $99,999 | 33 (7.4%) | 0 (0.0%) |
| $100,000 to $149,999 | 19 (4.3%) | 0 (0.0%) |
| $150,000 or more | 0 (0.0%) | 0 (0.0%) |
| Total | 445 (100.0%) | 272 (100.0%) |
Monthly Housing Cost Tiers in Shelby
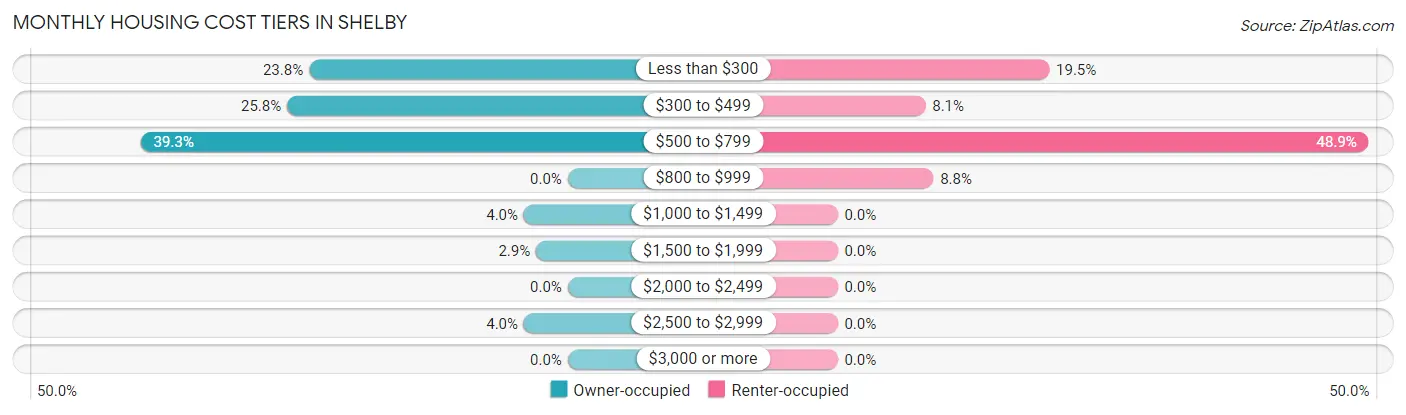
| Monthly Cost | Owner-occupied | Renter-occupied |
| Less than $300 | 106 (23.8%) | 53 (19.5%) |
| $300 to $499 | 115 (25.8%) | 22 (8.1%) |
| $500 to $799 | 175 (39.3%) | 133 (48.9%) |
| $800 to $999 | 0 (0.0%) | 24 (8.8%) |
| $1,000 to $1,499 | 18 (4.0%) | 0 (0.0%) |
| $1,500 to $1,999 | 13 (2.9%) | 0 (0.0%) |
| $2,000 to $2,499 | 0 (0.0%) | 0 (0.0%) |
| $2,500 to $2,999 | 18 (4.0%) | 0 (0.0%) |
| $3,000 or more | 0 (0.0%) | 0 (0.0%) |
| Total | 445 (100.0%) | 272 (100.0%) |
Physical Housing Characteristics in Shelby
Housing Structures in Shelby
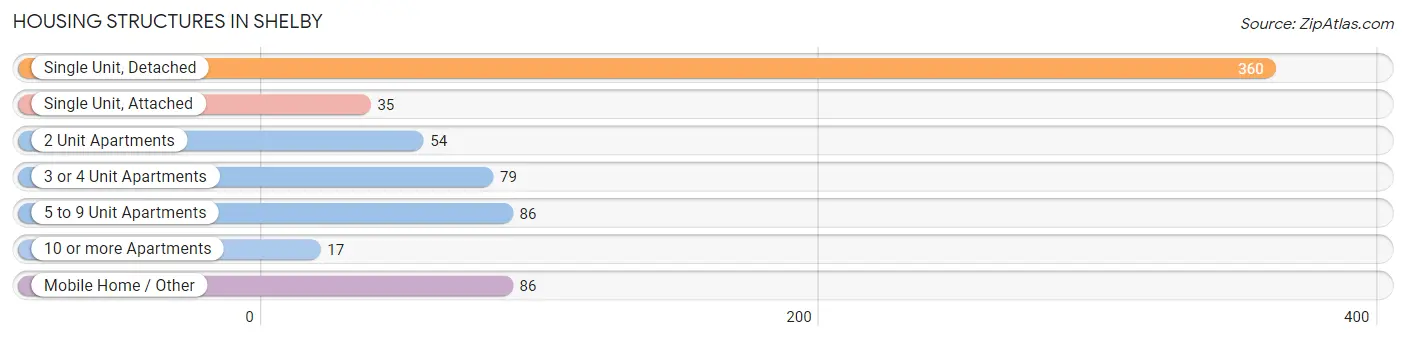
| Structure Type | # Housing Units | % Housing Units |
| Single Unit, Detached | 360 | 50.2% |
| Single Unit, Attached | 35 | 4.9% |
| 2 Unit Apartments | 54 | 7.5% |
| 3 or 4 Unit Apartments | 79 | 11.0% |
| 5 to 9 Unit Apartments | 86 | 12.0% |
| 10 or more Apartments | 17 | 2.4% |
| Mobile Home / Other | 86 | 12.0% |
| Total | 717 | 100.0% |
Housing Structures by Occupancy in Shelby
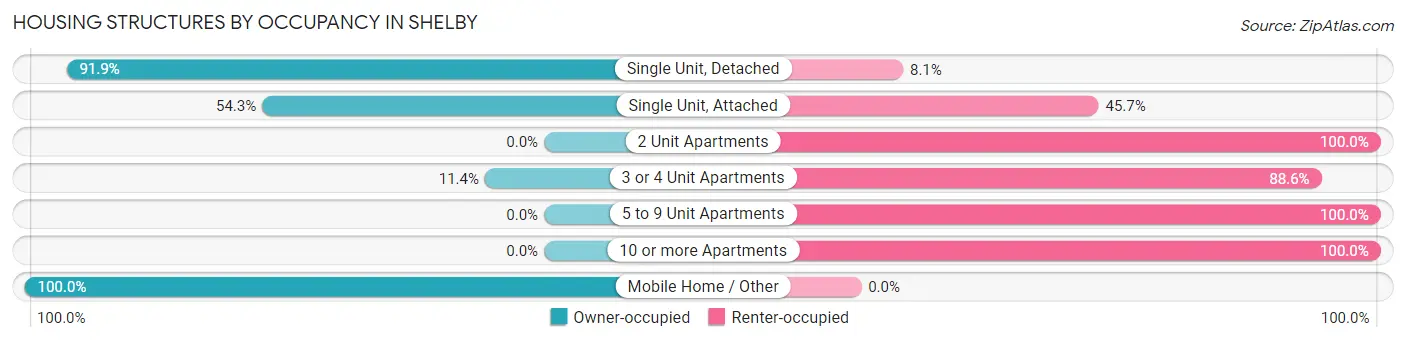
| Structure Type | Owner-occupied | Renter-occupied |
| Single Unit, Detached | 331 (91.9%) | 29 (8.1%) |
| Single Unit, Attached | 19 (54.3%) | 16 (45.7%) |
| 2 Unit Apartments | 0 (0.0%) | 54 (100.0%) |
| 3 or 4 Unit Apartments | 9 (11.4%) | 70 (88.6%) |
| 5 to 9 Unit Apartments | 0 (0.0%) | 86 (100.0%) |
| 10 or more Apartments | 0 (0.0%) | 17 (100.0%) |
| Mobile Home / Other | 86 (100.0%) | 0 (0.0%) |
| Total | 445 (62.1%) | 272 (37.9%) |
Housing Structures by Number of Rooms in Shelby
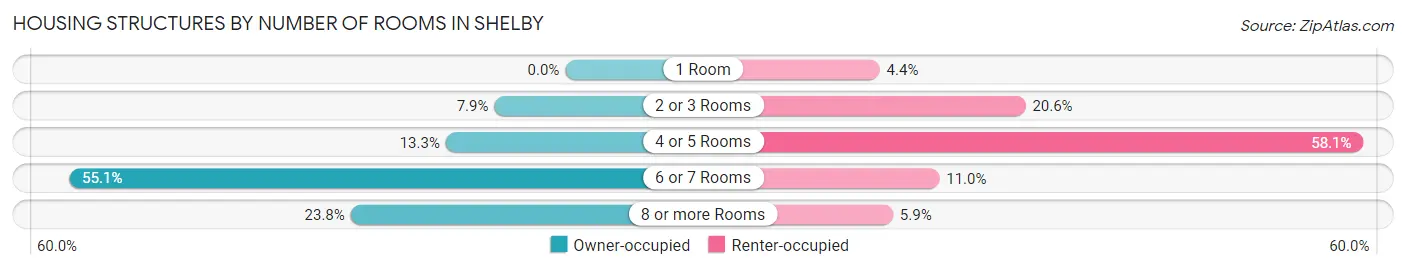
| Number of Rooms | Owner-occupied | Renter-occupied |
| 1 Room | 0 (0.0%) | 12 (4.4%) |
| 2 or 3 Rooms | 35 (7.9%) | 56 (20.6%) |
| 4 or 5 Rooms | 59 (13.3%) | 158 (58.1%) |
| 6 or 7 Rooms | 245 (55.1%) | 30 (11.0%) |
| 8 or more Rooms | 106 (23.8%) | 16 (5.9%) |
| Total | 445 (100.0%) | 272 (100.0%) |
Housing Structure by Heating Type in Shelby
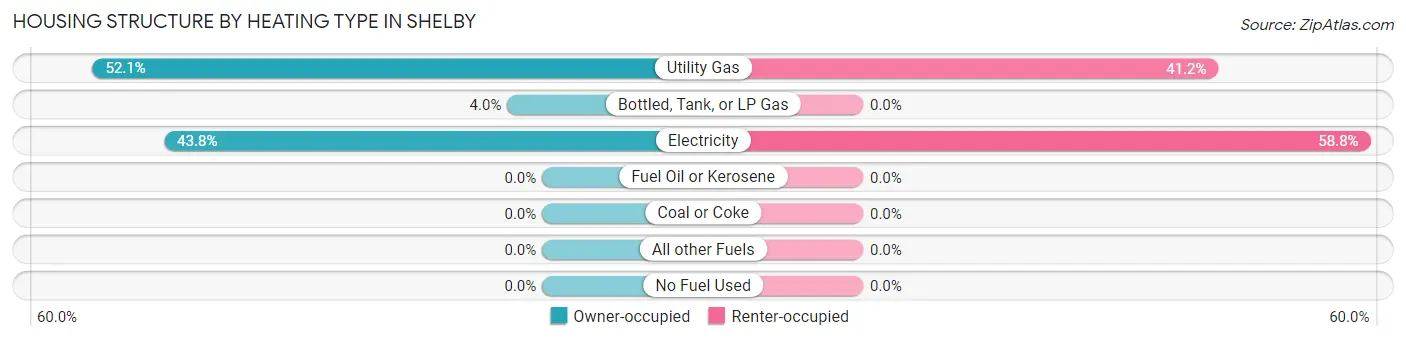
| Heating Type | Owner-occupied | Renter-occupied |
| Utility Gas | 232 (52.1%) | 112 (41.2%) |
| Bottled, Tank, or LP Gas | 18 (4.0%) | 0 (0.0%) |
| Electricity | 195 (43.8%) | 160 (58.8%) |
| Fuel Oil or Kerosene | 0 (0.0%) | 0 (0.0%) |
| Coal or Coke | 0 (0.0%) | 0 (0.0%) |
| All other Fuels | 0 (0.0%) | 0 (0.0%) |
| No Fuel Used | 0 (0.0%) | 0 (0.0%) |
| Total | 445 (100.0%) | 272 (100.0%) |
Household Vehicle Usage in Shelby
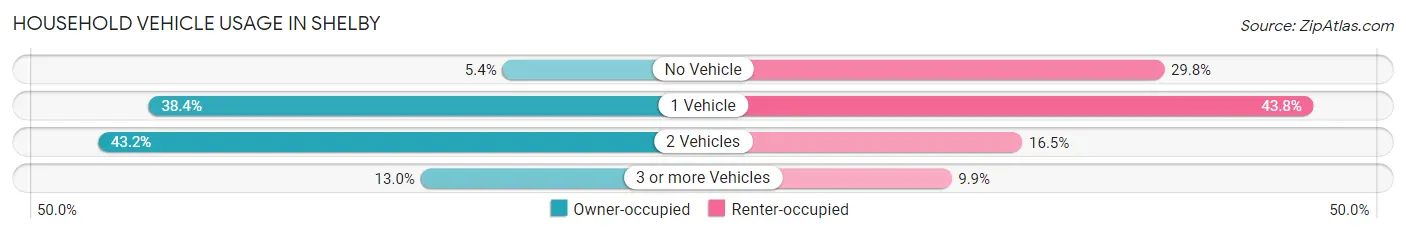
| Vehicles per Household | Owner-occupied | Renter-occupied |
| No Vehicle | 24 (5.4%) | 81 (29.8%) |
| 1 Vehicle | 171 (38.4%) | 119 (43.8%) |
| 2 Vehicles | 192 (43.1%) | 45 (16.5%) |
| 3 or more Vehicles | 58 (13.0%) | 27 (9.9%) |
| Total | 445 (100.0%) | 272 (100.0%) |
Real Estate & Mortgages in Shelby
Real Estate and Mortgage Overview in Shelby
| Characteristic | Without Mortgage | With Mortgage |
| Housing Units | 301 | 144 |
| Median Property Value | $80,500 | $87,100 |
| Median Household Income | $35,139 | $0 |
| Monthly Housing Costs | $408 | $0 |
| Real Estate Taxes | $263 | $18 |
Property Value by Mortgage Status in Shelby
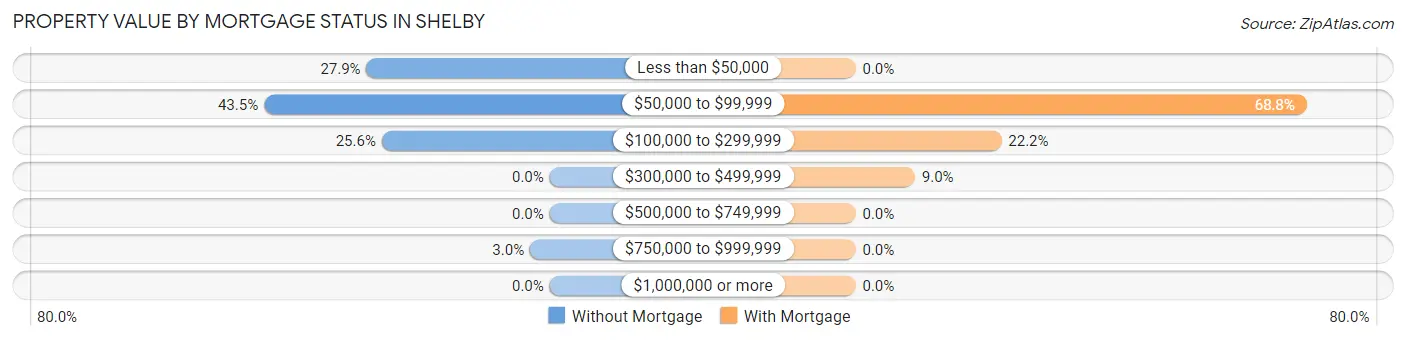
| Property Value | Without Mortgage | With Mortgage |
| Less than $50,000 | 84 (27.9%) | 0 (0.0%) |
| $50,000 to $99,999 | 131 (43.5%) | 99 (68.8%) |
| $100,000 to $299,999 | 77 (25.6%) | 32 (22.2%) |
| $300,000 to $499,999 | 0 (0.0%) | 13 (9.0%) |
| $500,000 to $749,999 | 0 (0.0%) | 0 (0.0%) |
| $750,000 to $999,999 | 9 (3.0%) | 0 (0.0%) |
| $1,000,000 or more | 0 (0.0%) | 0 (0.0%) |
| Total | 301 (100.0%) | 144 (100.0%) |
Household Income by Mortgage Status in Shelby
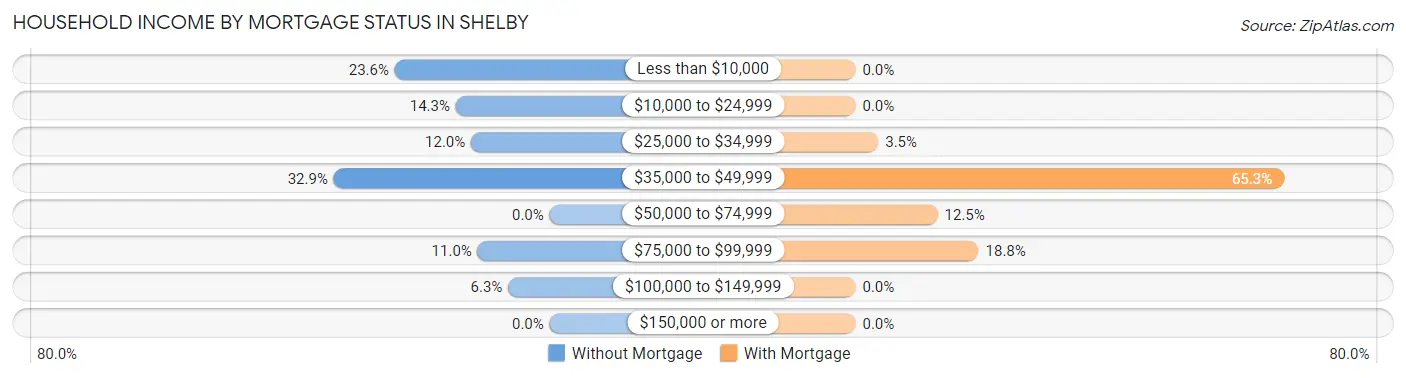
| Household Income | Without Mortgage | With Mortgage |
| Less than $10,000 | 71 (23.6%) | 0 (0.0%) |
| $10,000 to $24,999 | 43 (14.3%) | 0 (0.0%) |
| $25,000 to $34,999 | 36 (12.0%) | 5 (3.5%) |
| $35,000 to $49,999 | 99 (32.9%) | 94 (65.3%) |
| $50,000 to $74,999 | 0 (0.0%) | 18 (12.5%) |
| $75,000 to $99,999 | 33 (11.0%) | 27 (18.8%) |
| $100,000 to $149,999 | 19 (6.3%) | 0 (0.0%) |
| $150,000 or more | 0 (0.0%) | 0 (0.0%) |
| Total | 301 (100.0%) | 144 (100.0%) |
Property Value to Household Income Ratio in Shelby
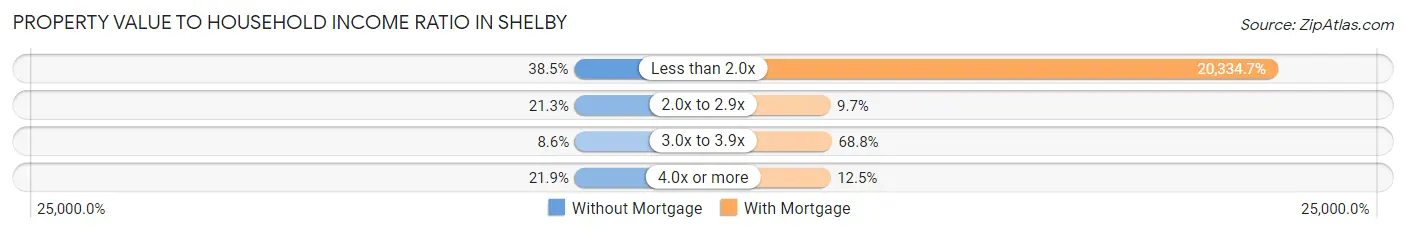
| Value-to-Income Ratio | Without Mortgage | With Mortgage |
| Less than 2.0x | 116 (38.5%) | 29,282 (20,334.7%) |
| 2.0x to 2.9x | 64 (21.3%) | 14 (9.7%) |
| 3.0x to 3.9x | 26 (8.6%) | 99 (68.8%) |
| 4.0x or more | 66 (21.9%) | 18 (12.5%) |
| Total | 301 (100.0%) | 144 (100.0%) |
Real Estate Taxes by Mortgage Status in Shelby
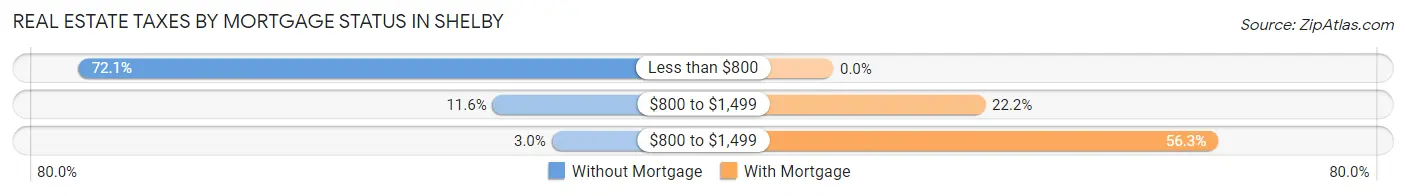
| Property Taxes | Without Mortgage | With Mortgage |
| Less than $800 | 217 (72.1%) | 0 (0.0%) |
| $800 to $1,499 | 35 (11.6%) | 32 (22.2%) |
| $800 to $1,499 | 9 (3.0%) | 81 (56.2%) |
| Total | 301 (100.0%) | 144 (100.0%) |
Health & Disability in Shelby
Health Insurance Coverage by Age in Shelby
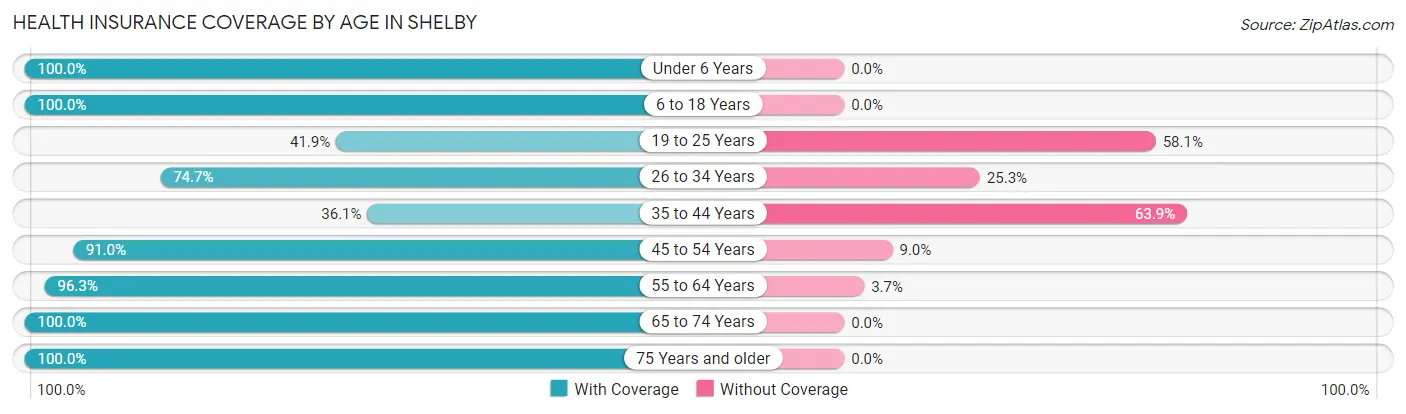
| Age Bracket | With Coverage | Without Coverage |
| Under 6 Years | 123 (100.0%) | 0 (0.0%) |
| 6 to 18 Years | 242 (100.0%) | 0 (0.0%) |
| 19 to 25 Years | 83 (41.9%) | 115 (58.1%) |
| 26 to 34 Years | 130 (74.7%) | 44 (25.3%) |
| 35 to 44 Years | 57 (36.1%) | 101 (63.9%) |
| 45 to 54 Years | 172 (91.0%) | 17 (9.0%) |
| 55 to 64 Years | 285 (96.3%) | 11 (3.7%) |
| 65 to 74 Years | 190 (100.0%) | 0 (0.0%) |
| 75 Years and older | 94 (100.0%) | 0 (0.0%) |
| Total | 1,376 (82.7%) | 288 (17.3%) |
Health Insurance Coverage by Citizenship Status in Shelby
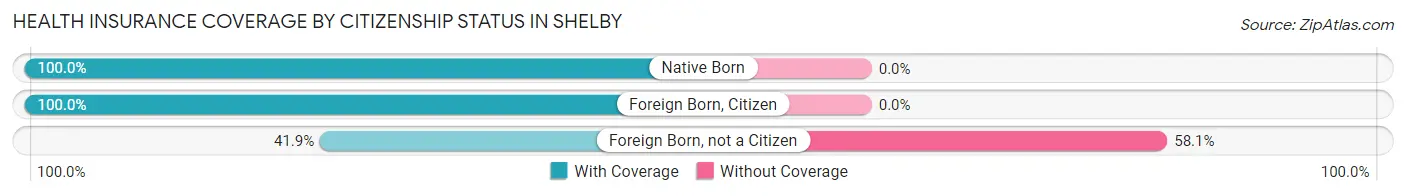
| Citizenship Status | With Coverage | Without Coverage |
| Native Born | 123 (100.0%) | 0 (0.0%) |
| Foreign Born, Citizen | 242 (100.0%) | 0 (0.0%) |
| Foreign Born, not a Citizen | 83 (41.9%) | 115 (58.1%) |
Health Insurance Coverage by Household Income in Shelby
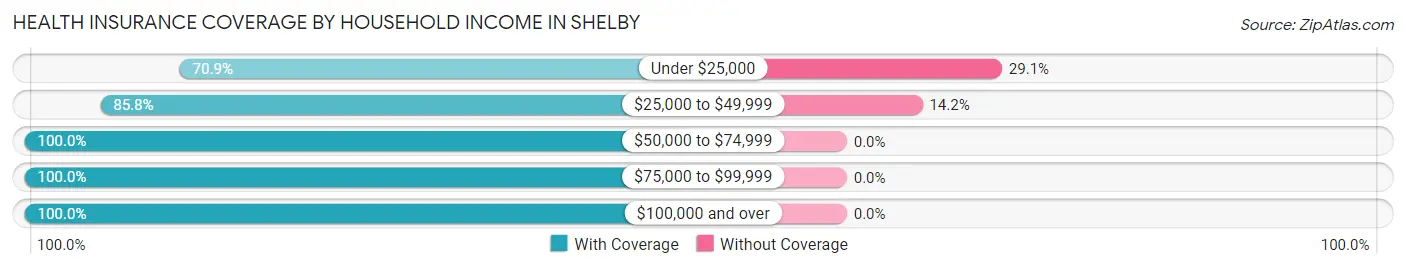
| Household Income | With Coverage | Without Coverage |
| Under $25,000 | 415 (70.9%) | 170 (29.1%) |
| $25,000 to $49,999 | 714 (85.8%) | 118 (14.2%) |
| $50,000 to $74,999 | 142 (100.0%) | 0 (0.0%) |
| $75,000 to $99,999 | 67 (100.0%) | 0 (0.0%) |
| $100,000 and over | 38 (100.0%) | 0 (0.0%) |
Public vs Private Health Insurance Coverage by Age in Shelby
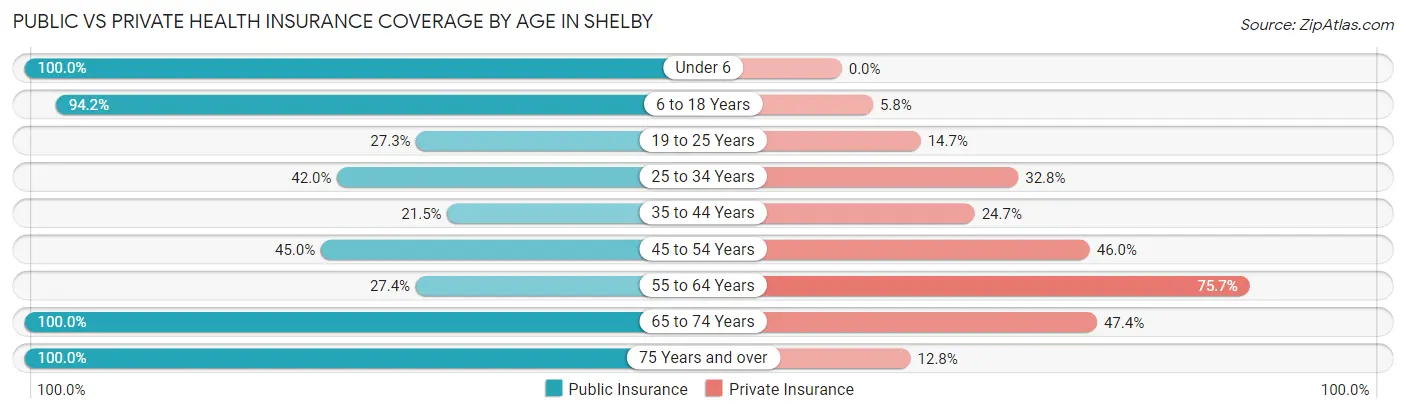
| Age Bracket | Public Insurance | Private Insurance |
| Under 6 | 123 (100.0%) | 0 (0.0%) |
| 6 to 18 Years | 228 (94.2%) | 14 (5.8%) |
| 19 to 25 Years | 54 (27.3%) | 29 (14.6%) |
| 25 to 34 Years | 73 (41.9%) | 57 (32.8%) |
| 35 to 44 Years | 34 (21.5%) | 39 (24.7%) |
| 45 to 54 Years | 85 (45.0%) | 87 (46.0%) |
| 55 to 64 Years | 81 (27.4%) | 224 (75.7%) |
| 65 to 74 Years | 190 (100.0%) | 90 (47.4%) |
| 75 Years and over | 94 (100.0%) | 12 (12.8%) |
| Total | 962 (57.8%) | 552 (33.2%) |
Disability Status by Sex by Age in Shelby
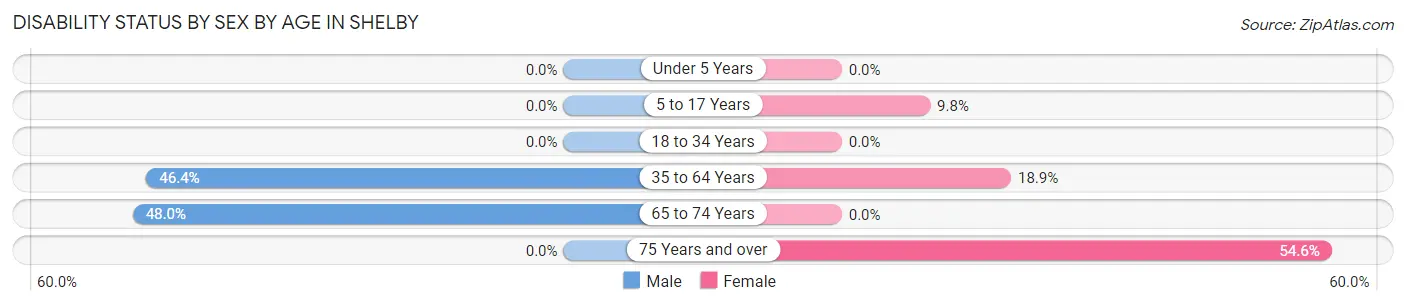
| Age Bracket | Male | Female |
| Under 5 Years | 0 (0.0%) | 0 (0.0%) |
| 5 to 17 Years | 0 (0.0%) | 12 (9.8%) |
| 18 to 34 Years | 0 (0.0%) | 0 (0.0%) |
| 35 to 64 Years | 104 (46.4%) | 79 (18.9%) |
| 65 to 74 Years | 47 (48.0%) | 0 (0.0%) |
| 75 Years and over | 0 (0.0%) | 36 (54.5%) |
Disability Class by Sex by Age in Shelby
Disability Class: Hearing Difficulty
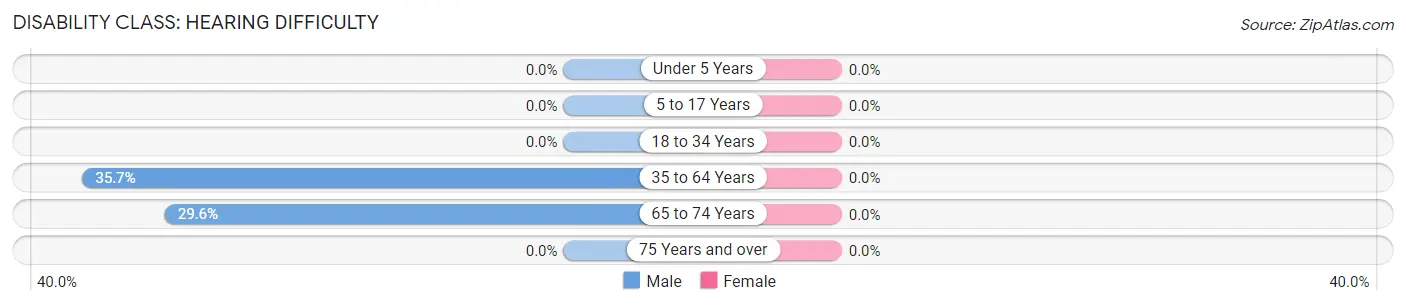
| Age Bracket | Male | Female |
| Under 5 Years | 0 (0.0%) | 0 (0.0%) |
| 5 to 17 Years | 0 (0.0%) | 0 (0.0%) |
| 18 to 34 Years | 0 (0.0%) | 0 (0.0%) |
| 35 to 64 Years | 80 (35.7%) | 0 (0.0%) |
| 65 to 74 Years | 29 (29.6%) | 0 (0.0%) |
| 75 Years and over | 0 (0.0%) | 0 (0.0%) |
Disability Class: Vision Difficulty
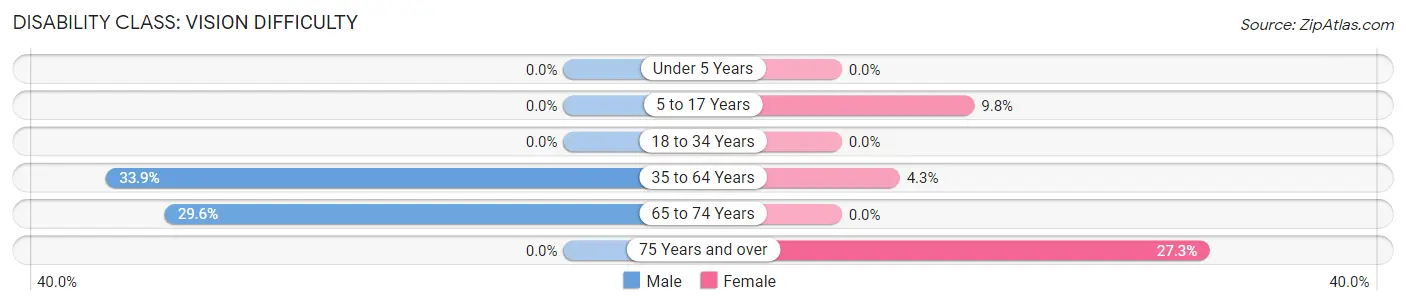
| Age Bracket | Male | Female |
| Under 5 Years | 0 (0.0%) | 0 (0.0%) |
| 5 to 17 Years | 0 (0.0%) | 12 (9.8%) |
| 18 to 34 Years | 0 (0.0%) | 0 (0.0%) |
| 35 to 64 Years | 76 (33.9%) | 18 (4.3%) |
| 65 to 74 Years | 29 (29.6%) | 0 (0.0%) |
| 75 Years and over | 0 (0.0%) | 18 (27.3%) |
Disability Class: Cognitive Difficulty
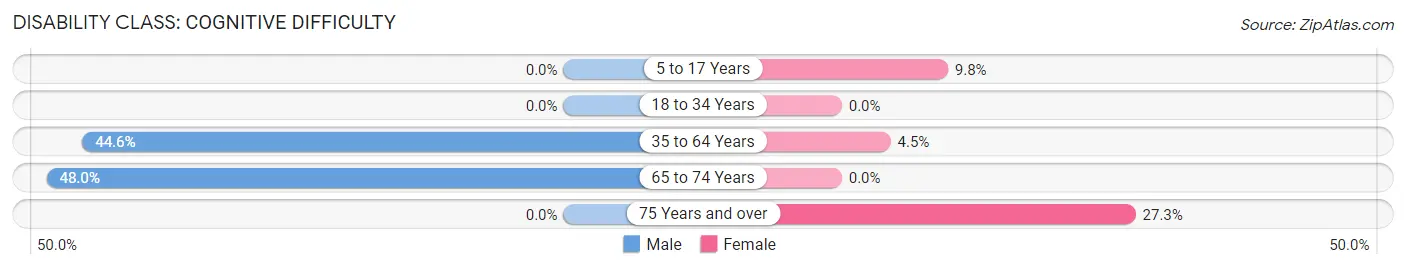
| Age Bracket | Male | Female |
| 5 to 17 Years | 0 (0.0%) | 12 (9.8%) |
| 18 to 34 Years | 0 (0.0%) | 0 (0.0%) |
| 35 to 64 Years | 100 (44.6%) | 19 (4.5%) |
| 65 to 74 Years | 47 (48.0%) | 0 (0.0%) |
| 75 Years and over | 0 (0.0%) | 18 (27.3%) |
Disability Class: Ambulatory Difficulty
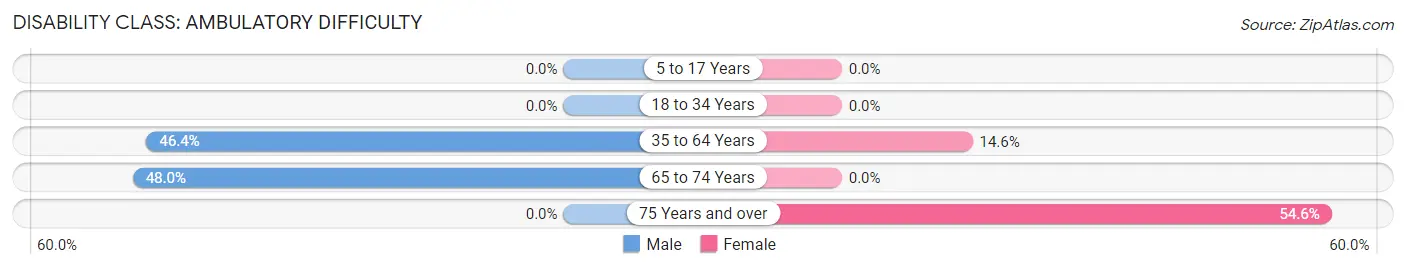
| Age Bracket | Male | Female |
| 5 to 17 Years | 0 (0.0%) | 0 (0.0%) |
| 18 to 34 Years | 0 (0.0%) | 0 (0.0%) |
| 35 to 64 Years | 104 (46.4%) | 61 (14.6%) |
| 65 to 74 Years | 47 (48.0%) | 0 (0.0%) |
| 75 Years and over | 0 (0.0%) | 36 (54.5%) |
Disability Class: Self-Care Difficulty
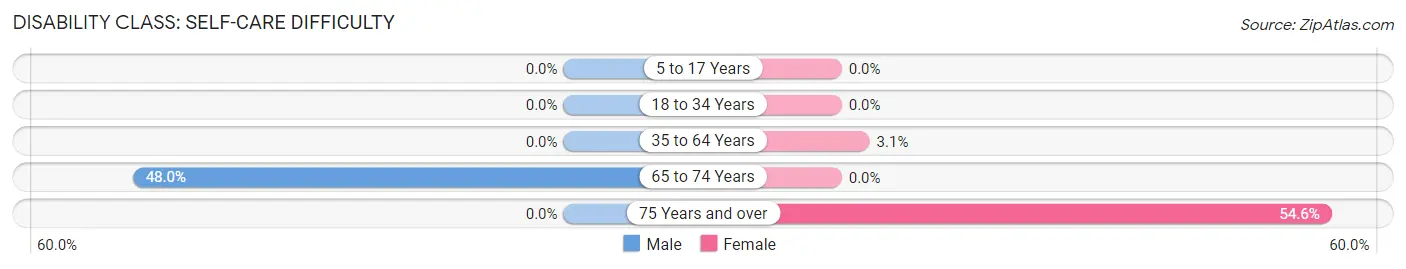
| Age Bracket | Male | Female |
| 5 to 17 Years | 0 (0.0%) | 0 (0.0%) |
| 18 to 34 Years | 0 (0.0%) | 0 (0.0%) |
| 35 to 64 Years | 0 (0.0%) | 13 (3.1%) |
| 65 to 74 Years | 47 (48.0%) | 0 (0.0%) |
| 75 Years and over | 0 (0.0%) | 36 (54.5%) |
Technology Access in Shelby
Computing Device Access in Shelby
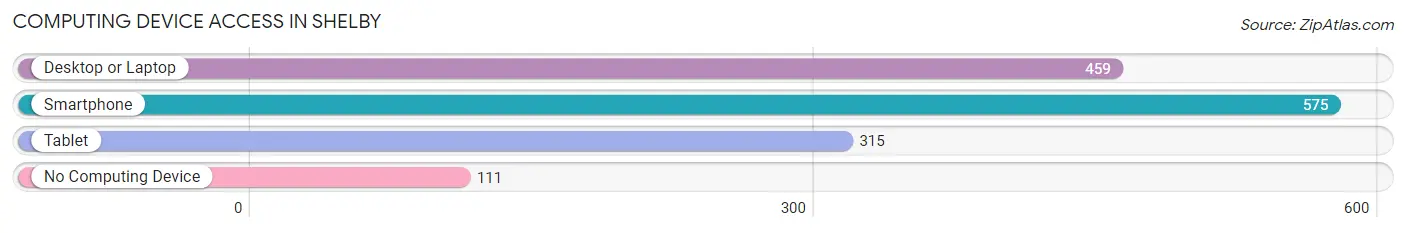
| Device Type | # Households | % Households |
| Desktop or Laptop | 459 | 64.0% |
| Smartphone | 575 | 80.2% |
| Tablet | 315 | 43.9% |
| No Computing Device | 111 | 15.5% |
| Total | 717 | 100.0% |
Internet Access in Shelby
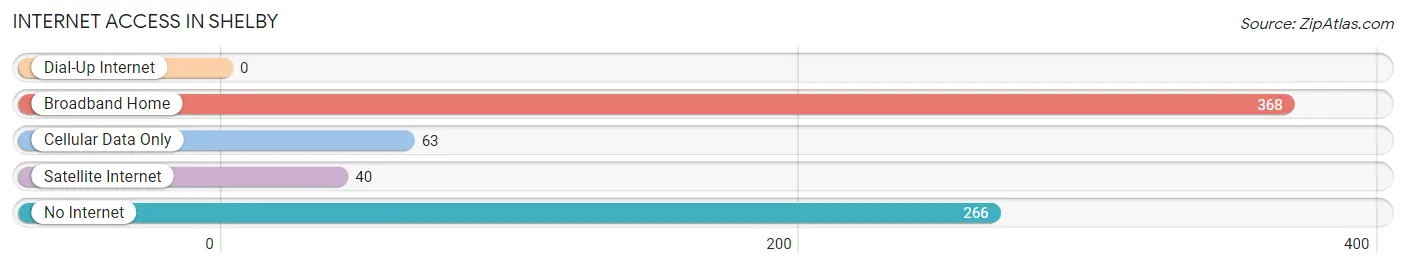
| Internet Type | # Households | % Households |
| Dial-Up Internet | 0 | 0.0% |
| Broadband Home | 368 | 51.3% |
| Cellular Data Only | 63 | 8.8% |
| Satellite Internet | 40 | 5.6% |
| No Internet | 266 | 37.1% |
| Total | 717 | 100.0% |
Shelby Summary
Shelby, Mississippi is a small town located in the northern part of the state, approximately 30 miles south of Memphis, Tennessee. It is the county seat of DeSoto County and is part of the Memphis metropolitan area. The town was founded in 1836 and has a population of approximately 8,000 people.
Geography
Shelby is located in the northwest corner of DeSoto County, Mississippi, and is situated on the banks of the Coldwater River. The town is located in the Mississippi Delta region, which is known for its flat terrain and rich soil. The town is surrounded by farmland and is located near the Mississippi River. The town is located approximately 30 miles south of Memphis, Tennessee, and is part of the Memphis metropolitan area.
Economy
Shelby’s economy is largely based on agriculture and manufacturing. The town is home to several large agricultural operations, including cotton, soybeans, corn, and wheat. The town is also home to several manufacturing companies, including a furniture factory, a paper mill, and a plastics plant. The town is also home to several small businesses, including restaurants, retail stores, and service providers.
Demographics
As of the 2010 census, the population of Shelby was 8,039. The racial makeup of the town was 79.3% White, 17.3% African American, 0.3% Native American, 0.7% Asian, 0.1% Pacific Islander, and 2.3% from other races. The median household income was $37,945, and the median family income was $45,945. The per capita income was $19,945.
History
Shelby was founded in 1836 and was named after Isaac Shelby, the first governor of Kentucky. The town was originally a trading post and was located on the Coldwater River. The town was incorporated in 1837 and was the county seat of DeSoto County. The town was a major stop on the Memphis and Charleston Railroad, which connected Memphis to Charleston, South Carolina. The town was also a major stop on the Mississippi Central Railroad, which connected Memphis to Jackson, Mississippi.
In the late 19th century, Shelby was a major cotton-producing center. The town was also home to several large plantations, which were worked by African American slaves. After the Civil War, the town’s economy shifted to agriculture and manufacturing. The town was also home to several large factories, including a furniture factory, a paper mill, and a plastics plant.
In the late 20th century, Shelby began to experience a decline in population as many of its residents moved to larger cities in search of better job opportunities. However, the town has experienced a resurgence in recent years, as many people have moved back to the area in search of a more rural lifestyle. The town is now home to several small businesses, including restaurants, retail stores, and service providers.
Common Questions
What is Per Capita Income in Shelby?
Per Capita income in Shelby is $14,020.
What is the Median Family Income in Shelby?
Median Family Income in Shelby is $28,487.
What is the Median Household income in Shelby?
Median Household Income in Shelby is $28,827.
What is Income or Wage Gap in Shelby?
Income or Wage Gap in Shelby is 40.8%.
Women in Shelby earn 59.2 cents for every dollar earned by a man.
What is Family Income Deficit in Shelby?
Family Income Deficit in Shelby is $12,788.
Families that are below poverty line in Shelby earn $12,788 less on average than the poverty threshold level.
What is Inequality or Gini Index in Shelby?
Inequality or Gini Index in Shelby is 0.42.
What is the Total Population of Shelby?
Total Population of Shelby is 1,751.
What is the Total Male Population of Shelby?
Total Male Population of Shelby is 780.
What is the Total Female Population of Shelby?
Total Female Population of Shelby is 971.
What is the Ratio of Males per 100 Females in Shelby?
There are 80.33 Males per 100 Females in Shelby.
What is the Ratio of Females per 100 Males in Shelby?
There are 124.49 Females per 100 Males in Shelby.
What is the Median Population Age in Shelby?
Median Population Age in Shelby is 42.1 Years.
What is the Average Family Size in Shelby
Average Family Size in Shelby is 3.0 People.
What is the Average Household Size in Shelby
Average Household Size in Shelby is 2.4 People.
How Large is the Labor Force in Shelby?
There are 408 People in the Labor Forcein in Shelby.
What is the Percentage of People in the Labor Force in Shelby?
27.4% of People are in the Labor Force in Shelby.
What is the Unemployment Rate in Shelby?
Unemployment Rate in Shelby is 16.8%.