Collins, MS Map & Demographics
Collins Map
Collins Overview
$15,850
PER CAPITA INCOME
$37,181
AVG FAMILY INCOME
$31,435
AVG HOUSEHOLD INCOME
53.3%
WAGE / INCOME GAP [ % ]
46.7¢/ $1
WAGE / INCOME GAP [ $ ]
$7,126
FAMILY INCOME DEFICIT
0.41
INEQUALITY / GINI INDEX
2,270
TOTAL POPULATION
1,046
MALE POPULATION
1,224
FEMALE POPULATION
85.46
MALES / 100 FEMALES
117.02
FEMALES / 100 MALES
53.6
MEDIAN AGE
3.1
AVG FAMILY SIZE
2.3
AVG HOUSEHOLD SIZE
762
LABOR FORCE [ PEOPLE ]
41.4%
PERCENT IN LABOR FORCE
13.0%
UNEMPLOYMENT RATE
Collins Zip Codes
Income in Collins
Income Overview in Collins
Per Capita Income in Collins is $15,850, while median incomes of families and households are $37,181 and $31,435 respectively.
| Characteristic | Number | Measure |
| Per Capita Income | 2,270 | $15,850 |
| Median Family Income | 519 | $37,181 |
| Mean Family Income | 519 | $45,147 |
| Median Household Income | 845 | $31,435 |
| Mean Household Income | 845 | $34,577 |
| Income Deficit | 519 | $7,126 |
| Wage / Income Gap (%) | 2,270 | 53.28% |
| Wage / Income Gap ($) | 2,270 | 46.72¢ per $1 |
| Gini / Inequality Index | 2,270 | 0.41 |
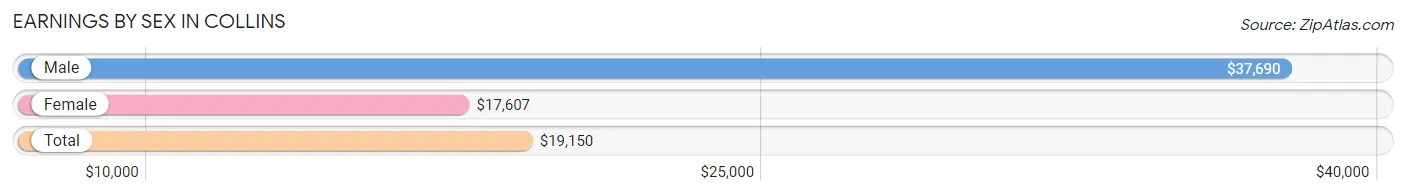
Earnings by Sex in Collins
Average Earnings in Collins are $19,150, $37,690 for men and $17,607 for women, a difference of 53.3%.
| Sex | Number | Average Earnings |
| Male | 247 (32.1%) | $37,690 |
| Female | 523 (67.9%) | $17,607 |
| Total | 770 (100.0%) | $19,150 |
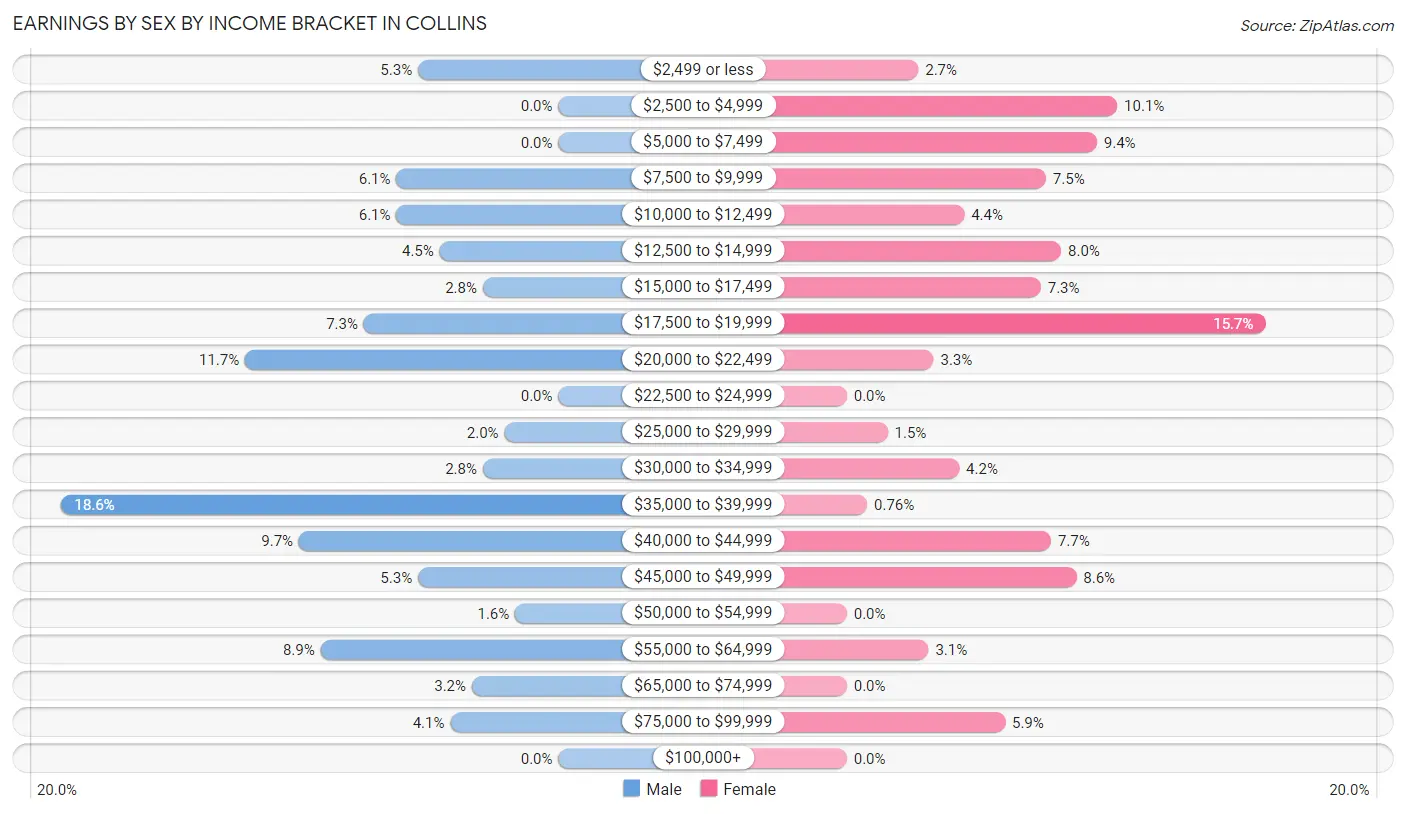
Earnings by Sex by Income Bracket in Collins
The most common earnings brackets in Collins are $35,000 to $39,999 for men (46 | 18.6%) and $17,500 to $19,999 for women (82 | 15.7%).
| Income | Male | Female |
| $2,499 or less | 13 (5.3%) | 14 (2.7%) |
| $2,500 to $4,999 | 0 (0.0%) | 53 (10.1%) |
| $5,000 to $7,499 | 0 (0.0%) | 49 (9.4%) |
| $7,500 to $9,999 | 15 (6.1%) | 39 (7.5%) |
| $10,000 to $12,499 | 15 (6.1%) | 23 (4.4%) |
| $12,500 to $14,999 | 11 (4.4%) | 42 (8.0%) |
| $15,000 to $17,499 | 7 (2.8%) | 38 (7.3%) |
| $17,500 to $19,999 | 18 (7.3%) | 82 (15.7%) |
| $20,000 to $22,499 | 29 (11.7%) | 17 (3.3%) |
| $22,500 to $24,999 | 0 (0.0%) | 0 (0.0%) |
| $25,000 to $29,999 | 5 (2.0%) | 8 (1.5%) |
| $30,000 to $34,999 | 7 (2.8%) | 22 (4.2%) |
| $35,000 to $39,999 | 46 (18.6%) | 4 (0.8%) |
| $40,000 to $44,999 | 24 (9.7%) | 40 (7.6%) |
| $45,000 to $49,999 | 13 (5.3%) | 45 (8.6%) |
| $50,000 to $54,999 | 4 (1.6%) | 0 (0.0%) |
| $55,000 to $64,999 | 22 (8.9%) | 16 (3.1%) |
| $65,000 to $74,999 | 8 (3.2%) | 0 (0.0%) |
| $75,000 to $99,999 | 10 (4.1%) | 31 (5.9%) |
| $100,000+ | 0 (0.0%) | 0 (0.0%) |
| Total | 247 (100.0%) | 523 (100.0%) |
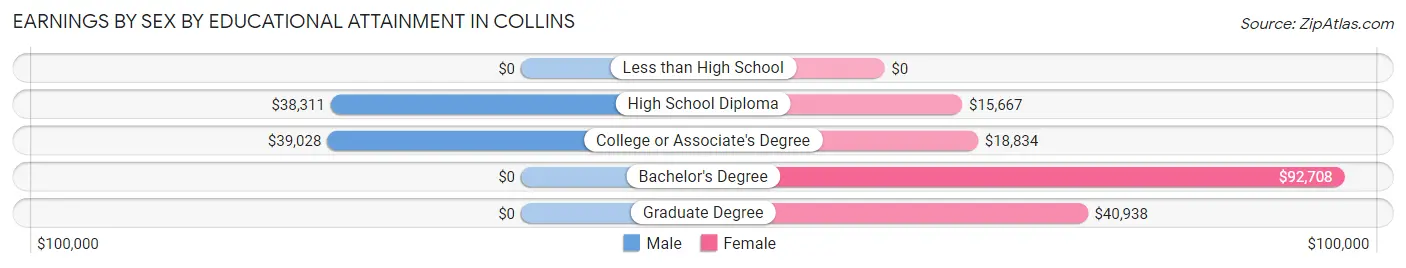
Earnings by Sex by Educational Attainment in Collins
Average earnings in Collins are $38,397 for men and $19,085 for women, a difference of 50.3%. Men with an educational attainment of college or associate's degree enjoy the highest average annual earnings of $39,028, while those with high school diploma education earn the least with $38,311. Women with an educational attainment of bachelor's degree earn the most with the average annual earnings of $92,708, while those with high school diploma education have the smallest earnings of $15,667.
| Educational Attainment | Male Income | Female Income |
| Less than High School | - | - |
| High School Diploma | $38,311 | $15,667 |
| College or Associate's Degree | $39,028 | $18,834 |
| Bachelor's Degree | - | - |
| Graduate Degree | - | - |
| Total | $38,397 | $19,085 |
Family Income in Collins
Family Income Brackets in Collins
According to the Collins family income data, there are 268 families falling into the $35,000 to $49,999 income range, which is the most common income bracket and makes up 51.6% of all families.
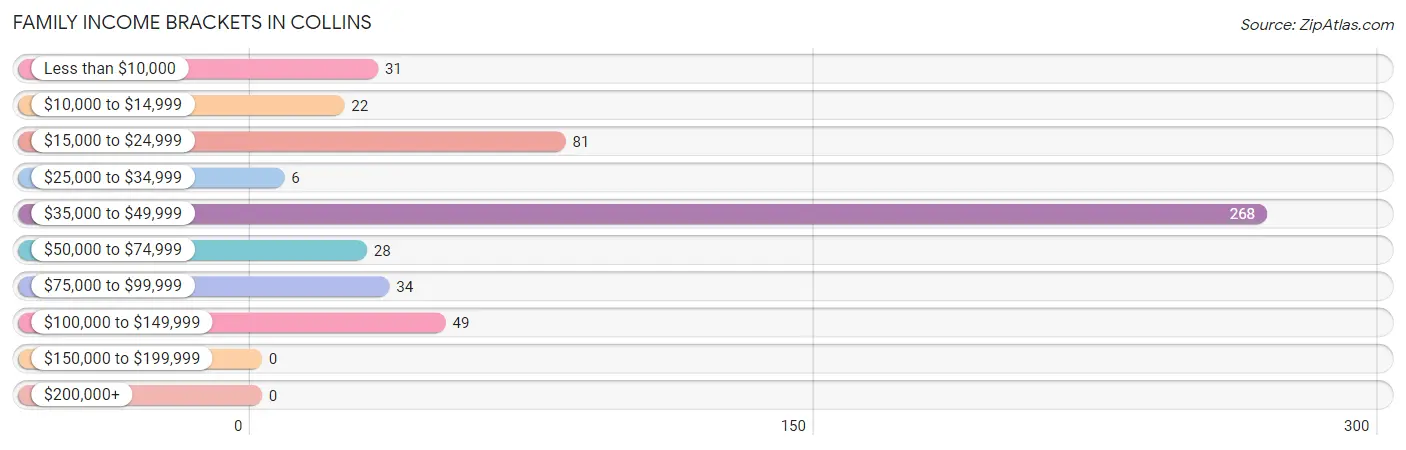
| Income Bracket | # Families | % Families |
| Less than $10,000 | 31 | 6.0% |
| $10,000 to $14,999 | 22 | 4.2% |
| $15,000 to $24,999 | 81 | 15.6% |
| $25,000 to $34,999 | 6 | 1.2% |
| $35,000 to $49,999 | 268 | 51.6% |
| $50,000 to $74,999 | 28 | 5.4% |
| $75,000 to $99,999 | 34 | 6.6% |
| $100,000 to $149,999 | 49 | 9.4% |
| $150,000 to $199,999 | 0 | 0.0% |
| $200,000+ | 0 | 0.0% |
Family Income by Famaliy Size in Collins
2-person families (307 | 59.2%) account for the highest median family income in Collins with $36,677 per family, while 2-person families (307 | 59.2%) have the highest median income of $18,338 per family member.
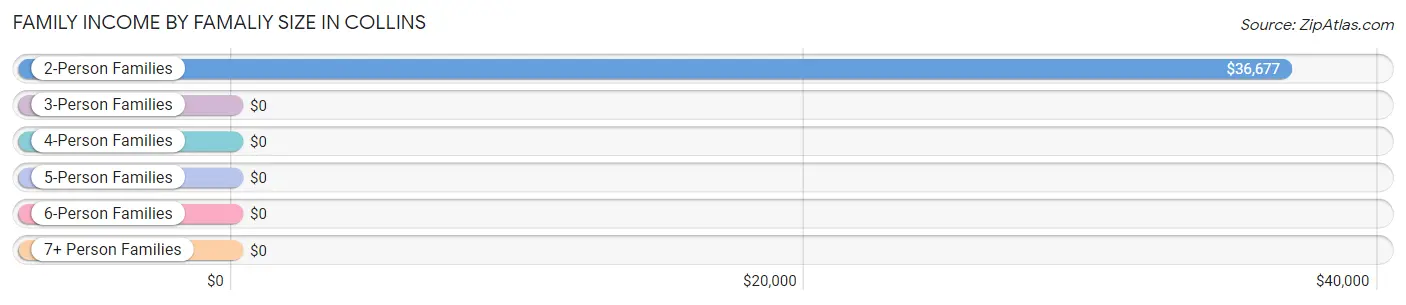
| Income Bracket | # Families | Median Income |
| 2-Person Families | 307 (59.2%) | $36,677 |
| 3-Person Families | 131 (25.2%) | $0 |
| 4-Person Families | 32 (6.2%) | $0 |
| 5-Person Families | 8 (1.5%) | $0 |
| 6-Person Families | 41 (7.9%) | $0 |
| 7+ Person Families | 0 (0.0%) | $0 |
| Total | 519 (100.0%) | $37,181 |
Family Income by Number of Earners in Collins
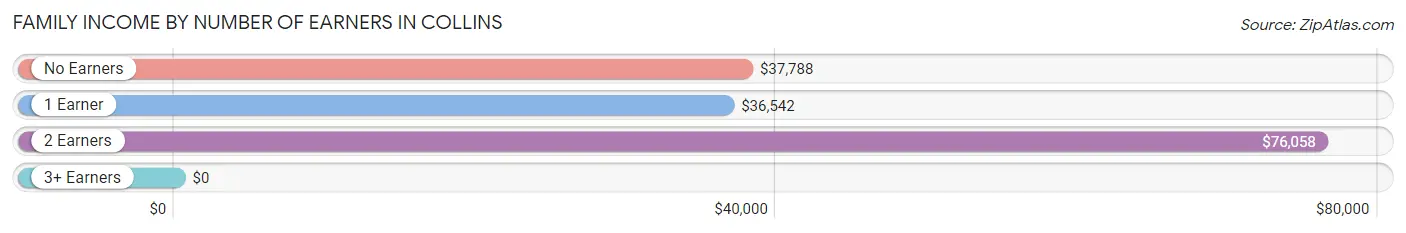
| Number of Earners | # Families | Median Income |
| No Earners | 76 (14.6%) | $37,788 |
| 1 Earner | 349 (67.2%) | $36,542 |
| 2 Earners | 63 (12.1%) | $76,058 |
| 3+ Earners | 31 (6.0%) | $0 |
| Total | 519 (100.0%) | $37,181 |
Household Income in Collins
Household Income Brackets in Collins
With 300 households falling in the category, the $35,000 to $49,999 income range is the most frequent in Collins, accounting for 35.5% of all households.
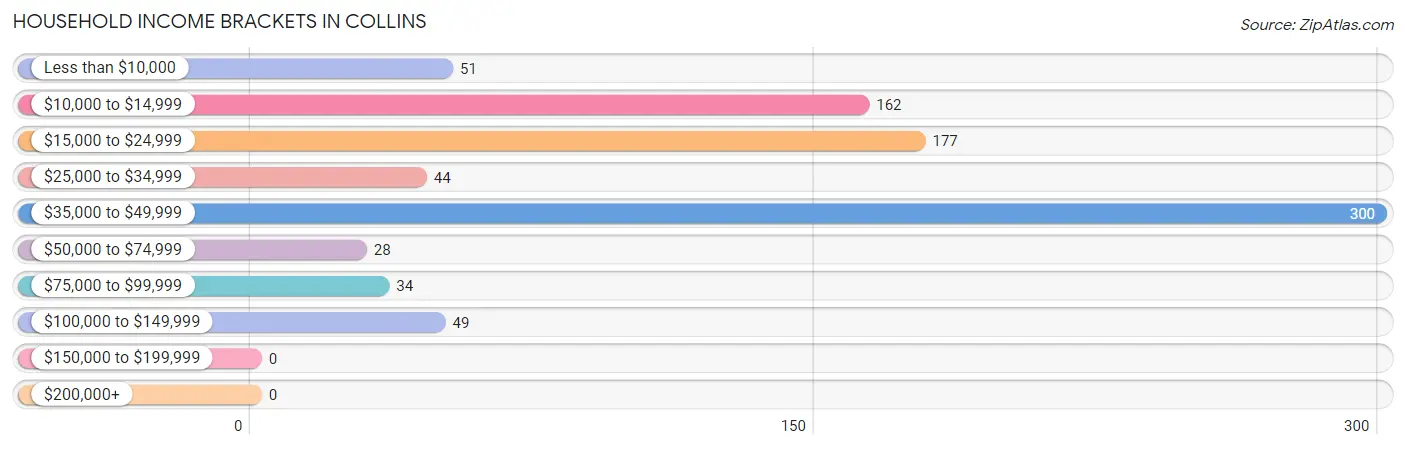
| Income Bracket | # Households | % Households |
| Less than $10,000 | 51 | 6.0% |
| $10,000 to $14,999 | 162 | 19.2% |
| $15,000 to $24,999 | 177 | 20.9% |
| $25,000 to $34,999 | 44 | 5.2% |
| $35,000 to $49,999 | 300 | 35.5% |
| $50,000 to $74,999 | 28 | 3.3% |
| $75,000 to $99,999 | 34 | 4.0% |
| $100,000 to $149,999 | 49 | 5.8% |
| $150,000 to $199,999 | 0 | 0.0% |
| $200,000+ | 0 | 0.0% |
Household Income by Householder Age in Collins
The median household income in Collins is $31,435, with the highest median household income of $38,026 found in the 25 to 44 years age bracket for the primary householder. A total of 126 households (14.9%) fall into this category. Meanwhile, the 15 to 24 years age bracket for the primary householder has the lowest median household income of $0, with 35 households (4.1%) in this group.
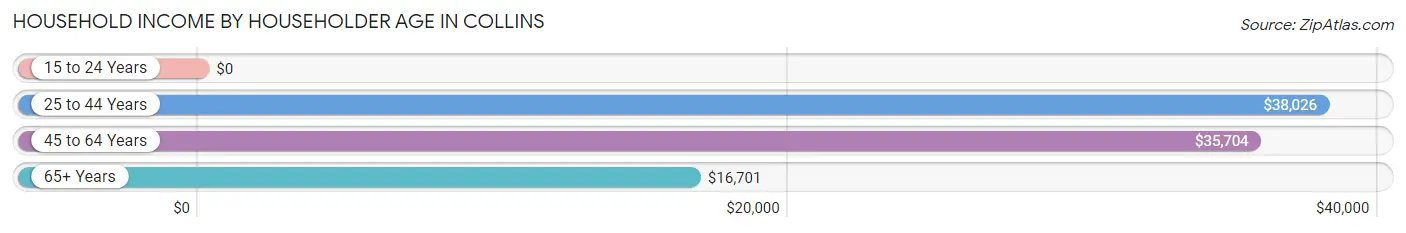
| Income Bracket | # Households | Median Income |
| 15 to 24 Years | 35 (4.1%) | $0 |
| 25 to 44 Years | 126 (14.9%) | $38,026 |
| 45 to 64 Years | 419 (49.6%) | $35,704 |
| 65+ Years | 265 (31.4%) | $16,701 |
| Total | 845 (100.0%) | $31,435 |
Poverty in Collins
Income Below Poverty by Sex and Age in Collins
With 33.5% poverty level for males and 43.8% for females among the residents of Collins, 15 year old males and 65 to 74 year old females are the most vulnerable to poverty, with 39 males (100.0%) and 98 females (73.7%) in their respective age groups living below the poverty level.
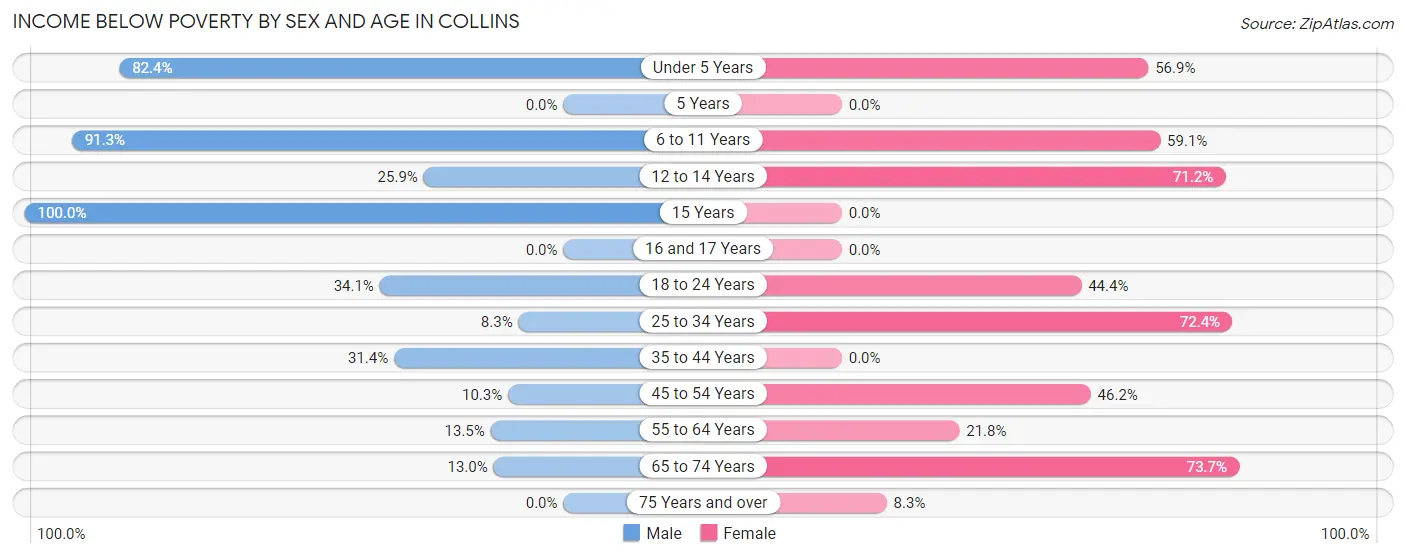
| Age Bracket | Male | Female |
| Under 5 Years | 61 (82.4%) | 62 (56.9%) |
| 5 Years | 0 (0.0%) | 0 (0.0%) |
| 6 to 11 Years | 73 (91.2%) | 13 (59.1%) |
| 12 to 14 Years | 14 (25.9%) | 37 (71.2%) |
| 15 Years | 39 (100.0%) | 0 (0.0%) |
| 16 and 17 Years | 0 (0.0%) | 0 (0.0%) |
| 18 to 24 Years | 15 (34.1%) | 76 (44.4%) |
| 25 to 34 Years | 6 (8.3%) | 63 (72.4%) |
| 35 to 44 Years | 33 (31.4%) | 0 (0.0%) |
| 45 to 54 Years | 4 (10.3%) | 91 (46.2%) |
| 55 to 64 Years | 32 (13.5%) | 41 (21.8%) |
| 65 to 74 Years | 7 (13.0%) | 98 (73.7%) |
| 75 Years and over | 0 (0.0%) | 10 (8.3%) |
| Total | 284 (33.5%) | 491 (43.8%) |
Income Above Poverty by Sex and Age in Collins
According to the poverty statistics in Collins, males aged 75 years and over and females aged 16 and 17 years are the age groups that are most secure financially, with 100.0% of males and 100.0% of females in these age groups living above the poverty line.
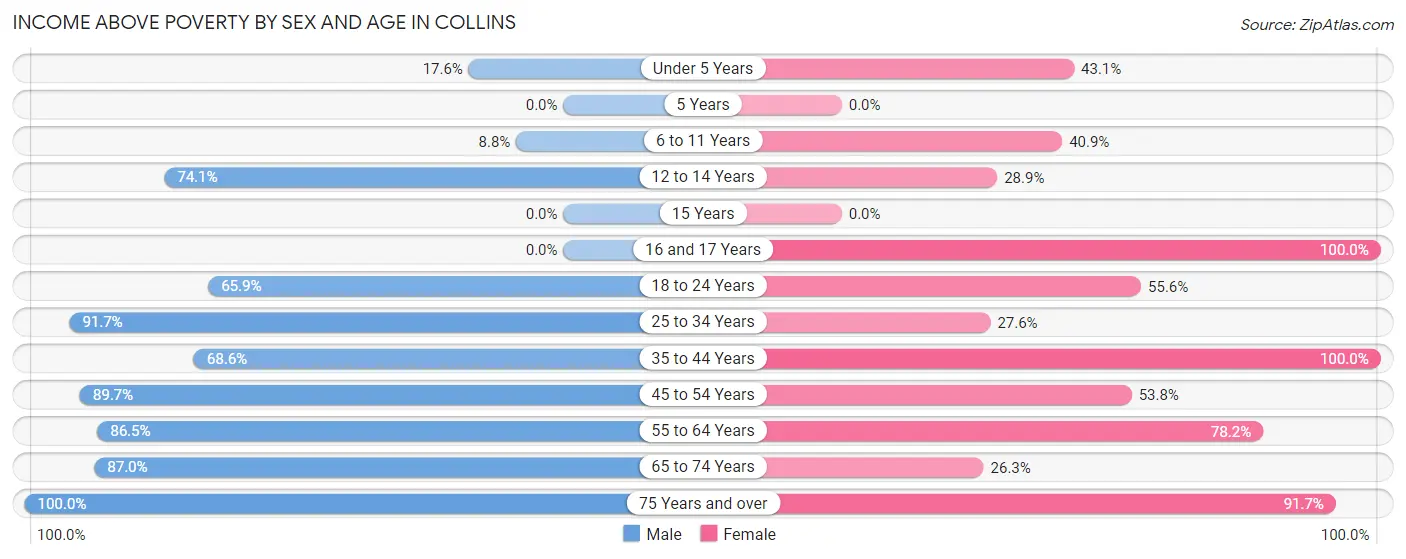
| Age Bracket | Male | Female |
| Under 5 Years | 13 (17.6%) | 47 (43.1%) |
| 5 Years | 0 (0.0%) | 0 (0.0%) |
| 6 to 11 Years | 7 (8.7%) | 9 (40.9%) |
| 12 to 14 Years | 40 (74.1%) | 15 (28.8%) |
| 15 Years | 0 (0.0%) | 0 (0.0%) |
| 16 and 17 Years | 0 (0.0%) | 2 (100.0%) |
| 18 to 24 Years | 29 (65.9%) | 95 (55.6%) |
| 25 to 34 Years | 66 (91.7%) | 24 (27.6%) |
| 35 to 44 Years | 72 (68.6%) | 41 (100.0%) |
| 45 to 54 Years | 35 (89.7%) | 106 (53.8%) |
| 55 to 64 Years | 205 (86.5%) | 147 (78.2%) |
| 65 to 74 Years | 47 (87.0%) | 35 (26.3%) |
| 75 Years and over | 51 (100.0%) | 110 (91.7%) |
| Total | 565 (66.5%) | 631 (56.2%) |
Income Below Poverty Among Married-Couple Families in Collins
The poverty statistics for married-couple families in Collins show that 19.2% or 65 of the total 339 families live below the poverty line. Families with 3 or 4 children have the highest poverty rate of 78.6%, comprising of 33 families. On the other hand, families with no children have the lowest poverty rate of 9.2%, which includes 24 families.
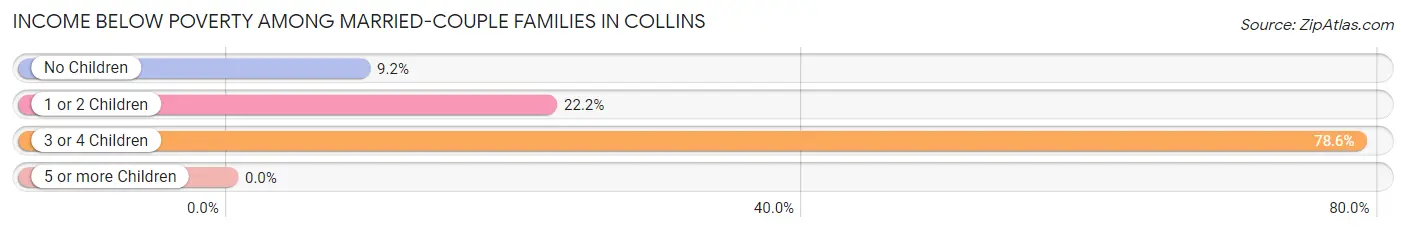
| Children | Above Poverty | Below Poverty |
| No Children | 237 (90.8%) | 24 (9.2%) |
| 1 or 2 Children | 28 (77.8%) | 8 (22.2%) |
| 3 or 4 Children | 9 (21.4%) | 33 (78.6%) |
| 5 or more Children | 0 (0.0%) | 0 (0.0%) |
| Total | 274 (80.8%) | 65 (19.2%) |
Income Below Poverty Among Single-Parent Households in Collins
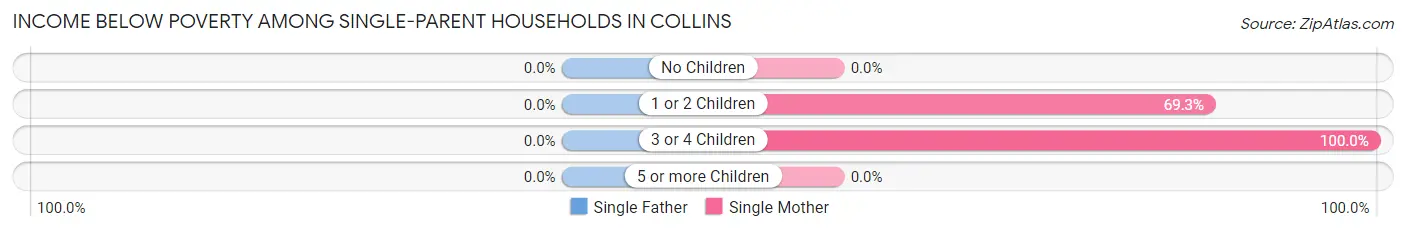
| Children | Single Father | Single Mother |
| No Children | 0 (0.0%) | 0 (0.0%) |
| 1 or 2 Children | 0 (0.0%) | 61 (69.3%) |
| 3 or 4 Children | 0 (0.0%) | 11 (100.0%) |
| 5 or more Children | 0 (0.0%) | 0 (0.0%) |
| Total | 0 (0.0%) | 72 (40.0%) |
Income Below Poverty Among Married-Couple vs Single-Parent Households in Collins
The poverty data for Collins shows that 65 of the married-couple family households (19.2%) and 72 of the single-parent households (40.0%) are living below the poverty level. Within the married-couple family households, those with 3 or 4 children have the highest poverty rate, with 33 households (78.6%) falling below the poverty line. Among the single-parent households, those with 3 or 4 children have the highest poverty rate, with 11 household (100.0%) living below poverty.
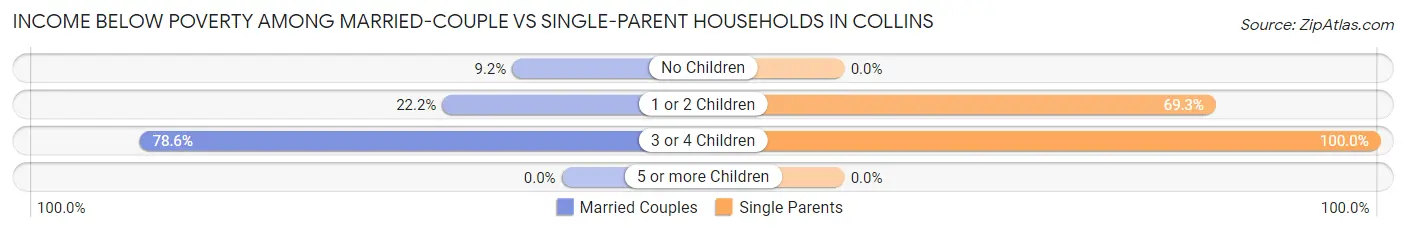
| Children | Married-Couple Families | Single-Parent Households |
| No Children | 24 (9.2%) | 0 (0.0%) |
| 1 or 2 Children | 8 (22.2%) | 61 (69.3%) |
| 3 or 4 Children | 33 (78.6%) | 11 (100.0%) |
| 5 or more Children | 0 (0.0%) | 0 (0.0%) |
| Total | 65 (19.2%) | 72 (40.0%) |
Race in Collins
The most populous races in Collins are Black / African American (1,077 | 47.4%), White / Caucasian (928 | 40.9%), and Two or more Races (230 | 10.1%).
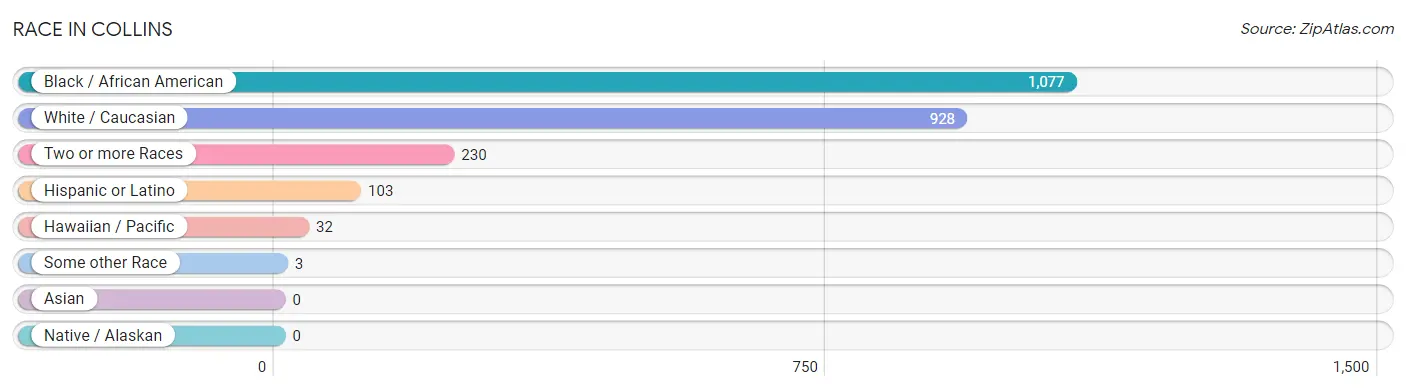
| Race | # Population | % Population |
| Asian | 0 | 0.0% |
| Black / African American | 1,077 | 47.4% |
| Hawaiian / Pacific | 32 | 1.4% |
| Hispanic or Latino | 103 | 4.5% |
| Native / Alaskan | 0 | 0.0% |
| White / Caucasian | 928 | 40.9% |
| Two or more Races | 230 | 10.1% |
| Some other Race | 3 | 0.1% |
| Total | 2,270 | 100.0% |
Ancestry in Collins
The most populous ancestries reported in Collins are American (230 | 10.1%), Native Hawaiian (202 | 8.9%), Irish (85 | 3.7%), Central American (66 | 2.9%), and Salvadoran (66 | 2.9%), together accounting for 28.6% of all Collins residents.
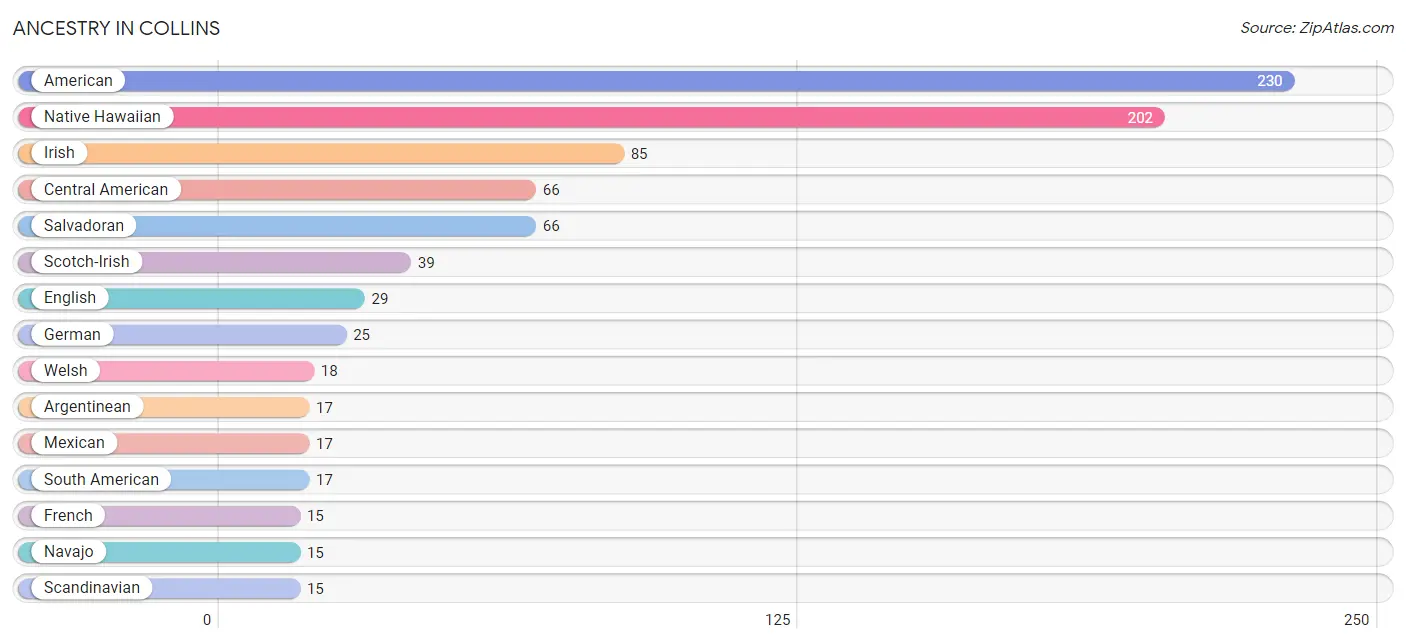
| Ancestry | # Population | % Population |
| American | 230 | 10.1% |
| Argentinean | 17 | 0.7% |
| British | 2 | 0.1% |
| Burmese | 8 | 0.4% |
| Central American | 66 | 2.9% |
| Cherokee | 8 | 0.4% |
| English | 29 | 1.3% |
| Ethiopian | 8 | 0.4% |
| French | 15 | 0.7% |
| German | 25 | 1.1% |
| Indian (Asian) | 8 | 0.4% |
| Irish | 85 | 3.7% |
| Japanese | 8 | 0.4% |
| Mexican | 17 | 0.7% |
| Native Hawaiian | 202 | 8.9% |
| Navajo | 15 | 0.7% |
| Salvadoran | 66 | 2.9% |
| Scandinavian | 15 | 0.7% |
| Scotch-Irish | 39 | 1.7% |
| Scottish | 4 | 0.2% |
| South American | 17 | 0.7% |
| Subsaharan African | 8 | 0.4% |
| Welsh | 18 | 0.8% | View All 23 Rows |
Immigrants in Collins
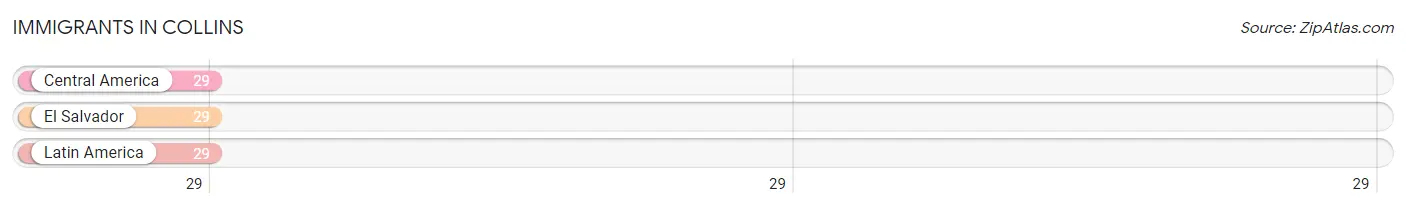
The most numerous immigrant groups reported in Collins came from Central America (29 | 1.3%), El Salvador (29 | 1.3%), and Latin America (29 | 1.3%), together accounting for 3.8% of all Collins residents.
| Immigration Origin | # Population | % Population |
| Central America | 29 | 1.3% |
| El Salvador | 29 | 1.3% |
| Latin America | 29 | 1.3% | View All 3 Rows |
Sex and Age in Collins
Sex and Age in Collins
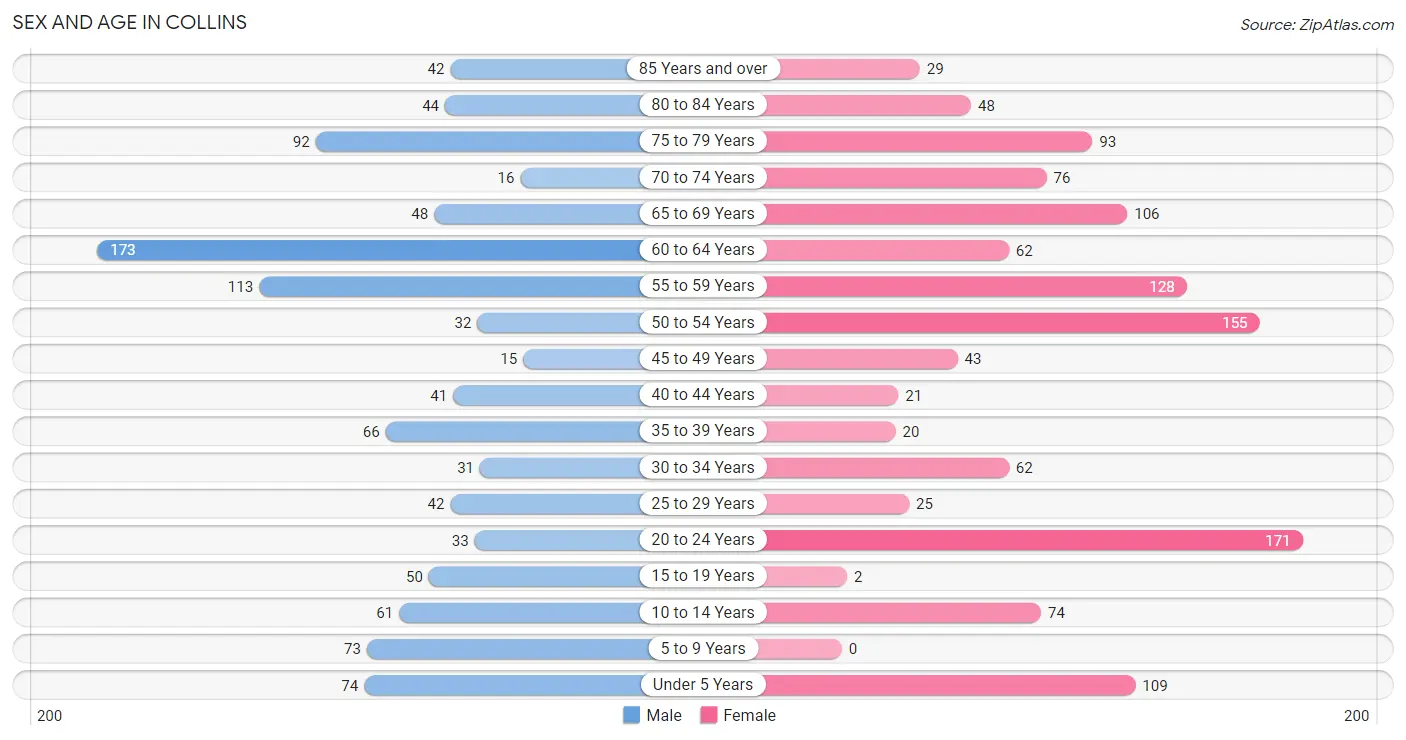
The most populous age groups in Collins are 60 to 64 Years (173 | 16.5%) for men and 20 to 24 Years (171 | 14.0%) for women.
| Age Bracket | Male | Female |
| Under 5 Years | 74 (7.1%) | 109 (8.9%) |
| 5 to 9 Years | 73 (7.0%) | 0 (0.0%) |
| 10 to 14 Years | 61 (5.8%) | 74 (6.0%) |
| 15 to 19 Years | 50 (4.8%) | 2 (0.2%) |
| 20 to 24 Years | 33 (3.2%) | 171 (14.0%) |
| 25 to 29 Years | 42 (4.0%) | 25 (2.0%) |
| 30 to 34 Years | 31 (3.0%) | 62 (5.1%) |
| 35 to 39 Years | 66 (6.3%) | 20 (1.6%) |
| 40 to 44 Years | 41 (3.9%) | 21 (1.7%) |
| 45 to 49 Years | 15 (1.4%) | 43 (3.5%) |
| 50 to 54 Years | 32 (3.1%) | 155 (12.7%) |
| 55 to 59 Years | 113 (10.8%) | 128 (10.5%) |
| 60 to 64 Years | 173 (16.5%) | 62 (5.1%) |
| 65 to 69 Years | 48 (4.6%) | 106 (8.7%) |
| 70 to 74 Years | 16 (1.5%) | 76 (6.2%) |
| 75 to 79 Years | 92 (8.8%) | 93 (7.6%) |
| 80 to 84 Years | 44 (4.2%) | 48 (3.9%) |
| 85 Years and over | 42 (4.0%) | 29 (2.4%) |
| Total | 1,046 (100.0%) | 1,224 (100.0%) |
Families and Households in Collins
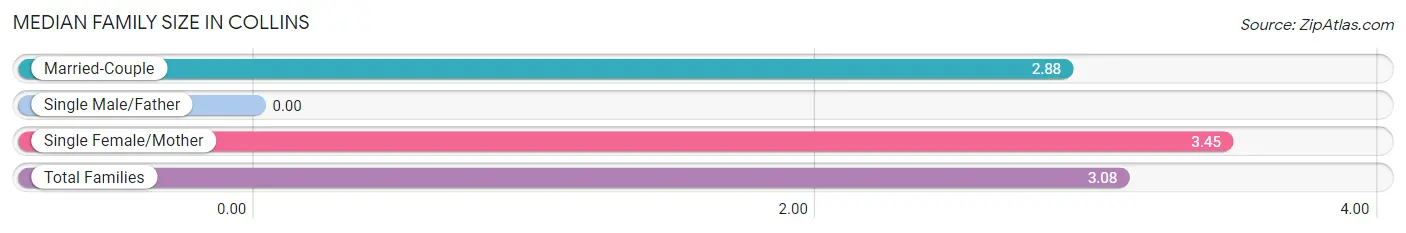
Median Family Size in Collins
| Family Type | # Families | Family Size |
| Married-Couple | 339 (65.3%) | 2.88 |
| Single Male/Father | 0 (0.0%) | - |
| Single Female/Mother | 180 (34.7%) | 3.45 |
| Total Families | 519 (100.0%) | 3.08 |
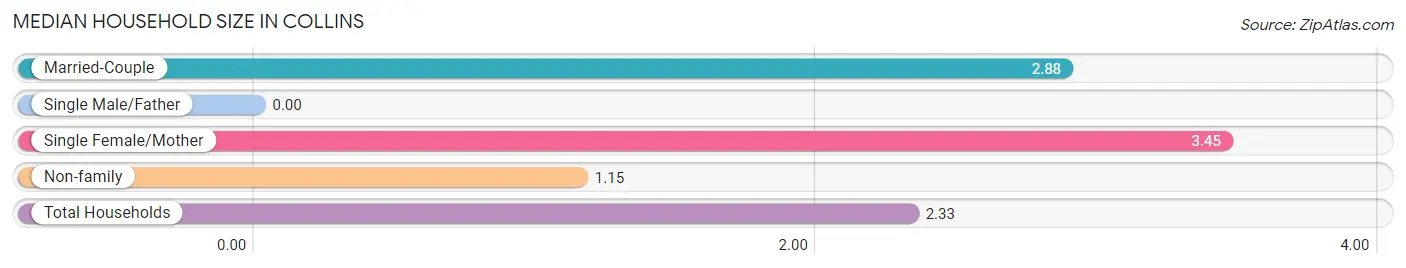
Median Household Size in Collins
| Household Type | # Households | Household Size |
| Married-Couple | 339 (40.1%) | 2.88 |
| Single Male/Father | 0 (0.0%) | - |
| Single Female/Mother | 180 (21.3%) | 3.45 |
| Non-family | 326 (38.6%) | 1.15 |
| Total Households | 845 (100.0%) | 2.33 |
Household Size by Marriage Status in Collins
Out of a total of 845 households in Collins, 519 (61.4%) are family households, while 326 (38.6%) are nonfamily households. The most numerous type of family households are 2-person households, comprising 307, and the most common type of nonfamily households are 1-person households, comprising 307.
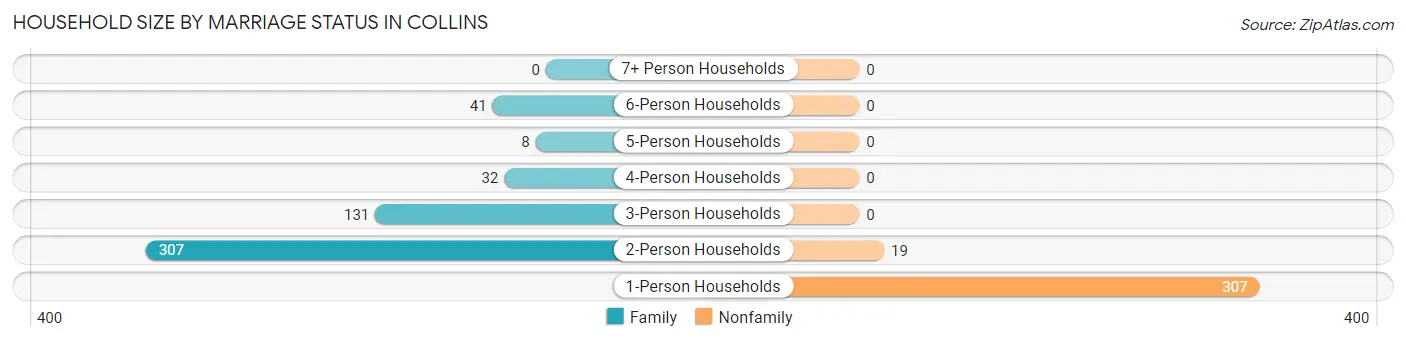
| Household Size | Family Households | Nonfamily Households |
| 1-Person Households | - | 307 (36.3%) |
| 2-Person Households | 307 (36.3%) | 19 (2.2%) |
| 3-Person Households | 131 (15.5%) | 0 (0.0%) |
| 4-Person Households | 32 (3.8%) | 0 (0.0%) |
| 5-Person Households | 8 (0.9%) | 0 (0.0%) |
| 6-Person Households | 41 (4.9%) | 0 (0.0%) |
| 7+ Person Households | 0 (0.0%) | 0 (0.0%) |
| Total | 519 (61.4%) | 326 (38.6%) |
Female Fertility in Collins
Fertility by Age in Collins
Average fertility rate in Collins is 273.0 births per 1,000 women. Women in the age bracket of 20 to 34 years have the highest fertility rate with 364.0 births per 1,000 women. Women in the age bracket of 20 to 34 years acount for 100.0% of all women with births.

| Age Bracket | Women with Births | Births / 1,000 Women |
| 15 to 19 years | 0 (0.0%) | 0.0 |
| 20 to 34 years | 94 (100.0%) | 364.0 |
| 35 to 50 years | 0 (0.0%) | 0.0 |
| Total | 94 (100.0%) | 273.0 |
Fertility by Age by Marriage Status in Collins
17.0% of women with births (94) in Collins are married. The highest percentage of unmarried women with births falls into 20 to 34 years age bracket with 83.0% of them unmarried at the time of birth, while the lowest percentage of unmarried women with births belong to 20 to 34 years age bracket with 83.0% of them unmarried.
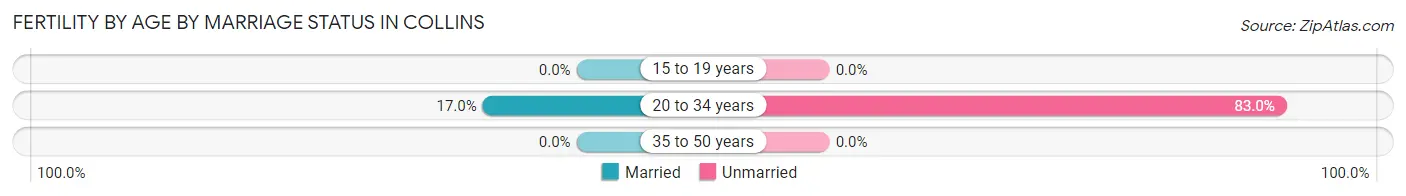
| Age Bracket | Married | Unmarried |
| 15 to 19 years | 0 (0.0%) | 0 (0.0%) |
| 20 to 34 years | 16 (17.0%) | 78 (83.0%) |
| 35 to 50 years | 0 (0.0%) | 0 (0.0%) |
| Total | 16 (17.0%) | 78 (83.0%) |
Fertility by Education in Collins
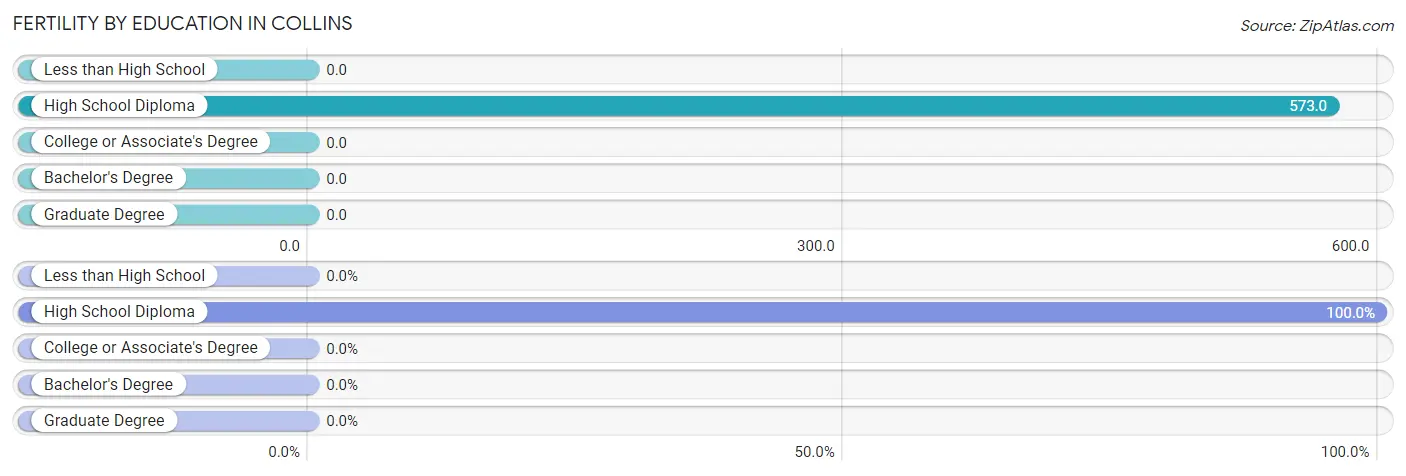
| Educational Attainment | Women with Births | Births / 1,000 Women |
| Less than High School | 0 (0.0%) | 0.0 |
| High School Diploma | 94 (100.0%) | 573.0 |
| College or Associate's Degree | 0 (0.0%) | 0.0 |
| Bachelor's Degree | 0 (0.0%) | 0.0 |
| Graduate Degree | 0 (0.0%) | 0.0 |
| Total | 94 (100.0%) | 273.0 |
Fertility by Education by Marriage Status in Collins
83.0% of women with births in Collins are unmarried. Women with the educational attainment of high school diploma are most likely to be married with 17.0% of them married at childbirth, while women with the educational attainment of high school diploma are least likely to be married with 83.0% of them unmarried at childbirth.
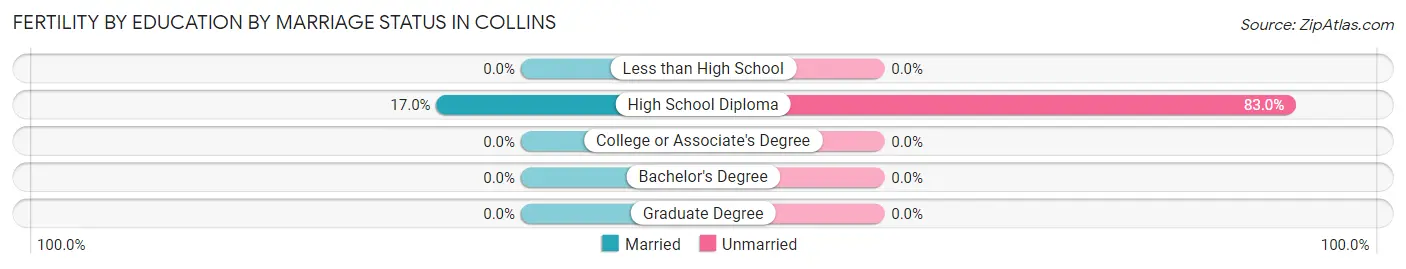
| Educational Attainment | Married | Unmarried |
| Less than High School | 0 (0.0%) | 0 (0.0%) |
| High School Diploma | 16 (17.0%) | 78 (83.0%) |
| College or Associate's Degree | 0 (0.0%) | 0 (0.0%) |
| Bachelor's Degree | 0 (0.0%) | 0 (0.0%) |
| Graduate Degree | 0 (0.0%) | 0 (0.0%) |
| Total | 16 (17.0%) | 78 (83.0%) |
Employment Characteristics in Collins
Employment by Class of Employer in Collins
Among the 667 employed individuals in Collins, private company employees (395 | 59.2%), not-for-profit organizations (103 | 15.4%), and state government employees (64 | 9.6%) make up the most common classes of employment.
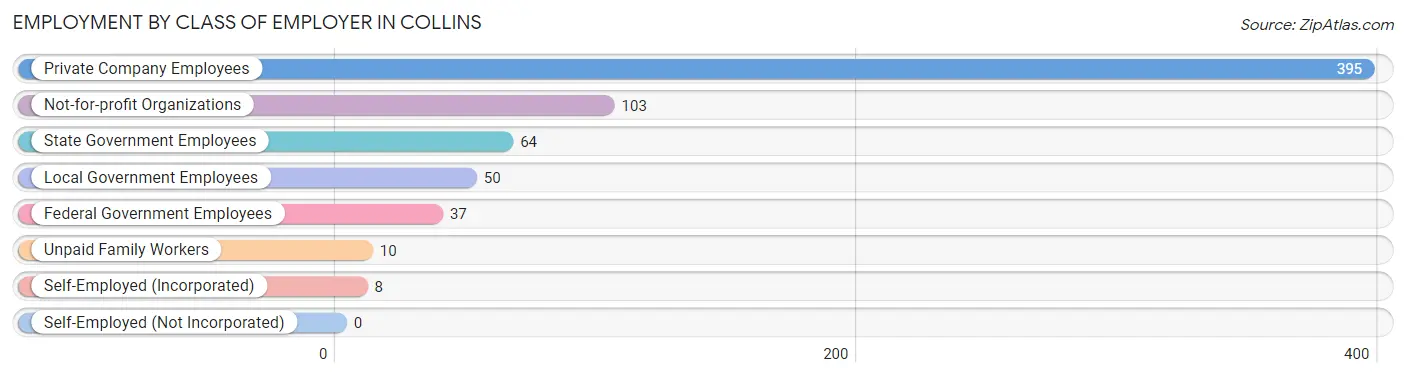
| Employer Class | # Employees | % Employees |
| Private Company Employees | 395 | 59.2% |
| Self-Employed (Incorporated) | 8 | 1.2% |
| Self-Employed (Not Incorporated) | 0 | 0.0% |
| Not-for-profit Organizations | 103 | 15.4% |
| Local Government Employees | 50 | 7.5% |
| State Government Employees | 64 | 9.6% |
| Federal Government Employees | 37 | 5.6% |
| Unpaid Family Workers | 10 | 1.5% |
| Total | 667 | 100.0% |
Employment Status by Age in Collins
According to the labor force statistics for Collins, out of the total population over 16 years of age (1,840), 41.4% or 762 individuals are in the labor force, with 13.0% or 99 of them unemployed. The age group with the highest labor force participation rate is 20 to 24 years, with 91.2% or 186 individuals in the labor force. Within the labor force, the 60 to 64 years age range has the highest percentage of unemployed individuals, with 50.0% or 14 of them being unemployed.
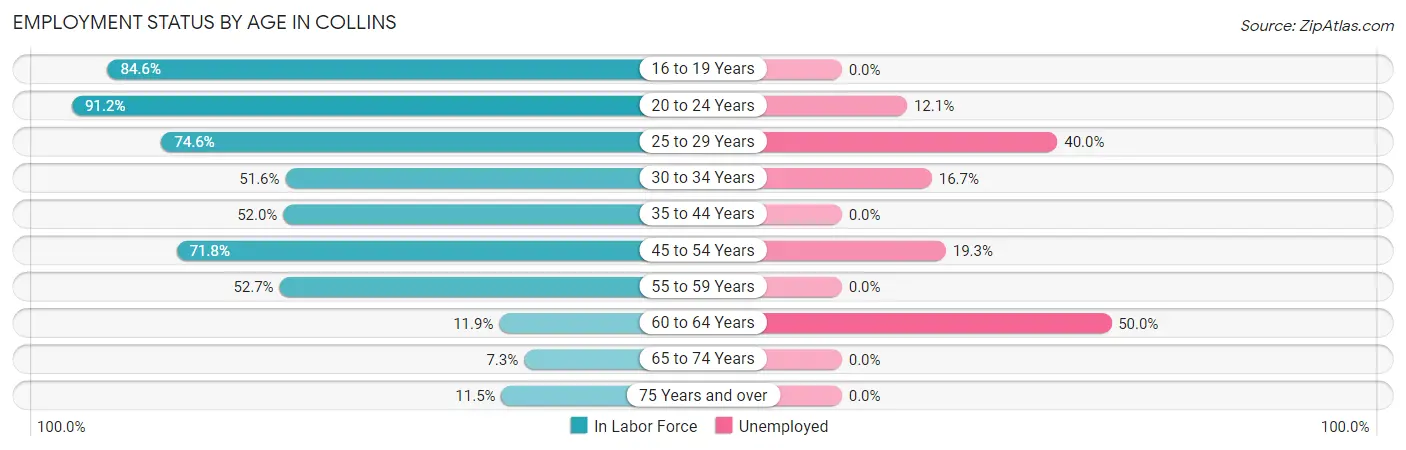
| Age Bracket | In Labor Force | Unemployed |
| 16 to 19 Years | 11 (84.6%) | 0 (0.0%) |
| 20 to 24 Years | 186 (91.2%) | 23 (12.1%) |
| 25 to 29 Years | 50 (74.6%) | 20 (40.0%) |
| 30 to 34 Years | 48 (51.6%) | 8 (16.7%) |
| 35 to 44 Years | 77 (52.0%) | 0 (0.0%) |
| 45 to 54 Years | 176 (71.8%) | 34 (19.3%) |
| 55 to 59 Years | 127 (52.7%) | 0 (0.0%) |
| 60 to 64 Years | 28 (11.9%) | 14 (50.0%) |
| 65 to 74 Years | 18 (7.3%) | 0 (0.0%) |
| 75 Years and over | 40 (11.5%) | 0 (0.0%) |
| Total | 762 (41.4%) | 99 (13.0%) |
Employment Status by Educational Attainment in Collins
According to labor force statistics for Collins, 49.2% of individuals (506) out of the total population between 25 and 64 years of age (1,029) are in the labor force, with 15.0% or 76 of them being unemployed. The group with the highest labor force participation rate are those with the educational attainment of bachelor's degree or higher, with 78.9% or 97 individuals in the labor force. Within the labor force, individuals with high school diploma education have the highest percentage of unemployment, with 30.8% or 60 of them being unemployed.
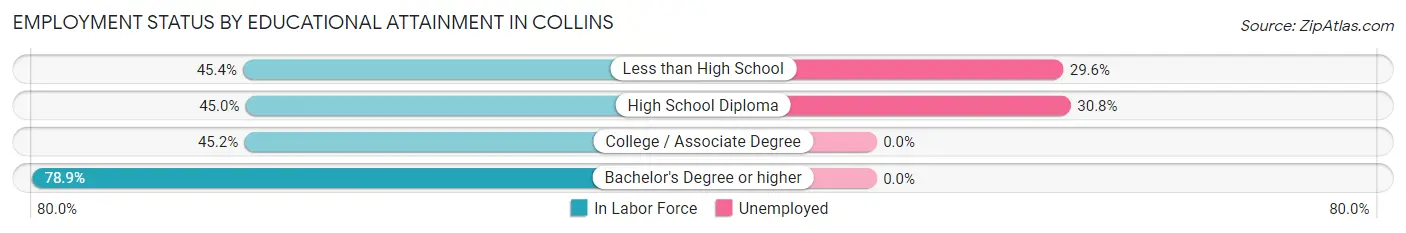
| Educational Attainment | In Labor Force | Unemployed |
| Less than High School | 54 (45.4%) | 35 (29.6%) |
| High School Diploma | 195 (45.0%) | 133 (30.8%) |
| College / Associate Degree | 160 (45.2%) | 0 (0.0%) |
| Bachelor's Degree or higher | 97 (78.9%) | 0 (0.0%) |
| Total | 506 (49.2%) | 154 (15.0%) |
Employment Occupations by Sex in Collins
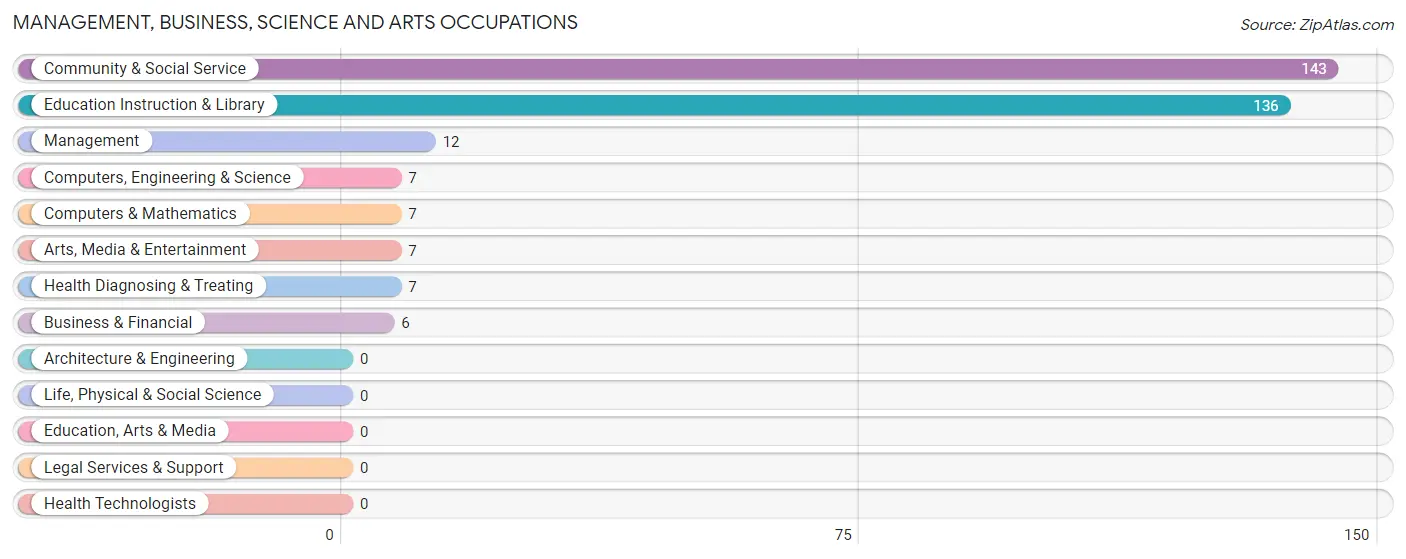
Management, Business, Science and Arts Occupations
The most common Management, Business, Science and Arts occupations in Collins are Community & Social Service (143 | 22.7%), Education Instruction & Library (136 | 21.6%), Management (12 | 1.9%), Computers, Engineering & Science (7 | 1.1%), and Computers & Mathematics (7 | 1.1%).
Management, Business, Science and Arts Occupations by Sex
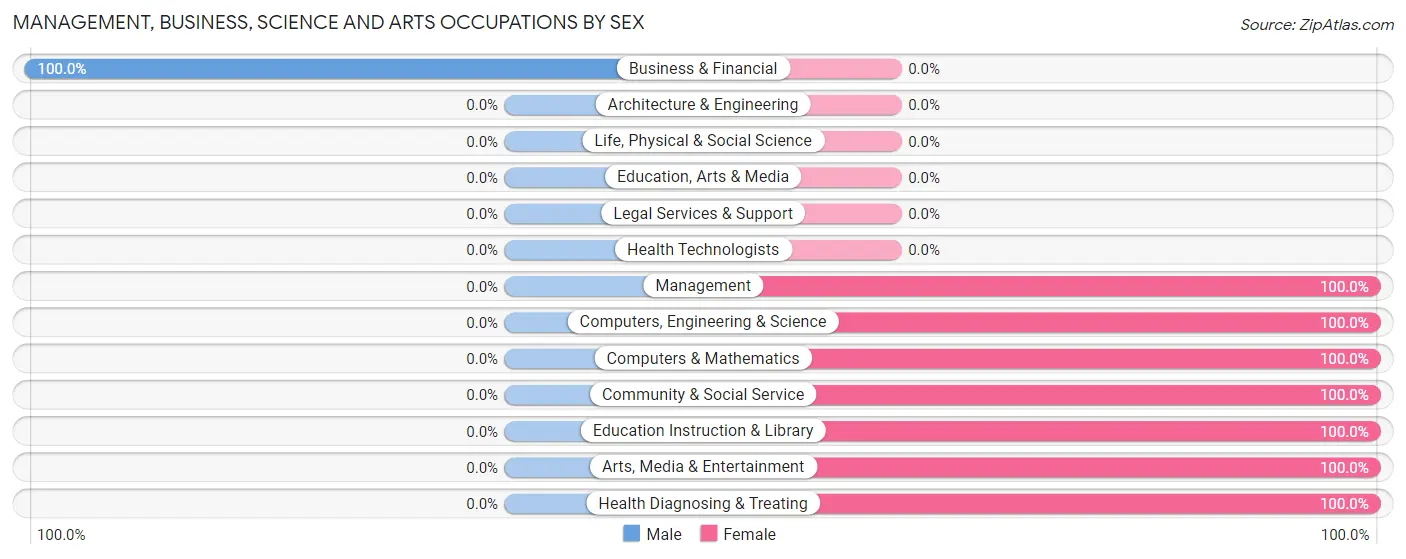
| Occupation | Male | Female |
| Management | 0 (0.0%) | 12 (100.0%) |
| Business & Financial | 6 (100.0%) | 0 (0.0%) |
| Computers, Engineering & Science | 0 (0.0%) | 7 (100.0%) |
| Computers & Mathematics | 0 (0.0%) | 7 (100.0%) |
| Architecture & Engineering | 0 (0.0%) | 0 (0.0%) |
| Life, Physical & Social Science | 0 (0.0%) | 0 (0.0%) |
| Community & Social Service | 0 (0.0%) | 143 (100.0%) |
| Education, Arts & Media | 0 (0.0%) | 0 (0.0%) |
| Legal Services & Support | 0 (0.0%) | 0 (0.0%) |
| Education Instruction & Library | 0 (0.0%) | 136 (100.0%) |
| Arts, Media & Entertainment | 0 (0.0%) | 7 (100.0%) |
| Health Diagnosing & Treating | 0 (0.0%) | 7 (100.0%) |
| Health Technologists | 0 (0.0%) | 0 (0.0%) |
| Total (Category) | 6 (3.4%) | 169 (96.6%) |
| Total (Overall) | 229 (36.3%) | 401 (63.6%) |
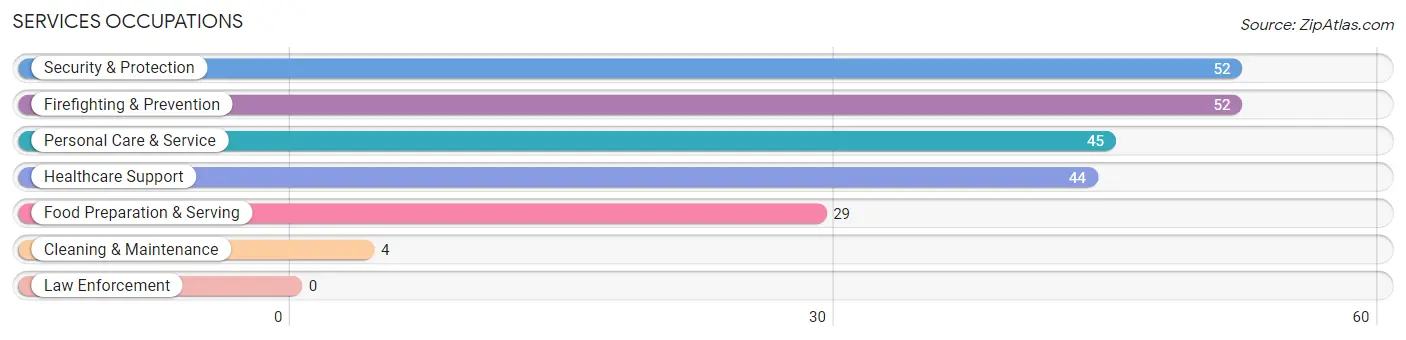
Services Occupations
The most common Services occupations in Collins are Security & Protection (52 | 8.3%), Firefighting & Prevention (52 | 8.3%), Personal Care & Service (45 | 7.1%), Healthcare Support (44 | 7.0%), and Food Preparation & Serving (29 | 4.6%).
Services Occupations by Sex
Within the Services occupations in Collins, the most male-oriented occupations are Cleaning & Maintenance (75.0%), Security & Protection (26.9%), and Firefighting & Prevention (26.9%), while the most female-oriented occupations are Healthcare Support (100.0%), Food Preparation & Serving (100.0%), and Personal Care & Service (100.0%).
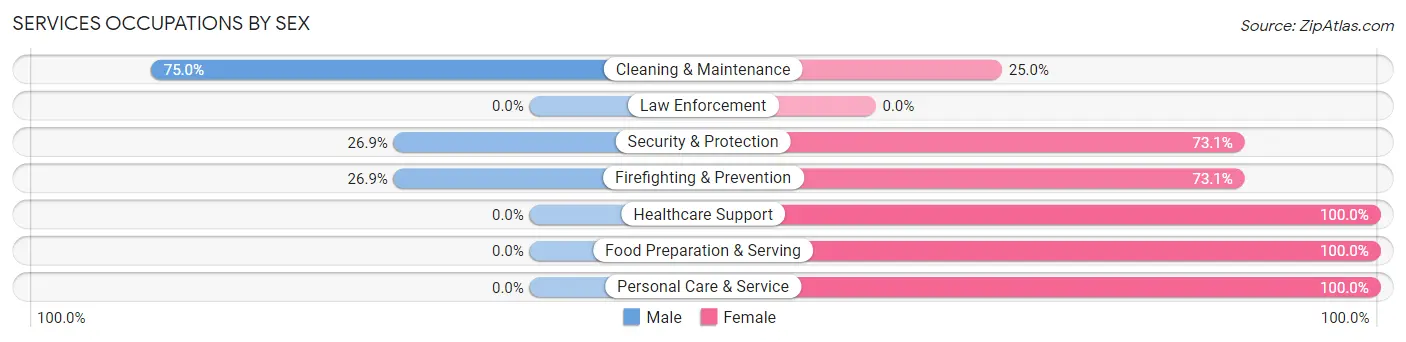
| Occupation | Male | Female |
| Healthcare Support | 0 (0.0%) | 44 (100.0%) |
| Security & Protection | 14 (26.9%) | 38 (73.1%) |
| Firefighting & Prevention | 14 (26.9%) | 38 (73.1%) |
| Law Enforcement | 0 (0.0%) | 0 (0.0%) |
| Food Preparation & Serving | 0 (0.0%) | 29 (100.0%) |
| Cleaning & Maintenance | 3 (75.0%) | 1 (25.0%) |
| Personal Care & Service | 0 (0.0%) | 45 (100.0%) |
| Total (Category) | 17 (9.8%) | 157 (90.2%) |
| Total (Overall) | 229 (36.3%) | 401 (63.6%) |
Sales and Office Occupations
The most common Sales and Office occupations in Collins are Sales & Related (32 | 5.1%), and Office & Administration (5 | 0.8%).
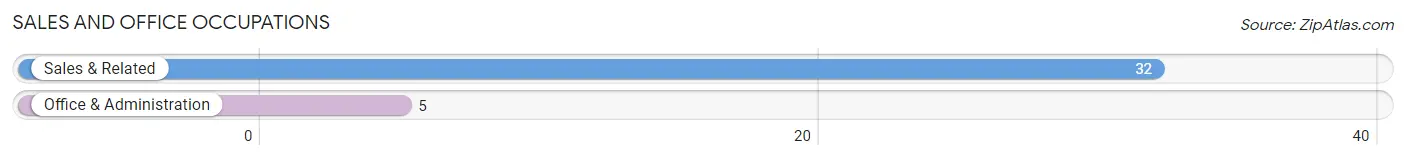
Sales and Office Occupations by Sex
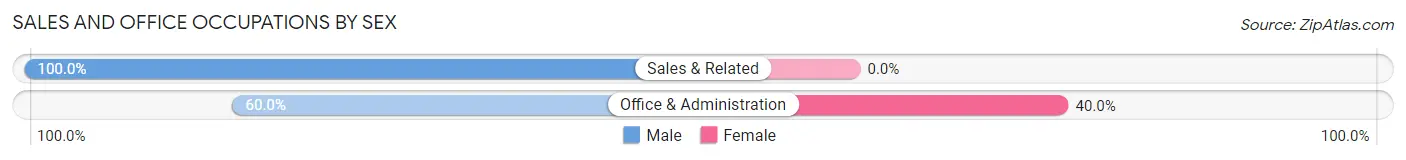
| Occupation | Male | Female |
| Sales & Related | 32 (100.0%) | 0 (0.0%) |
| Office & Administration | 3 (60.0%) | 2 (40.0%) |
| Total (Category) | 35 (94.6%) | 2 (5.4%) |
| Total (Overall) | 229 (36.3%) | 401 (63.6%) |
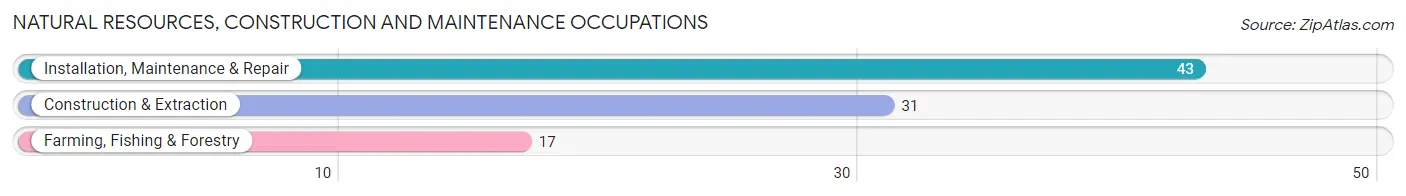
Natural Resources, Construction and Maintenance Occupations
The most common Natural Resources, Construction and Maintenance occupations in Collins are Installation, Maintenance & Repair (43 | 6.8%), Construction & Extraction (31 | 4.9%), and Farming, Fishing & Forestry (17 | 2.7%).
Natural Resources, Construction and Maintenance Occupations by Sex
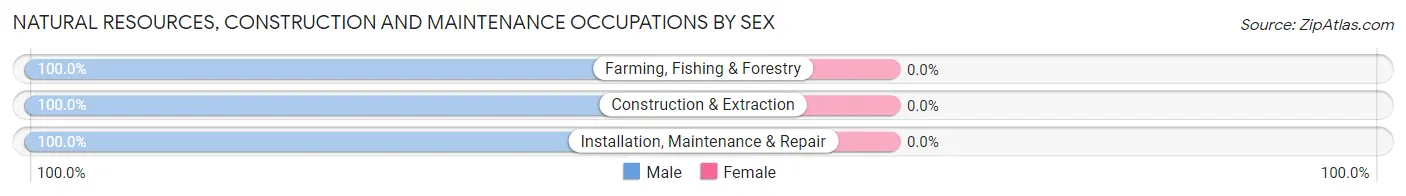
| Occupation | Male | Female |
| Farming, Fishing & Forestry | 17 (100.0%) | 0 (0.0%) |
| Construction & Extraction | 31 (100.0%) | 0 (0.0%) |
| Installation, Maintenance & Repair | 43 (100.0%) | 0 (0.0%) |
| Total (Category) | 91 (100.0%) | 0 (0.0%) |
| Total (Overall) | 229 (36.3%) | 401 (63.6%) |
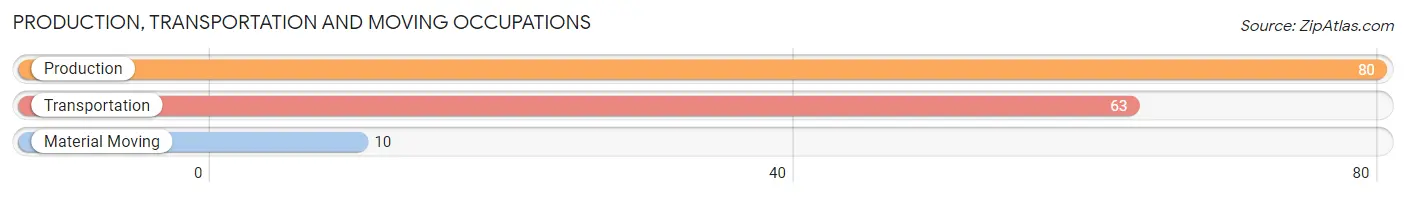
Production, Transportation and Moving Occupations
The most common Production, Transportation and Moving occupations in Collins are Production (80 | 12.7%), Transportation (63 | 10.0%), and Material Moving (10 | 1.6%).
Production, Transportation and Moving Occupations by Sex
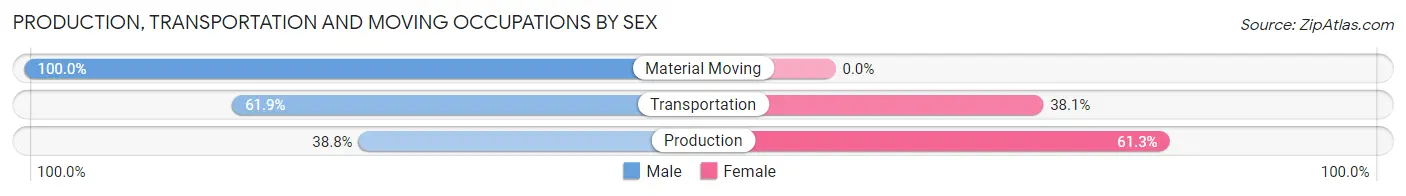
| Occupation | Male | Female |
| Production | 31 (38.8%) | 49 (61.3%) |
| Transportation | 39 (61.9%) | 24 (38.1%) |
| Material Moving | 10 (100.0%) | 0 (0.0%) |
| Total (Category) | 80 (52.3%) | 73 (47.7%) |
| Total (Overall) | 229 (36.3%) | 401 (63.6%) |
Employment Industries by Sex in Collins
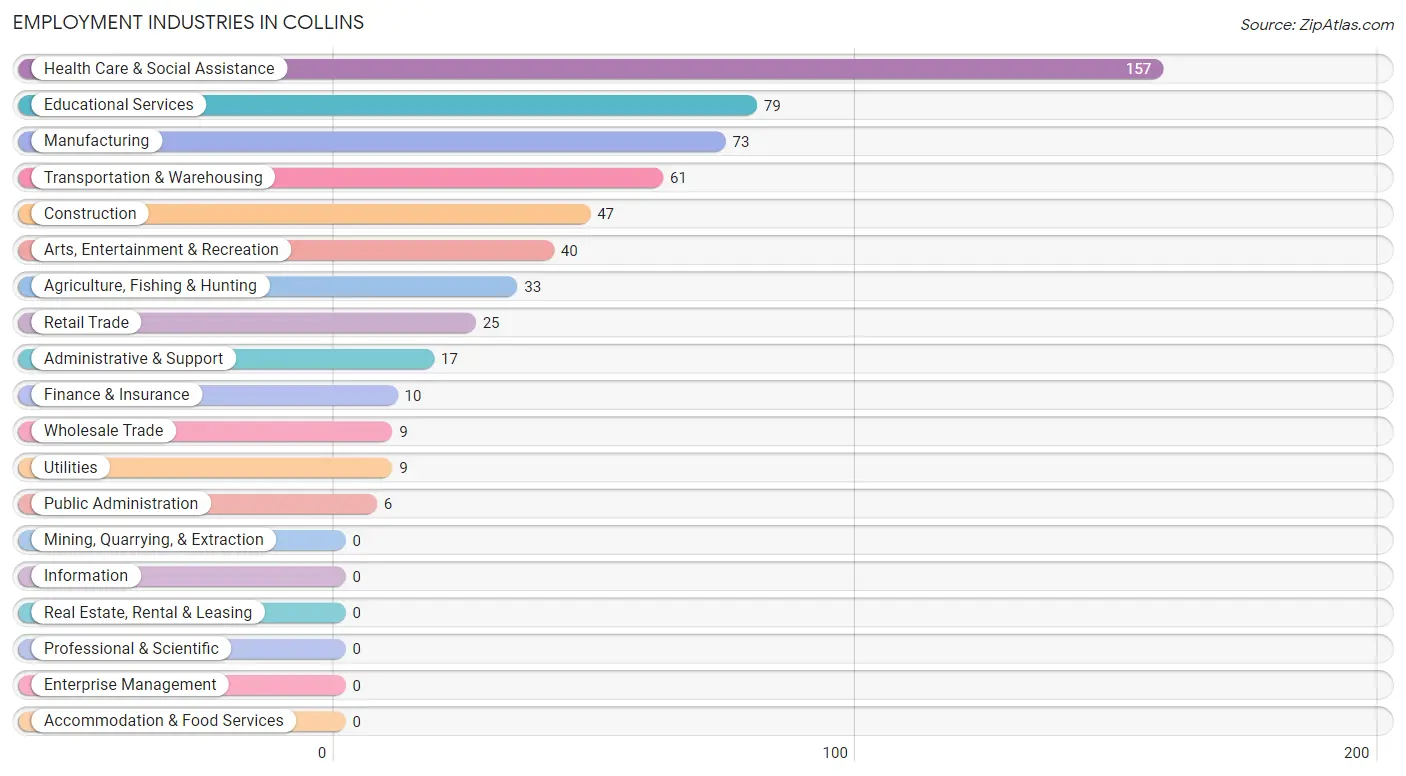
Employment Industries in Collins
The major employment industries in Collins include Health Care & Social Assistance (157 | 24.9%), Educational Services (79 | 12.5%), Manufacturing (73 | 11.6%), Transportation & Warehousing (61 | 9.7%), and Construction (47 | 7.5%).
Employment Industries by Sex in Collins
The Collins industries that see more men than women are Agriculture, Fishing & Hunting (100.0%), Wholesale Trade (100.0%), and Retail Trade (100.0%), whereas the industries that tend to have a higher number of women are Administrative & Support (100.0%), Health Care & Social Assistance (94.3%), and Arts, Entertainment & Recreation (92.5%).
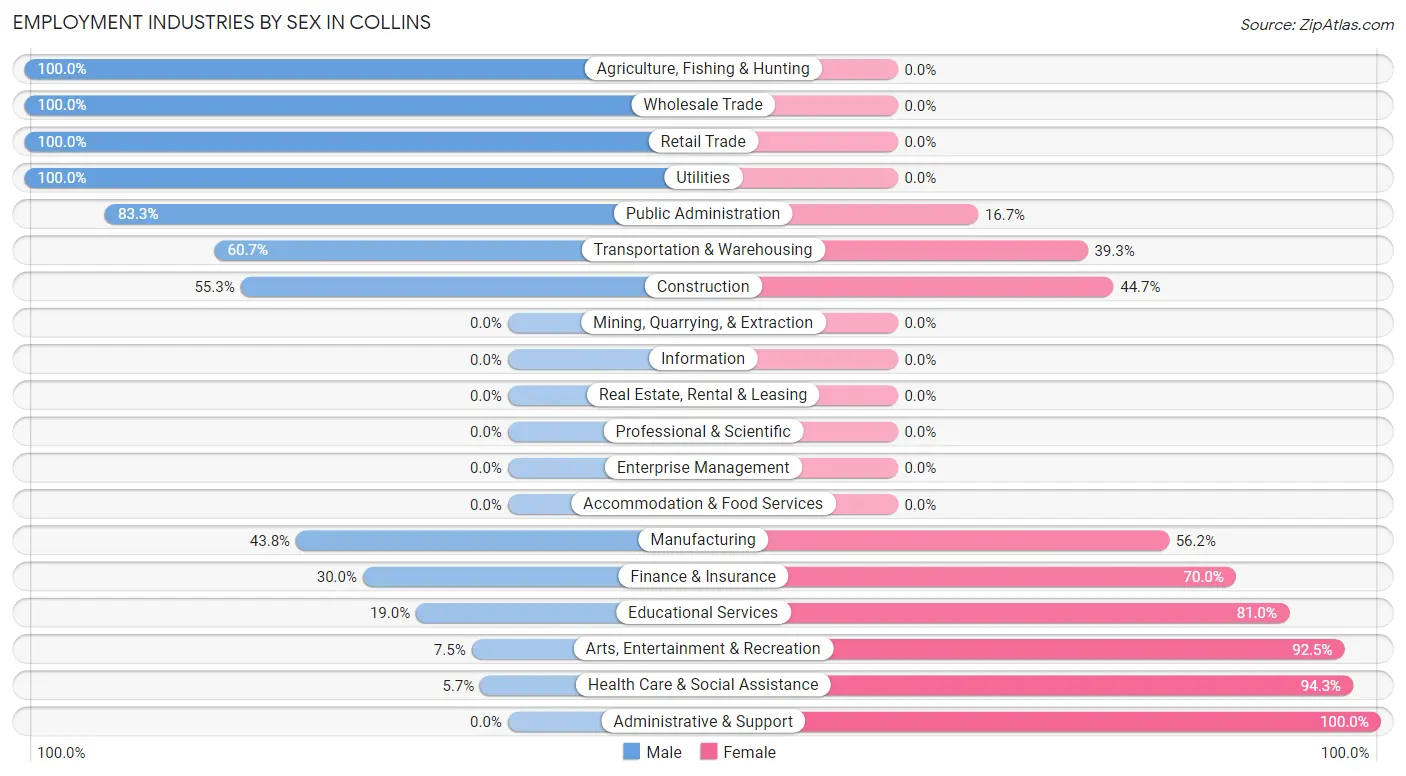
| Industry | Male | Female |
| Agriculture, Fishing & Hunting | 33 (100.0%) | 0 (0.0%) |
| Mining, Quarrying, & Extraction | 0 (0.0%) | 0 (0.0%) |
| Construction | 26 (55.3%) | 21 (44.7%) |
| Manufacturing | 32 (43.8%) | 41 (56.2%) |
| Wholesale Trade | 9 (100.0%) | 0 (0.0%) |
| Retail Trade | 25 (100.0%) | 0 (0.0%) |
| Transportation & Warehousing | 37 (60.7%) | 24 (39.3%) |
| Utilities | 9 (100.0%) | 0 (0.0%) |
| Information | 0 (0.0%) | 0 (0.0%) |
| Finance & Insurance | 3 (30.0%) | 7 (70.0%) |
| Real Estate, Rental & Leasing | 0 (0.0%) | 0 (0.0%) |
| Professional & Scientific | 0 (0.0%) | 0 (0.0%) |
| Enterprise Management | 0 (0.0%) | 0 (0.0%) |
| Administrative & Support | 0 (0.0%) | 17 (100.0%) |
| Educational Services | 15 (19.0%) | 64 (81.0%) |
| Health Care & Social Assistance | 9 (5.7%) | 148 (94.3%) |
| Arts, Entertainment & Recreation | 3 (7.5%) | 37 (92.5%) |
| Accommodation & Food Services | 0 (0.0%) | 0 (0.0%) |
| Public Administration | 5 (83.3%) | 1 (16.7%) |
| Total | 229 (36.3%) | 401 (63.6%) |
Education in Collins
School Enrollment in Collins
The most common levels of schooling among the 322 students in Collins are middle school (101 | 31.4%), college / undergraduate (98 | 30.4%), and elementary school (75 | 23.3%).
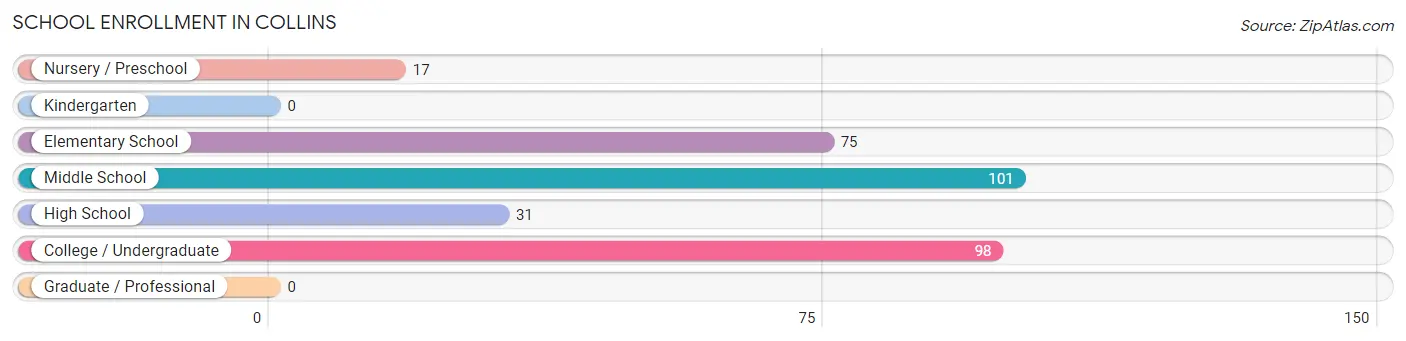
| School Level | # Students | % Students |
| Nursery / Preschool | 17 | 5.3% |
| Kindergarten | 0 | 0.0% |
| Elementary School | 75 | 23.3% |
| Middle School | 101 | 31.4% |
| High School | 31 | 9.6% |
| College / Undergraduate | 98 | 30.4% |
| Graduate / Professional | 0 | 0.0% |
| Total | 322 | 100.0% |
School Enrollment by Age by Funding Source in Collins
Out of a total of 322 students who are enrolled in schools in Collins, 70 (21.7%) attend a private institution, while the remaining 252 (78.3%) are enrolled in public schools. The age group of 3 to 4 year olds has the highest likelihood of being enrolled in private schools, with 17 (100.0% in the age bracket) enrolled. Conversely, the age group of 5 to 9 year old has the lowest likelihood of being enrolled in a private school, with 68 (100.0% in the age bracket) attending a public institution.
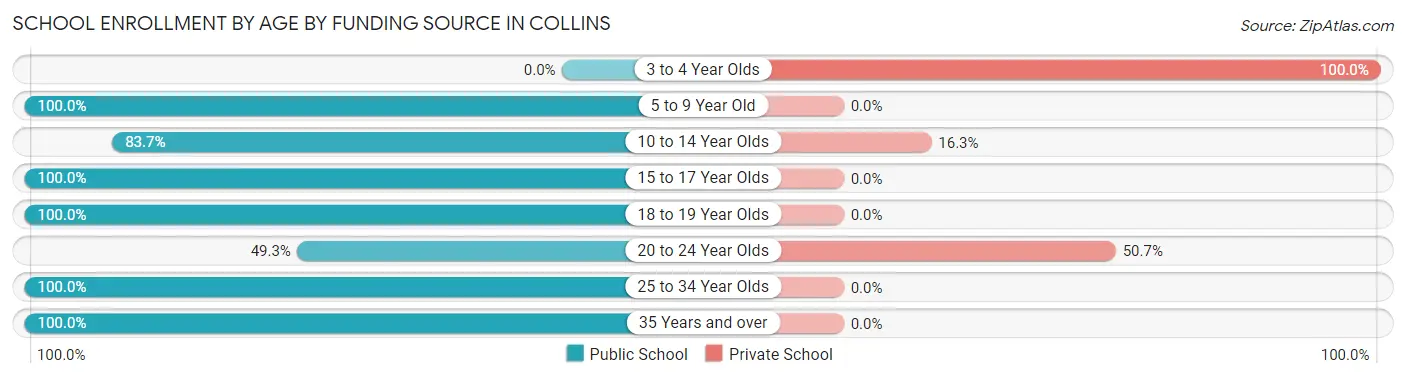
| Age Bracket | Public School | Private School |
| 3 to 4 Year Olds | 0 (0.0%) | 17 (100.0%) |
| 5 to 9 Year Old | 68 (100.0%) | 0 (0.0%) |
| 10 to 14 Year Olds | 82 (83.7%) | 16 (16.3%) |
| 15 to 17 Year Olds | 41 (100.0%) | 0 (0.0%) |
| 18 to 19 Year Olds | 3 (100.0%) | 0 (0.0%) |
| 20 to 24 Year Olds | 36 (49.3%) | 37 (50.7%) |
| 25 to 34 Year Olds | 8 (100.0%) | 0 (0.0%) |
| 35 Years and over | 14 (100.0%) | 0 (0.0%) |
| Total | 252 (78.3%) | 70 (21.7%) |
Educational Attainment by Field of Study in Collins
Education (81 | 34.9%), communications (47 | 20.3%), business (35 | 15.1%), bio, nature & agricultural (16 | 6.9%), and literature & languages (12 | 5.2%) are the most common fields of study among 232 individuals in Collins who have obtained a bachelor's degree or higher.
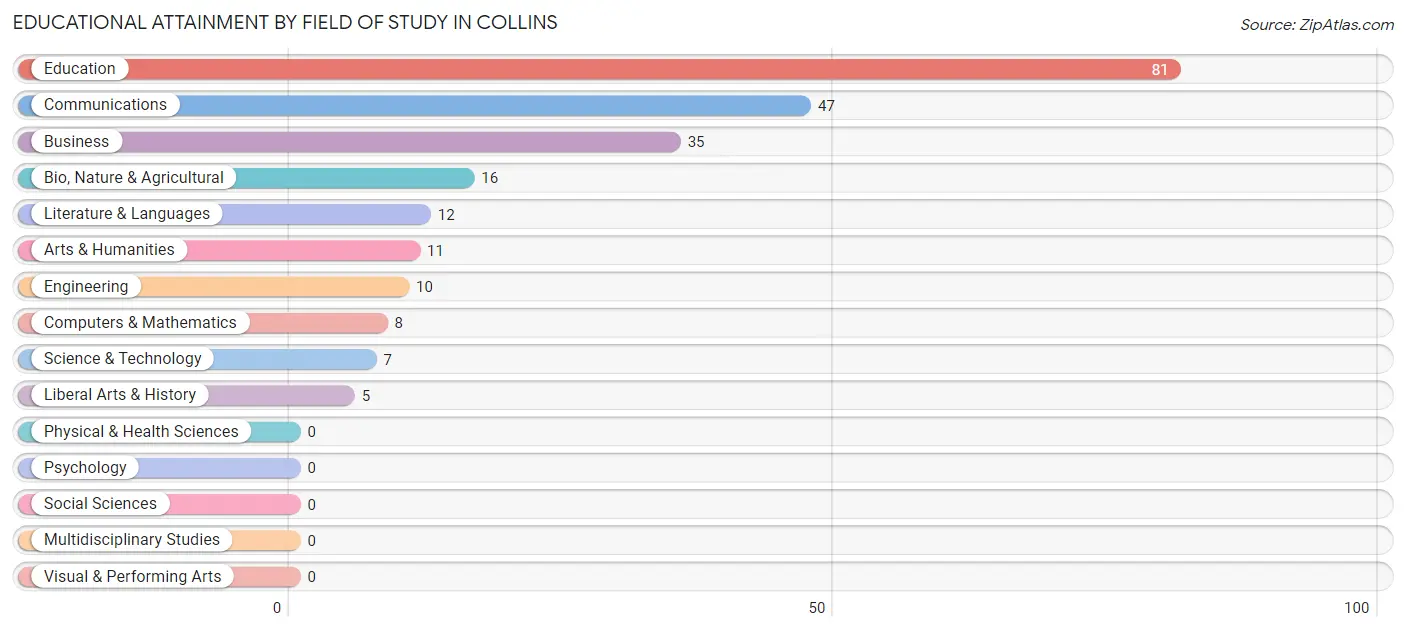
| Field of Study | # Graduates | % Graduates |
| Computers & Mathematics | 8 | 3.5% |
| Bio, Nature & Agricultural | 16 | 6.9% |
| Physical & Health Sciences | 0 | 0.0% |
| Psychology | 0 | 0.0% |
| Social Sciences | 0 | 0.0% |
| Engineering | 10 | 4.3% |
| Multidisciplinary Studies | 0 | 0.0% |
| Science & Technology | 7 | 3.0% |
| Business | 35 | 15.1% |
| Education | 81 | 34.9% |
| Literature & Languages | 12 | 5.2% |
| Liberal Arts & History | 5 | 2.2% |
| Visual & Performing Arts | 0 | 0.0% |
| Communications | 47 | 20.3% |
| Arts & Humanities | 11 | 4.7% |
| Total | 232 | 100.0% |
Transportation & Commute in Collins
Vehicle Availability by Sex in Collins
The most prevalent vehicle ownership categories in Collins are males with 2 vehicles (128, accounting for 55.9%) and females with 2 vehicles (243, making up 29.2%).
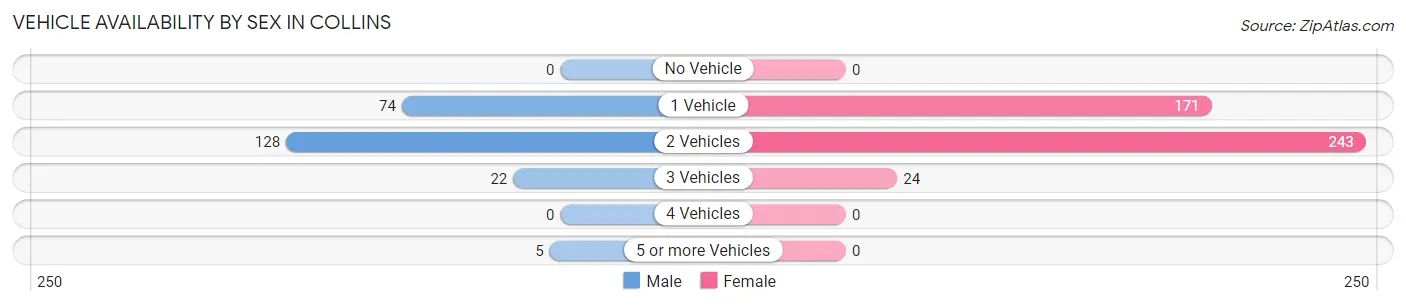
| Vehicles Available | Male | Female |
| No Vehicle | 0 (0.0%) | 0 (0.0%) |
| 1 Vehicle | 74 (32.3%) | 171 (39.0%) |
| 2 Vehicles | 128 (55.9%) | 243 (55.5%) |
| 3 Vehicles | 22 (9.6%) | 24 (5.5%) |
| 4 Vehicles | 0 (0.0%) | 0 (0.0%) |
| 5 or more Vehicles | 5 (2.2%) | 0 (0.0%) |
| Total | 229 (100.0%) | 438 (100.0%) |
Commute Time in Collins
The most frequently occuring commute durations in Collins are 10 to 14 minutes (162 commuters, 25.0%), 45 to 59 minutes (129 commuters, 19.9%), and 5 to 9 minutes (91 commuters, 14.0%).
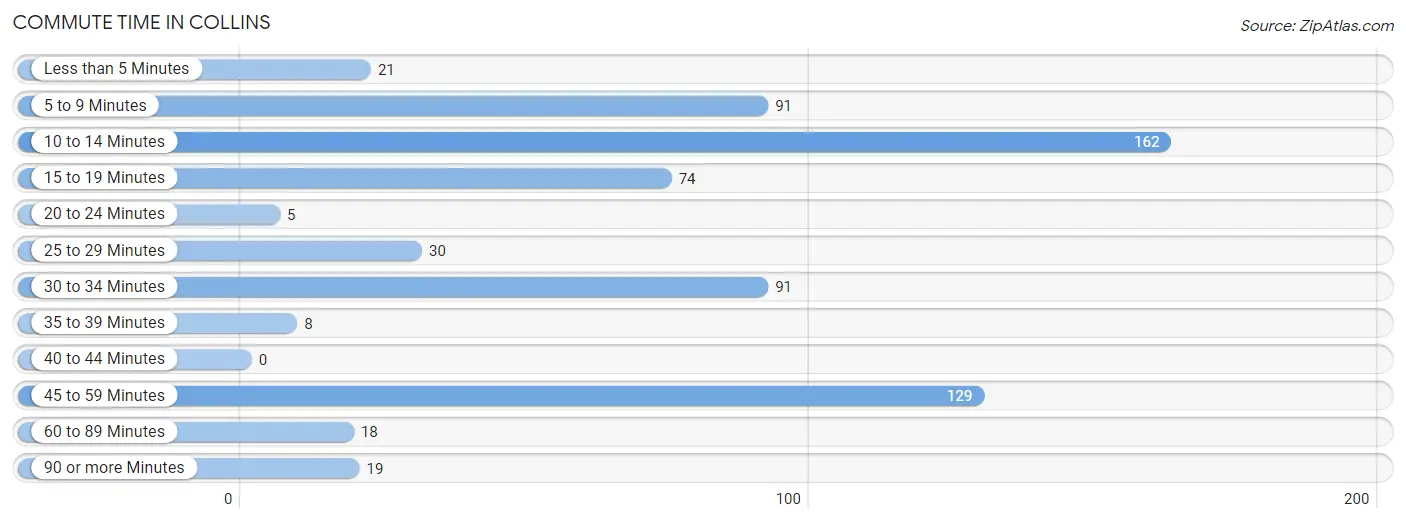
| Commute Time | # Commuters | % Commuters |
| Less than 5 Minutes | 21 | 3.2% |
| 5 to 9 Minutes | 91 | 14.0% |
| 10 to 14 Minutes | 162 | 25.0% |
| 15 to 19 Minutes | 74 | 11.4% |
| 20 to 24 Minutes | 5 | 0.8% |
| 25 to 29 Minutes | 30 | 4.6% |
| 30 to 34 Minutes | 91 | 14.0% |
| 35 to 39 Minutes | 8 | 1.2% |
| 40 to 44 Minutes | 0 | 0.0% |
| 45 to 59 Minutes | 129 | 19.9% |
| 60 to 89 Minutes | 18 | 2.8% |
| 90 or more Minutes | 19 | 2.9% |
Commute Time by Sex in Collins
The most common commute times in Collins are 15 to 19 minutes (56 commuters, 25.8%) for males and 10 to 14 minutes (138 commuters, 32.0%) for females.
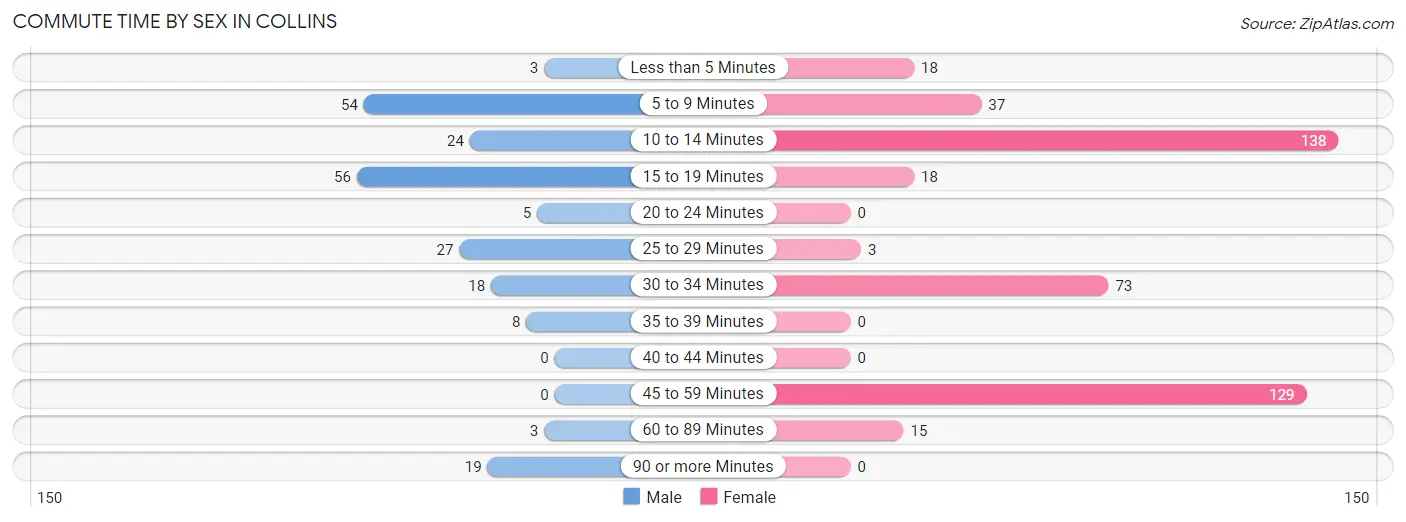
| Commute Time | Male | Female |
| Less than 5 Minutes | 3 (1.4%) | 18 (4.2%) |
| 5 to 9 Minutes | 54 (24.9%) | 37 (8.6%) |
| 10 to 14 Minutes | 24 (11.1%) | 138 (32.0%) |
| 15 to 19 Minutes | 56 (25.8%) | 18 (4.2%) |
| 20 to 24 Minutes | 5 (2.3%) | 0 (0.0%) |
| 25 to 29 Minutes | 27 (12.4%) | 3 (0.7%) |
| 30 to 34 Minutes | 18 (8.3%) | 73 (16.9%) |
| 35 to 39 Minutes | 8 (3.7%) | 0 (0.0%) |
| 40 to 44 Minutes | 0 (0.0%) | 0 (0.0%) |
| 45 to 59 Minutes | 0 (0.0%) | 129 (29.9%) |
| 60 to 89 Minutes | 3 (1.4%) | 15 (3.5%) |
| 90 or more Minutes | 19 (8.8%) | 0 (0.0%) |
Time of Departure to Work by Sex in Collins
The most frequent times of departure to work in Collins are 7:30 AM to 7:59 AM (53, 24.4%) for males and 7:30 AM to 7:59 AM (115, 26.7%) for females.
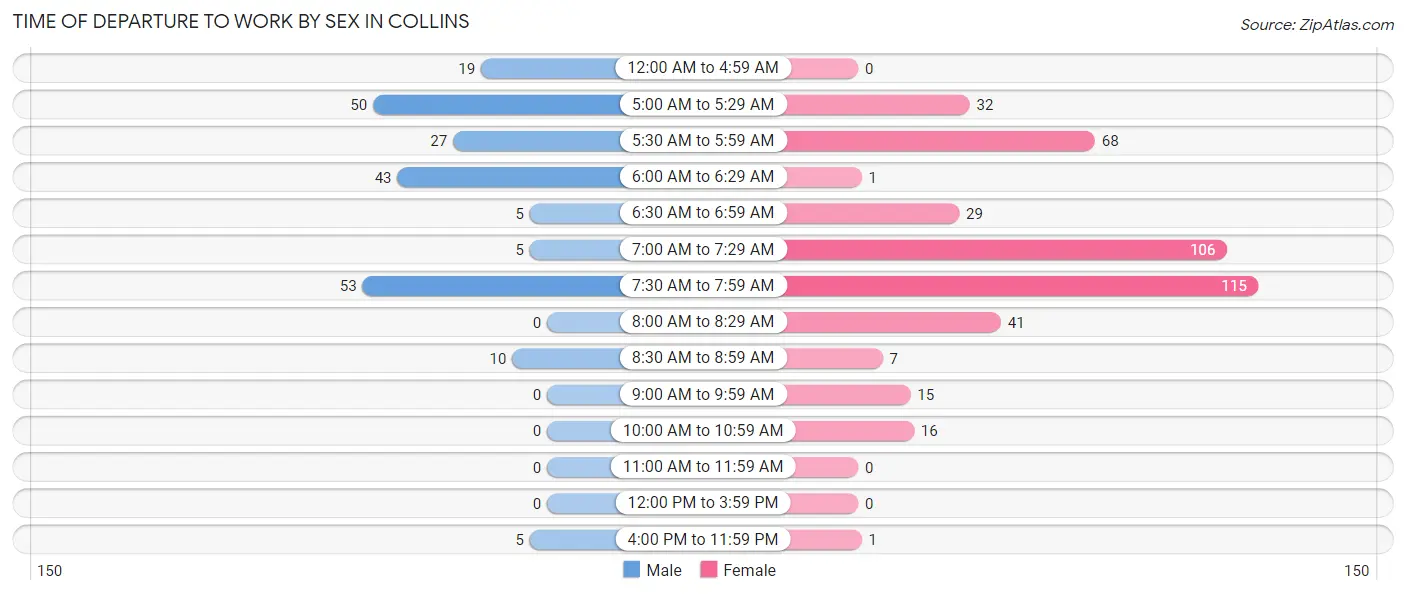
| Time of Departure | Male | Female |
| 12:00 AM to 4:59 AM | 19 (8.8%) | 0 (0.0%) |
| 5:00 AM to 5:29 AM | 50 (23.0%) | 32 (7.4%) |
| 5:30 AM to 5:59 AM | 27 (12.4%) | 68 (15.8%) |
| 6:00 AM to 6:29 AM | 43 (19.8%) | 1 (0.2%) |
| 6:30 AM to 6:59 AM | 5 (2.3%) | 29 (6.7%) |
| 7:00 AM to 7:29 AM | 5 (2.3%) | 106 (24.6%) |
| 7:30 AM to 7:59 AM | 53 (24.4%) | 115 (26.7%) |
| 8:00 AM to 8:29 AM | 0 (0.0%) | 41 (9.5%) |
| 8:30 AM to 8:59 AM | 10 (4.6%) | 7 (1.6%) |
| 9:00 AM to 9:59 AM | 0 (0.0%) | 15 (3.5%) |
| 10:00 AM to 10:59 AM | 0 (0.0%) | 16 (3.7%) |
| 11:00 AM to 11:59 AM | 0 (0.0%) | 0 (0.0%) |
| 12:00 PM to 3:59 PM | 0 (0.0%) | 0 (0.0%) |
| 4:00 PM to 11:59 PM | 5 (2.3%) | 1 (0.2%) |
| Total | 217 (100.0%) | 431 (100.0%) |
Housing Occupancy in Collins
Occupancy by Ownership in Collins
Of the total 845 dwellings in Collins, owner-occupied units account for 472 (55.9%), while renter-occupied units make up 373 (44.1%).
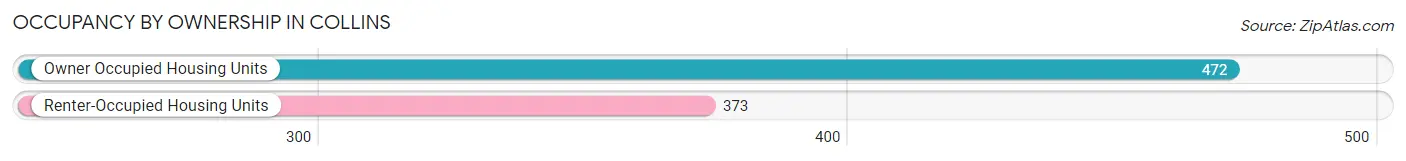
| Occupancy | # Housing Units | % Housing Units |
| Owner Occupied Housing Units | 472 | 55.9% |
| Renter-Occupied Housing Units | 373 | 44.1% |
| Total Occupied Housing Units | 845 | 100.0% |
Occupancy by Household Size in Collins
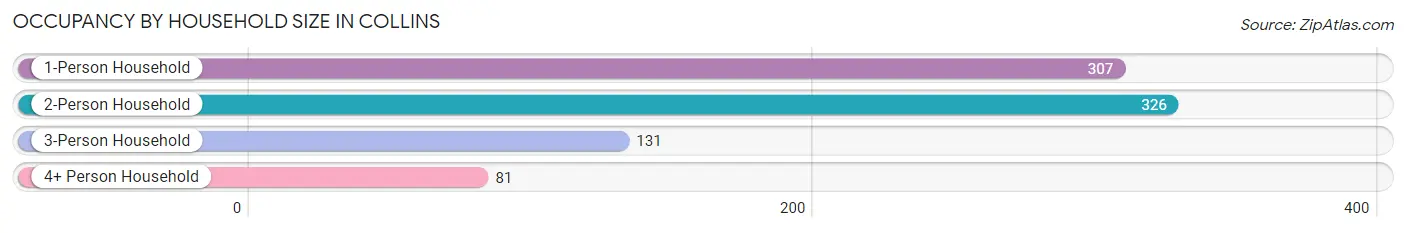
| Household Size | # Housing Units | % Housing Units |
| 1-Person Household | 307 | 36.3% |
| 2-Person Household | 326 | 38.6% |
| 3-Person Household | 131 | 15.5% |
| 4+ Person Household | 81 | 9.6% |
| Total Housing Units | 845 | 100.0% |
Occupancy by Ownership by Household Size in Collins
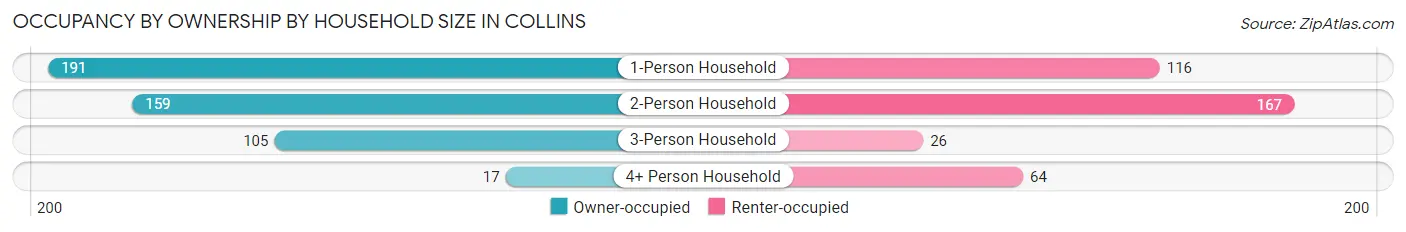
| Household Size | Owner-occupied | Renter-occupied |
| 1-Person Household | 191 (62.2%) | 116 (37.8%) |
| 2-Person Household | 159 (48.8%) | 167 (51.2%) |
| 3-Person Household | 105 (80.1%) | 26 (19.9%) |
| 4+ Person Household | 17 (21.0%) | 64 (79.0%) |
| Total Housing Units | 472 (55.9%) | 373 (44.1%) |
Occupancy by Educational Attainment in Collins
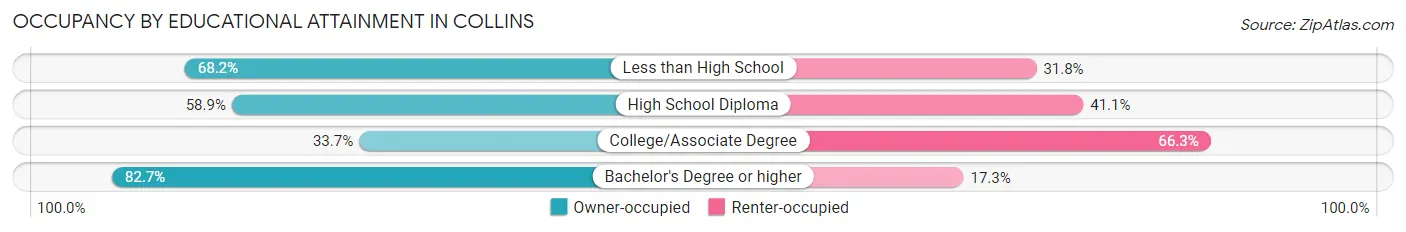
| Household Size | Owner-occupied | Renter-occupied |
| Less than High School | 88 (68.2%) | 41 (31.8%) |
| High School Diploma | 188 (58.9%) | 131 (41.1%) |
| College/Associate Degree | 91 (33.7%) | 179 (66.3%) |
| Bachelor's Degree or higher | 105 (82.7%) | 22 (17.3%) |
Occupancy by Age of Householder in Collins
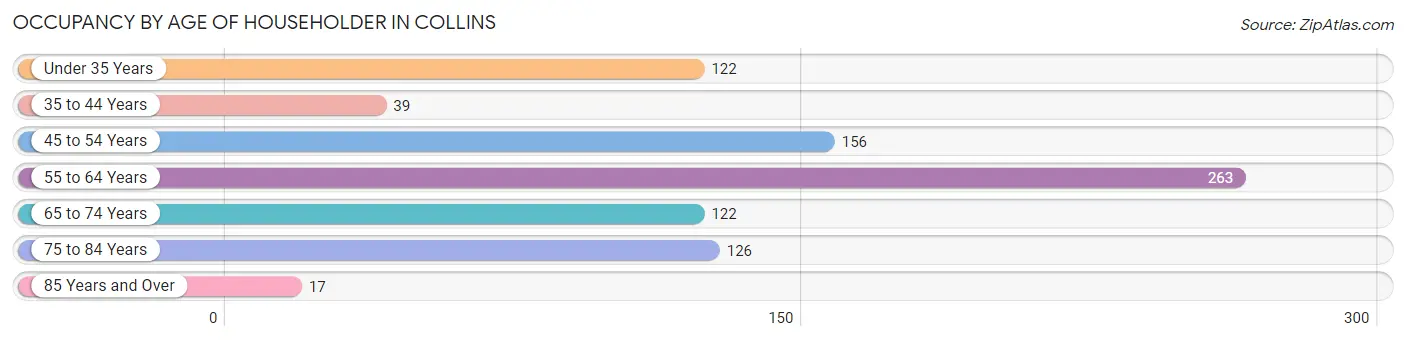
| Age Bracket | # Households | % Households |
| Under 35 Years | 122 | 14.4% |
| 35 to 44 Years | 39 | 4.6% |
| 45 to 54 Years | 156 | 18.5% |
| 55 to 64 Years | 263 | 31.1% |
| 65 to 74 Years | 122 | 14.4% |
| 75 to 84 Years | 126 | 14.9% |
| 85 Years and Over | 17 | 2.0% |
| Total | 845 | 100.0% |
Housing Finances in Collins
Median Income by Occupancy in Collins
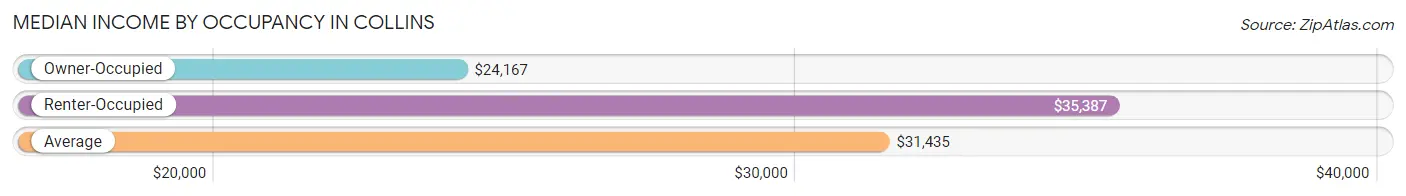
| Occupancy Type | # Households | Median Income |
| Owner-Occupied | 472 (55.9%) | $24,167 |
| Renter-Occupied | 373 (44.1%) | $35,387 |
| Average | 845 (100.0%) | $31,435 |
Occupancy by Householder Income Bracket in Collins
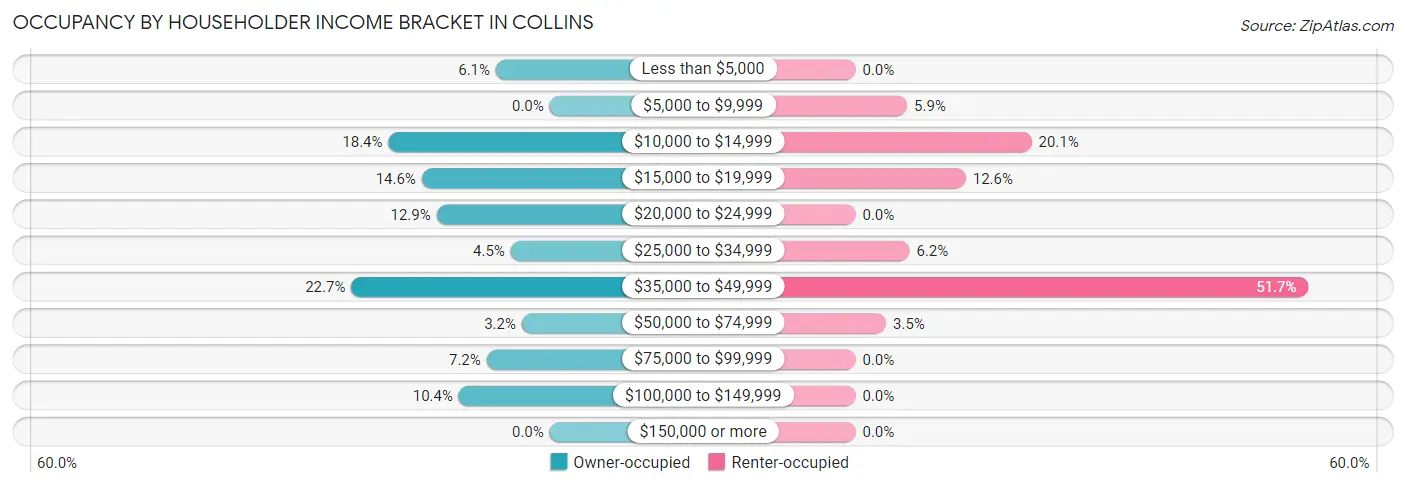
| Income Bracket | Owner-occupied | Renter-occupied |
| Less than $5,000 | 29 (6.1%) | 0 (0.0%) |
| $5,000 to $9,999 | 0 (0.0%) | 22 (5.9%) |
| $10,000 to $14,999 | 87 (18.4%) | 75 (20.1%) |
| $15,000 to $19,999 | 69 (14.6%) | 47 (12.6%) |
| $20,000 to $24,999 | 61 (12.9%) | 0 (0.0%) |
| $25,000 to $34,999 | 21 (4.4%) | 23 (6.2%) |
| $35,000 to $49,999 | 107 (22.7%) | 193 (51.7%) |
| $50,000 to $74,999 | 15 (3.2%) | 13 (3.5%) |
| $75,000 to $99,999 | 34 (7.2%) | 0 (0.0%) |
| $100,000 to $149,999 | 49 (10.4%) | 0 (0.0%) |
| $150,000 or more | 0 (0.0%) | 0 (0.0%) |
| Total | 472 (100.0%) | 373 (100.0%) |
Monthly Housing Cost Tiers in Collins
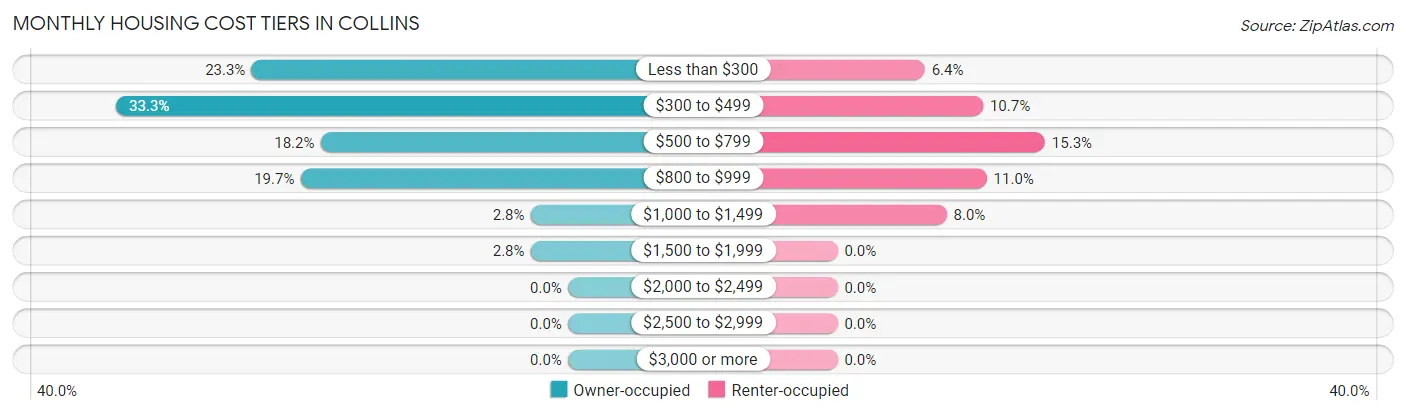
| Monthly Cost | Owner-occupied | Renter-occupied |
| Less than $300 | 110 (23.3%) | 24 (6.4%) |
| $300 to $499 | 157 (33.3%) | 40 (10.7%) |
| $500 to $799 | 86 (18.2%) | 57 (15.3%) |
| $800 to $999 | 93 (19.7%) | 41 (11.0%) |
| $1,000 to $1,499 | 13 (2.8%) | 30 (8.0%) |
| $1,500 to $1,999 | 13 (2.8%) | 0 (0.0%) |
| $2,000 to $2,499 | 0 (0.0%) | 0 (0.0%) |
| $2,500 to $2,999 | 0 (0.0%) | 0 (0.0%) |
| $3,000 or more | 0 (0.0%) | 0 (0.0%) |
| Total | 472 (100.0%) | 373 (100.0%) |
Physical Housing Characteristics in Collins
Housing Structures in Collins
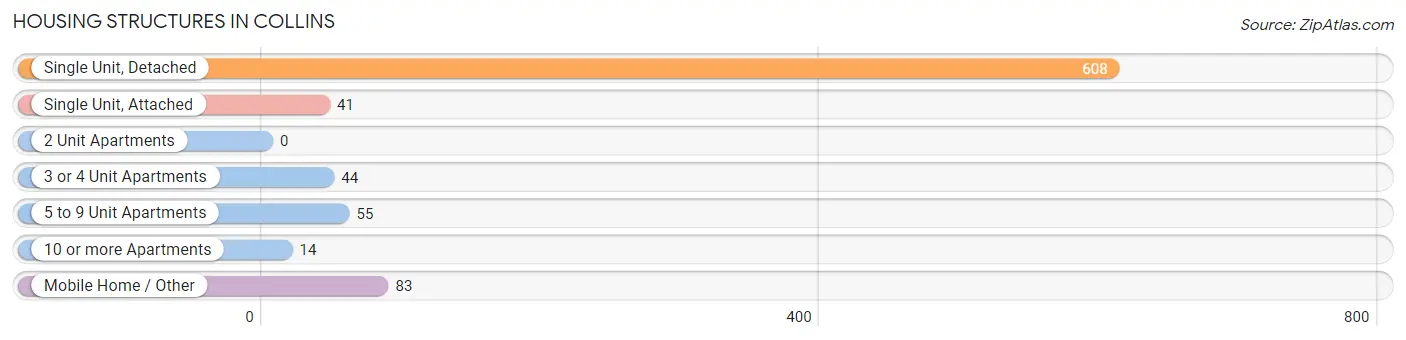
| Structure Type | # Housing Units | % Housing Units |
| Single Unit, Detached | 608 | 72.0% |
| Single Unit, Attached | 41 | 4.9% |
| 2 Unit Apartments | 0 | 0.0% |
| 3 or 4 Unit Apartments | 44 | 5.2% |
| 5 to 9 Unit Apartments | 55 | 6.5% |
| 10 or more Apartments | 14 | 1.7% |
| Mobile Home / Other | 83 | 9.8% |
| Total | 845 | 100.0% |
Housing Structures by Occupancy in Collins
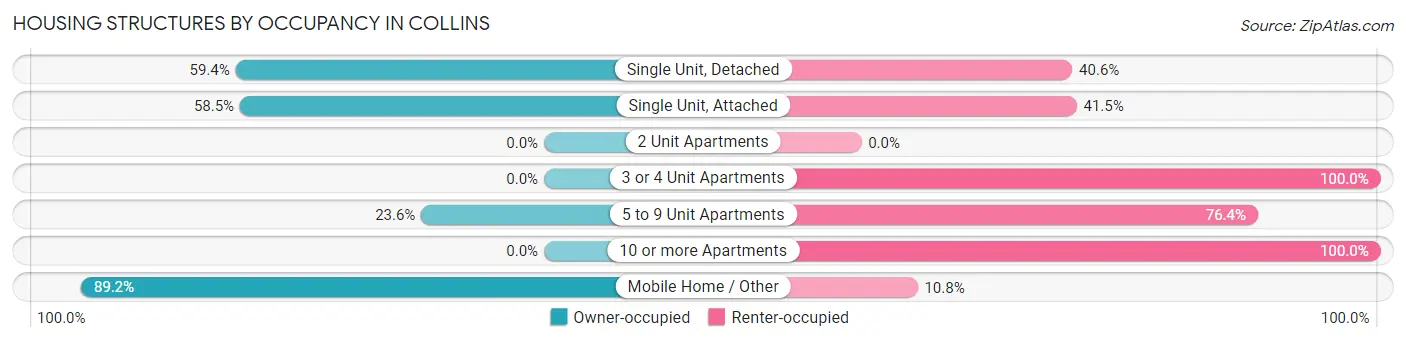
| Structure Type | Owner-occupied | Renter-occupied |
| Single Unit, Detached | 361 (59.4%) | 247 (40.6%) |
| Single Unit, Attached | 24 (58.5%) | 17 (41.5%) |
| 2 Unit Apartments | 0 (0.0%) | 0 (0.0%) |
| 3 or 4 Unit Apartments | 0 (0.0%) | 44 (100.0%) |
| 5 to 9 Unit Apartments | 13 (23.6%) | 42 (76.4%) |
| 10 or more Apartments | 0 (0.0%) | 14 (100.0%) |
| Mobile Home / Other | 74 (89.2%) | 9 (10.8%) |
| Total | 472 (55.9%) | 373 (44.1%) |
Housing Structures by Number of Rooms in Collins
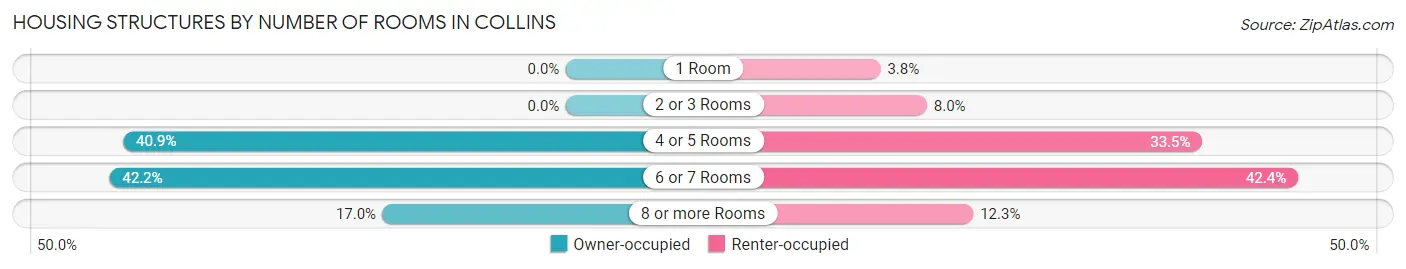
| Number of Rooms | Owner-occupied | Renter-occupied |
| 1 Room | 0 (0.0%) | 14 (3.7%) |
| 2 or 3 Rooms | 0 (0.0%) | 30 (8.0%) |
| 4 or 5 Rooms | 193 (40.9%) | 125 (33.5%) |
| 6 or 7 Rooms | 199 (42.2%) | 158 (42.4%) |
| 8 or more Rooms | 80 (17.0%) | 46 (12.3%) |
| Total | 472 (100.0%) | 373 (100.0%) |
Housing Structure by Heating Type in Collins
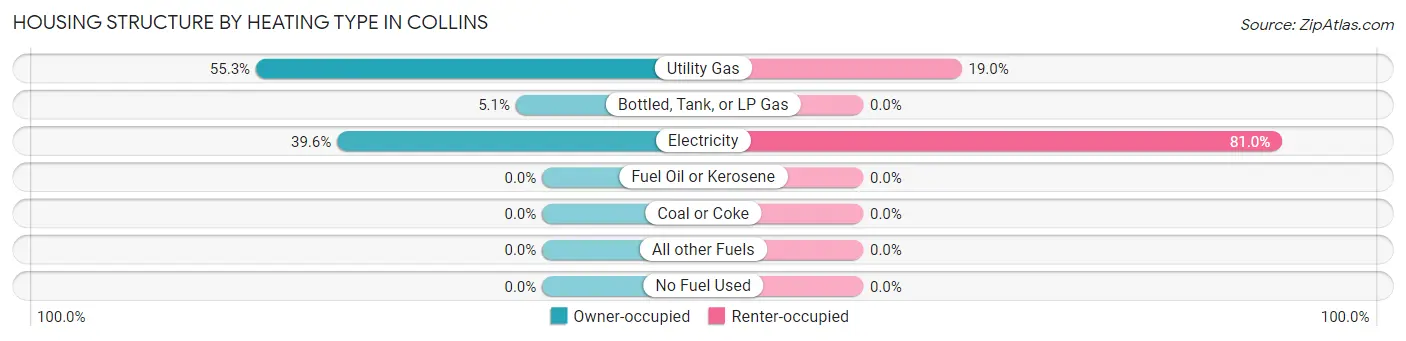
| Heating Type | Owner-occupied | Renter-occupied |
| Utility Gas | 261 (55.3%) | 71 (19.0%) |
| Bottled, Tank, or LP Gas | 24 (5.1%) | 0 (0.0%) |
| Electricity | 187 (39.6%) | 302 (81.0%) |
| Fuel Oil or Kerosene | 0 (0.0%) | 0 (0.0%) |
| Coal or Coke | 0 (0.0%) | 0 (0.0%) |
| All other Fuels | 0 (0.0%) | 0 (0.0%) |
| No Fuel Used | 0 (0.0%) | 0 (0.0%) |
| Total | 472 (100.0%) | 373 (100.0%) |
Household Vehicle Usage in Collins
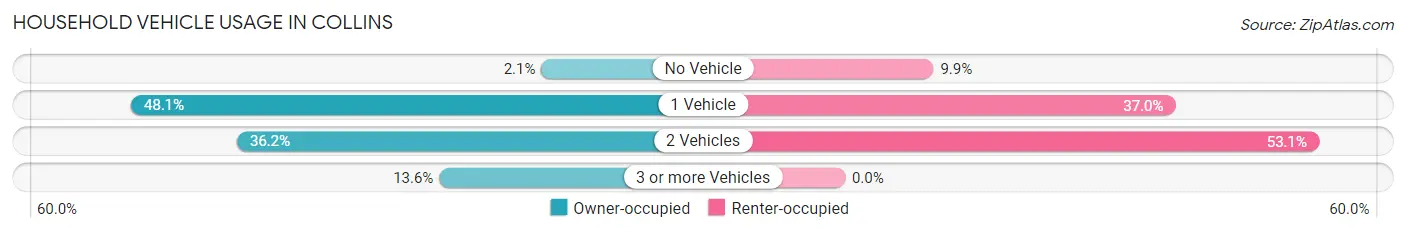
| Vehicles per Household | Owner-occupied | Renter-occupied |
| No Vehicle | 10 (2.1%) | 37 (9.9%) |
| 1 Vehicle | 227 (48.1%) | 138 (37.0%) |
| 2 Vehicles | 171 (36.2%) | 198 (53.1%) |
| 3 or more Vehicles | 64 (13.6%) | 0 (0.0%) |
| Total | 472 (100.0%) | 373 (100.0%) |
Real Estate & Mortgages in Collins
Real Estate and Mortgage Overview in Collins
| Characteristic | Without Mortgage | With Mortgage |
| Housing Units | 252 | 220 |
| Median Property Value | $67,700 | $94,600 |
| Median Household Income | $20,887 | $0 |
| Monthly Housing Costs | $322 | $0 |
| Real Estate Taxes | - | - |
Property Value by Mortgage Status in Collins
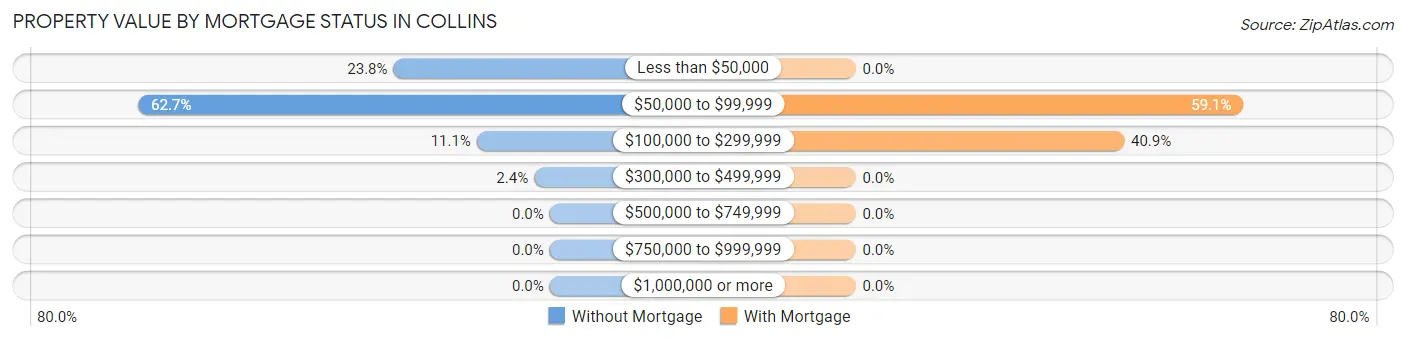
| Property Value | Without Mortgage | With Mortgage |
| Less than $50,000 | 60 (23.8%) | 0 (0.0%) |
| $50,000 to $99,999 | 158 (62.7%) | 130 (59.1%) |
| $100,000 to $299,999 | 28 (11.1%) | 90 (40.9%) |
| $300,000 to $499,999 | 6 (2.4%) | 0 (0.0%) |
| $500,000 to $749,999 | 0 (0.0%) | 0 (0.0%) |
| $750,000 to $999,999 | 0 (0.0%) | 0 (0.0%) |
| $1,000,000 or more | 0 (0.0%) | 0 (0.0%) |
| Total | 252 (100.0%) | 220 (100.0%) |
Household Income by Mortgage Status in Collins
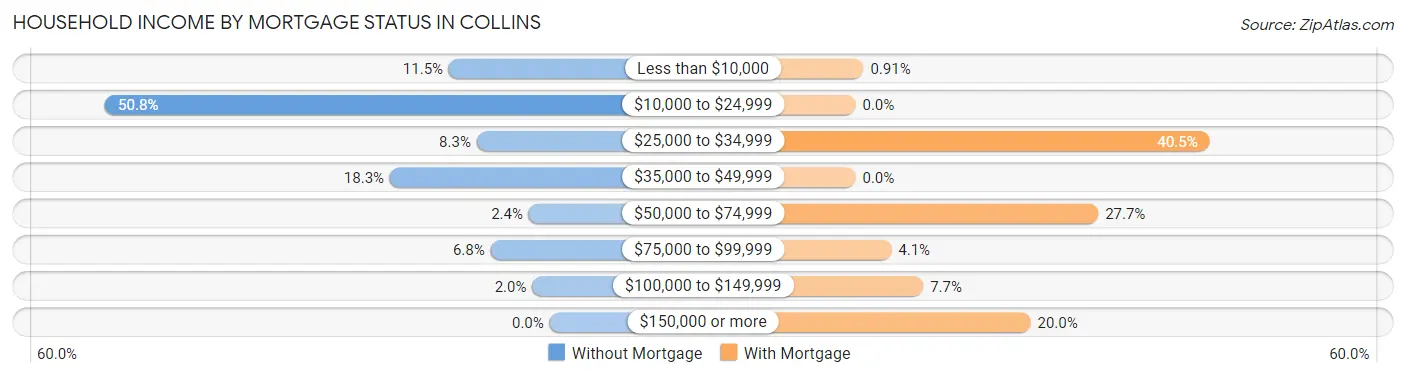
| Household Income | Without Mortgage | With Mortgage |
| Less than $10,000 | 29 (11.5%) | 2 (0.9%) |
| $10,000 to $24,999 | 128 (50.8%) | 0 (0.0%) |
| $25,000 to $34,999 | 21 (8.3%) | 89 (40.5%) |
| $35,000 to $49,999 | 46 (18.2%) | 0 (0.0%) |
| $50,000 to $74,999 | 6 (2.4%) | 61 (27.7%) |
| $75,000 to $99,999 | 17 (6.8%) | 9 (4.1%) |
| $100,000 to $149,999 | 5 (2.0%) | 17 (7.7%) |
| $150,000 or more | 0 (0.0%) | 44 (20.0%) |
| Total | 252 (100.0%) | 220 (100.0%) |
Property Value to Household Income Ratio in Collins
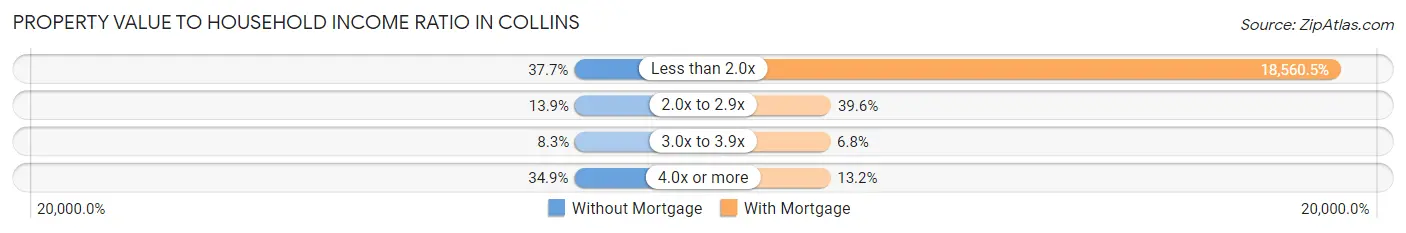
| Value-to-Income Ratio | Without Mortgage | With Mortgage |
| Less than 2.0x | 95 (37.7%) | 40,833 (18,560.5%) |
| 2.0x to 2.9x | 35 (13.9%) | 87 (39.6%) |
| 3.0x to 3.9x | 21 (8.3%) | 15 (6.8%) |
| 4.0x or more | 88 (34.9%) | 29 (13.2%) |
| Total | 252 (100.0%) | 220 (100.0%) |
Real Estate Taxes by Mortgage Status in Collins
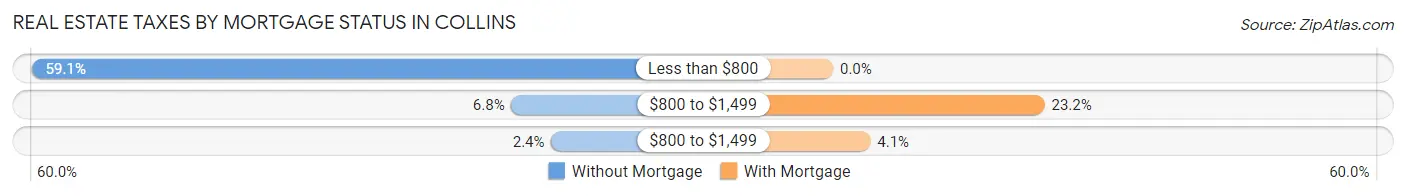
| Property Taxes | Without Mortgage | With Mortgage |
| Less than $800 | 149 (59.1%) | 0 (0.0%) |
| $800 to $1,499 | 17 (6.8%) | 51 (23.2%) |
| $800 to $1,499 | 6 (2.4%) | 9 (4.1%) |
| Total | 252 (100.0%) | 220 (100.0%) |
Health & Disability in Collins
Health Insurance Coverage by Age in Collins
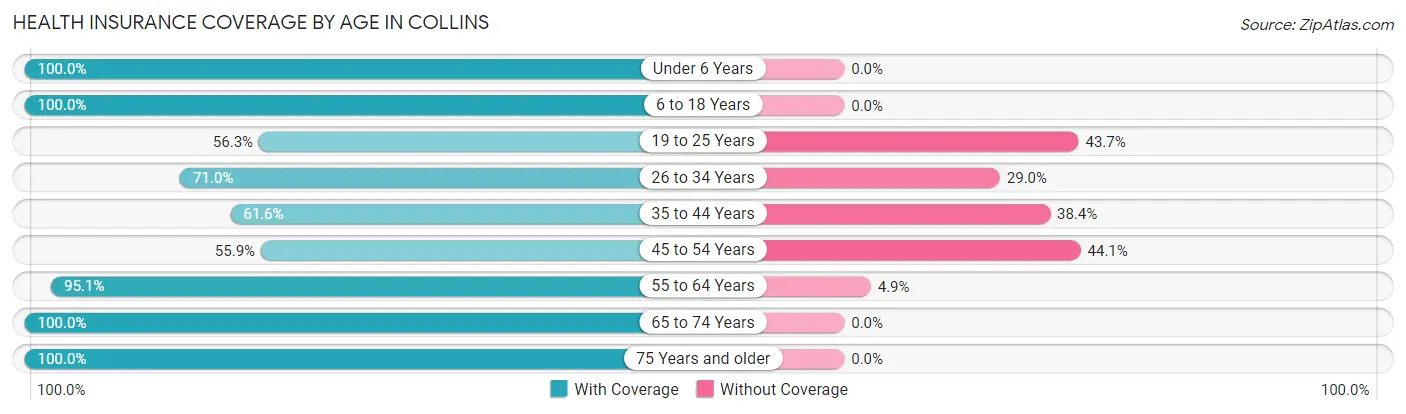
| Age Bracket | With Coverage | Without Coverage |
| Under 6 Years | 183 (100.0%) | 0 (0.0%) |
| 6 to 18 Years | 249 (100.0%) | 0 (0.0%) |
| 19 to 25 Years | 116 (56.3%) | 90 (43.7%) |
| 26 to 34 Years | 93 (71.0%) | 38 (29.0%) |
| 35 to 44 Years | 90 (61.6%) | 56 (38.4%) |
| 45 to 54 Years | 132 (55.9%) | 104 (44.1%) |
| 55 to 64 Years | 404 (95.1%) | 21 (4.9%) |
| 65 to 74 Years | 187 (100.0%) | 0 (0.0%) |
| 75 Years and older | 171 (100.0%) | 0 (0.0%) |
| Total | 1,625 (84.0%) | 309 (16.0%) |
Health Insurance Coverage by Citizenship Status in Collins
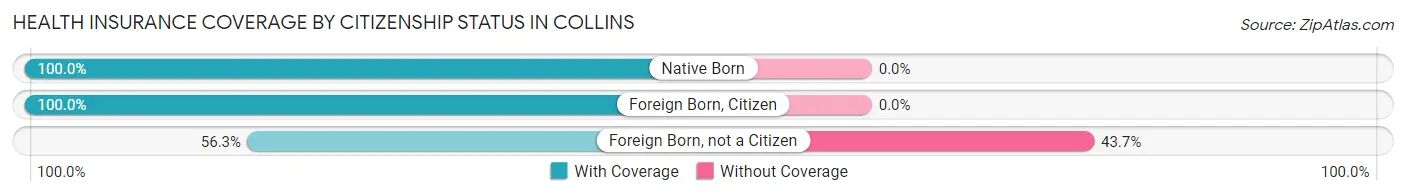
| Citizenship Status | With Coverage | Without Coverage |
| Native Born | 183 (100.0%) | 0 (0.0%) |
| Foreign Born, Citizen | 249 (100.0%) | 0 (0.0%) |
| Foreign Born, not a Citizen | 116 (56.3%) | 90 (43.7%) |
Health Insurance Coverage by Household Income in Collins
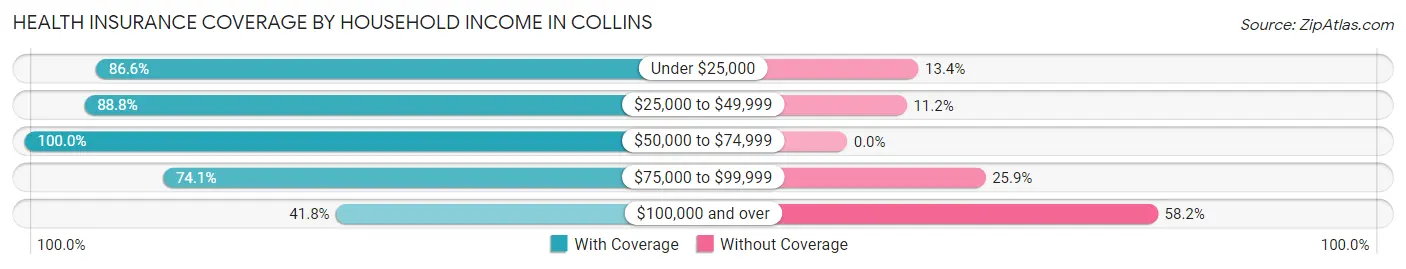
| Household Income | With Coverage | Without Coverage |
| Under $25,000 | 590 (86.6%) | 91 (13.4%) |
| $25,000 to $49,999 | 834 (88.8%) | 105 (11.2%) |
| $50,000 to $74,999 | 75 (100.0%) | 0 (0.0%) |
| $75,000 to $99,999 | 60 (74.1%) | 21 (25.9%) |
| $100,000 and over | 66 (41.8%) | 92 (58.2%) |
Public vs Private Health Insurance Coverage by Age in Collins
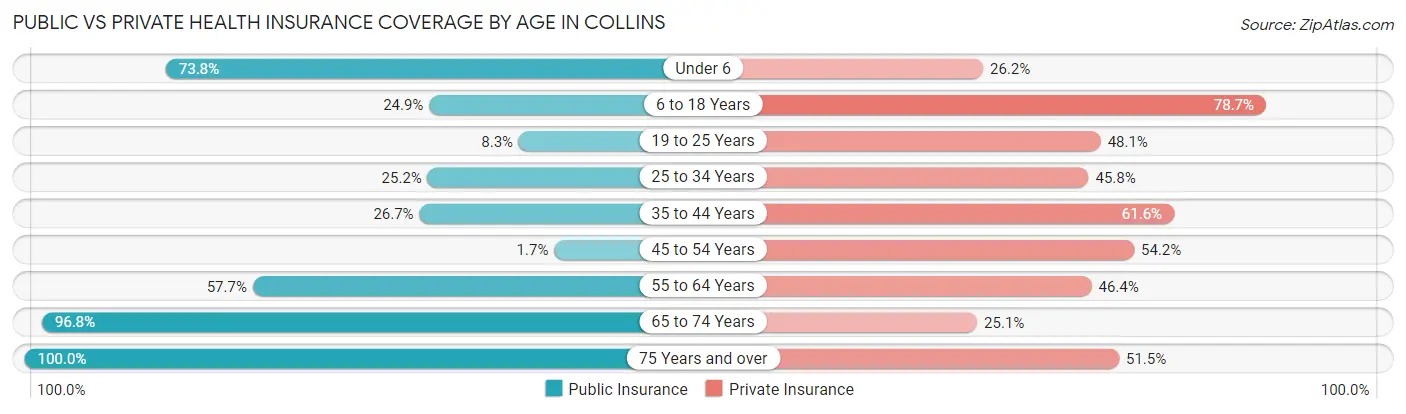
| Age Bracket | Public Insurance | Private Insurance |
| Under 6 | 135 (73.8%) | 48 (26.2%) |
| 6 to 18 Years | 62 (24.9%) | 196 (78.7%) |
| 19 to 25 Years | 17 (8.3%) | 99 (48.1%) |
| 25 to 34 Years | 33 (25.2%) | 60 (45.8%) |
| 35 to 44 Years | 39 (26.7%) | 90 (61.6%) |
| 45 to 54 Years | 4 (1.7%) | 128 (54.2%) |
| 55 to 64 Years | 245 (57.7%) | 197 (46.4%) |
| 65 to 74 Years | 181 (96.8%) | 47 (25.1%) |
| 75 Years and over | 171 (100.0%) | 88 (51.5%) |
| Total | 887 (45.9%) | 953 (49.3%) |
Disability Status by Sex by Age in Collins
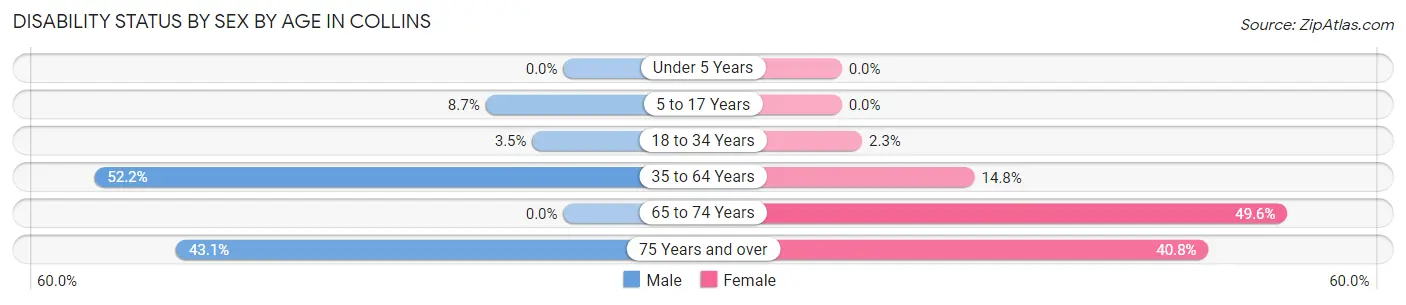
| Age Bracket | Male | Female |
| Under 5 Years | 0 (0.0%) | 0 (0.0%) |
| 5 to 17 Years | 15 (8.7%) | 0 (0.0%) |
| 18 to 34 Years | 4 (3.5%) | 5 (2.3%) |
| 35 to 64 Years | 199 (52.2%) | 63 (14.8%) |
| 65 to 74 Years | 0 (0.0%) | 66 (49.6%) |
| 75 Years and over | 22 (43.1%) | 49 (40.8%) |
Disability Class by Sex by Age in Collins
Disability Class: Hearing Difficulty
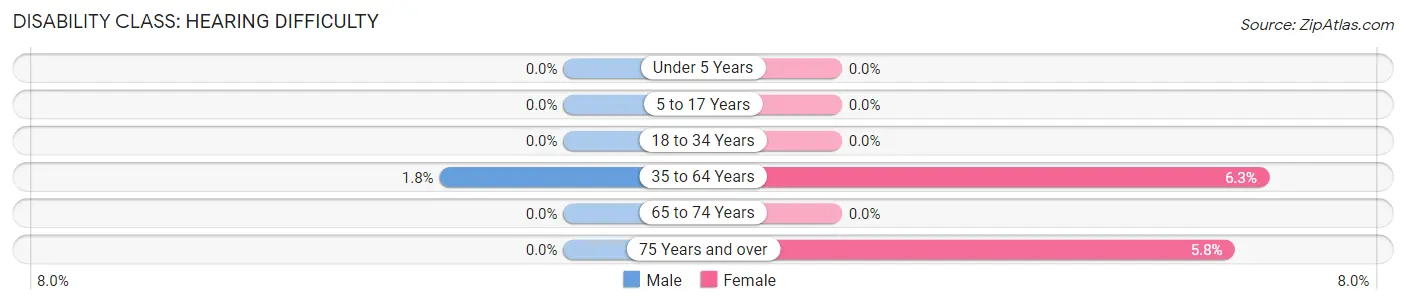
| Age Bracket | Male | Female |
| Under 5 Years | 0 (0.0%) | 0 (0.0%) |
| 5 to 17 Years | 0 (0.0%) | 0 (0.0%) |
| 18 to 34 Years | 0 (0.0%) | 0 (0.0%) |
| 35 to 64 Years | 7 (1.8%) | 27 (6.3%) |
| 65 to 74 Years | 0 (0.0%) | 0 (0.0%) |
| 75 Years and over | 0 (0.0%) | 7 (5.8%) |
Disability Class: Vision Difficulty
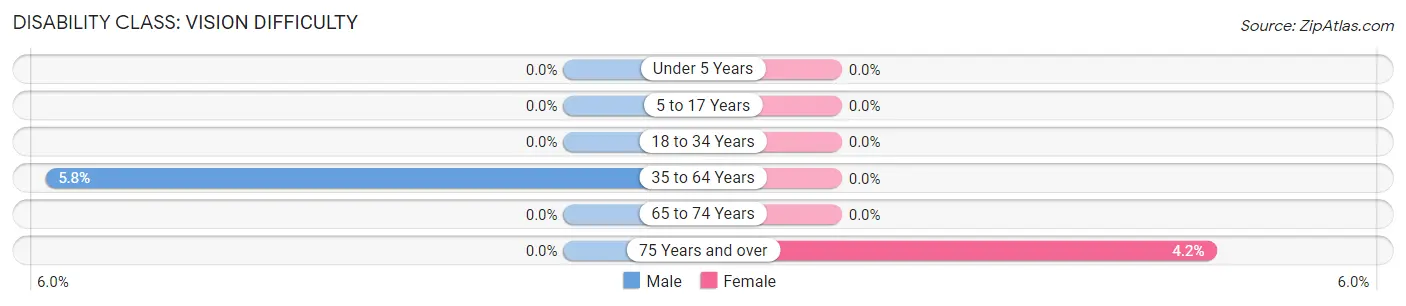
| Age Bracket | Male | Female |
| Under 5 Years | 0 (0.0%) | 0 (0.0%) |
| 5 to 17 Years | 0 (0.0%) | 0 (0.0%) |
| 18 to 34 Years | 0 (0.0%) | 0 (0.0%) |
| 35 to 64 Years | 22 (5.8%) | 0 (0.0%) |
| 65 to 74 Years | 0 (0.0%) | 0 (0.0%) |
| 75 Years and over | 0 (0.0%) | 5 (4.2%) |
Disability Class: Cognitive Difficulty
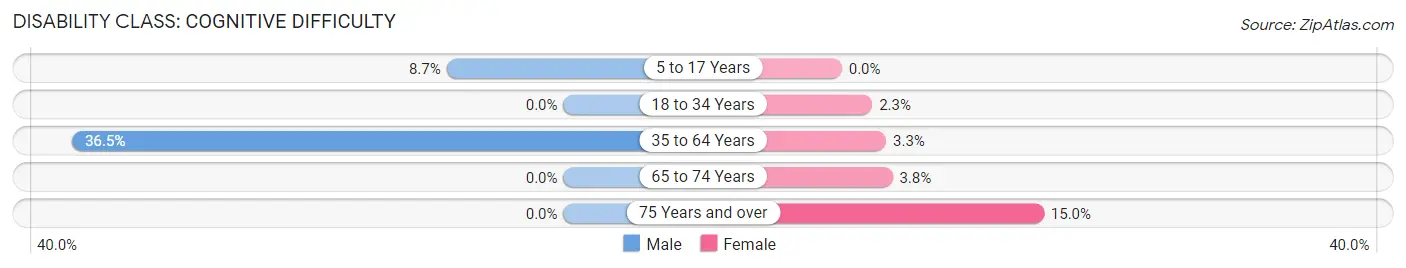
| Age Bracket | Male | Female |
| 5 to 17 Years | 15 (8.7%) | 0 (0.0%) |
| 18 to 34 Years | 0 (0.0%) | 5 (2.3%) |
| 35 to 64 Years | 139 (36.5%) | 14 (3.3%) |
| 65 to 74 Years | 0 (0.0%) | 5 (3.8%) |
| 75 Years and over | 0 (0.0%) | 18 (15.0%) |
Disability Class: Ambulatory Difficulty
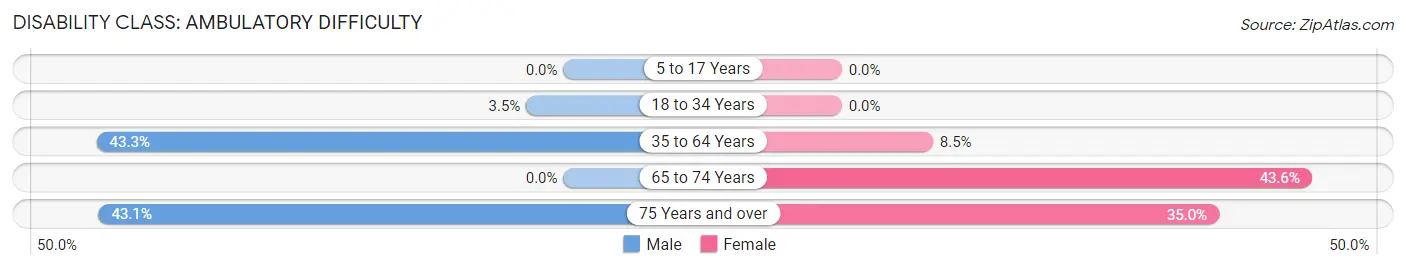
| Age Bracket | Male | Female |
| 5 to 17 Years | 0 (0.0%) | 0 (0.0%) |
| 18 to 34 Years | 4 (3.5%) | 0 (0.0%) |
| 35 to 64 Years | 165 (43.3%) | 36 (8.5%) |
| 65 to 74 Years | 0 (0.0%) | 58 (43.6%) |
| 75 Years and over | 22 (43.1%) | 42 (35.0%) |
Disability Class: Self-Care Difficulty
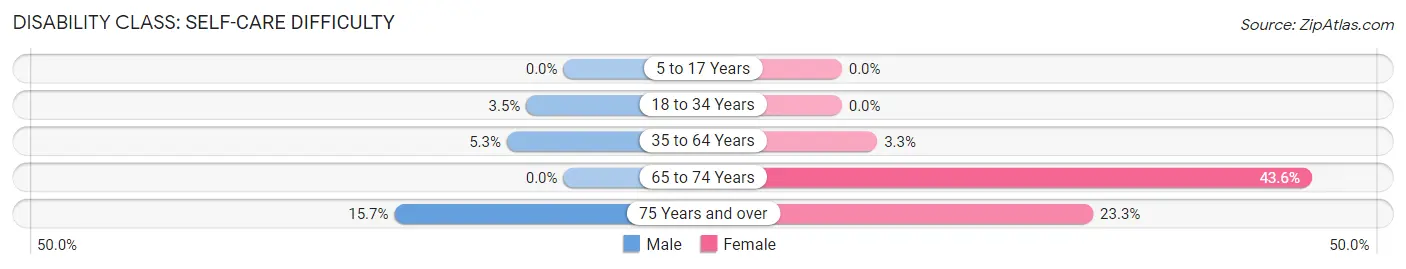
| Age Bracket | Male | Female |
| 5 to 17 Years | 0 (0.0%) | 0 (0.0%) |
| 18 to 34 Years | 4 (3.5%) | 0 (0.0%) |
| 35 to 64 Years | 20 (5.2%) | 14 (3.3%) |
| 65 to 74 Years | 0 (0.0%) | 58 (43.6%) |
| 75 Years and over | 8 (15.7%) | 28 (23.3%) |
Technology Access in Collins
Computing Device Access in Collins
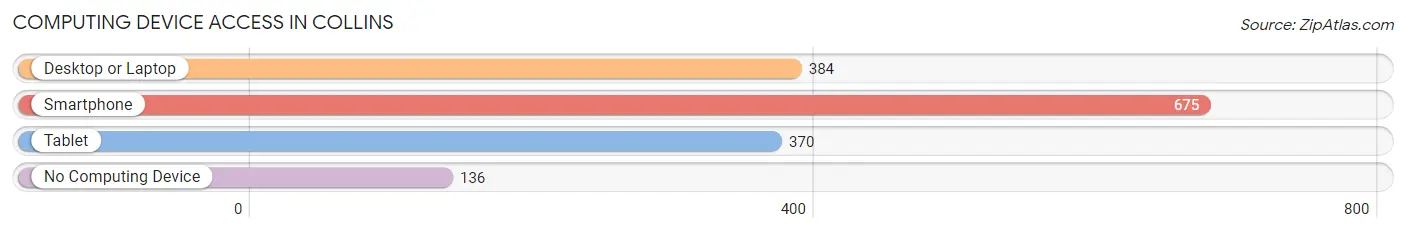
| Device Type | # Households | % Households |
| Desktop or Laptop | 384 | 45.4% |
| Smartphone | 675 | 79.9% |
| Tablet | 370 | 43.8% |
| No Computing Device | 136 | 16.1% |
| Total | 845 | 100.0% |
Internet Access in Collins
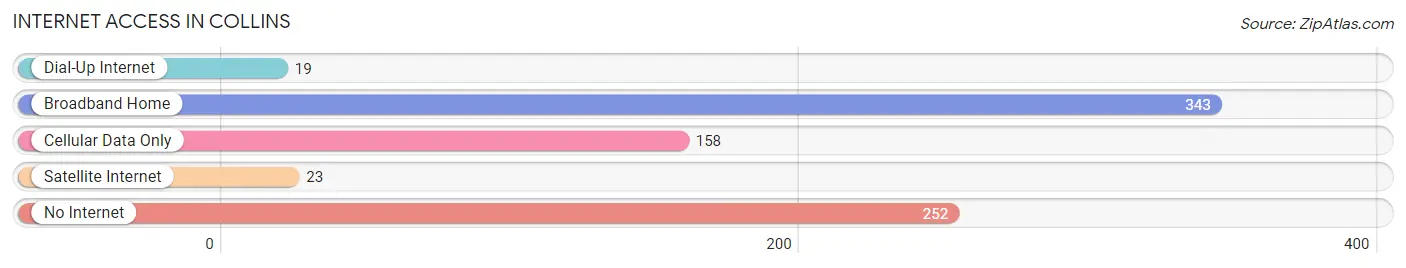
| Internet Type | # Households | % Households |
| Dial-Up Internet | 19 | 2.2% |
| Broadband Home | 343 | 40.6% |
| Cellular Data Only | 158 | 18.7% |
| Satellite Internet | 23 | 2.7% |
| No Internet | 252 | 29.8% |
| Total | 845 | 100.0% |
Collins Summary
MS History
Mississippi is a state located in the southeastern region of the United States. It is bordered by Tennessee to the north, Alabama to the east, the Gulf of Mexico to the south, and Louisiana and Arkansas to the west. Mississippi has a rich and diverse history, with its earliest inhabitants being Native American tribes such as the Choctaw, Chickasaw, and Natchez. The first Europeans to explore the area were the Spanish, who arrived in the 16th century. The French then established a colony in the area in the 17th century, and the British took control of the region in the 18th century.
Mississippi became part of the United States in 1798, and was admitted as the 20th state in 1817. During the 19th century, Mississippi was a slave state, and the state was a major battleground during the Civil War. After the war, Mississippi was the first state to ratify the 13th Amendment, which abolished slavery.
In the late 19th and early 20th centuries, Mississippi was a major center of the civil rights movement. The state was the site of the 1964 Freedom Summer, when civil rights activists from around the country came to Mississippi to register African-American voters and challenge segregation. In the late 20th century, Mississippi was the site of the first successful civil rights lawsuit, which resulted in the desegregation of the state’s public schools.
MS Geography
Mississippi is located in the southeastern region of the United States. It is bordered by Tennessee to the north, Alabama to the east, the Gulf of Mexico to the south, and Louisiana and Arkansas to the west. Mississippi is the 32nd largest state in the US, with an area of 48,430 square miles.
The state is divided into three distinct geographic regions: the Gulf Coastal Plain, the Mississippi Alluvial Plain, and the Mississippi Hills. The Gulf Coastal Plain is located along the Gulf of Mexico and is characterized by flat, low-lying land. The Mississippi Alluvial Plain is located in the northern part of the state and is characterized by flat, fertile land. The Mississippi Hills are located in the western part of the state and are characterized by rolling hills and valleys.
The state is home to a variety of natural features, including the Mississippi River, which forms the western border of the state, and the Gulf of Mexico, which forms the southern border. Other major rivers in the state include the Pearl, Big Black, and Yazoo Rivers. The state is also home to a variety of lakes, including Ross Barnett Reservoir, Sardis Lake, and Grenada Lake.
MS Economy
Mississippi’s economy is largely based on agriculture, manufacturing, and services. The state’s agricultural sector is the largest in the nation, with crops such as cotton, soybeans, corn, and rice being the most important. The state’s manufacturing sector is also important, with products such as furniture, chemicals, and food processing being the most important. The state’s service sector is also important, with tourism, healthcare, and education being the most important.
The state’s economy has been growing steadily in recent years, with the unemployment rate falling from 8.5% in 2010 to 5.2% in 2019. The state’s GDP has also been growing steadily, with the state’s GDP increasing from $90.3 billion in 2010 to $125.3 billion in 2019.
MS Demographics
As of 2019, Mississippi had an estimated population of 2,976,149. The state’s population is largely composed of African Americans, who make up 38.3% of the population. Whites make up 57.2% of the population, while Hispanics make up 2.3% of the population.
The state’s median household income is $41,754, and the poverty rate is 19.8%. The state’s largest cities are Jackson, Gulfport, and Hattiesburg. The state’s capital is Jackson, which is also the largest city in the state.
Common Questions
What is Per Capita Income in Collins?
Per Capita income in Collins is $15,850.
What is the Median Family Income in Collins?
Median Family Income in Collins is $37,181.
What is the Median Household income in Collins?
Median Household Income in Collins is $31,435.
What is Income or Wage Gap in Collins?
Income or Wage Gap in Collins is 53.3%.
Women in Collins earn 46.7 cents for every dollar earned by a man.
What is Family Income Deficit in Collins?
Family Income Deficit in Collins is $7,126.
Families that are below poverty line in Collins earn $7,126 less on average than the poverty threshold level.
What is Inequality or Gini Index in Collins?
Inequality or Gini Index in Collins is 0.41.
What is the Total Population of Collins?
Total Population of Collins is 2,270.
What is the Total Male Population of Collins?
Total Male Population of Collins is 1,046.
What is the Total Female Population of Collins?
Total Female Population of Collins is 1,224.
What is the Ratio of Males per 100 Females in Collins?
There are 85.46 Males per 100 Females in Collins.
What is the Ratio of Females per 100 Males in Collins?
There are 117.02 Females per 100 Males in Collins.
What is the Median Population Age in Collins?
Median Population Age in Collins is 53.6 Years.
What is the Average Family Size in Collins
Average Family Size in Collins is 3.1 People.
What is the Average Household Size in Collins
Average Household Size in Collins is 2.3 People.
How Large is the Labor Force in Collins?
There are 762 People in the Labor Forcein in Collins.
What is the Percentage of People in the Labor Force in Collins?
41.4% of People are in the Labor Force in Collins.
What is the Unemployment Rate in Collins?
Unemployment Rate in Collins is 13.0%.