Sumrall, MS Map & Demographics
Sumrall Map
Sumrall Overview
$33,027
PER CAPITA INCOME
$94,545
AVG FAMILY INCOME
$82,292
AVG HOUSEHOLD INCOME
16.3%
WAGE / INCOME GAP [ % ]
83.7¢/ $1
WAGE / INCOME GAP [ $ ]
0.34
INEQUALITY / GINI INDEX
2,194
TOTAL POPULATION
1,151
MALE POPULATION
1,043
FEMALE POPULATION
110.35
MALES / 100 FEMALES
90.62
FEMALES / 100 MALES
38.3
MEDIAN AGE
3.2
AVG FAMILY SIZE
3.0
AVG HOUSEHOLD SIZE
1,170
LABOR FORCE [ PEOPLE ]
71.1%
PERCENT IN LABOR FORCE
7.5%
UNEMPLOYMENT RATE
Sumrall Zip Codes
Income in Sumrall
Income Overview in Sumrall
Per Capita Income in Sumrall is $33,027, while median incomes of families and households are $94,545 and $82,292 respectively.
| Characteristic | Number | Measure |
| Per Capita Income | 2,194 | $33,027 |
| Median Family Income | 618 | $94,545 |
| Mean Family Income | 618 | $106,800 |
| Median Household Income | 735 | $82,292 |
| Mean Household Income | 735 | $98,062 |
| Income Deficit | 618 | $0 |
| Wage / Income Gap (%) | 2,194 | 16.29% |
| Wage / Income Gap ($) | 2,194 | 83.71¢ per $1 |
| Gini / Inequality Index | 2,194 | 0.34 |
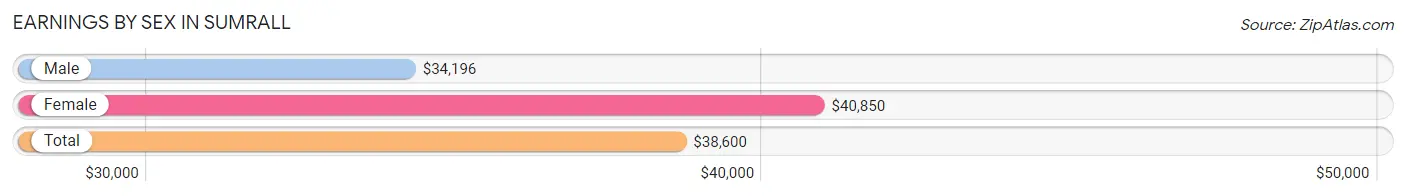
Earnings by Sex in Sumrall
Average Earnings in Sumrall are $38,600, $34,196 for men and $40,850 for women, a difference of 16.3%.
| Sex | Number | Average Earnings |
| Male | 629 (54.4%) | $34,196 |
| Female | 527 (45.6%) | $40,850 |
| Total | 1,156 (100.0%) | $38,600 |
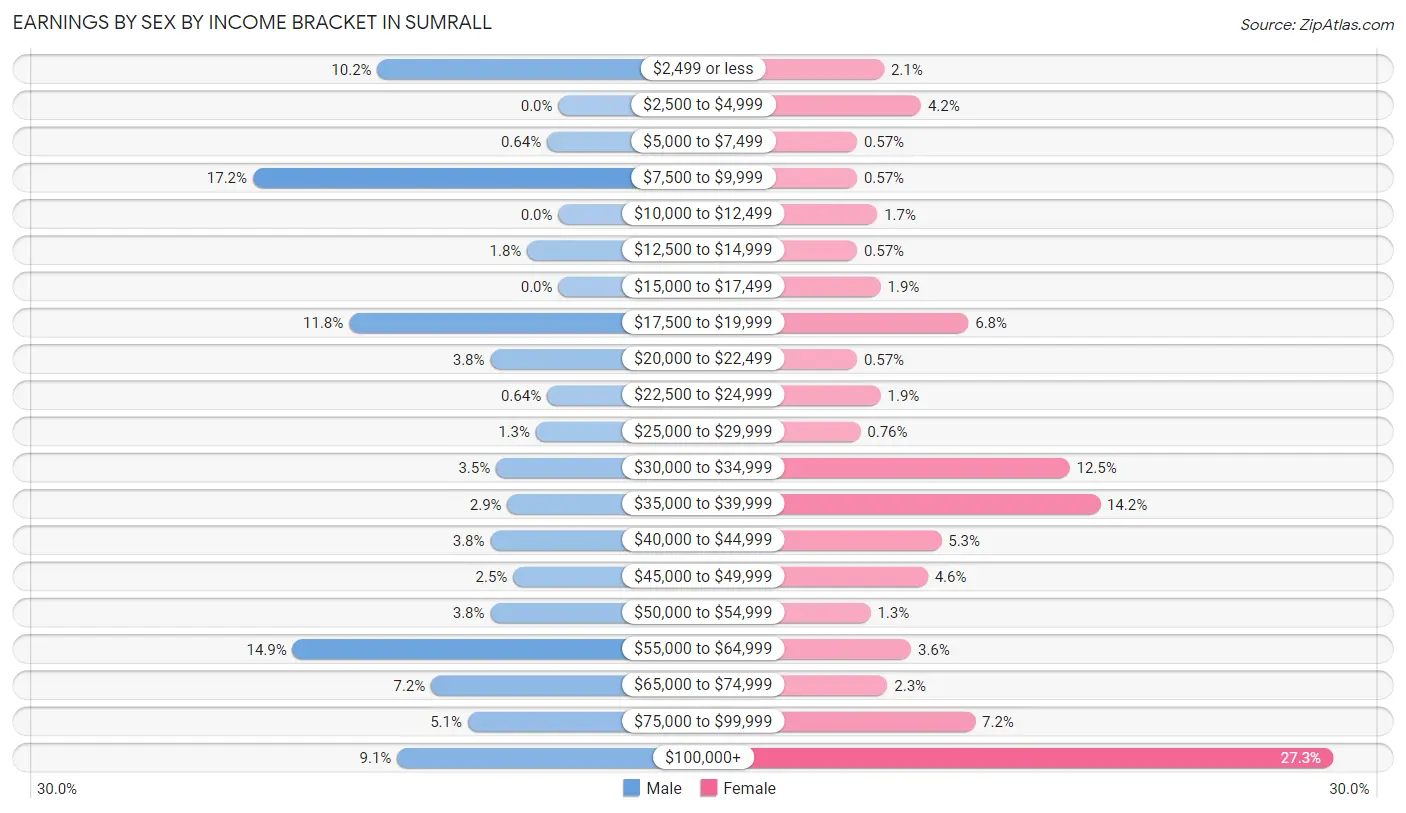
Earnings by Sex by Income Bracket in Sumrall
The most common earnings brackets in Sumrall are $7,500 to $9,999 for men (108 | 17.2%) and $100,000+ for women (144 | 27.3%).
| Income | Male | Female |
| $2,499 or less | 64 (10.2%) | 11 (2.1%) |
| $2,500 to $4,999 | 0 (0.0%) | 22 (4.2%) |
| $5,000 to $7,499 | 4 (0.6%) | 3 (0.6%) |
| $7,500 to $9,999 | 108 (17.2%) | 3 (0.6%) |
| $10,000 to $12,499 | 0 (0.0%) | 9 (1.7%) |
| $12,500 to $14,999 | 11 (1.8%) | 3 (0.6%) |
| $15,000 to $17,499 | 0 (0.0%) | 10 (1.9%) |
| $17,500 to $19,999 | 74 (11.8%) | 36 (6.8%) |
| $20,000 to $22,499 | 24 (3.8%) | 3 (0.6%) |
| $22,500 to $24,999 | 4 (0.6%) | 10 (1.9%) |
| $25,000 to $29,999 | 8 (1.3%) | 4 (0.8%) |
| $30,000 to $34,999 | 22 (3.5%) | 66 (12.5%) |
| $35,000 to $39,999 | 18 (2.9%) | 75 (14.2%) |
| $40,000 to $44,999 | 24 (3.8%) | 28 (5.3%) |
| $45,000 to $49,999 | 16 (2.5%) | 24 (4.5%) |
| $50,000 to $54,999 | 24 (3.8%) | 7 (1.3%) |
| $55,000 to $64,999 | 94 (14.9%) | 19 (3.6%) |
| $65,000 to $74,999 | 45 (7.1%) | 12 (2.3%) |
| $75,000 to $99,999 | 32 (5.1%) | 38 (7.2%) |
| $100,000+ | 57 (9.1%) | 144 (27.3%) |
| Total | 629 (100.0%) | 527 (100.0%) |
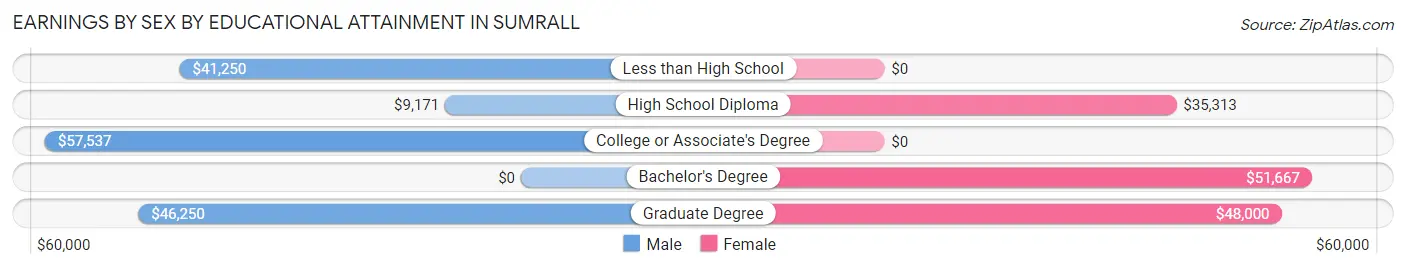
Earnings by Sex by Educational Attainment in Sumrall
Average earnings in Sumrall are $40,221 for men and $45,391 for women, a difference of 11.4%. Men with an educational attainment of college or associate's degree enjoy the highest average annual earnings of $57,537, while those with high school diploma education earn the least with $9,171. Women with an educational attainment of bachelor's degree earn the most with the average annual earnings of $51,667, while those with high school diploma education have the smallest earnings of $35,313.
| Educational Attainment | Male Income | Female Income |
| Less than High School | $41,250 | $0 |
| High School Diploma | $9,171 | $35,313 |
| College or Associate's Degree | $57,537 | $0 |
| Bachelor's Degree | - | - |
| Graduate Degree | $46,250 | $48,000 |
| Total | $40,221 | $45,391 |
Family Income in Sumrall
Family Income Brackets in Sumrall
According to the Sumrall family income data, there are 180 families falling into the $100,000 to $149,999 income range, which is the most common income bracket and makes up 29.1% of all families. Conversely, the less than $10,000 income bracket is the least frequent group with only 1 families (0.2%) belonging to this category.
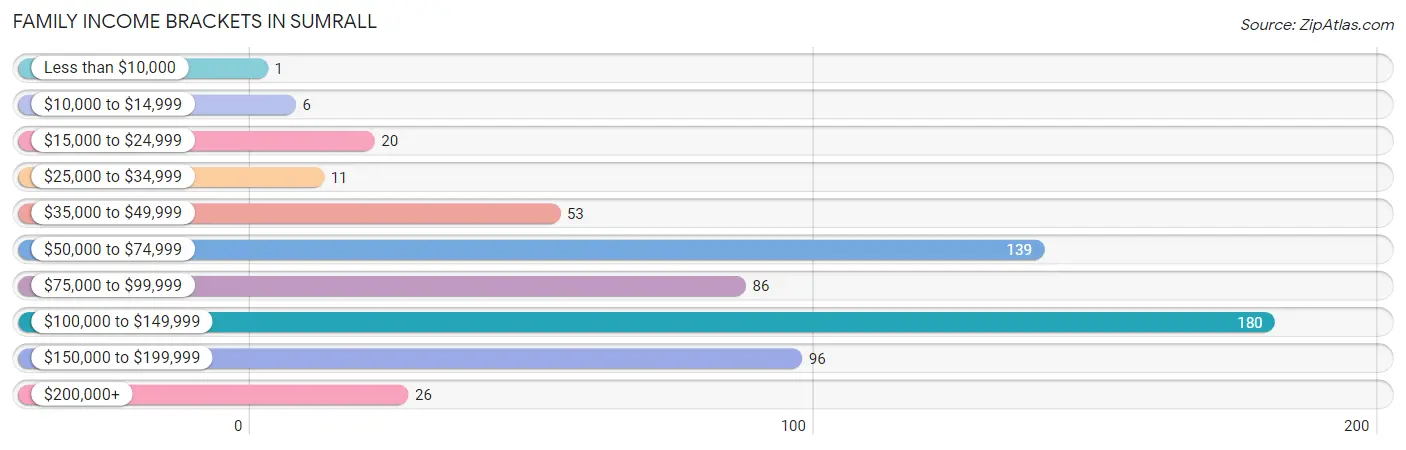
| Income Bracket | # Families | % Families |
| Less than $10,000 | 1 | 0.2% |
| $10,000 to $14,999 | 6 | 1.0% |
| $15,000 to $24,999 | 20 | 3.2% |
| $25,000 to $34,999 | 11 | 1.8% |
| $35,000 to $49,999 | 53 | 8.6% |
| $50,000 to $74,999 | 139 | 22.5% |
| $75,000 to $99,999 | 86 | 13.9% |
| $100,000 to $149,999 | 180 | 29.1% |
| $150,000 to $199,999 | 96 | 15.5% |
| $200,000+ | 26 | 4.2% |
Family Income by Famaliy Size in Sumrall
6-person families (80 | 12.9%) account for the highest median family income in Sumrall with $152,197 per family, while 2-person families (289 | 46.8%) have the highest median income of $61,280 per family member.
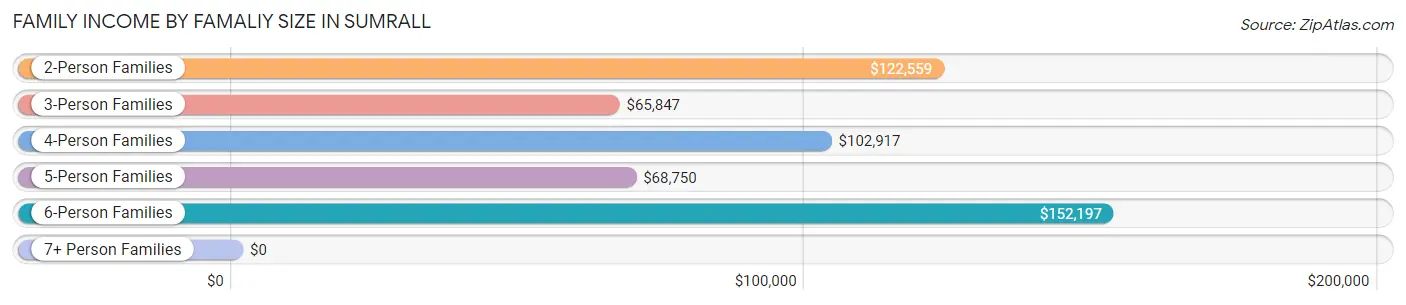
| Income Bracket | # Families | Median Income |
| 2-Person Families | 289 (46.8%) | $122,559 |
| 3-Person Families | 137 (22.2%) | $65,847 |
| 4-Person Families | 87 (14.1%) | $102,917 |
| 5-Person Families | 25 (4.1%) | $68,750 |
| 6-Person Families | 80 (12.9%) | $152,197 |
| 7+ Person Families | 0 (0.0%) | $0 |
| Total | 618 (100.0%) | $94,545 |
Family Income by Number of Earners in Sumrall
The median family income in Sumrall is $94,545, with families comprising 3+ earners (55) having the highest median family income of $150,644, while families with 1 earner (174) have the lowest median family income of $62,721, accounting for 8.9% and 28.2% of families, respectively.
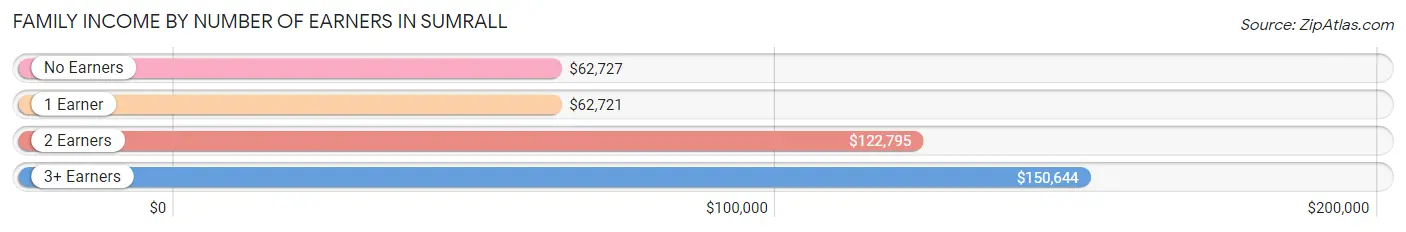
| Number of Earners | # Families | Median Income |
| No Earners | 54 (8.7%) | $62,727 |
| 1 Earner | 174 (28.2%) | $62,721 |
| 2 Earners | 335 (54.2%) | $122,795 |
| 3+ Earners | 55 (8.9%) | $150,644 |
| Total | 618 (100.0%) | $94,545 |
Household Income in Sumrall
Household Income Brackets in Sumrall
With 189 households falling in the category, the $100,000 to $149,999 income range is the most frequent in Sumrall, accounting for 25.7% of all households. In contrast, only 3 households (0.4%) fall into the less than $10,000 income bracket, making it the least populous group.
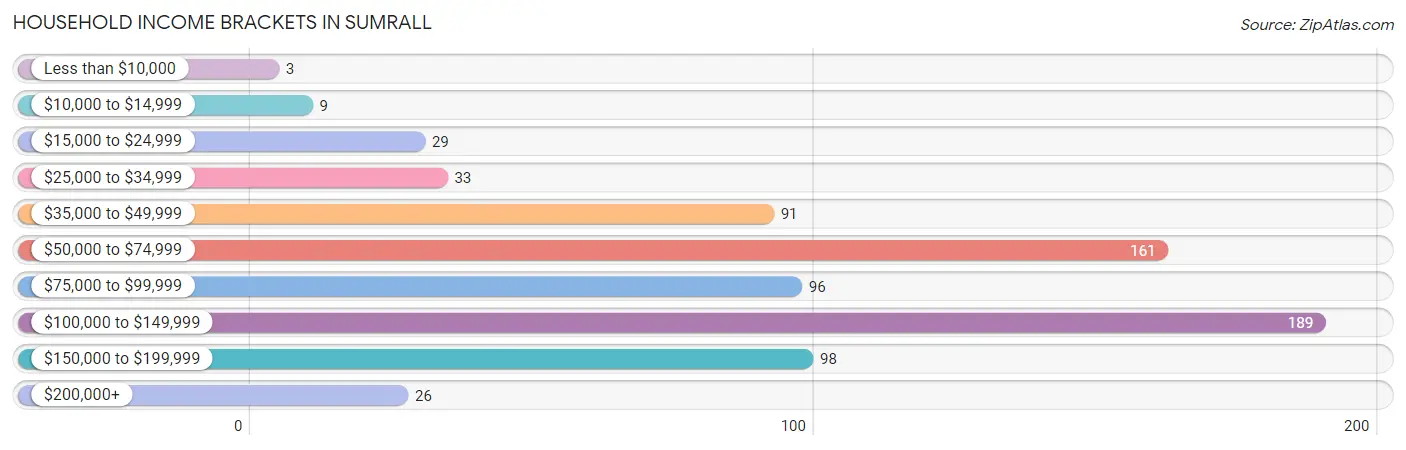
| Income Bracket | # Households | % Households |
| Less than $10,000 | 3 | 0.4% |
| $10,000 to $14,999 | 9 | 1.2% |
| $15,000 to $24,999 | 29 | 3.9% |
| $25,000 to $34,999 | 33 | 4.5% |
| $35,000 to $49,999 | 91 | 12.4% |
| $50,000 to $74,999 | 161 | 21.9% |
| $75,000 to $99,999 | 96 | 13.1% |
| $100,000 to $149,999 | 189 | 25.7% |
| $150,000 to $199,999 | 98 | 13.3% |
| $200,000+ | 26 | 3.5% |
Household Income by Householder Age in Sumrall
The median household income in Sumrall is $82,292, with the highest median household income of $98,750 found in the 25 to 44 years age bracket for the primary householder. A total of 268 households (36.5%) fall into this category. Meanwhile, the 15 to 24 years age bracket for the primary householder has the lowest median household income of $0, with 11 households (1.5%) in this group.
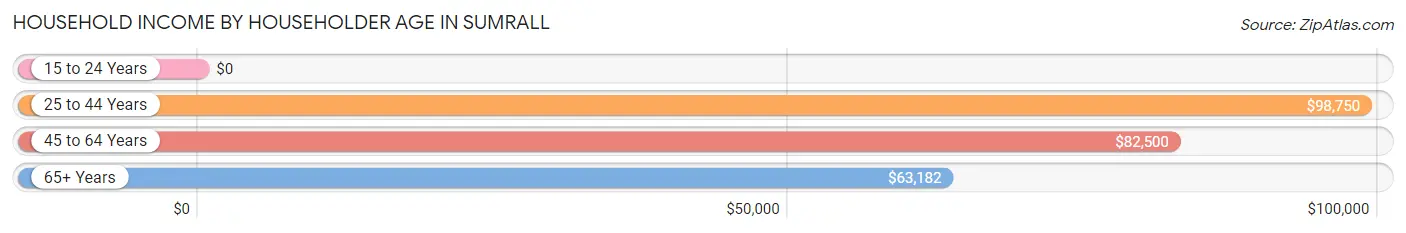
| Income Bracket | # Households | Median Income |
| 15 to 24 Years | 11 (1.5%) | $0 |
| 25 to 44 Years | 268 (36.5%) | $98,750 |
| 45 to 64 Years | 332 (45.2%) | $82,500 |
| 65+ Years | 124 (16.9%) | $63,182 |
| Total | 735 (100.0%) | $82,292 |
Poverty in Sumrall
Income Below Poverty by Sex and Age in Sumrall
With 3.7% poverty level for males and 8.2% for females among the residents of Sumrall, under 5 year old males and 15 year old females are the most vulnerable to poverty, with 13 males (16.1%) and 8 females (72.7%) in their respective age groups living below the poverty level.
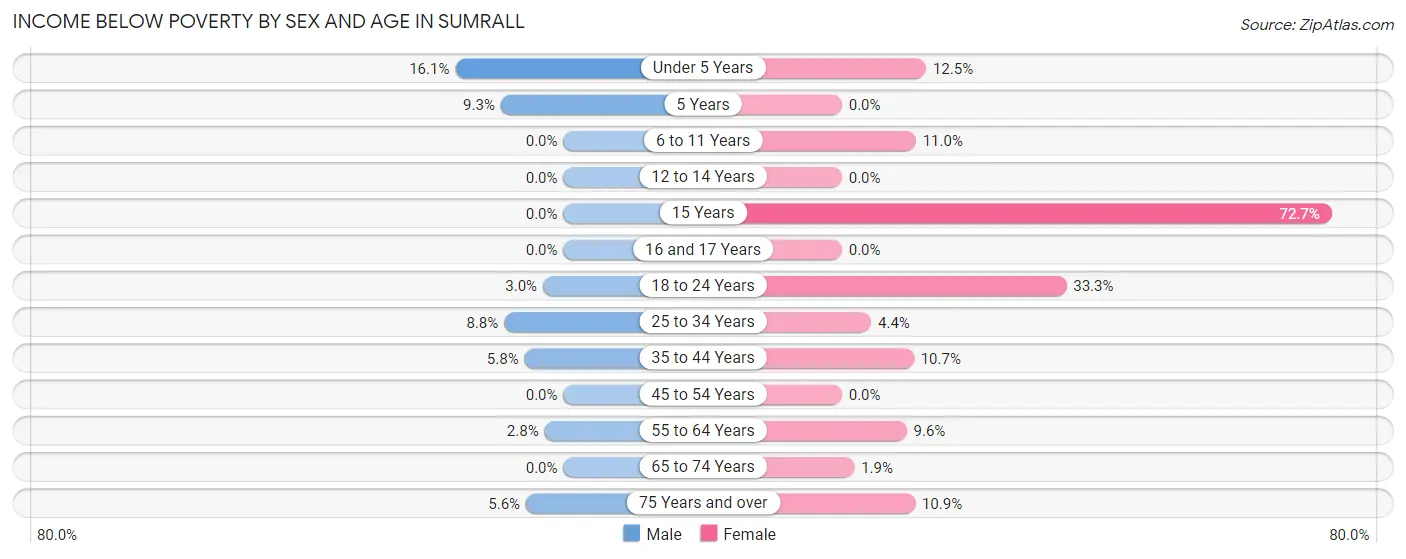
| Age Bracket | Male | Female |
| Under 5 Years | 13 (16.1%) | 7 (12.5%) |
| 5 Years | 4 (9.3%) | 0 (0.0%) |
| 6 to 11 Years | 0 (0.0%) | 9 (11.0%) |
| 12 to 14 Years | 0 (0.0%) | 0 (0.0%) |
| 15 Years | 0 (0.0%) | 8 (72.7%) |
| 16 and 17 Years | 0 (0.0%) | 0 (0.0%) |
| 18 to 24 Years | 2 (3.0%) | 20 (33.3%) |
| 25 to 34 Years | 11 (8.8%) | 3 (4.3%) |
| 35 to 44 Years | 6 (5.8%) | 22 (10.7%) |
| 45 to 54 Years | 0 (0.0%) | 0 (0.0%) |
| 55 to 64 Years | 4 (2.8%) | 5 (9.6%) |
| 65 to 74 Years | 0 (0.0%) | 1 (1.8%) |
| 75 Years and over | 3 (5.6%) | 10 (10.9%) |
| Total | 43 (3.7%) | 85 (8.2%) |
Income Above Poverty by Sex and Age in Sumrall
According to the poverty statistics in Sumrall, males aged 6 to 11 years and females aged 5 years are the age groups that are most secure financially, with 100.0% of males and 100.0% of females in these age groups living above the poverty line.
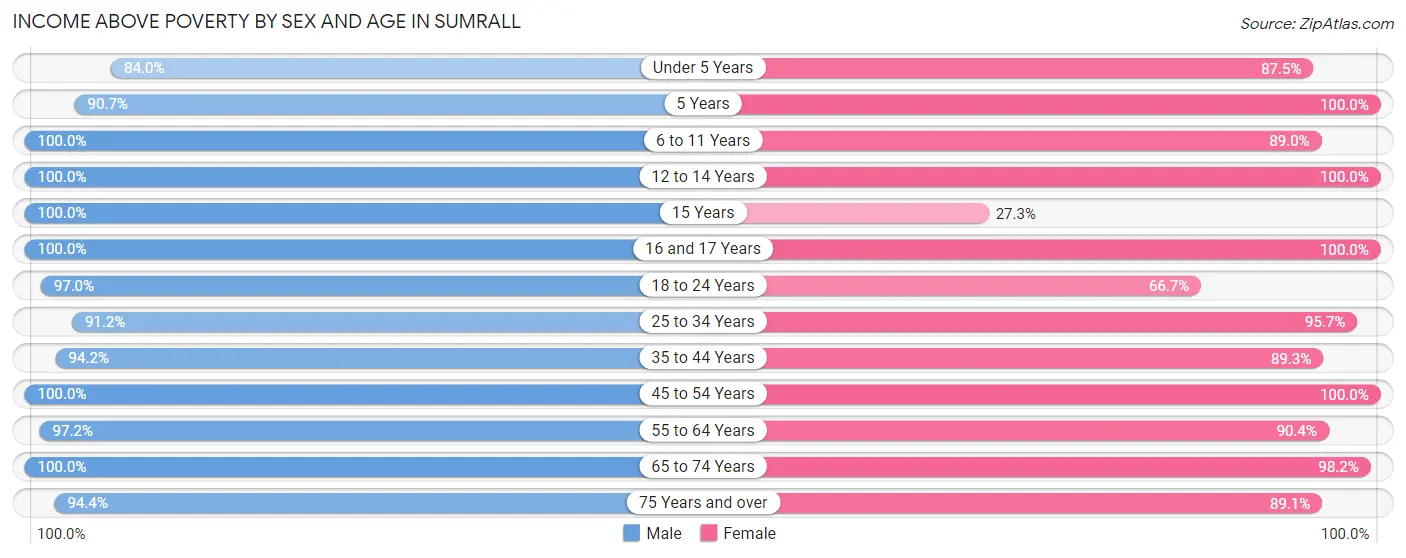
| Age Bracket | Male | Female |
| Under 5 Years | 68 (84.0%) | 49 (87.5%) |
| 5 Years | 39 (90.7%) | 7 (100.0%) |
| 6 to 11 Years | 120 (100.0%) | 73 (89.0%) |
| 12 to 14 Years | 80 (100.0%) | 53 (100.0%) |
| 15 Years | 15 (100.0%) | 3 (27.3%) |
| 16 and 17 Years | 57 (100.0%) | 60 (100.0%) |
| 18 to 24 Years | 64 (97.0%) | 40 (66.7%) |
| 25 to 34 Years | 114 (91.2%) | 66 (95.7%) |
| 35 to 44 Years | 98 (94.2%) | 184 (89.3%) |
| 45 to 54 Years | 225 (100.0%) | 240 (100.0%) |
| 55 to 64 Years | 139 (97.2%) | 47 (90.4%) |
| 65 to 74 Years | 38 (100.0%) | 53 (98.2%) |
| 75 Years and over | 51 (94.4%) | 82 (89.1%) |
| Total | 1,108 (96.3%) | 957 (91.8%) |
Income Below Poverty Among Married-Couple Families in Sumrall
The poverty statistics for married-couple families in Sumrall show that 0.2% or 1 of the total 533 families live below the poverty line. Families with 3 or 4 children have the highest poverty rate of 1.1%, comprising of 1 families. On the other hand, families with no children have the lowest poverty rate of 0.0%, which includes 0 families.
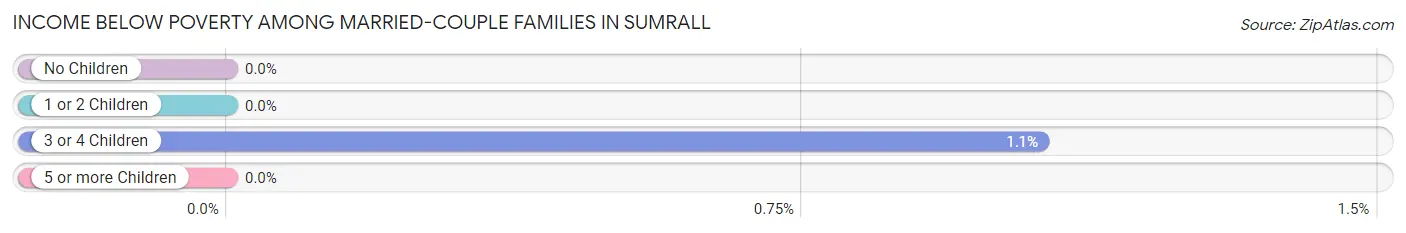
| Children | Above Poverty | Below Poverty |
| No Children | 267 (100.0%) | 0 (0.0%) |
| 1 or 2 Children | 172 (100.0%) | 0 (0.0%) |
| 3 or 4 Children | 93 (98.9%) | 1 (1.1%) |
| 5 or more Children | 0 (0.0%) | 0 (0.0%) |
| Total | 532 (99.8%) | 1 (0.2%) |
Income Below Poverty Among Single-Parent Households in Sumrall
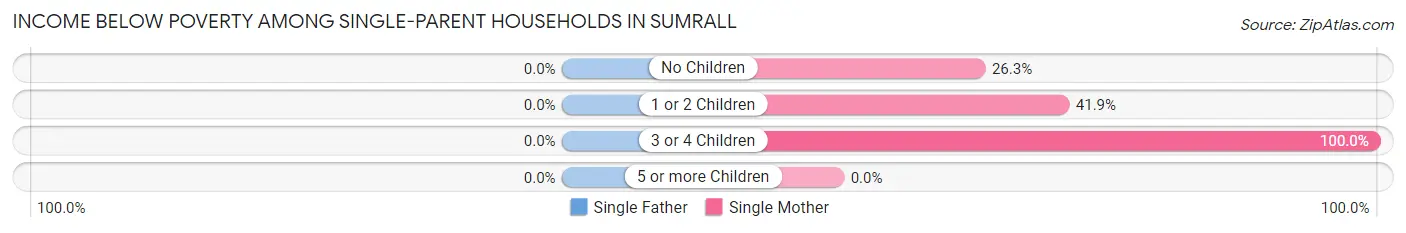
| Children | Single Father | Single Mother |
| No Children | 0 (0.0%) | 5 (26.3%) |
| 1 or 2 Children | 0 (0.0%) | 13 (41.9%) |
| 3 or 4 Children | 0 (0.0%) | 2 (100.0%) |
| 5 or more Children | 0 (0.0%) | 0 (0.0%) |
| Total | 0 (0.0%) | 20 (38.5%) |
Income Below Poverty Among Married-Couple vs Single-Parent Households in Sumrall
The poverty data for Sumrall shows that 1 of the married-couple family households (0.2%) and 20 of the single-parent households (23.5%) are living below the poverty level. Within the married-couple family households, those with 3 or 4 children have the highest poverty rate, with 1 households (1.1%) falling below the poverty line. Among the single-parent households, those with 3 or 4 children have the highest poverty rate, with 2 household (28.6%) living below poverty.
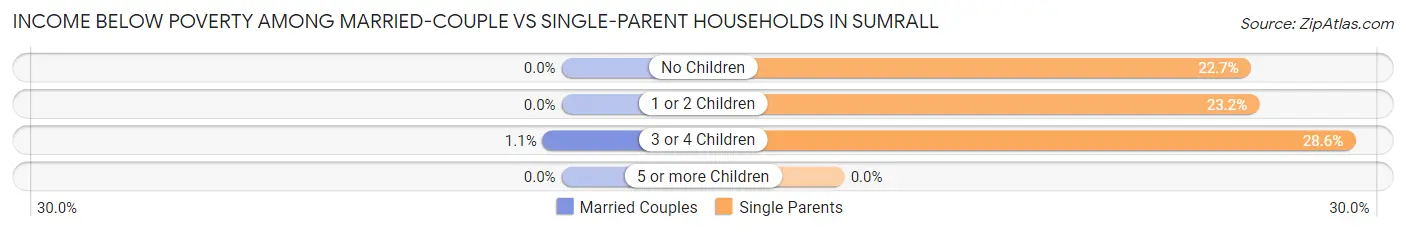
| Children | Married-Couple Families | Single-Parent Households |
| No Children | 0 (0.0%) | 5 (22.7%) |
| 1 or 2 Children | 0 (0.0%) | 13 (23.2%) |
| 3 or 4 Children | 1 (1.1%) | 2 (28.6%) |
| 5 or more Children | 0 (0.0%) | 0 (0.0%) |
| Total | 1 (0.2%) | 20 (23.5%) |
Race in Sumrall
The most populous races in Sumrall are White / Caucasian (1,718 | 78.3%), Black / African American (420 | 19.1%), and Two or more Races (56 | 2.5%).
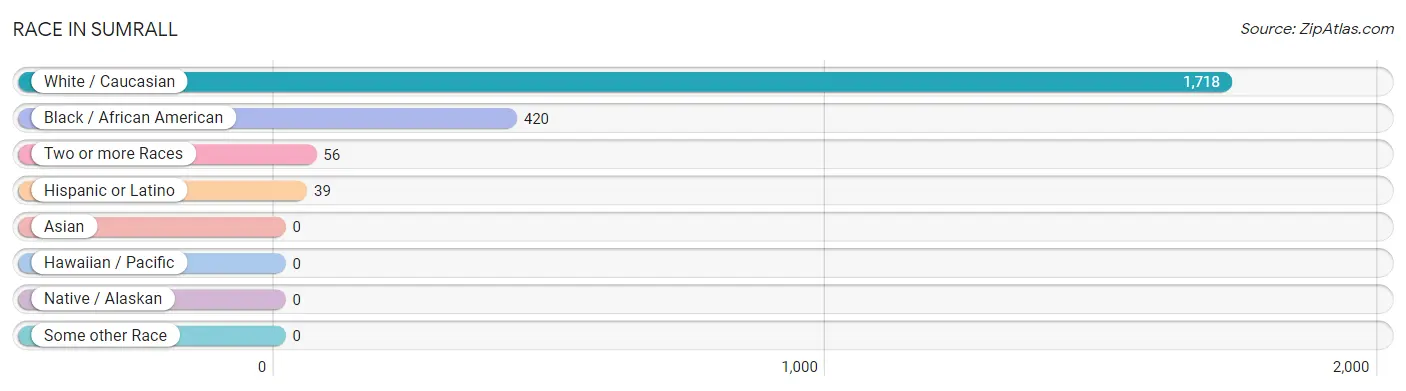
| Race | # Population | % Population |
| Asian | 0 | 0.0% |
| Black / African American | 420 | 19.1% |
| Hawaiian / Pacific | 0 | 0.0% |
| Hispanic or Latino | 39 | 1.8% |
| Native / Alaskan | 0 | 0.0% |
| White / Caucasian | 1,718 | 78.3% |
| Two or more Races | 56 | 2.5% |
| Some other Race | 0 | 0.0% |
| Total | 2,194 | 100.0% |
Ancestry in Sumrall
The most populous ancestries reported in Sumrall are American (531 | 24.2%), German (399 | 18.2%), Scottish (204 | 9.3%), English (173 | 7.9%), and Irish (151 | 6.9%), together accounting for 66.5% of all Sumrall residents.
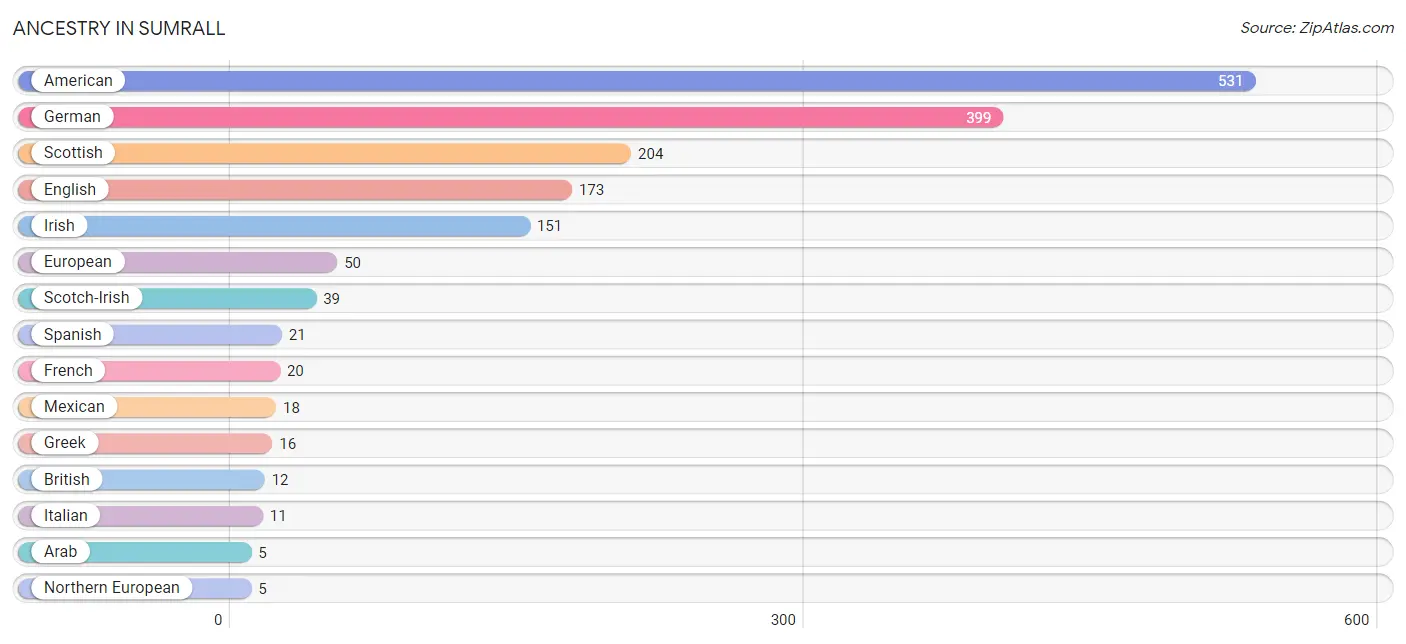
| Ancestry | # Population | % Population |
| American | 531 | 24.2% |
| Arab | 5 | 0.2% |
| British | 12 | 0.5% |
| Cheyenne | 2 | 0.1% |
| Dutch | 2 | 0.1% |
| English | 173 | 7.9% |
| European | 50 | 2.3% |
| French | 20 | 0.9% |
| French Canadian | 1 | 0.1% |
| German | 399 | 18.2% |
| Greek | 16 | 0.7% |
| Indian (Asian) | 4 | 0.2% |
| Irish | 151 | 6.9% |
| Italian | 11 | 0.5% |
| Mexican | 18 | 0.8% |
| Northern European | 5 | 0.2% |
| Romanian | 2 | 0.1% |
| Scotch-Irish | 39 | 1.8% |
| Scottish | 204 | 9.3% |
| Spanish | 21 | 1.0% |
| Swedish | 4 | 0.2% | View All 21 Rows |
Immigrants in Sumrall
The most numerous immigrant groups reported in Sumrall came from , and Asia (5 | 0.2%), together accounting for 0.2% of all Sumrall residents.

| Immigration Origin | # Population | % Population |
| Asia | 5 | 0.2% | View All 1 Rows |
Sex and Age in Sumrall
Sex and Age in Sumrall
The most populous age groups in Sumrall are 45 to 49 Years (175 | 15.2%) for men and 50 to 54 Years (200 | 19.2%) for women.
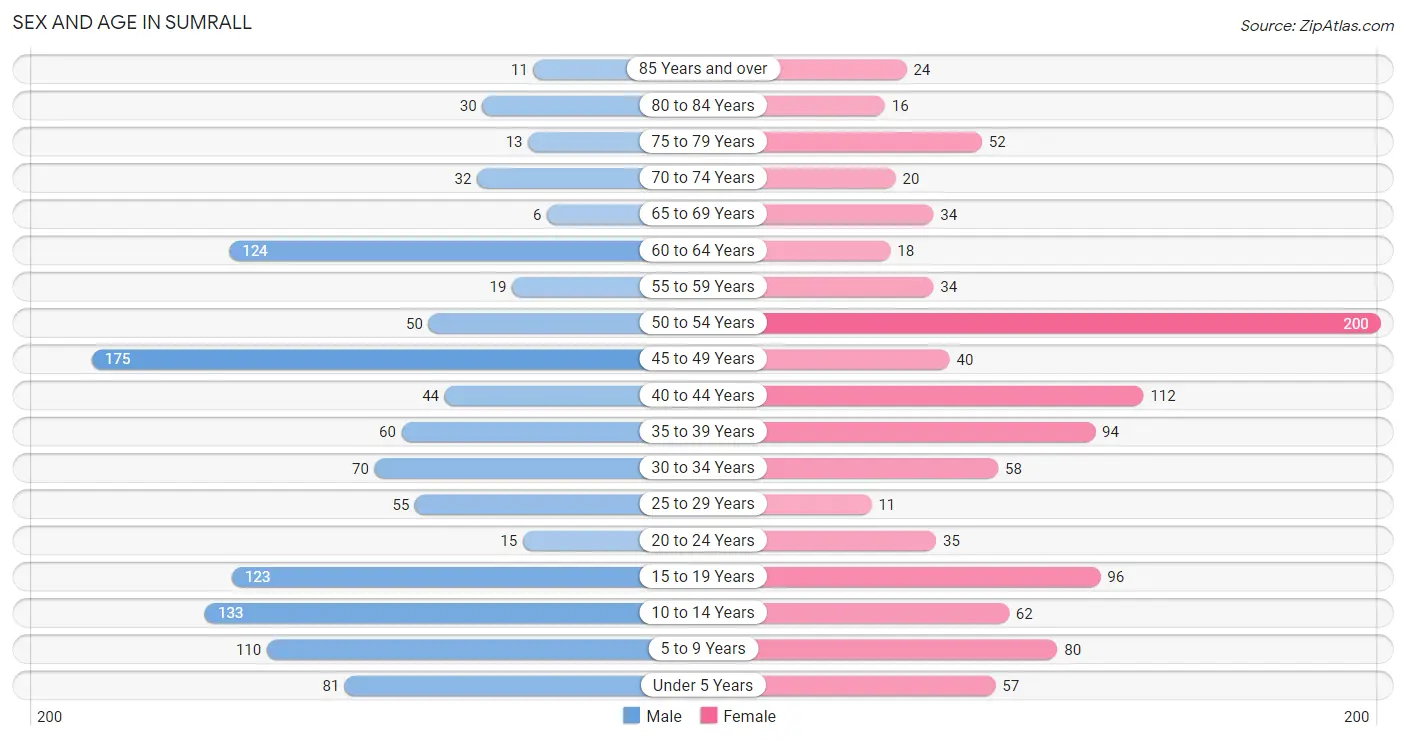
| Age Bracket | Male | Female |
| Under 5 Years | 81 (7.0%) | 57 (5.5%) |
| 5 to 9 Years | 110 (9.6%) | 80 (7.7%) |
| 10 to 14 Years | 133 (11.6%) | 62 (5.9%) |
| 15 to 19 Years | 123 (10.7%) | 96 (9.2%) |
| 20 to 24 Years | 15 (1.3%) | 35 (3.4%) |
| 25 to 29 Years | 55 (4.8%) | 11 (1.1%) |
| 30 to 34 Years | 70 (6.1%) | 58 (5.6%) |
| 35 to 39 Years | 60 (5.2%) | 94 (9.0%) |
| 40 to 44 Years | 44 (3.8%) | 112 (10.7%) |
| 45 to 49 Years | 175 (15.2%) | 40 (3.8%) |
| 50 to 54 Years | 50 (4.3%) | 200 (19.2%) |
| 55 to 59 Years | 19 (1.7%) | 34 (3.3%) |
| 60 to 64 Years | 124 (10.8%) | 18 (1.7%) |
| 65 to 69 Years | 6 (0.5%) | 34 (3.3%) |
| 70 to 74 Years | 32 (2.8%) | 20 (1.9%) |
| 75 to 79 Years | 13 (1.1%) | 52 (5.0%) |
| 80 to 84 Years | 30 (2.6%) | 16 (1.5%) |
| 85 Years and over | 11 (1.0%) | 24 (2.3%) |
| Total | 1,151 (100.0%) | 1,043 (100.0%) |
Families and Households in Sumrall
Median Family Size in Sumrall
The median family size in Sumrall is 3.24 persons per family, with married-couple families (533 | 86.3%) accounting for the largest median family size of 3.3 persons per family. On the other hand, single female/mother families (52 | 8.4%) represent the smallest median family size with 2.87 persons per family.
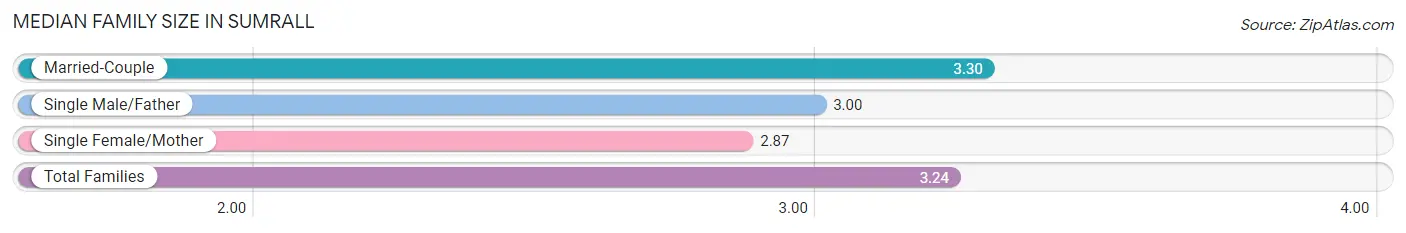
| Family Type | # Families | Family Size |
| Married-Couple | 533 (86.3%) | 3.30 |
| Single Male/Father | 33 (5.3%) | 3.00 |
| Single Female/Mother | 52 (8.4%) | 2.87 |
| Total Families | 618 (100.0%) | 3.24 |
Median Household Size in Sumrall
The median household size in Sumrall is 2.95 persons per household, with single female/mother households (52 | 7.1%) accounting for the largest median household size of 3.37 persons per household. non-family households (117 | 15.9%) represent the smallest median household size with 1.15 persons per household.
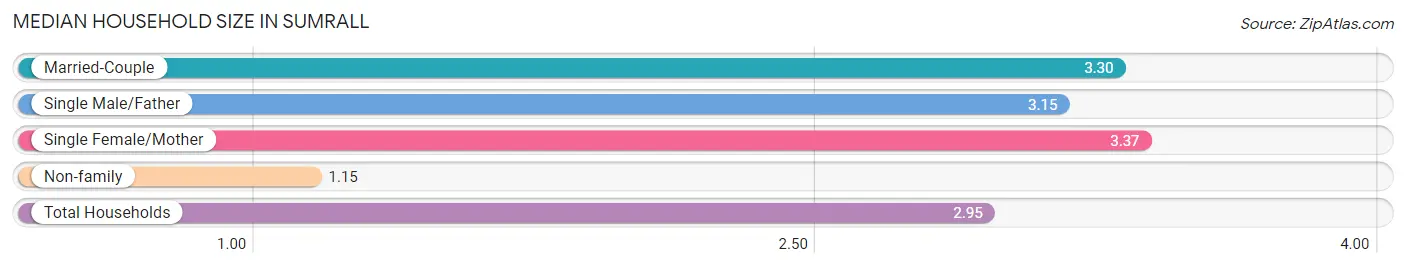
| Household Type | # Households | Household Size |
| Married-Couple | 533 (72.5%) | 3.30 |
| Single Male/Father | 33 (4.5%) | 3.15 |
| Single Female/Mother | 52 (7.1%) | 3.37 |
| Non-family | 117 (15.9%) | 1.15 |
| Total Households | 735 (100.0%) | 2.95 |
Household Size by Marriage Status in Sumrall
Out of a total of 735 households in Sumrall, 618 (84.1%) are family households, while 117 (15.9%) are nonfamily households. The most numerous type of family households are 2-person households, comprising 278, and the most common type of nonfamily households are 1-person households, comprising 98.
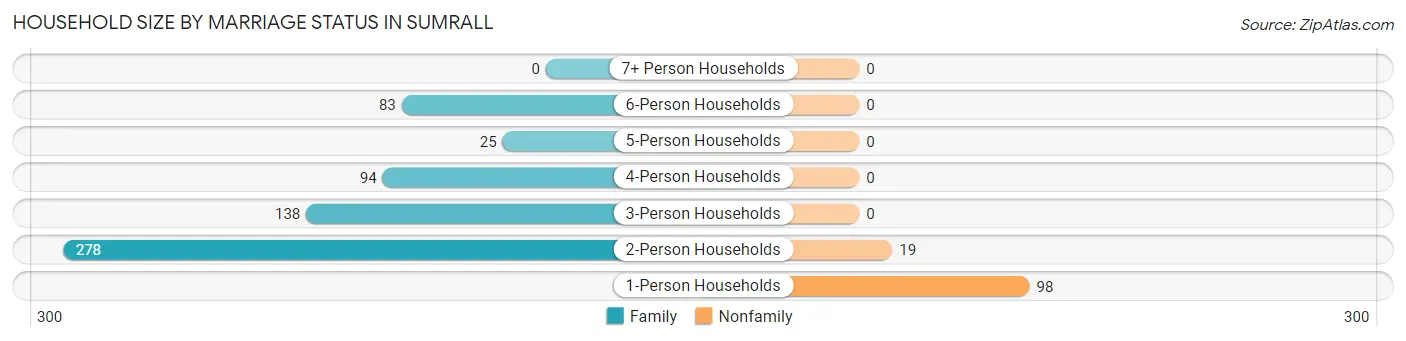
| Household Size | Family Households | Nonfamily Households |
| 1-Person Households | - | 98 (13.3%) |
| 2-Person Households | 278 (37.8%) | 19 (2.6%) |
| 3-Person Households | 138 (18.8%) | 0 (0.0%) |
| 4-Person Households | 94 (12.8%) | 0 (0.0%) |
| 5-Person Households | 25 (3.4%) | 0 (0.0%) |
| 6-Person Households | 83 (11.3%) | 0 (0.0%) |
| 7+ Person Households | 0 (0.0%) | 0 (0.0%) |
| Total | 618 (84.1%) | 117 (15.9%) |
Female Fertility in Sumrall
Fertility by Age in Sumrall
Average fertility rate in Sumrall is 24.0 births per 1,000 women. Women in the age bracket of 20 to 34 years have the highest fertility rate with 58.0 births per 1,000 women. Women in the age bracket of 20 to 34 years acount for 50.0% of all women with births.
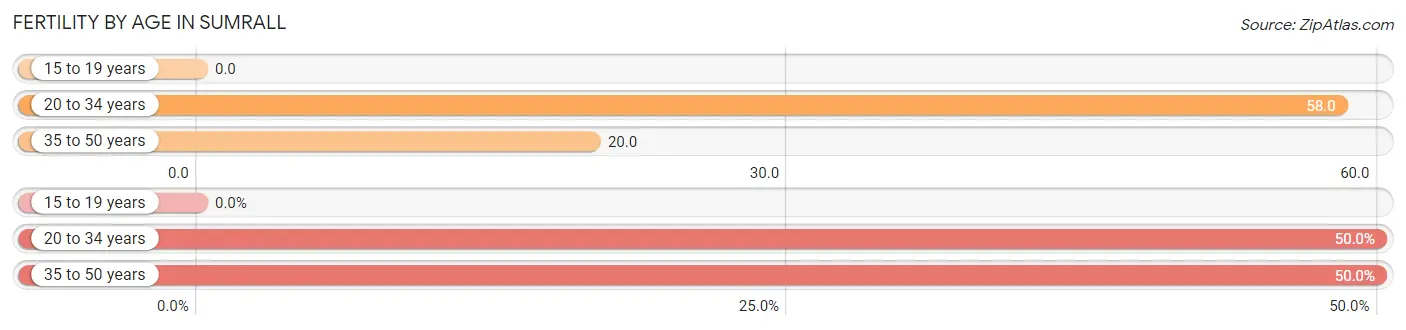
| Age Bracket | Women with Births | Births / 1,000 Women |
| 15 to 19 years | 0 (0.0%) | 0.0 |
| 20 to 34 years | 6 (50.0%) | 58.0 |
| 35 to 50 years | 6 (50.0%) | 20.0 |
| Total | 12 (100.0%) | 24.0 |
Fertility by Age by Marriage Status in Sumrall
58.3% of women with births (12) in Sumrall are married. The highest percentage of unmarried women with births falls into 20 to 34 years age bracket with 83.3% of them unmarried at the time of birth, while the lowest percentage of unmarried women with births belong to 35 to 50 years age bracket with 0.0% of them unmarried.
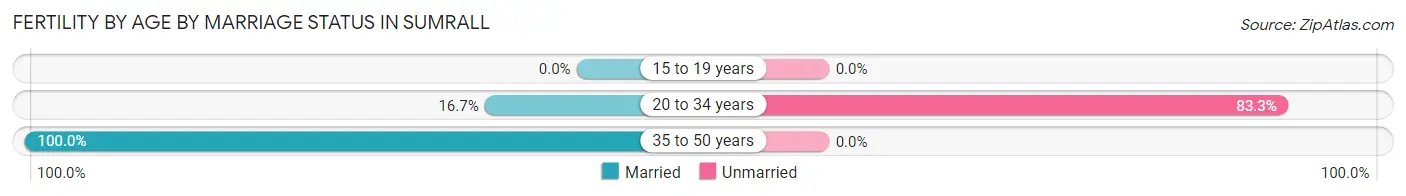
| Age Bracket | Married | Unmarried |
| 15 to 19 years | 0 (0.0%) | 0 (0.0%) |
| 20 to 34 years | 1 (16.7%) | 5 (83.3%) |
| 35 to 50 years | 6 (100.0%) | 0 (0.0%) |
| Total | 7 (58.3%) | 5 (41.7%) |
Fertility by Education in Sumrall
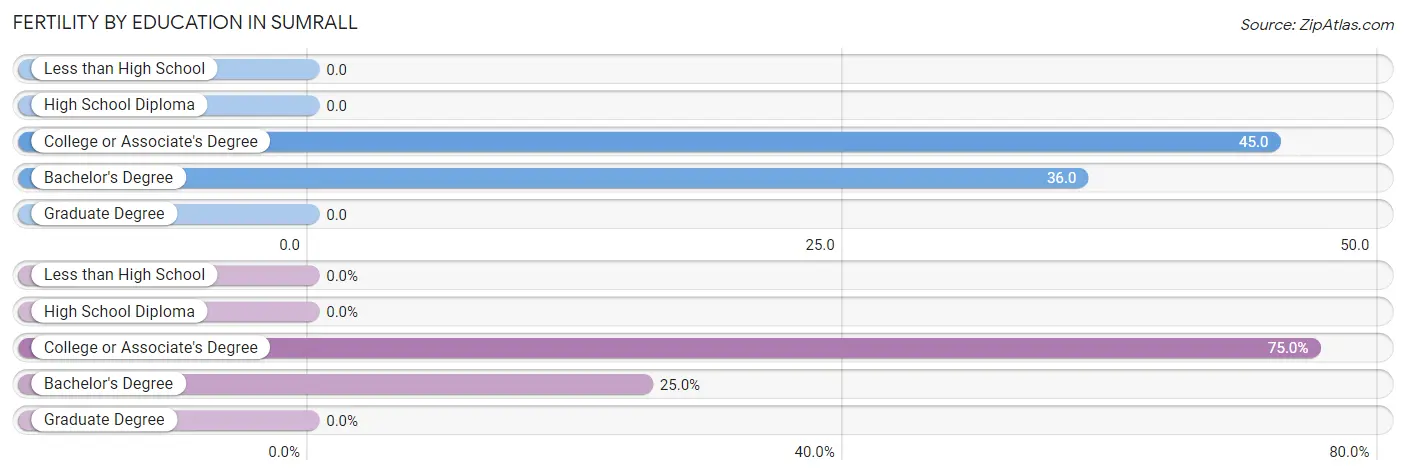
| Educational Attainment | Women with Births | Births / 1,000 Women |
| Less than High School | 0 (0.0%) | 0.0 |
| High School Diploma | 0 (0.0%) | 0.0 |
| College or Associate's Degree | 9 (75.0%) | 45.0 |
| Bachelor's Degree | 3 (25.0%) | 36.0 |
| Graduate Degree | 0 (0.0%) | 0.0 |
| Total | 12 (100.0%) | 24.0 |
Fertility by Education by Marriage Status in Sumrall
41.7% of women with births in Sumrall are unmarried. Women with the educational attainment of bachelor's degree are most likely to be married with 100.0% of them married at childbirth, while women with the educational attainment of college or associate's degree are least likely to be married with 55.6% of them unmarried at childbirth.
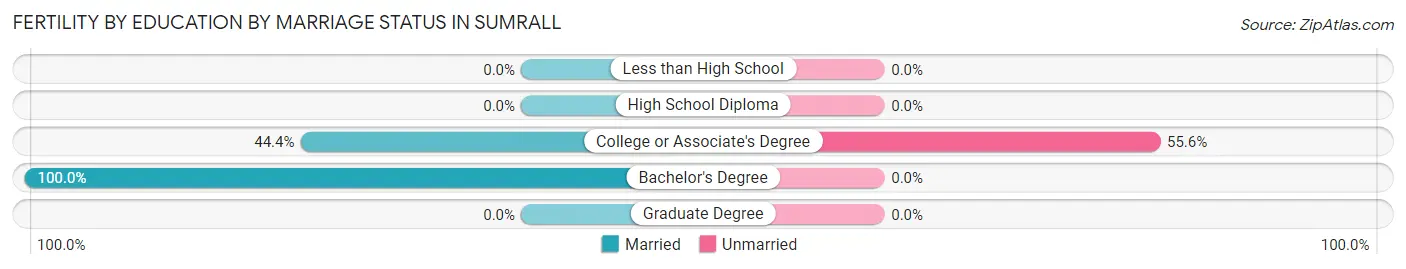
| Educational Attainment | Married | Unmarried |
| Less than High School | 0 (0.0%) | 0 (0.0%) |
| High School Diploma | 0 (0.0%) | 0 (0.0%) |
| College or Associate's Degree | 4 (44.4%) | 5 (55.6%) |
| Bachelor's Degree | 3 (100.0%) | 0 (0.0%) |
| Graduate Degree | 0 (0.0%) | 0 (0.0%) |
| Total | 7 (58.3%) | 5 (41.7%) |
Employment Characteristics in Sumrall
Employment by Class of Employer in Sumrall
Among the 1,075 employed individuals in Sumrall, private company employees (724 | 67.3%), self-employed (incorporated) (128 | 11.9%), and self-employed (not incorporated) (75 | 7.0%) make up the most common classes of employment.
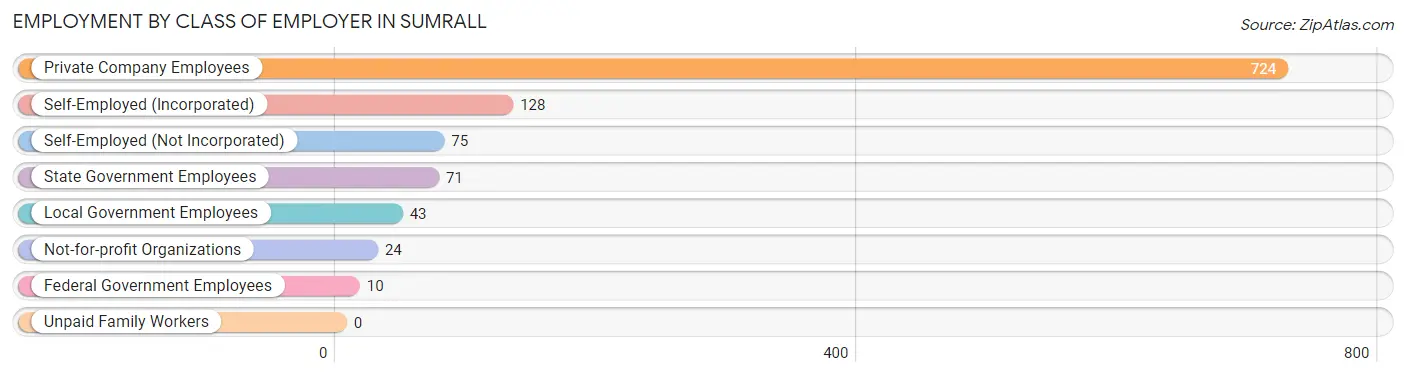
| Employer Class | # Employees | % Employees |
| Private Company Employees | 724 | 67.3% |
| Self-Employed (Incorporated) | 128 | 11.9% |
| Self-Employed (Not Incorporated) | 75 | 7.0% |
| Not-for-profit Organizations | 24 | 2.2% |
| Local Government Employees | 43 | 4.0% |
| State Government Employees | 71 | 6.6% |
| Federal Government Employees | 10 | 0.9% |
| Unpaid Family Workers | 0 | 0.0% |
| Total | 1,075 | 100.0% |
Employment Status by Age in Sumrall
According to the labor force statistics for Sumrall, out of the total population over 16 years of age (1,645), 71.1% or 1,170 individuals are in the labor force, with 7.5% or 88 of them unemployed. The age group with the highest labor force participation rate is 20 to 24 years, with 94.0% or 47 individuals in the labor force. Within the labor force, the 16 to 19 years age range has the highest percentage of unemployed individuals, with 89.9% or 80 of them being unemployed.
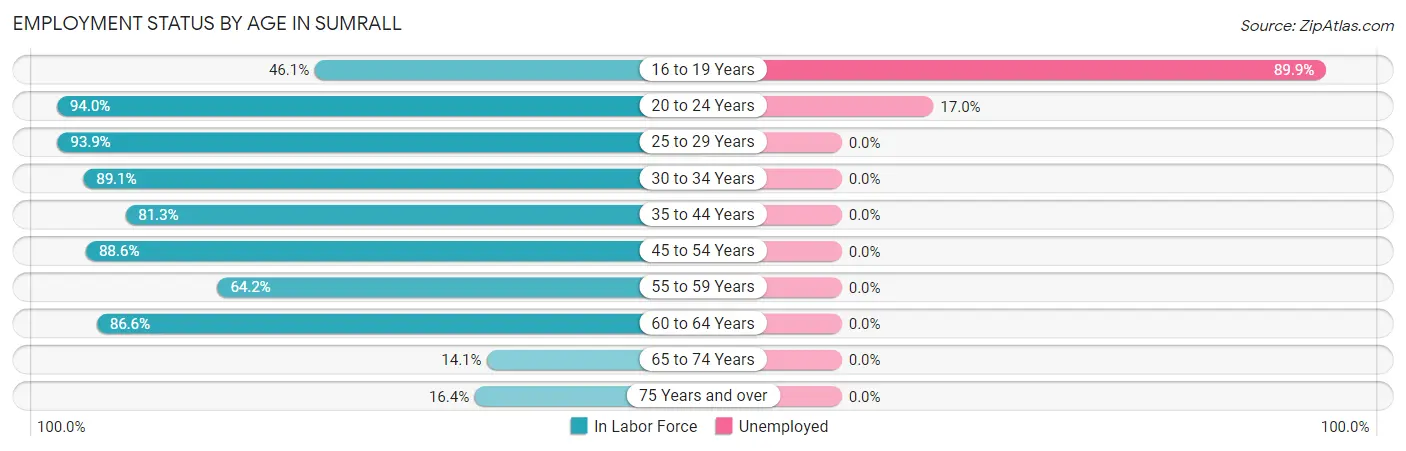
| Age Bracket | In Labor Force | Unemployed |
| 16 to 19 Years | 89 (46.1%) | 80 (89.9%) |
| 20 to 24 Years | 47 (94.0%) | 8 (17.0%) |
| 25 to 29 Years | 62 (93.9%) | 0 (0.0%) |
| 30 to 34 Years | 114 (89.1%) | 0 (0.0%) |
| 35 to 44 Years | 252 (81.3%) | 0 (0.0%) |
| 45 to 54 Years | 412 (88.6%) | 0 (0.0%) |
| 55 to 59 Years | 34 (64.2%) | 0 (0.0%) |
| 60 to 64 Years | 123 (86.6%) | 0 (0.0%) |
| 65 to 74 Years | 13 (14.1%) | 0 (0.0%) |
| 75 Years and over | 24 (16.4%) | 0 (0.0%) |
| Total | 1,170 (71.1%) | 88 (7.5%) |
Employment Status by Educational Attainment in Sumrall
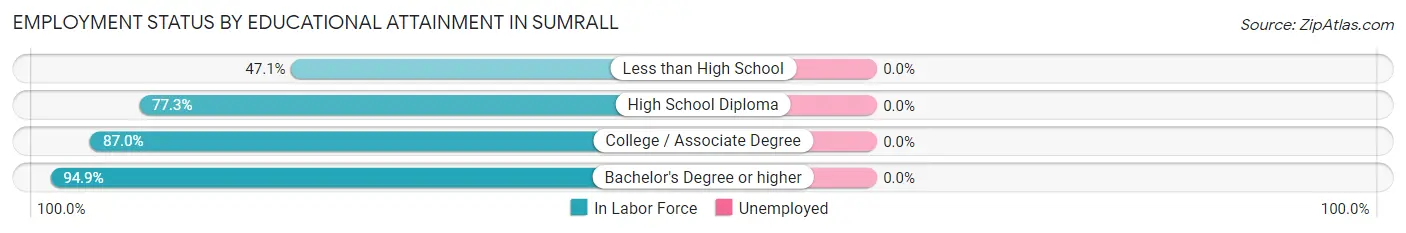
| Educational Attainment | In Labor Force | Unemployed |
| Less than High School | 16 (47.1%) | 0 (0.0%) |
| High School Diploma | 191 (77.3%) | 0 (0.0%) |
| College / Associate Degree | 529 (87.0%) | 0 (0.0%) |
| Bachelor's Degree or higher | 261 (94.9%) | 0 (0.0%) |
| Total | 998 (85.7%) | 0 (0.0%) |
Employment Occupations by Sex in Sumrall
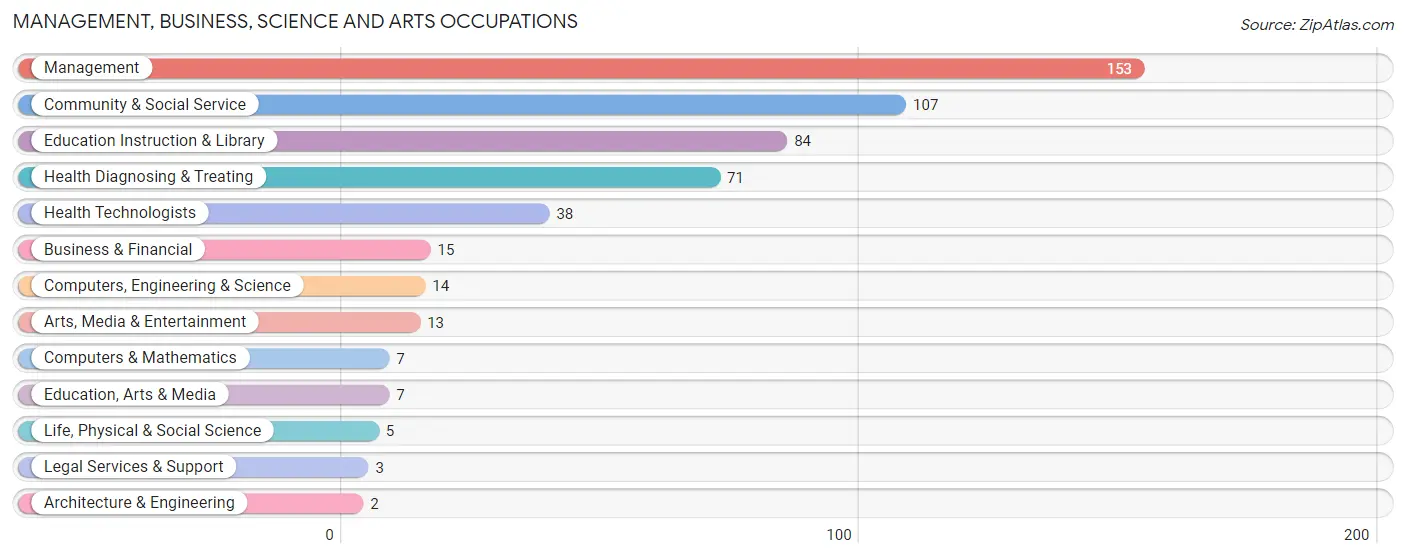
Management, Business, Science and Arts Occupations
The most common Management, Business, Science and Arts occupations in Sumrall are Management (153 | 14.2%), Community & Social Service (107 | 9.9%), Education Instruction & Library (84 | 7.8%), Health Diagnosing & Treating (71 | 6.6%), and Health Technologists (38 | 3.5%).
Management, Business, Science and Arts Occupations by Sex
Within the Management, Business, Science and Arts occupations in Sumrall, the most male-oriented occupations are Architecture & Engineering (100.0%), Life, Physical & Social Science (100.0%), and Computers, Engineering & Science (64.3%), while the most female-oriented occupations are Legal Services & Support (100.0%), Health Diagnosing & Treating (80.3%), and Management (73.9%).
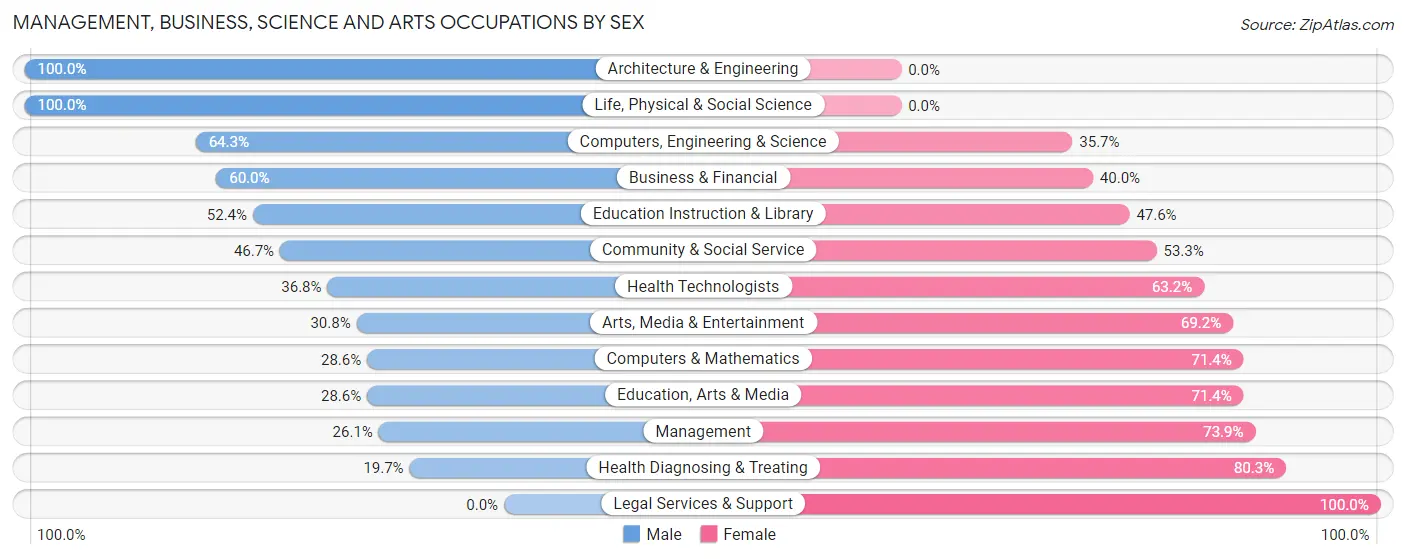
| Occupation | Male | Female |
| Management | 40 (26.1%) | 113 (73.9%) |
| Business & Financial | 9 (60.0%) | 6 (40.0%) |
| Computers, Engineering & Science | 9 (64.3%) | 5 (35.7%) |
| Computers & Mathematics | 2 (28.6%) | 5 (71.4%) |
| Architecture & Engineering | 2 (100.0%) | 0 (0.0%) |
| Life, Physical & Social Science | 5 (100.0%) | 0 (0.0%) |
| Community & Social Service | 50 (46.7%) | 57 (53.3%) |
| Education, Arts & Media | 2 (28.6%) | 5 (71.4%) |
| Legal Services & Support | 0 (0.0%) | 3 (100.0%) |
| Education Instruction & Library | 44 (52.4%) | 40 (47.6%) |
| Arts, Media & Entertainment | 4 (30.8%) | 9 (69.2%) |
| Health Diagnosing & Treating | 14 (19.7%) | 57 (80.3%) |
| Health Technologists | 14 (36.8%) | 24 (63.2%) |
| Total (Category) | 122 (33.9%) | 238 (66.1%) |
| Total (Overall) | 561 (52.0%) | 518 (48.0%) |
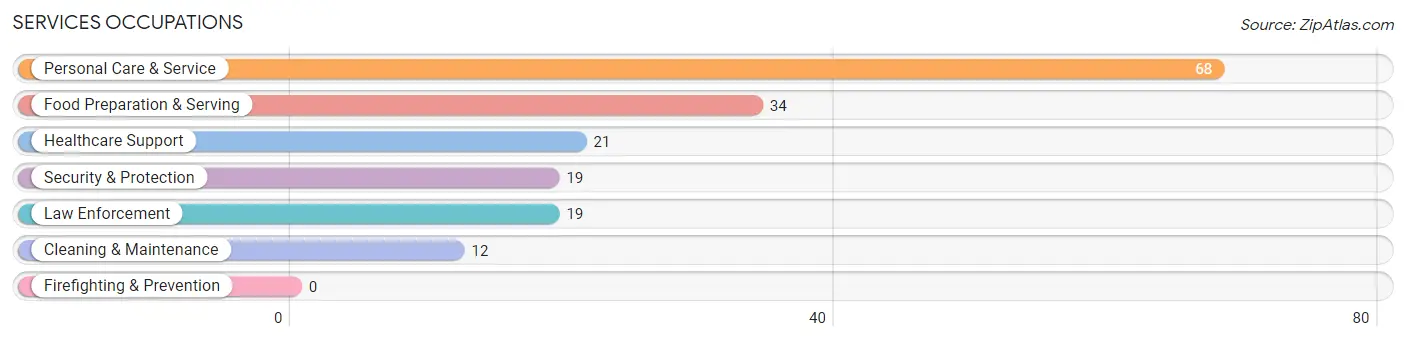
Services Occupations
The most common Services occupations in Sumrall are Personal Care & Service (68 | 6.3%), Food Preparation & Serving (34 | 3.2%), Healthcare Support (21 | 1.9%), Security & Protection (19 | 1.8%), and Law Enforcement (19 | 1.8%).
Services Occupations by Sex
Within the Services occupations in Sumrall, the most male-oriented occupations are Security & Protection (100.0%), Law Enforcement (100.0%), and Food Preparation & Serving (73.5%), while the most female-oriented occupations are Healthcare Support (100.0%), Personal Care & Service (100.0%), and Cleaning & Maintenance (91.7%).
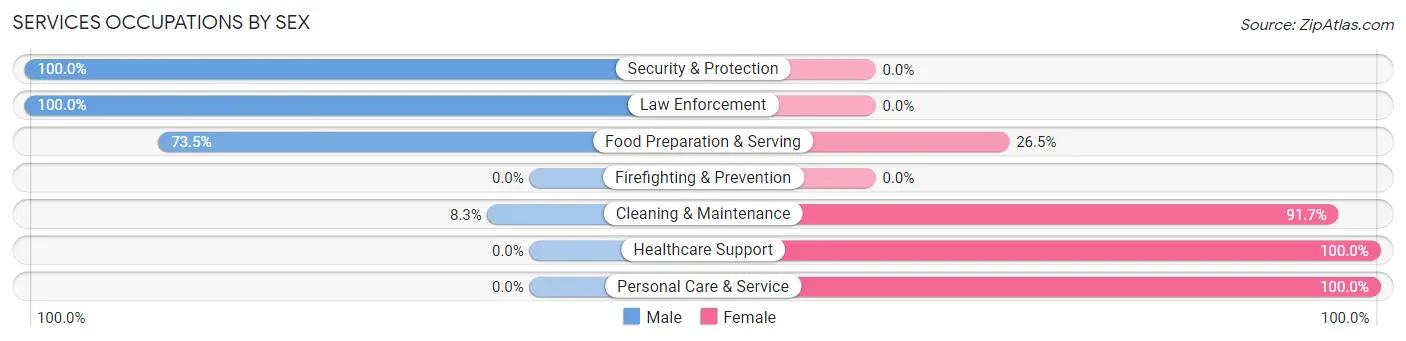
| Occupation | Male | Female |
| Healthcare Support | 0 (0.0%) | 21 (100.0%) |
| Security & Protection | 19 (100.0%) | 0 (0.0%) |
| Firefighting & Prevention | 0 (0.0%) | 0 (0.0%) |
| Law Enforcement | 19 (100.0%) | 0 (0.0%) |
| Food Preparation & Serving | 25 (73.5%) | 9 (26.5%) |
| Cleaning & Maintenance | 1 (8.3%) | 11 (91.7%) |
| Personal Care & Service | 0 (0.0%) | 68 (100.0%) |
| Total (Category) | 45 (29.2%) | 109 (70.8%) |
| Total (Overall) | 561 (52.0%) | 518 (48.0%) |
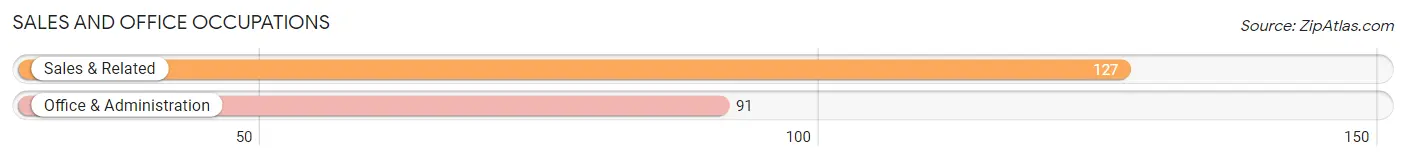
Sales and Office Occupations
The most common Sales and Office occupations in Sumrall are Sales & Related (127 | 11.8%), and Office & Administration (91 | 8.4%).
Sales and Office Occupations by Sex
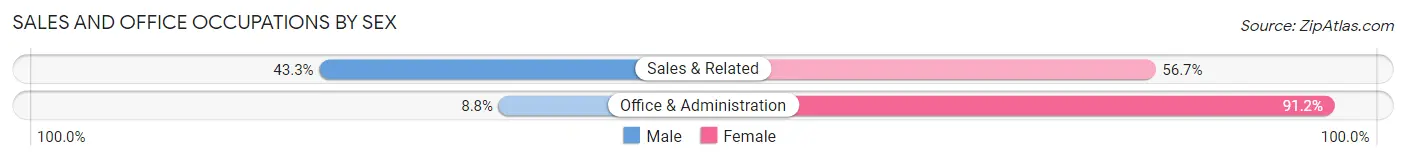
| Occupation | Male | Female |
| Sales & Related | 55 (43.3%) | 72 (56.7%) |
| Office & Administration | 8 (8.8%) | 83 (91.2%) |
| Total (Category) | 63 (28.9%) | 155 (71.1%) |
| Total (Overall) | 561 (52.0%) | 518 (48.0%) |
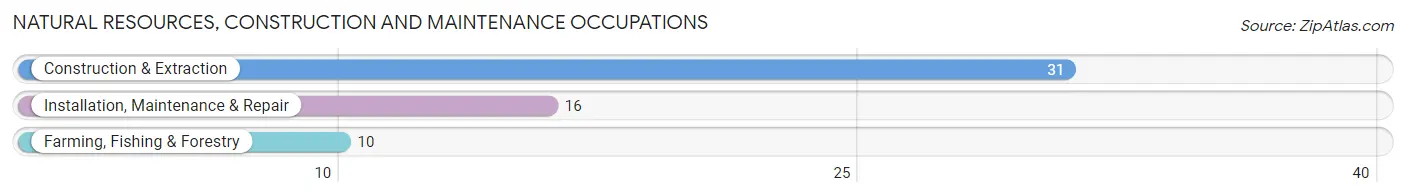
Natural Resources, Construction and Maintenance Occupations
The most common Natural Resources, Construction and Maintenance occupations in Sumrall are Construction & Extraction (31 | 2.9%), Installation, Maintenance & Repair (16 | 1.5%), and Farming, Fishing & Forestry (10 | 0.9%).
Natural Resources, Construction and Maintenance Occupations by Sex
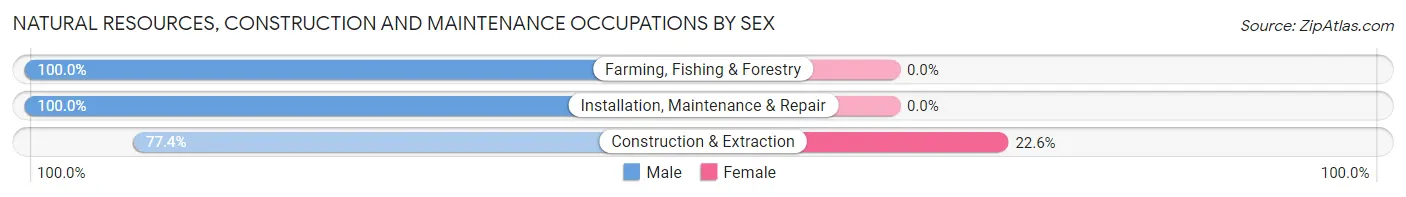
| Occupation | Male | Female |
| Farming, Fishing & Forestry | 10 (100.0%) | 0 (0.0%) |
| Construction & Extraction | 24 (77.4%) | 7 (22.6%) |
| Installation, Maintenance & Repair | 16 (100.0%) | 0 (0.0%) |
| Total (Category) | 50 (87.7%) | 7 (12.3%) |
| Total (Overall) | 561 (52.0%) | 518 (48.0%) |
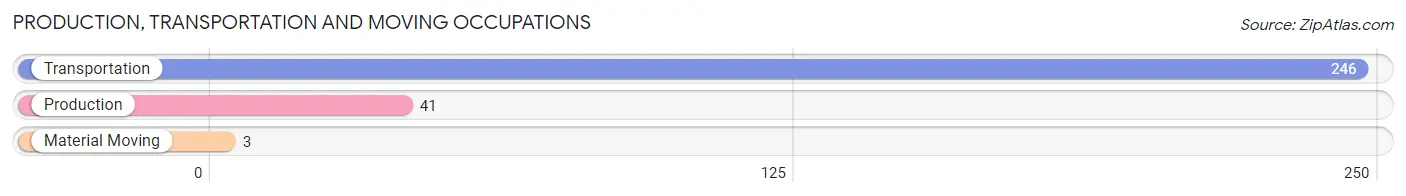
Production, Transportation and Moving Occupations
The most common Production, Transportation and Moving occupations in Sumrall are Transportation (246 | 22.8%), Production (41 | 3.8%), and Material Moving (3 | 0.3%).
Production, Transportation and Moving Occupations by Sex
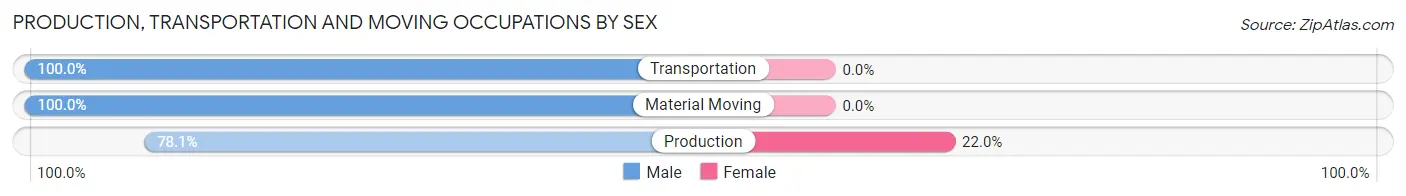
| Occupation | Male | Female |
| Production | 32 (78.0%) | 9 (22.0%) |
| Transportation | 246 (100.0%) | 0 (0.0%) |
| Material Moving | 3 (100.0%) | 0 (0.0%) |
| Total (Category) | 281 (96.9%) | 9 (3.1%) |
| Total (Overall) | 561 (52.0%) | 518 (48.0%) |
Employment Industries by Sex in Sumrall
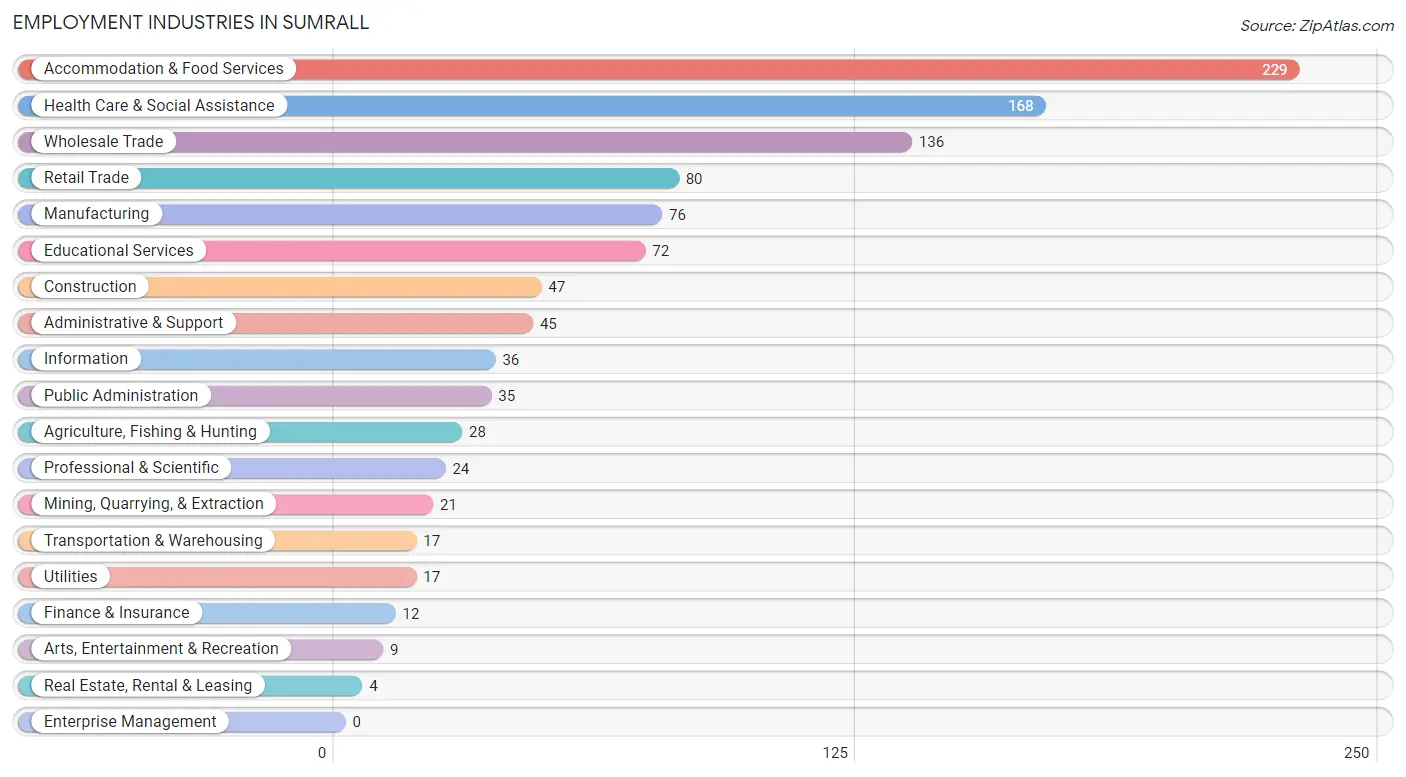
Employment Industries in Sumrall
The major employment industries in Sumrall include Accommodation & Food Services (229 | 21.2%), Health Care & Social Assistance (168 | 15.6%), Wholesale Trade (136 | 12.6%), Retail Trade (80 | 7.4%), and Manufacturing (76 | 7.0%).
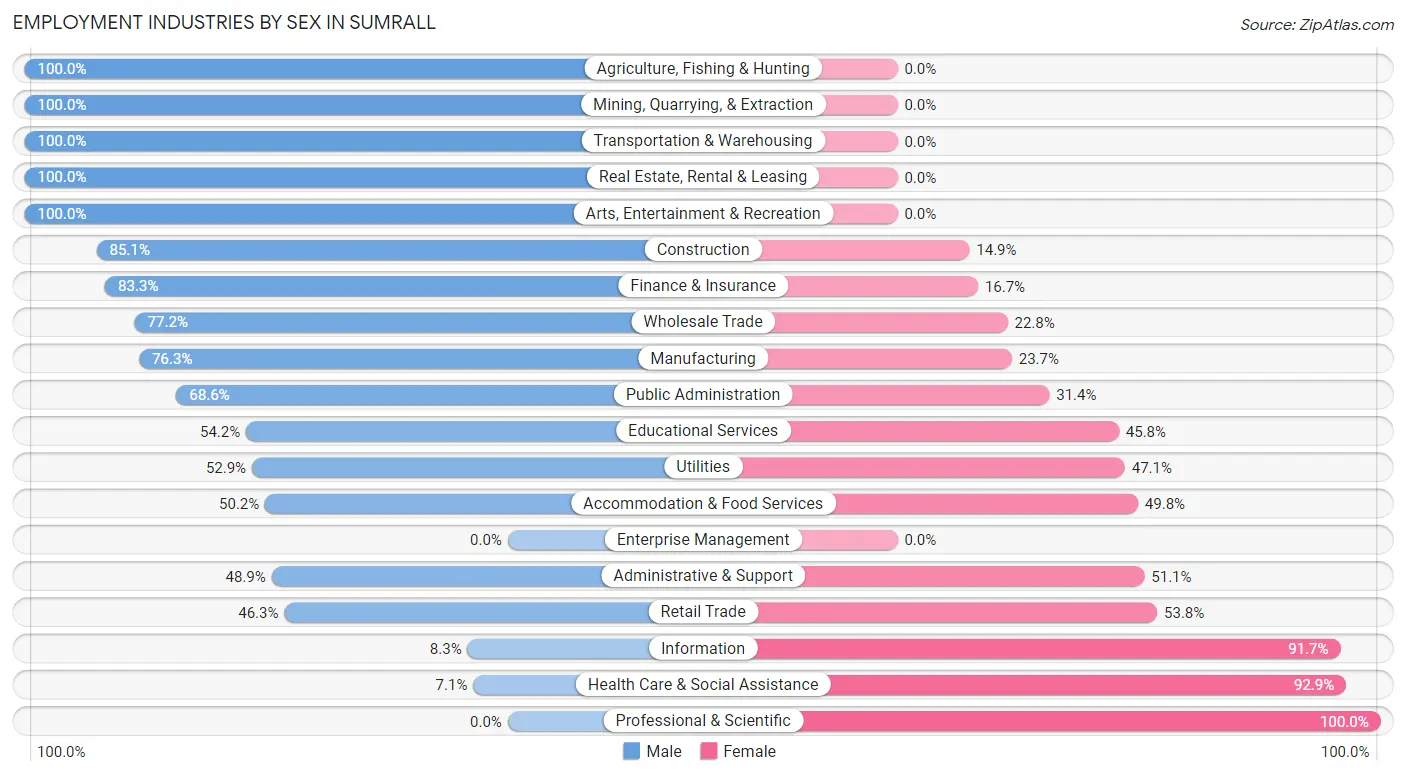
Employment Industries by Sex in Sumrall
The Sumrall industries that see more men than women are Agriculture, Fishing & Hunting (100.0%), Mining, Quarrying, & Extraction (100.0%), and Transportation & Warehousing (100.0%), whereas the industries that tend to have a higher number of women are Professional & Scientific (100.0%), Health Care & Social Assistance (92.9%), and Information (91.7%).
| Industry | Male | Female |
| Agriculture, Fishing & Hunting | 28 (100.0%) | 0 (0.0%) |
| Mining, Quarrying, & Extraction | 21 (100.0%) | 0 (0.0%) |
| Construction | 40 (85.1%) | 7 (14.9%) |
| Manufacturing | 58 (76.3%) | 18 (23.7%) |
| Wholesale Trade | 105 (77.2%) | 31 (22.8%) |
| Retail Trade | 37 (46.3%) | 43 (53.7%) |
| Transportation & Warehousing | 17 (100.0%) | 0 (0.0%) |
| Utilities | 9 (52.9%) | 8 (47.1%) |
| Information | 3 (8.3%) | 33 (91.7%) |
| Finance & Insurance | 10 (83.3%) | 2 (16.7%) |
| Real Estate, Rental & Leasing | 4 (100.0%) | 0 (0.0%) |
| Professional & Scientific | 0 (0.0%) | 24 (100.0%) |
| Enterprise Management | 0 (0.0%) | 0 (0.0%) |
| Administrative & Support | 22 (48.9%) | 23 (51.1%) |
| Educational Services | 39 (54.2%) | 33 (45.8%) |
| Health Care & Social Assistance | 12 (7.1%) | 156 (92.9%) |
| Arts, Entertainment & Recreation | 9 (100.0%) | 0 (0.0%) |
| Accommodation & Food Services | 115 (50.2%) | 114 (49.8%) |
| Public Administration | 24 (68.6%) | 11 (31.4%) |
| Total | 561 (52.0%) | 518 (48.0%) |
Education in Sumrall
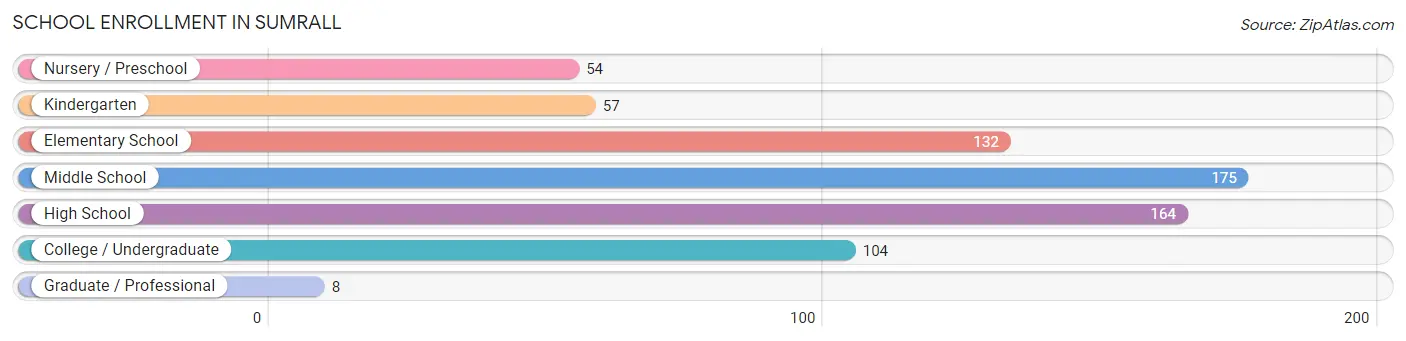
School Enrollment in Sumrall
The most common levels of schooling among the 694 students in Sumrall are middle school (175 | 25.2%), high school (164 | 23.6%), and elementary school (132 | 19.0%).
| School Level | # Students | % Students |
| Nursery / Preschool | 54 | 7.8% |
| Kindergarten | 57 | 8.2% |
| Elementary School | 132 | 19.0% |
| Middle School | 175 | 25.2% |
| High School | 164 | 23.6% |
| College / Undergraduate | 104 | 15.0% |
| Graduate / Professional | 8 | 1.1% |
| Total | 694 | 100.0% |
School Enrollment by Age by Funding Source in Sumrall
Out of a total of 694 students who are enrolled in schools in Sumrall, 32 (4.6%) attend a private institution, while the remaining 662 (95.4%) are enrolled in public schools. The age group of 3 to 4 year olds has the highest likelihood of being enrolled in private schools, with 10 (23.8% in the age bracket) enrolled. Conversely, the age group of 5 to 9 year old has the lowest likelihood of being enrolled in a private school, with 190 (100.0% in the age bracket) attending a public institution.
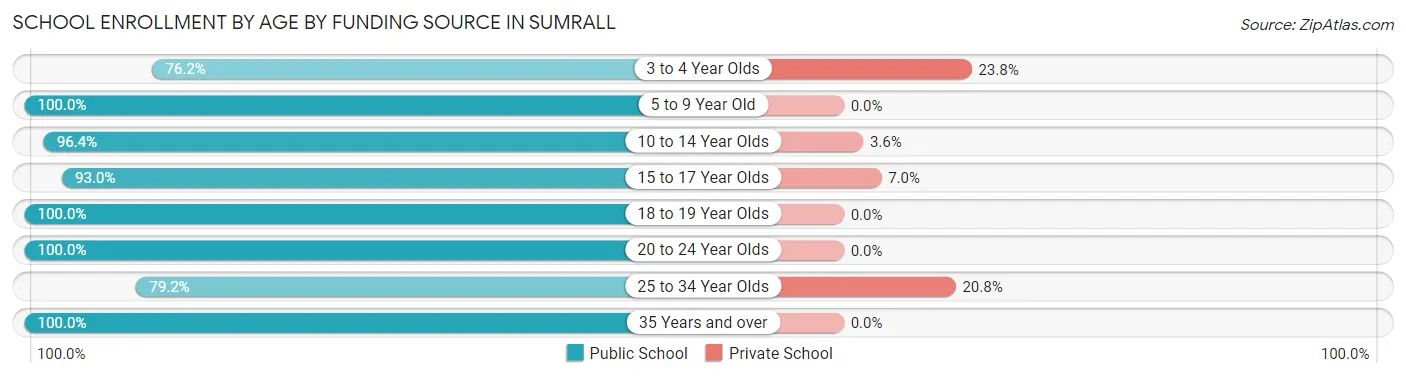
| Age Bracket | Public School | Private School |
| 3 to 4 Year Olds | 32 (76.2%) | 10 (23.8%) |
| 5 to 9 Year Old | 190 (100.0%) | 0 (0.0%) |
| 10 to 14 Year Olds | 188 (96.4%) | 7 (3.6%) |
| 15 to 17 Year Olds | 133 (93.0%) | 10 (7.0%) |
| 18 to 19 Year Olds | 75 (100.0%) | 0 (0.0%) |
| 20 to 24 Year Olds | 14 (100.0%) | 0 (0.0%) |
| 25 to 34 Year Olds | 19 (79.2%) | 5 (20.8%) |
| 35 Years and over | 11 (100.0%) | 0 (0.0%) |
| Total | 662 (95.4%) | 32 (4.6%) |
Educational Attainment by Field of Study in Sumrall
Business (130 | 34.9%), education (93 | 25.0%), arts & humanities (36 | 9.7%), science & technology (24 | 6.5%), and communications (17 | 4.6%) are the most common fields of study among 372 individuals in Sumrall who have obtained a bachelor's degree or higher.
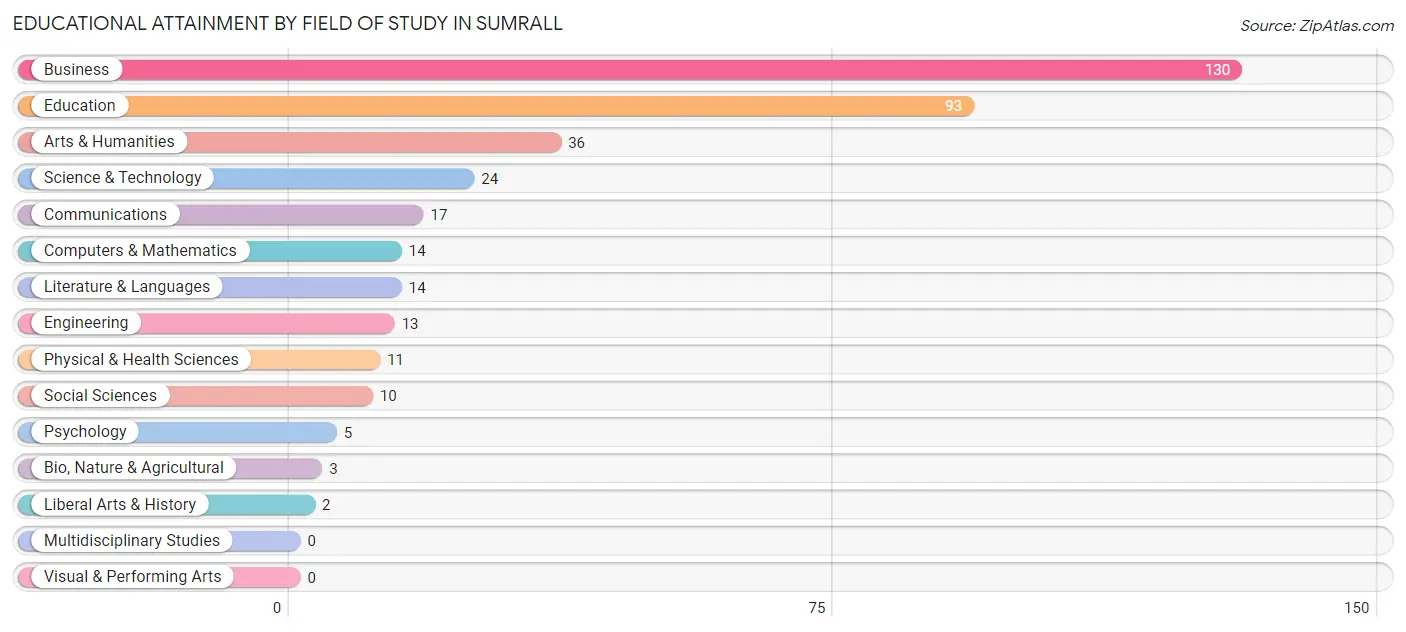
| Field of Study | # Graduates | % Graduates |
| Computers & Mathematics | 14 | 3.8% |
| Bio, Nature & Agricultural | 3 | 0.8% |
| Physical & Health Sciences | 11 | 3.0% |
| Psychology | 5 | 1.3% |
| Social Sciences | 10 | 2.7% |
| Engineering | 13 | 3.5% |
| Multidisciplinary Studies | 0 | 0.0% |
| Science & Technology | 24 | 6.5% |
| Business | 130 | 34.9% |
| Education | 93 | 25.0% |
| Literature & Languages | 14 | 3.8% |
| Liberal Arts & History | 2 | 0.5% |
| Visual & Performing Arts | 0 | 0.0% |
| Communications | 17 | 4.6% |
| Arts & Humanities | 36 | 9.7% |
| Total | 372 | 100.0% |
Transportation & Commute in Sumrall
Vehicle Availability by Sex in Sumrall
The most prevalent vehicle ownership categories in Sumrall are males with 2 vehicles (329, accounting for 58.8%) and females with 2 vehicles (269, making up 64.1%).
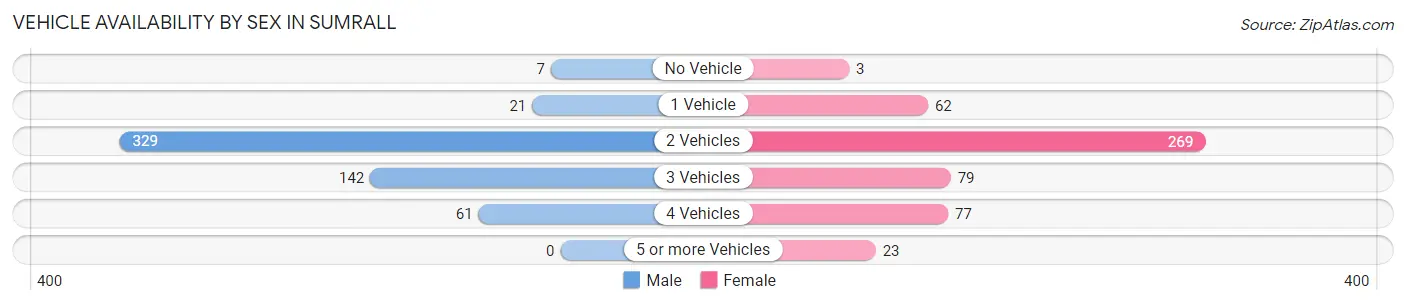
| Vehicles Available | Male | Female |
| No Vehicle | 7 (1.3%) | 3 (0.6%) |
| 1 Vehicle | 21 (3.7%) | 62 (12.1%) |
| 2 Vehicles | 329 (58.8%) | 269 (52.4%) |
| 3 Vehicles | 142 (25.4%) | 79 (15.4%) |
| 4 Vehicles | 61 (10.9%) | 77 (15.0%) |
| 5 or more Vehicles | 0 (0.0%) | 23 (4.5%) |
| Total | 560 (100.0%) | 513 (100.0%) |
Commute Time in Sumrall
The most frequently occuring commute durations in Sumrall are 5 to 9 minutes (282 commuters, 27.0%), 20 to 24 minutes (239 commuters, 22.9%), and 30 to 34 minutes (147 commuters, 14.1%).
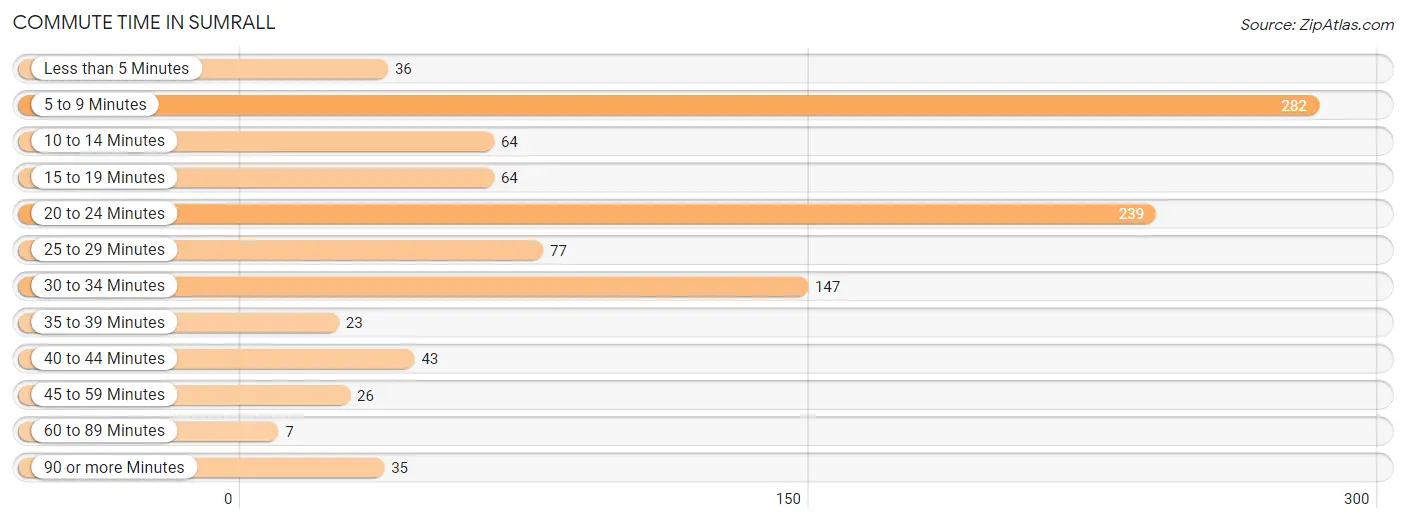
| Commute Time | # Commuters | % Commuters |
| Less than 5 Minutes | 36 | 3.5% |
| 5 to 9 Minutes | 282 | 27.0% |
| 10 to 14 Minutes | 64 | 6.1% |
| 15 to 19 Minutes | 64 | 6.1% |
| 20 to 24 Minutes | 239 | 22.9% |
| 25 to 29 Minutes | 77 | 7.4% |
| 30 to 34 Minutes | 147 | 14.1% |
| 35 to 39 Minutes | 23 | 2.2% |
| 40 to 44 Minutes | 43 | 4.1% |
| 45 to 59 Minutes | 26 | 2.5% |
| 60 to 89 Minutes | 7 | 0.7% |
| 90 or more Minutes | 35 | 3.4% |
Commute Time by Sex in Sumrall
The most common commute times in Sumrall are 20 to 24 minutes (179 commuters, 32.2%) for males and 5 to 9 minutes (146 commuters, 30.0%) for females.
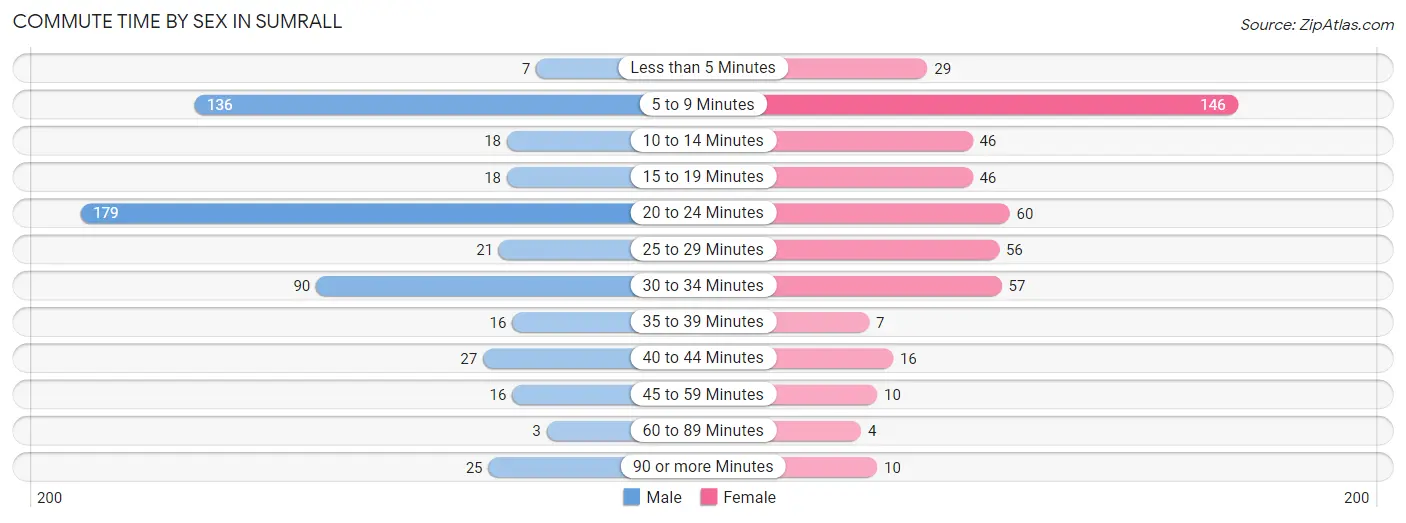
| Commute Time | Male | Female |
| Less than 5 Minutes | 7 (1.3%) | 29 (5.9%) |
| 5 to 9 Minutes | 136 (24.5%) | 146 (30.0%) |
| 10 to 14 Minutes | 18 (3.2%) | 46 (9.5%) |
| 15 to 19 Minutes | 18 (3.2%) | 46 (9.5%) |
| 20 to 24 Minutes | 179 (32.2%) | 60 (12.3%) |
| 25 to 29 Minutes | 21 (3.8%) | 56 (11.5%) |
| 30 to 34 Minutes | 90 (16.2%) | 57 (11.7%) |
| 35 to 39 Minutes | 16 (2.9%) | 7 (1.4%) |
| 40 to 44 Minutes | 27 (4.9%) | 16 (3.3%) |
| 45 to 59 Minutes | 16 (2.9%) | 10 (2.1%) |
| 60 to 89 Minutes | 3 (0.5%) | 4 (0.8%) |
| 90 or more Minutes | 25 (4.5%) | 10 (2.1%) |
Time of Departure to Work by Sex in Sumrall
The most frequent times of departure to work in Sumrall are 8:00 AM to 8:29 AM (153, 27.5%) for males and 9:00 AM to 9:59 AM (129, 26.5%) for females.
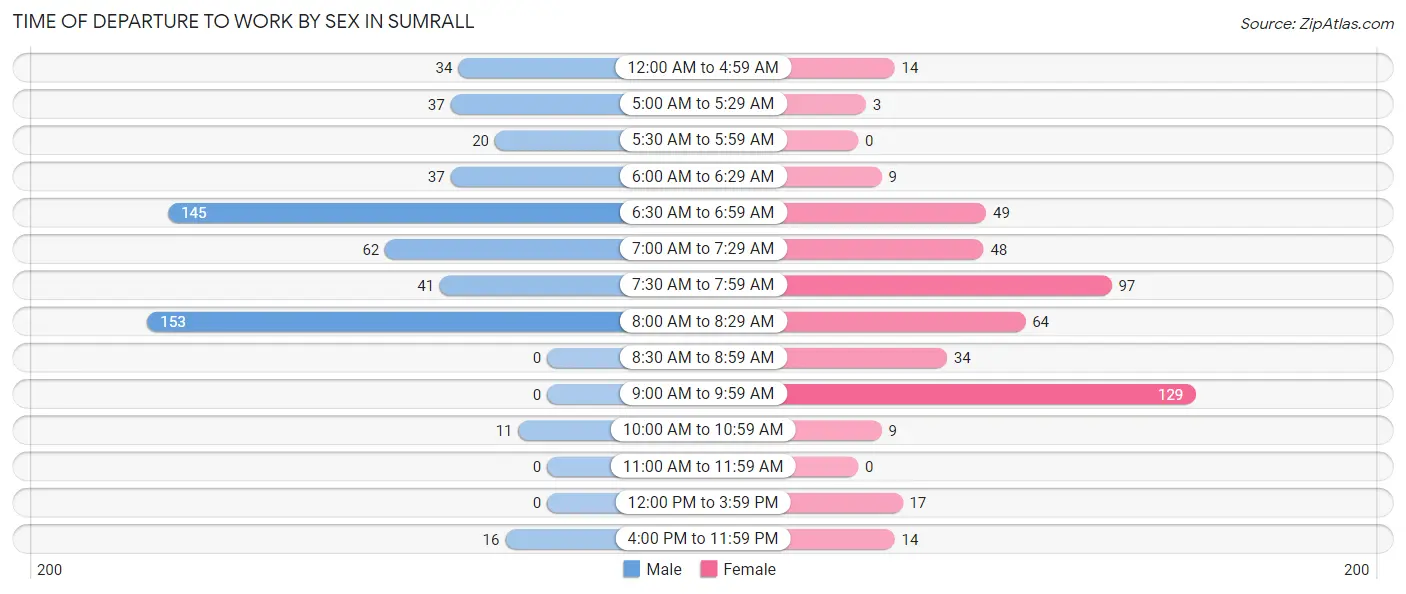
| Time of Departure | Male | Female |
| 12:00 AM to 4:59 AM | 34 (6.1%) | 14 (2.9%) |
| 5:00 AM to 5:29 AM | 37 (6.7%) | 3 (0.6%) |
| 5:30 AM to 5:59 AM | 20 (3.6%) | 0 (0.0%) |
| 6:00 AM to 6:29 AM | 37 (6.7%) | 9 (1.8%) |
| 6:30 AM to 6:59 AM | 145 (26.1%) | 49 (10.1%) |
| 7:00 AM to 7:29 AM | 62 (11.2%) | 48 (9.9%) |
| 7:30 AM to 7:59 AM | 41 (7.4%) | 97 (19.9%) |
| 8:00 AM to 8:29 AM | 153 (27.5%) | 64 (13.1%) |
| 8:30 AM to 8:59 AM | 0 (0.0%) | 34 (7.0%) |
| 9:00 AM to 9:59 AM | 0 (0.0%) | 129 (26.5%) |
| 10:00 AM to 10:59 AM | 11 (2.0%) | 9 (1.8%) |
| 11:00 AM to 11:59 AM | 0 (0.0%) | 0 (0.0%) |
| 12:00 PM to 3:59 PM | 0 (0.0%) | 17 (3.5%) |
| 4:00 PM to 11:59 PM | 16 (2.9%) | 14 (2.9%) |
| Total | 556 (100.0%) | 487 (100.0%) |
Housing Occupancy in Sumrall
Occupancy by Ownership in Sumrall
Of the total 735 dwellings in Sumrall, owner-occupied units account for 628 (85.4%), while renter-occupied units make up 107 (14.6%).
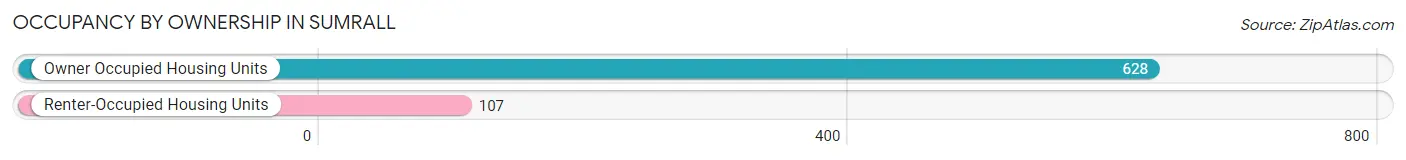
| Occupancy | # Housing Units | % Housing Units |
| Owner Occupied Housing Units | 628 | 85.4% |
| Renter-Occupied Housing Units | 107 | 14.6% |
| Total Occupied Housing Units | 735 | 100.0% |
Occupancy by Household Size in Sumrall
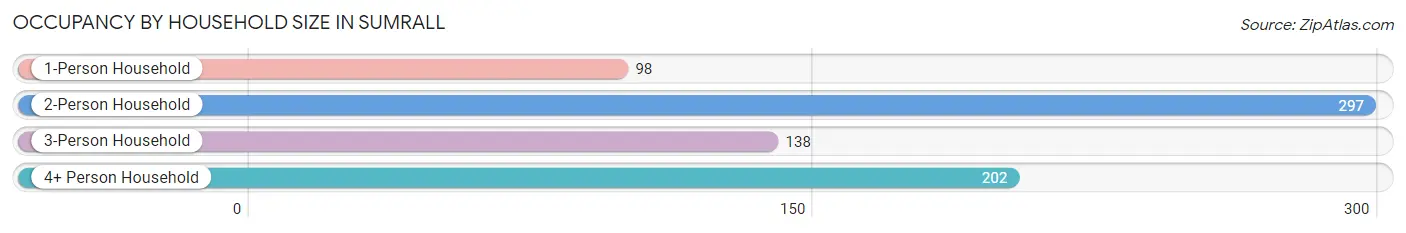
| Household Size | # Housing Units | % Housing Units |
| 1-Person Household | 98 | 13.3% |
| 2-Person Household | 297 | 40.4% |
| 3-Person Household | 138 | 18.8% |
| 4+ Person Household | 202 | 27.5% |
| Total Housing Units | 735 | 100.0% |
Occupancy by Ownership by Household Size in Sumrall
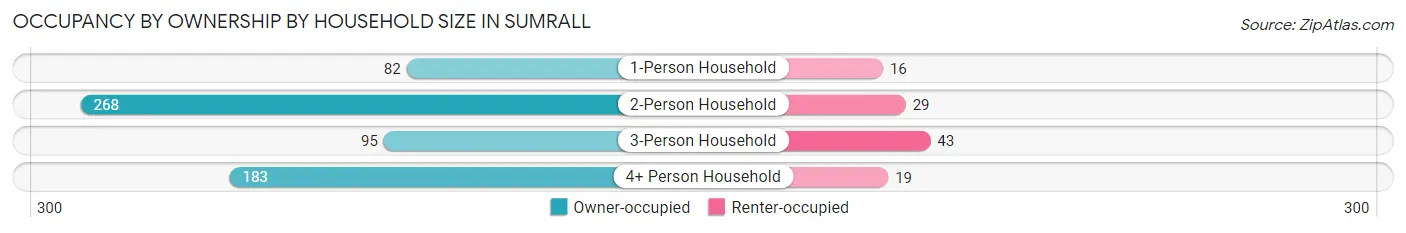
| Household Size | Owner-occupied | Renter-occupied |
| 1-Person Household | 82 (83.7%) | 16 (16.3%) |
| 2-Person Household | 268 (90.2%) | 29 (9.8%) |
| 3-Person Household | 95 (68.8%) | 43 (31.2%) |
| 4+ Person Household | 183 (90.6%) | 19 (9.4%) |
| Total Housing Units | 628 (85.4%) | 107 (14.6%) |
Occupancy by Educational Attainment in Sumrall
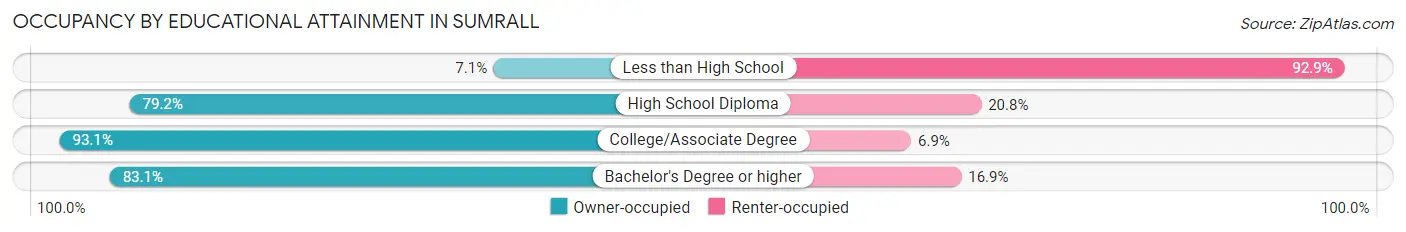
| Household Size | Owner-occupied | Renter-occupied |
| Less than High School | 2 (7.1%) | 26 (92.9%) |
| High School Diploma | 95 (79.2%) | 25 (20.8%) |
| College/Associate Degree | 403 (93.1%) | 30 (6.9%) |
| Bachelor's Degree or higher | 128 (83.1%) | 26 (16.9%) |
Occupancy by Age of Householder in Sumrall
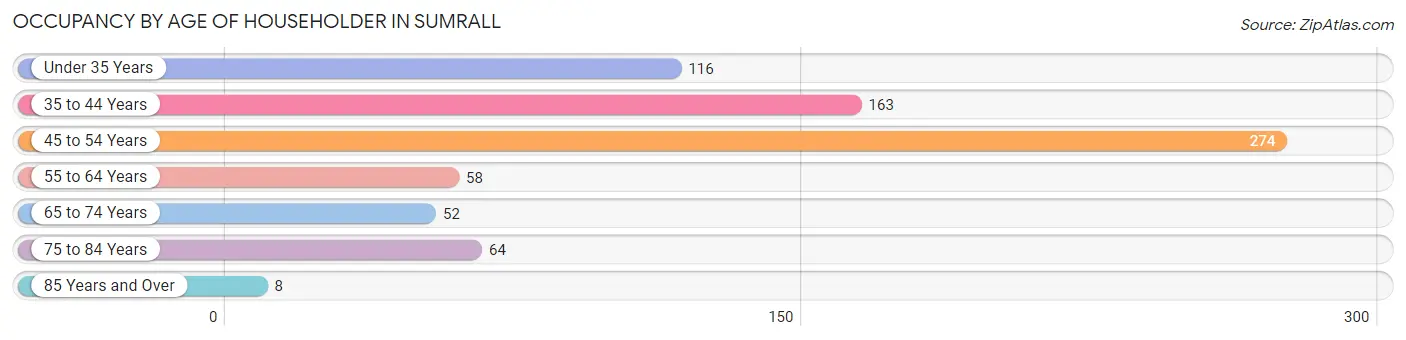
| Age Bracket | # Households | % Households |
| Under 35 Years | 116 | 15.8% |
| 35 to 44 Years | 163 | 22.2% |
| 45 to 54 Years | 274 | 37.3% |
| 55 to 64 Years | 58 | 7.9% |
| 65 to 74 Years | 52 | 7.1% |
| 75 to 84 Years | 64 | 8.7% |
| 85 Years and Over | 8 | 1.1% |
| Total | 735 | 100.0% |
Housing Finances in Sumrall
Median Income by Occupancy in Sumrall
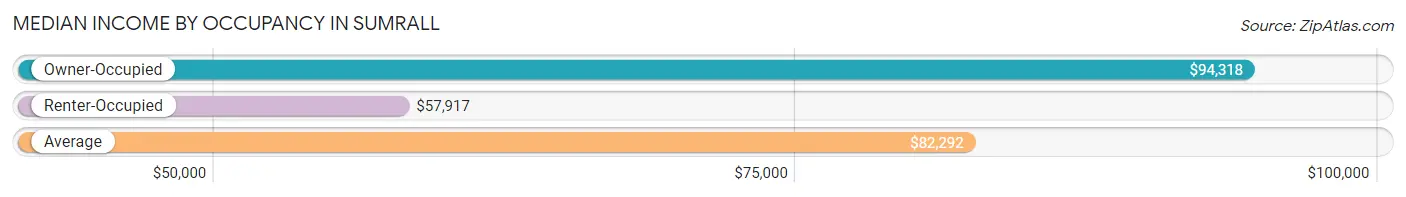
| Occupancy Type | # Households | Median Income |
| Owner-Occupied | 628 (85.4%) | $94,318 |
| Renter-Occupied | 107 (14.6%) | $57,917 |
| Average | 735 (100.0%) | $82,292 |
Occupancy by Householder Income Bracket in Sumrall
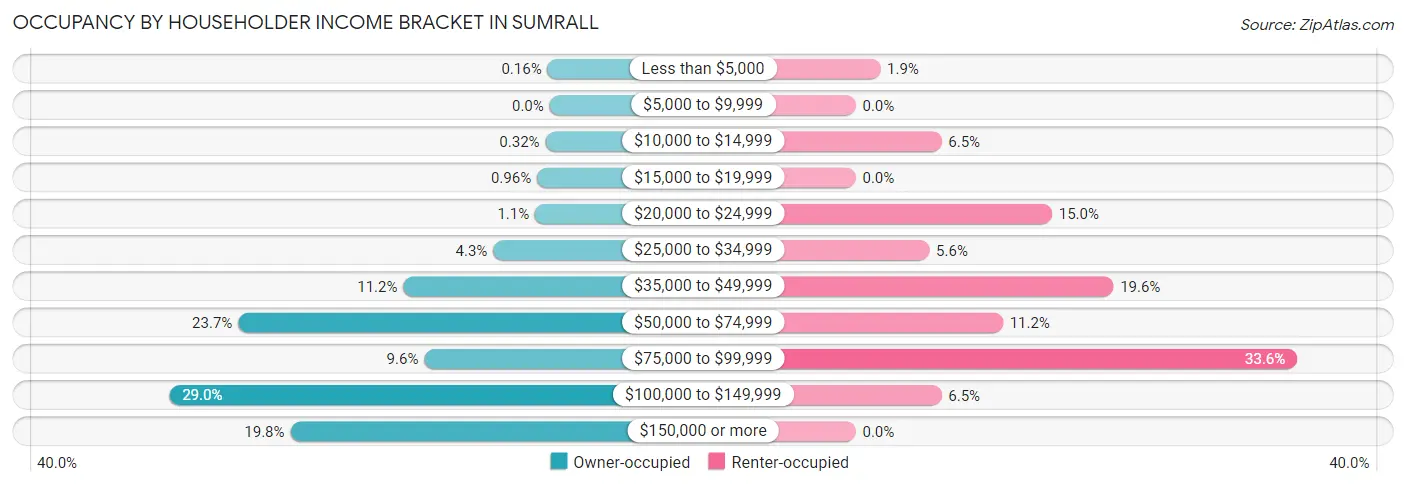
| Income Bracket | Owner-occupied | Renter-occupied |
| Less than $5,000 | 1 (0.2%) | 2 (1.9%) |
| $5,000 to $9,999 | 0 (0.0%) | 0 (0.0%) |
| $10,000 to $14,999 | 2 (0.3%) | 7 (6.5%) |
| $15,000 to $19,999 | 6 (1.0%) | 0 (0.0%) |
| $20,000 to $24,999 | 7 (1.1%) | 16 (14.9%) |
| $25,000 to $34,999 | 27 (4.3%) | 6 (5.6%) |
| $35,000 to $49,999 | 70 (11.2%) | 21 (19.6%) |
| $50,000 to $74,999 | 149 (23.7%) | 12 (11.2%) |
| $75,000 to $99,999 | 60 (9.6%) | 36 (33.6%) |
| $100,000 to $149,999 | 182 (29.0%) | 7 (6.5%) |
| $150,000 or more | 124 (19.8%) | 0 (0.0%) |
| Total | 628 (100.0%) | 107 (100.0%) |
Monthly Housing Cost Tiers in Sumrall
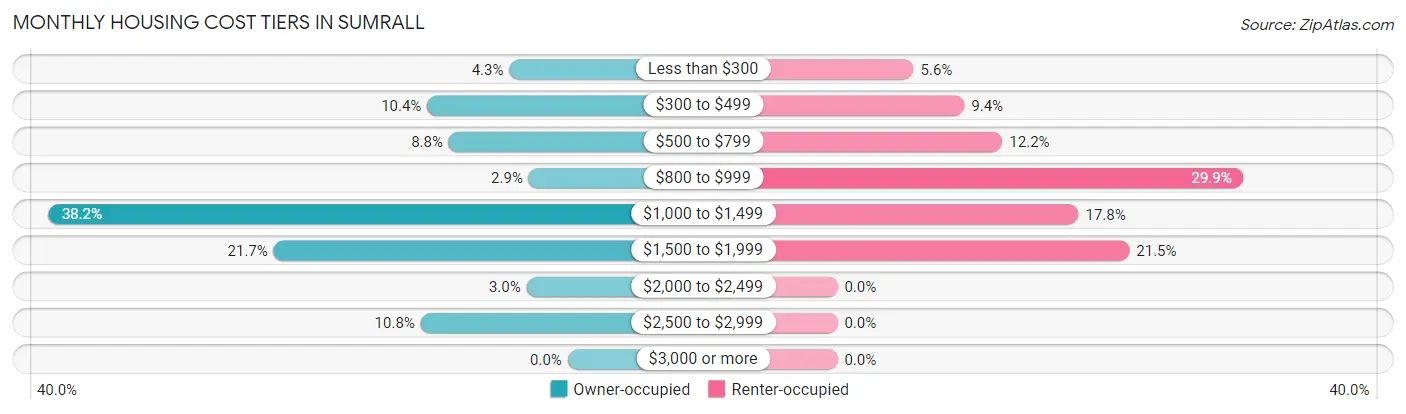
| Monthly Cost | Owner-occupied | Renter-occupied |
| Less than $300 | 27 (4.3%) | 6 (5.6%) |
| $300 to $499 | 65 (10.3%) | 10 (9.3%) |
| $500 to $799 | 55 (8.8%) | 13 (12.1%) |
| $800 to $999 | 18 (2.9%) | 32 (29.9%) |
| $1,000 to $1,499 | 240 (38.2%) | 19 (17.8%) |
| $1,500 to $1,999 | 136 (21.7%) | 23 (21.5%) |
| $2,000 to $2,499 | 19 (3.0%) | 0 (0.0%) |
| $2,500 to $2,999 | 68 (10.8%) | 0 (0.0%) |
| $3,000 or more | 0 (0.0%) | 0 (0.0%) |
| Total | 628 (100.0%) | 107 (100.0%) |
Physical Housing Characteristics in Sumrall
Housing Structures in Sumrall
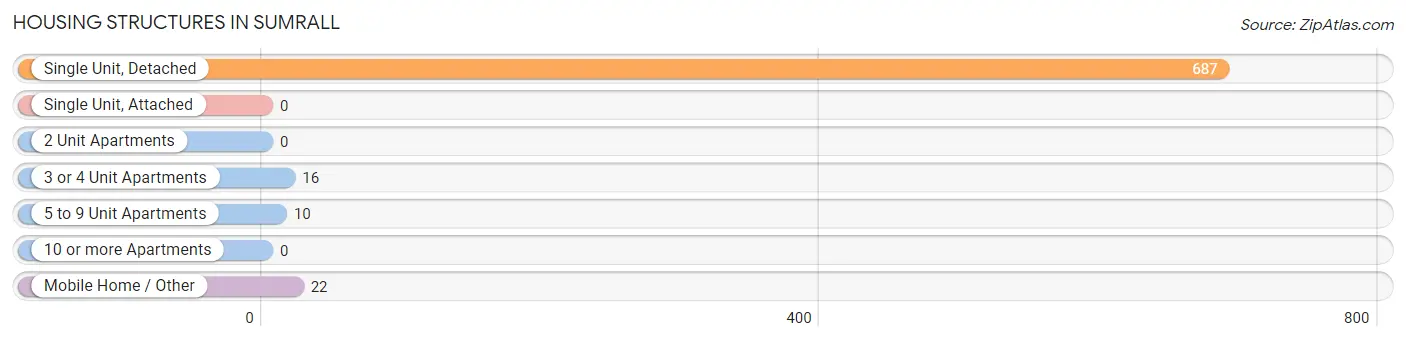
| Structure Type | # Housing Units | % Housing Units |
| Single Unit, Detached | 687 | 93.5% |
| Single Unit, Attached | 0 | 0.0% |
| 2 Unit Apartments | 0 | 0.0% |
| 3 or 4 Unit Apartments | 16 | 2.2% |
| 5 to 9 Unit Apartments | 10 | 1.4% |
| 10 or more Apartments | 0 | 0.0% |
| Mobile Home / Other | 22 | 3.0% |
| Total | 735 | 100.0% |
Housing Structures by Occupancy in Sumrall
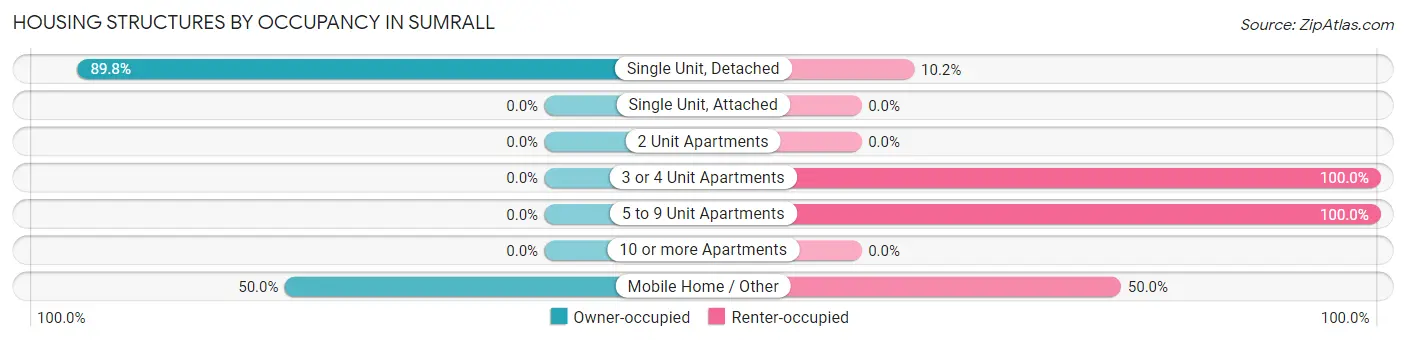
| Structure Type | Owner-occupied | Renter-occupied |
| Single Unit, Detached | 617 (89.8%) | 70 (10.2%) |
| Single Unit, Attached | 0 (0.0%) | 0 (0.0%) |
| 2 Unit Apartments | 0 (0.0%) | 0 (0.0%) |
| 3 or 4 Unit Apartments | 0 (0.0%) | 16 (100.0%) |
| 5 to 9 Unit Apartments | 0 (0.0%) | 10 (100.0%) |
| 10 or more Apartments | 0 (0.0%) | 0 (0.0%) |
| Mobile Home / Other | 11 (50.0%) | 11 (50.0%) |
| Total | 628 (85.4%) | 107 (14.6%) |
Housing Structures by Number of Rooms in Sumrall
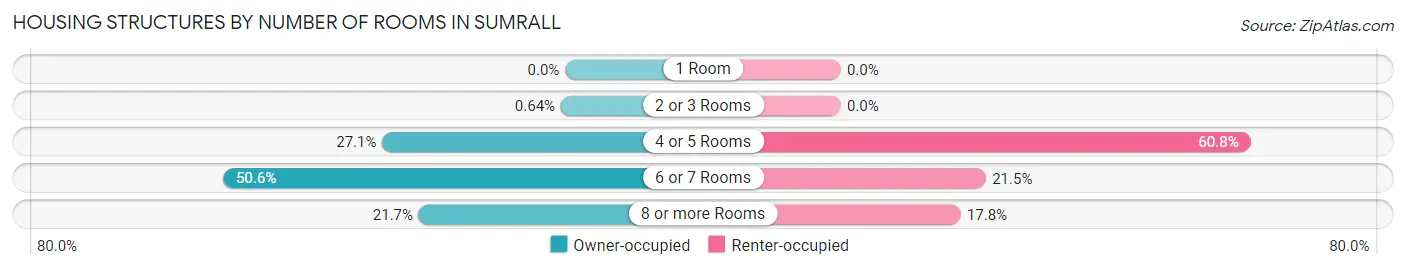
| Number of Rooms | Owner-occupied | Renter-occupied |
| 1 Room | 0 (0.0%) | 0 (0.0%) |
| 2 or 3 Rooms | 4 (0.6%) | 0 (0.0%) |
| 4 or 5 Rooms | 170 (27.1%) | 65 (60.8%) |
| 6 or 7 Rooms | 318 (50.6%) | 23 (21.5%) |
| 8 or more Rooms | 136 (21.7%) | 19 (17.8%) |
| Total | 628 (100.0%) | 107 (100.0%) |
Housing Structure by Heating Type in Sumrall
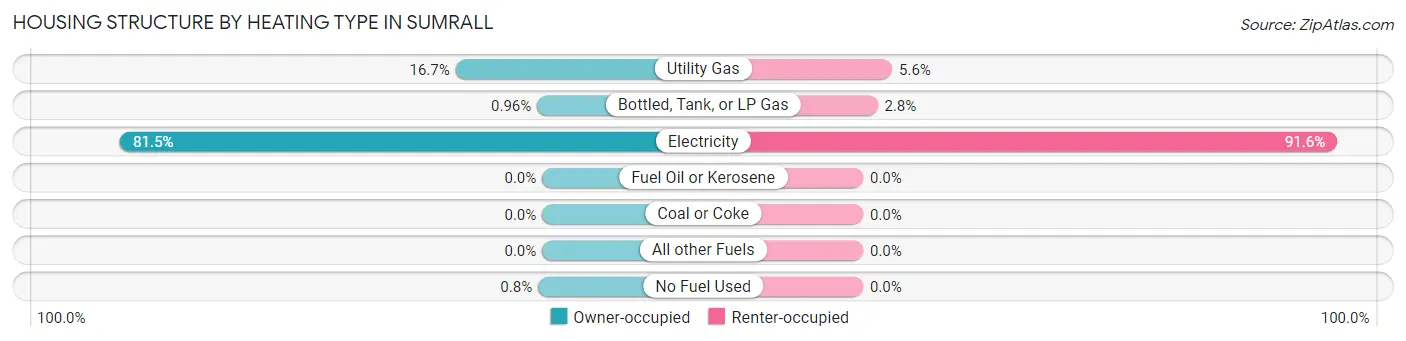
| Heating Type | Owner-occupied | Renter-occupied |
| Utility Gas | 105 (16.7%) | 6 (5.6%) |
| Bottled, Tank, or LP Gas | 6 (1.0%) | 3 (2.8%) |
| Electricity | 512 (81.5%) | 98 (91.6%) |
| Fuel Oil or Kerosene | 0 (0.0%) | 0 (0.0%) |
| Coal or Coke | 0 (0.0%) | 0 (0.0%) |
| All other Fuels | 0 (0.0%) | 0 (0.0%) |
| No Fuel Used | 5 (0.8%) | 0 (0.0%) |
| Total | 628 (100.0%) | 107 (100.0%) |
Household Vehicle Usage in Sumrall
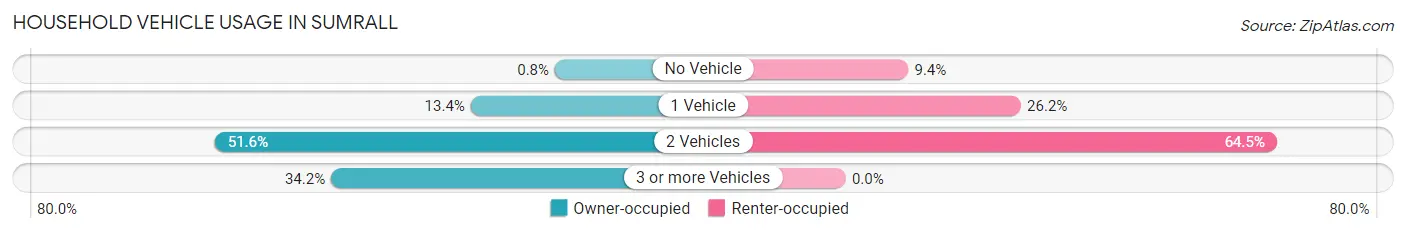
| Vehicles per Household | Owner-occupied | Renter-occupied |
| No Vehicle | 5 (0.8%) | 10 (9.3%) |
| 1 Vehicle | 84 (13.4%) | 28 (26.2%) |
| 2 Vehicles | 324 (51.6%) | 69 (64.5%) |
| 3 or more Vehicles | 215 (34.2%) | 0 (0.0%) |
| Total | 628 (100.0%) | 107 (100.0%) |
Real Estate & Mortgages in Sumrall
Real Estate and Mortgage Overview in Sumrall
| Characteristic | Without Mortgage | With Mortgage |
| Housing Units | 128 | 500 |
| Median Property Value | $125,000 | $219,100 |
| Median Household Income | $61,250 | $122 |
| Monthly Housing Costs | $418 | $0 |
| Real Estate Taxes | $943 | $89 |
Property Value by Mortgage Status in Sumrall
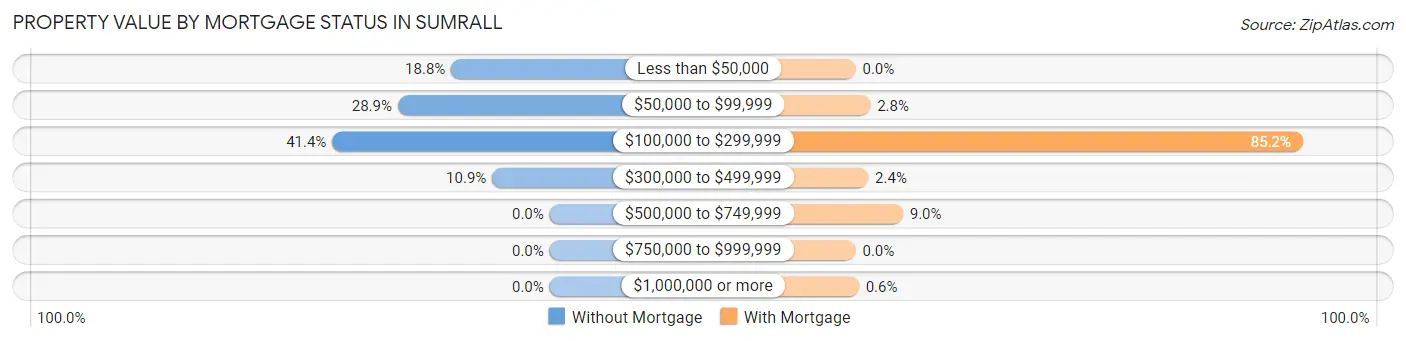
| Property Value | Without Mortgage | With Mortgage |
| Less than $50,000 | 24 (18.8%) | 0 (0.0%) |
| $50,000 to $99,999 | 37 (28.9%) | 14 (2.8%) |
| $100,000 to $299,999 | 53 (41.4%) | 426 (85.2%) |
| $300,000 to $499,999 | 14 (10.9%) | 12 (2.4%) |
| $500,000 to $749,999 | 0 (0.0%) | 45 (9.0%) |
| $750,000 to $999,999 | 0 (0.0%) | 0 (0.0%) |
| $1,000,000 or more | 0 (0.0%) | 3 (0.6%) |
| Total | 128 (100.0%) | 500 (100.0%) |
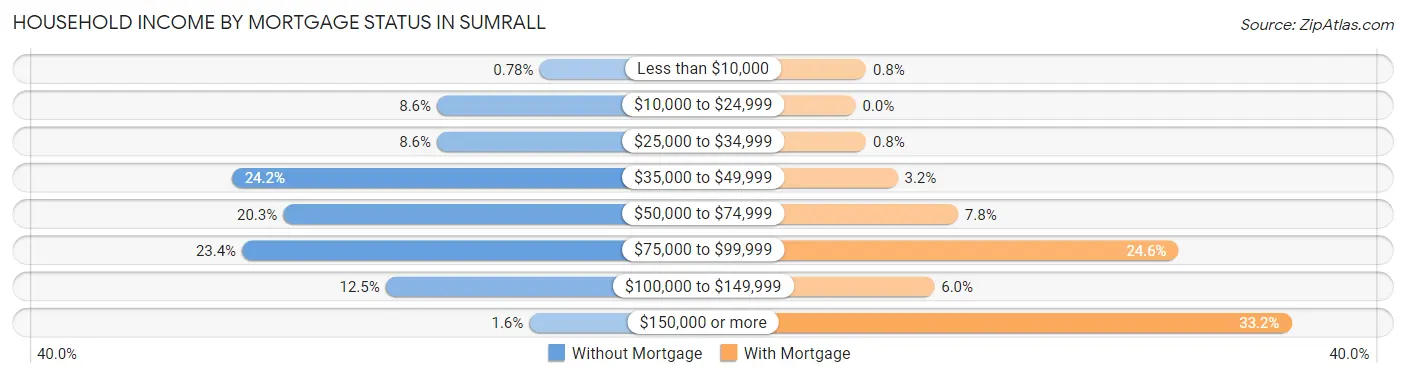
Household Income by Mortgage Status in Sumrall
| Household Income | Without Mortgage | With Mortgage |
| Less than $10,000 | 1 (0.8%) | 4 (0.8%) |
| $10,000 to $24,999 | 11 (8.6%) | 0 (0.0%) |
| $25,000 to $34,999 | 11 (8.6%) | 4 (0.8%) |
| $35,000 to $49,999 | 31 (24.2%) | 16 (3.2%) |
| $50,000 to $74,999 | 26 (20.3%) | 39 (7.8%) |
| $75,000 to $99,999 | 30 (23.4%) | 123 (24.6%) |
| $100,000 to $149,999 | 16 (12.5%) | 30 (6.0%) |
| $150,000 or more | 2 (1.6%) | 166 (33.2%) |
| Total | 128 (100.0%) | 500 (100.0%) |
Property Value to Household Income Ratio in Sumrall
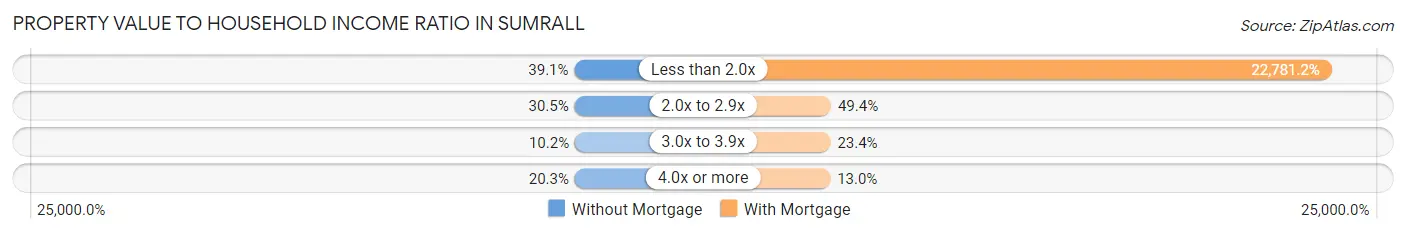
| Value-to-Income Ratio | Without Mortgage | With Mortgage |
| Less than 2.0x | 50 (39.1%) | 113,906 (22,781.2%) |
| 2.0x to 2.9x | 39 (30.5%) | 247 (49.4%) |
| 3.0x to 3.9x | 13 (10.2%) | 117 (23.4%) |
| 4.0x or more | 26 (20.3%) | 65 (13.0%) |
| Total | 128 (100.0%) | 500 (100.0%) |
Real Estate Taxes by Mortgage Status in Sumrall
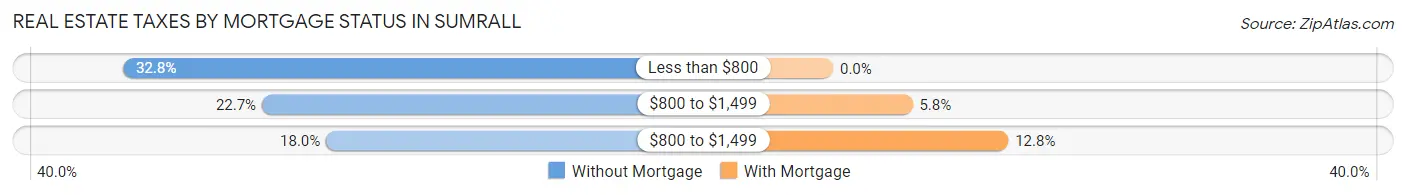
| Property Taxes | Without Mortgage | With Mortgage |
| Less than $800 | 42 (32.8%) | 0 (0.0%) |
| $800 to $1,499 | 29 (22.7%) | 29 (5.8%) |
| $800 to $1,499 | 23 (18.0%) | 64 (12.8%) |
| Total | 128 (100.0%) | 500 (100.0%) |
Health & Disability in Sumrall
Health Insurance Coverage by Age in Sumrall
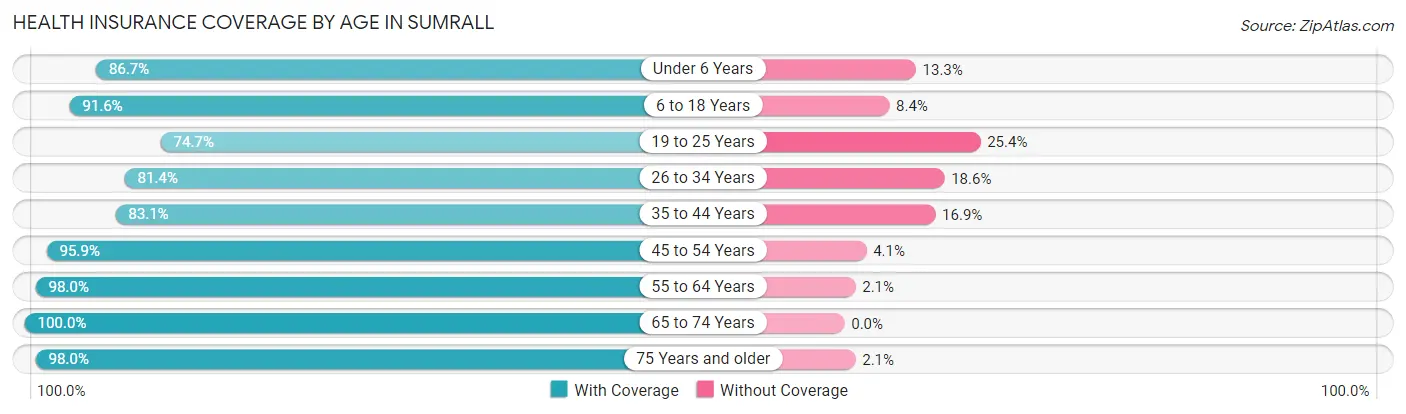
| Age Bracket | With Coverage | Without Coverage |
| Under 6 Years | 163 (86.7%) | 25 (13.3%) |
| 6 to 18 Years | 504 (91.6%) | 46 (8.4%) |
| 19 to 25 Years | 53 (74.7%) | 18 (25.4%) |
| 26 to 34 Years | 144 (81.4%) | 33 (18.6%) |
| 35 to 44 Years | 255 (83.1%) | 52 (16.9%) |
| 45 to 54 Years | 446 (95.9%) | 19 (4.1%) |
| 55 to 64 Years | 191 (98.0%) | 4 (2.1%) |
| 65 to 74 Years | 92 (100.0%) | 0 (0.0%) |
| 75 Years and older | 143 (98.0%) | 3 (2.1%) |
| Total | 1,991 (90.9%) | 200 (9.1%) |
Health Insurance Coverage by Citizenship Status in Sumrall
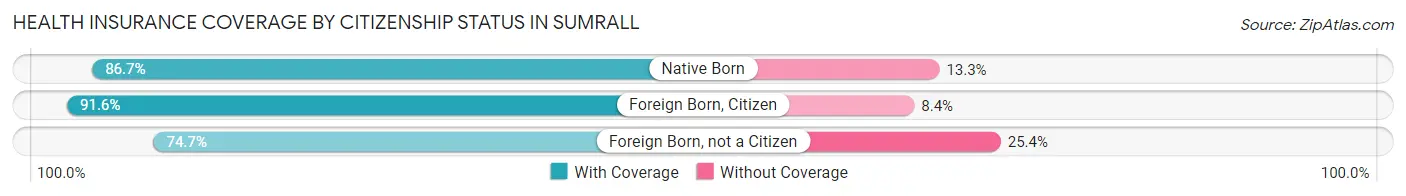
| Citizenship Status | With Coverage | Without Coverage |
| Native Born | 163 (86.7%) | 25 (13.3%) |
| Foreign Born, Citizen | 504 (91.6%) | 46 (8.4%) |
| Foreign Born, not a Citizen | 53 (74.7%) | 18 (25.4%) |
Health Insurance Coverage by Household Income in Sumrall
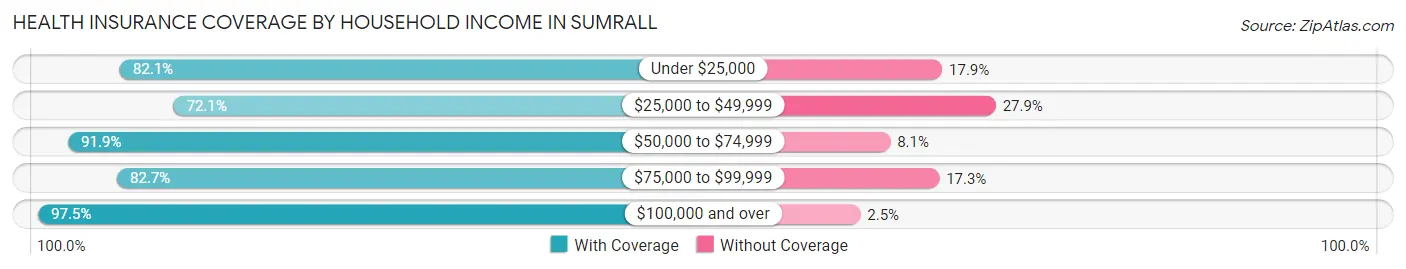
| Household Income | With Coverage | Without Coverage |
| Under $25,000 | 92 (82.1%) | 20 (17.9%) |
| $25,000 to $49,999 | 168 (72.1%) | 65 (27.9%) |
| $50,000 to $74,999 | 440 (91.9%) | 39 (8.1%) |
| $75,000 to $99,999 | 234 (82.7%) | 49 (17.3%) |
| $100,000 and over | 1,034 (97.5%) | 27 (2.5%) |
Public vs Private Health Insurance Coverage by Age in Sumrall
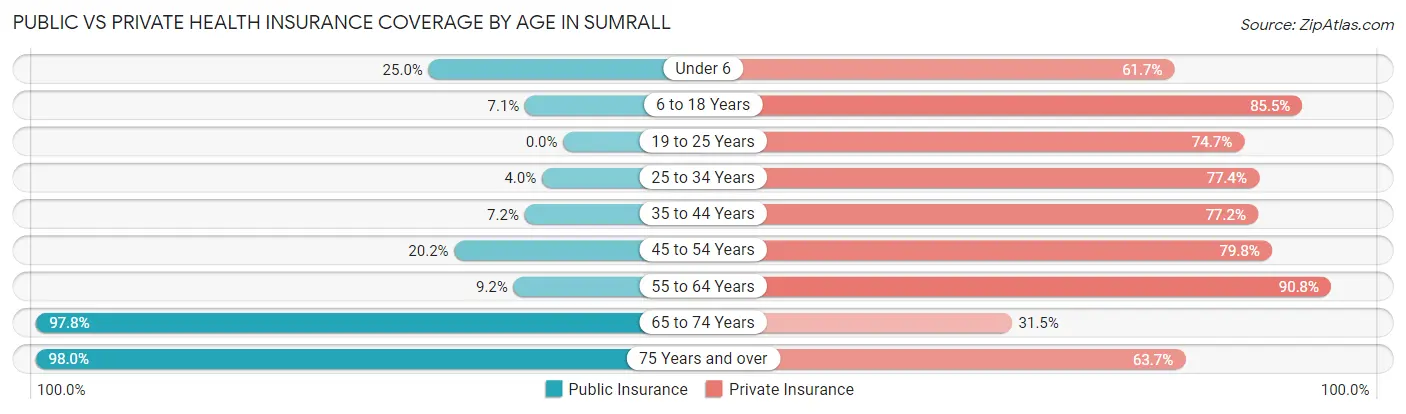
| Age Bracket | Public Insurance | Private Insurance |
| Under 6 | 47 (25.0%) | 116 (61.7%) |
| 6 to 18 Years | 39 (7.1%) | 470 (85.5%) |
| 19 to 25 Years | 0 (0.0%) | 53 (74.7%) |
| 25 to 34 Years | 7 (4.0%) | 137 (77.4%) |
| 35 to 44 Years | 22 (7.2%) | 237 (77.2%) |
| 45 to 54 Years | 94 (20.2%) | 371 (79.8%) |
| 55 to 64 Years | 18 (9.2%) | 177 (90.8%) |
| 65 to 74 Years | 90 (97.8%) | 29 (31.5%) |
| 75 Years and over | 143 (98.0%) | 93 (63.7%) |
| Total | 460 (21.0%) | 1,683 (76.8%) |
Disability Status by Sex by Age in Sumrall
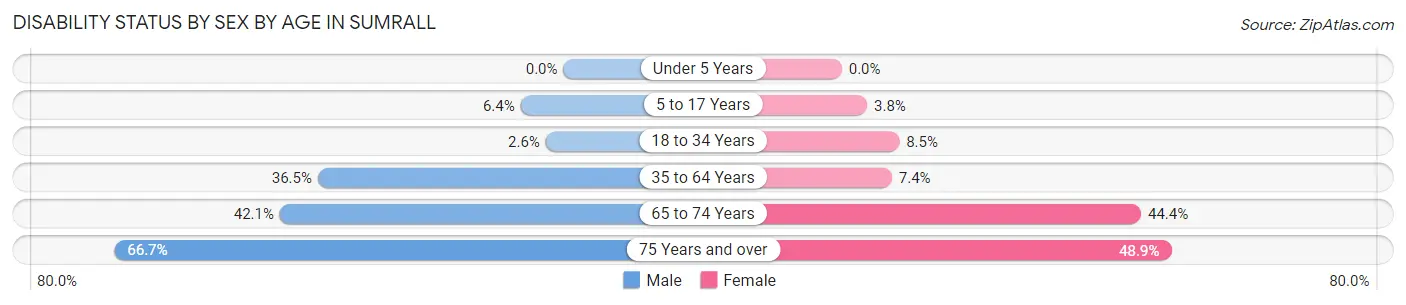
| Age Bracket | Male | Female |
| Under 5 Years | 0 (0.0%) | 0 (0.0%) |
| 5 to 17 Years | 20 (6.4%) | 8 (3.8%) |
| 18 to 34 Years | 5 (2.6%) | 11 (8.5%) |
| 35 to 64 Years | 171 (36.5%) | 37 (7.4%) |
| 65 to 74 Years | 16 (42.1%) | 24 (44.4%) |
| 75 Years and over | 36 (66.7%) | 45 (48.9%) |
Disability Class by Sex by Age in Sumrall
Disability Class: Hearing Difficulty
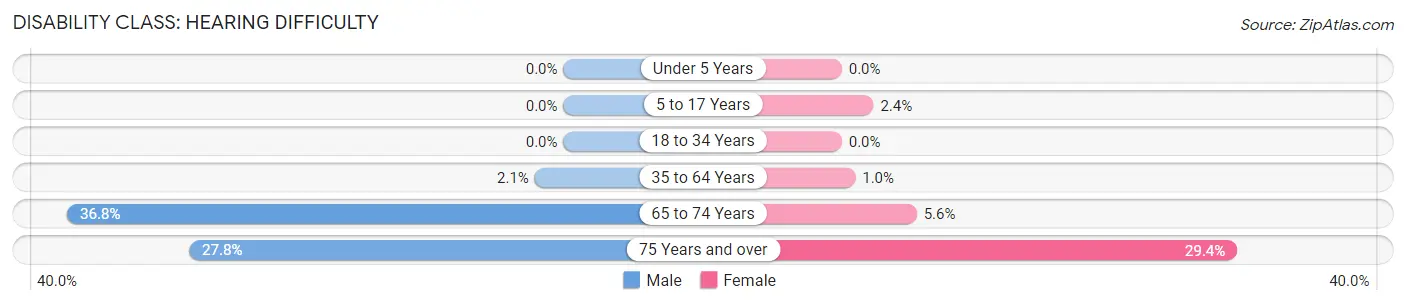
| Age Bracket | Male | Female |
| Under 5 Years | 0 (0.0%) | 0 (0.0%) |
| 5 to 17 Years | 0 (0.0%) | 5 (2.4%) |
| 18 to 34 Years | 0 (0.0%) | 0 (0.0%) |
| 35 to 64 Years | 10 (2.1%) | 5 (1.0%) |
| 65 to 74 Years | 14 (36.8%) | 3 (5.6%) |
| 75 Years and over | 15 (27.8%) | 27 (29.3%) |
Disability Class: Vision Difficulty
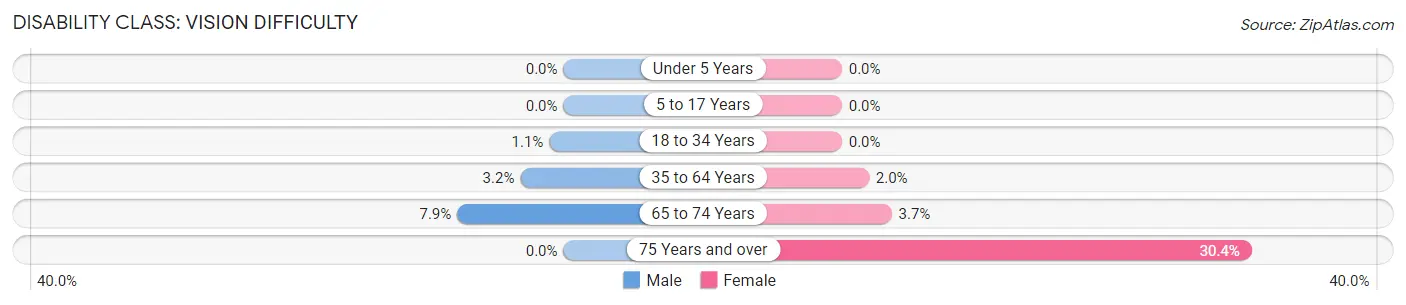
| Age Bracket | Male | Female |
| Under 5 Years | 0 (0.0%) | 0 (0.0%) |
| 5 to 17 Years | 0 (0.0%) | 0 (0.0%) |
| 18 to 34 Years | 2 (1.1%) | 0 (0.0%) |
| 35 to 64 Years | 15 (3.2%) | 10 (2.0%) |
| 65 to 74 Years | 3 (7.9%) | 2 (3.7%) |
| 75 Years and over | 0 (0.0%) | 28 (30.4%) |
Disability Class: Cognitive Difficulty
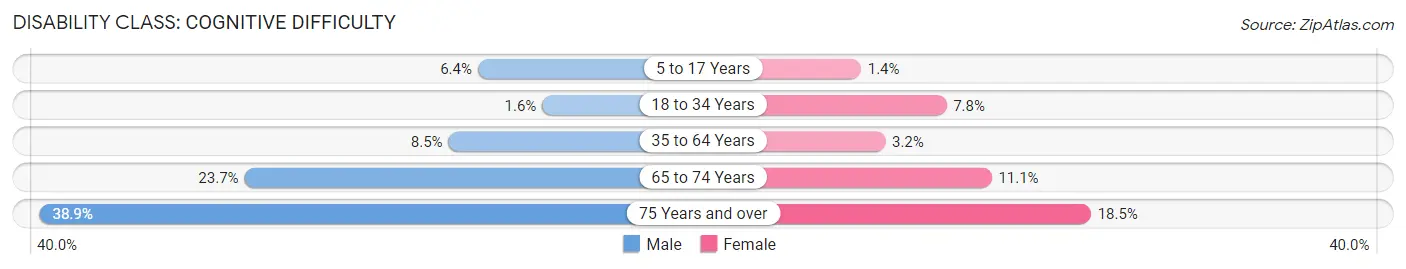
| Age Bracket | Male | Female |
| 5 to 17 Years | 20 (6.4%) | 3 (1.4%) |
| 18 to 34 Years | 3 (1.6%) | 10 (7.7%) |
| 35 to 64 Years | 40 (8.5%) | 16 (3.2%) |
| 65 to 74 Years | 9 (23.7%) | 6 (11.1%) |
| 75 Years and over | 21 (38.9%) | 17 (18.5%) |
Disability Class: Ambulatory Difficulty
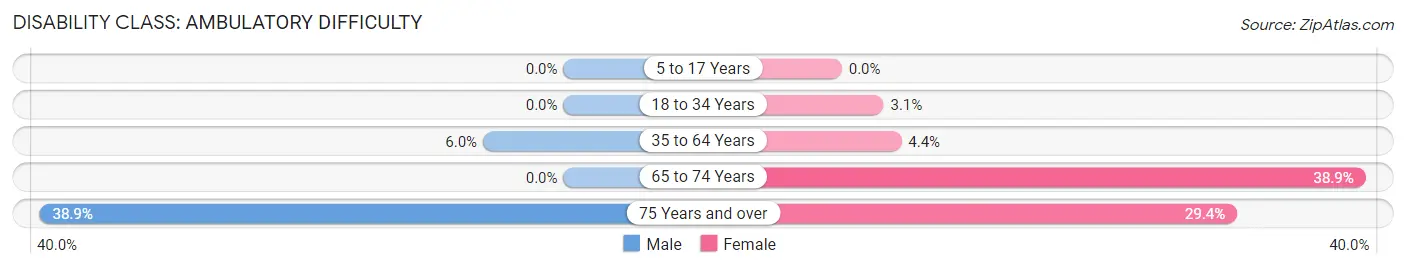
| Age Bracket | Male | Female |
| 5 to 17 Years | 0 (0.0%) | 0 (0.0%) |
| 18 to 34 Years | 0 (0.0%) | 4 (3.1%) |
| 35 to 64 Years | 28 (6.0%) | 22 (4.4%) |
| 65 to 74 Years | 0 (0.0%) | 21 (38.9%) |
| 75 Years and over | 21 (38.9%) | 27 (29.3%) |
Disability Class: Self-Care Difficulty
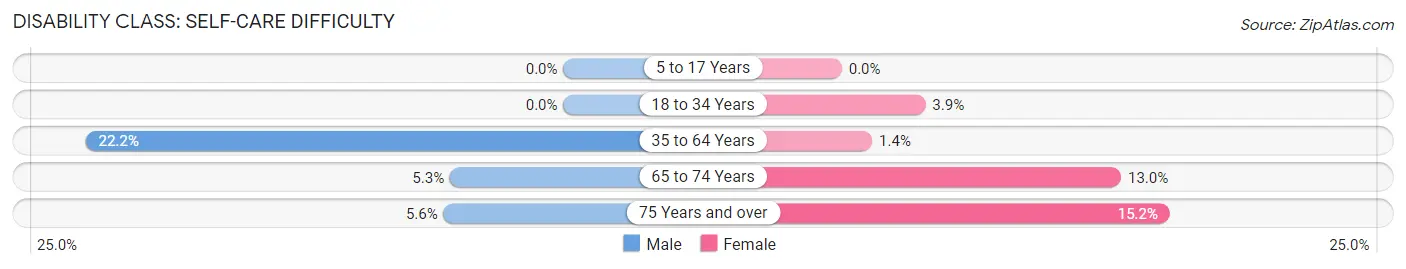
| Age Bracket | Male | Female |
| 5 to 17 Years | 0 (0.0%) | 0 (0.0%) |
| 18 to 34 Years | 0 (0.0%) | 5 (3.9%) |
| 35 to 64 Years | 104 (22.2%) | 7 (1.4%) |
| 65 to 74 Years | 2 (5.3%) | 7 (13.0%) |
| 75 Years and over | 3 (5.6%) | 14 (15.2%) |
Technology Access in Sumrall
Computing Device Access in Sumrall
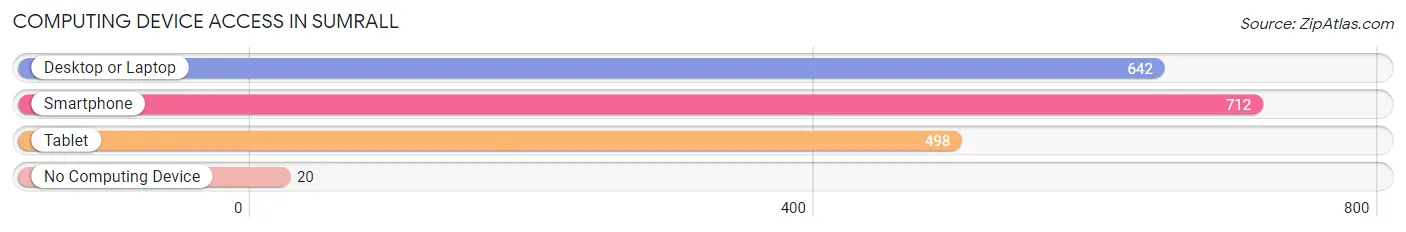
| Device Type | # Households | % Households |
| Desktop or Laptop | 642 | 87.4% |
| Smartphone | 712 | 96.9% |
| Tablet | 498 | 67.8% |
| No Computing Device | 20 | 2.7% |
| Total | 735 | 100.0% |
Internet Access in Sumrall
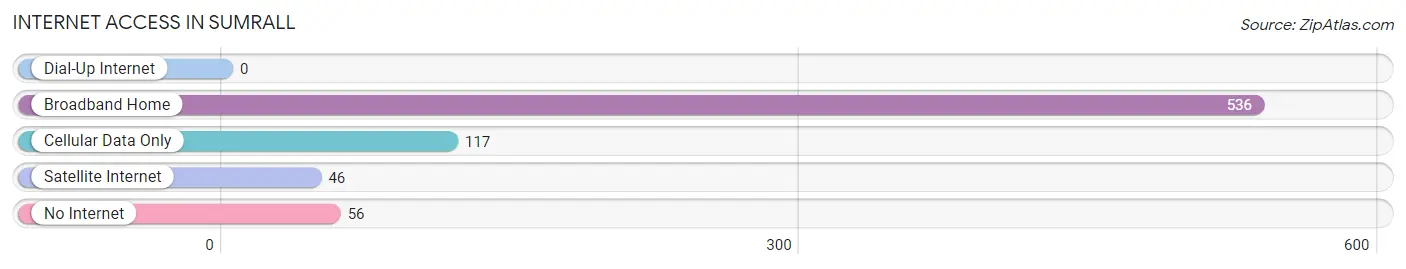
| Internet Type | # Households | % Households |
| Dial-Up Internet | 0 | 0.0% |
| Broadband Home | 536 | 72.9% |
| Cellular Data Only | 117 | 15.9% |
| Satellite Internet | 46 | 6.3% |
| No Internet | 56 | 7.6% |
| Total | 735 | 100.0% |
Sumrall Summary
Sumrall is a small town located in Lamar County, Mississippi. It is situated approximately 10 miles north of Hattiesburg and is part of the Hattiesburg, Mississippi Metropolitan Statistical Area. The town has a population of 1,717 as of the 2010 census.
History
Sumrall was founded in 1883 by the Sumrall family, who had moved to the area from Georgia. The town was named after the family and was originally known as Sumrall Station. The town was incorporated in 1891 and was the first town in Lamar County to be incorporated.
The town was a major stop on the Gulf and Ship Island Railroad, which ran from Gulfport to Jackson. The railroad was a major factor in the town's growth and development. The town was also home to a number of businesses, including a sawmill, a gristmill, a cotton gin, and a general store.
Geography
Sumrall is located at 31°25'25" North, 89°30'45" West (31.423, -89.512). The town is situated in the Piney Woods region of Mississippi and is located in the southeastern part of Lamar County. The town is located approximately 10 miles north of Hattiesburg and is part of the Hattiesburg, Mississippi Metropolitan Statistical Area.
The town is located on the banks of the Leaf River and is surrounded by rolling hills and forests. The town is located in a rural area and is surrounded by farmland.
Economy
The economy of Sumrall is largely based on agriculture. The town is home to a number of farms, including cattle, poultry, and hog farms. The town is also home to a number of small businesses, including restaurants, convenience stores, and auto repair shops.
The town is also home to a number of manufacturing companies, including a furniture manufacturer, a plastics manufacturer, and a metal fabrication company. The town is also home to a number of retail stores, including a grocery store, a hardware store, and a pharmacy.
Demographics
As of the 2010 census, the town had a population of 1,717. The racial makeup of the town was 79.3% White, 18.2% African American, 0.3% Native American, 0.3% Asian, 0.1% Pacific Islander, 0.7% from other races, and 1.3% from two or more races. Hispanic or Latino of any race were 1.7% of the population.
The median income for a household in the town was $31,250, and the median income for a family was $37,500. The per capita income for the town was $15,945. About 17.2% of families and 20.2% of the population were below the poverty line, including 28.3% of those under age 18 and 15.2% of those age 65 or over.
Conclusion
Sumrall is a small town located in Lamar County, Mississippi. It is situated approximately 10 miles north of Hattiesburg and is part of the Hattiesburg, Mississippi Metropolitan Statistical Area. The town has a population of 1,717 as of the 2010 census. The town was founded in 1883 by the Sumrall family and was originally known as Sumrall Station. The town was a major stop on the Gulf and Ship Island Railroad and was home to a number of businesses. The economy of Sumrall is largely based on agriculture and the town is home to a number of small businesses. The racial makeup of the town is 79.3% White, 18.2% African American, 0.3% Native American, 0.3% Asian, 0.1% Pacific Islander, 0.7% from other races, and 1.3% from two or more races. The median income for a household in the town was $31,250, and the median income for a family was $37,500. About 17.2% of families and 20.2% of the population were below the poverty line.
Common Questions
What is Per Capita Income in Sumrall?
Per Capita income in Sumrall is $33,027.
What is the Median Family Income in Sumrall?
Median Family Income in Sumrall is $94,545.
What is the Median Household income in Sumrall?
Median Household Income in Sumrall is $82,292.
What is Income or Wage Gap in Sumrall?
Income or Wage Gap in Sumrall is 16.3%.
Women in Sumrall earn 83.7 cents for every dollar earned by a man.
What is Inequality or Gini Index in Sumrall?
Inequality or Gini Index in Sumrall is 0.34.
What is the Total Population of Sumrall?
Total Population of Sumrall is 2,194.
What is the Total Male Population of Sumrall?
Total Male Population of Sumrall is 1,151.
What is the Total Female Population of Sumrall?
Total Female Population of Sumrall is 1,043.
What is the Ratio of Males per 100 Females in Sumrall?
There are 110.35 Males per 100 Females in Sumrall.
What is the Ratio of Females per 100 Males in Sumrall?
There are 90.62 Females per 100 Males in Sumrall.
What is the Median Population Age in Sumrall?
Median Population Age in Sumrall is 38.3 Years.
What is the Average Family Size in Sumrall
Average Family Size in Sumrall is 3.2 People.
What is the Average Household Size in Sumrall
Average Household Size in Sumrall is 3.0 People.
How Large is the Labor Force in Sumrall?
There are 1,170 People in the Labor Forcein in Sumrall.
What is the Percentage of People in the Labor Force in Sumrall?
71.1% of People are in the Labor Force in Sumrall.
What is the Unemployment Rate in Sumrall?
Unemployment Rate in Sumrall is 7.5%.