Mize, MS Map & Demographics
Mize Map
Mize Overview
$26,850
PER CAPITA INCOME
$88,365
AVG FAMILY INCOME
$48,750
AVG HOUSEHOLD INCOME
24.3%
WAGE / INCOME GAP [ % ]
75.7¢/ $1
WAGE / INCOME GAP [ $ ]
0.40
INEQUALITY / GINI INDEX
321
TOTAL POPULATION
120
MALE POPULATION
201
FEMALE POPULATION
59.70
MALES / 100 FEMALES
167.50
FEMALES / 100 MALES
54.1
MEDIAN AGE
3.1
AVG FAMILY SIZE
2.4
AVG HOUSEHOLD SIZE
108
LABOR FORCE [ PEOPLE ]
43.7%
PERCENT IN LABOR FORCE
4.6%
UNEMPLOYMENT RATE
Mize Zip Codes
Mize Area Codes
Income in Mize
Income Overview in Mize
Per Capita Income in Mize is $26,850, while median incomes of families and households are $88,365 and $48,750 respectively.
| Characteristic | Number | Measure |
| Per Capita Income | 321 | $26,850 |
| Median Family Income | 89 | $88,365 |
| Mean Family Income | 89 | $87,357 |
| Median Household Income | 132 | $48,750 |
| Mean Household Income | 132 | $67,929 |
| Income Deficit | 89 | $0 |
| Wage / Income Gap (%) | 321 | 24.29% |
| Wage / Income Gap ($) | 321 | 75.71¢ per $1 |
| Gini / Inequality Index | 321 | 0.40 |
Earnings by Sex in Mize
Average Earnings in Mize are $40,000, $50,000 for men and $37,857 for women, a difference of 24.3%.
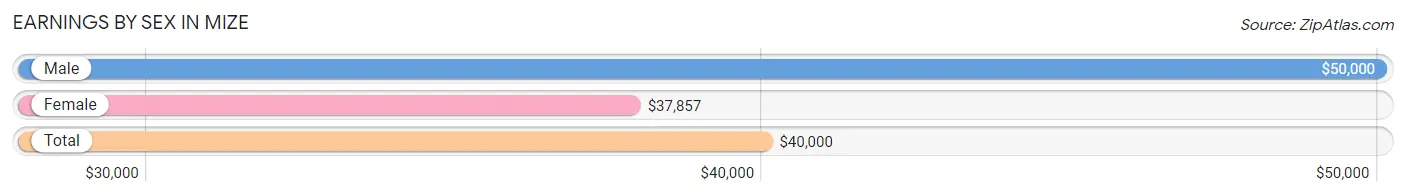
| Sex | Number | Average Earnings |
| Male | 58 (53.7%) | $50,000 |
| Female | 50 (46.3%) | $37,857 |
| Total | 108 (100.0%) | $40,000 |
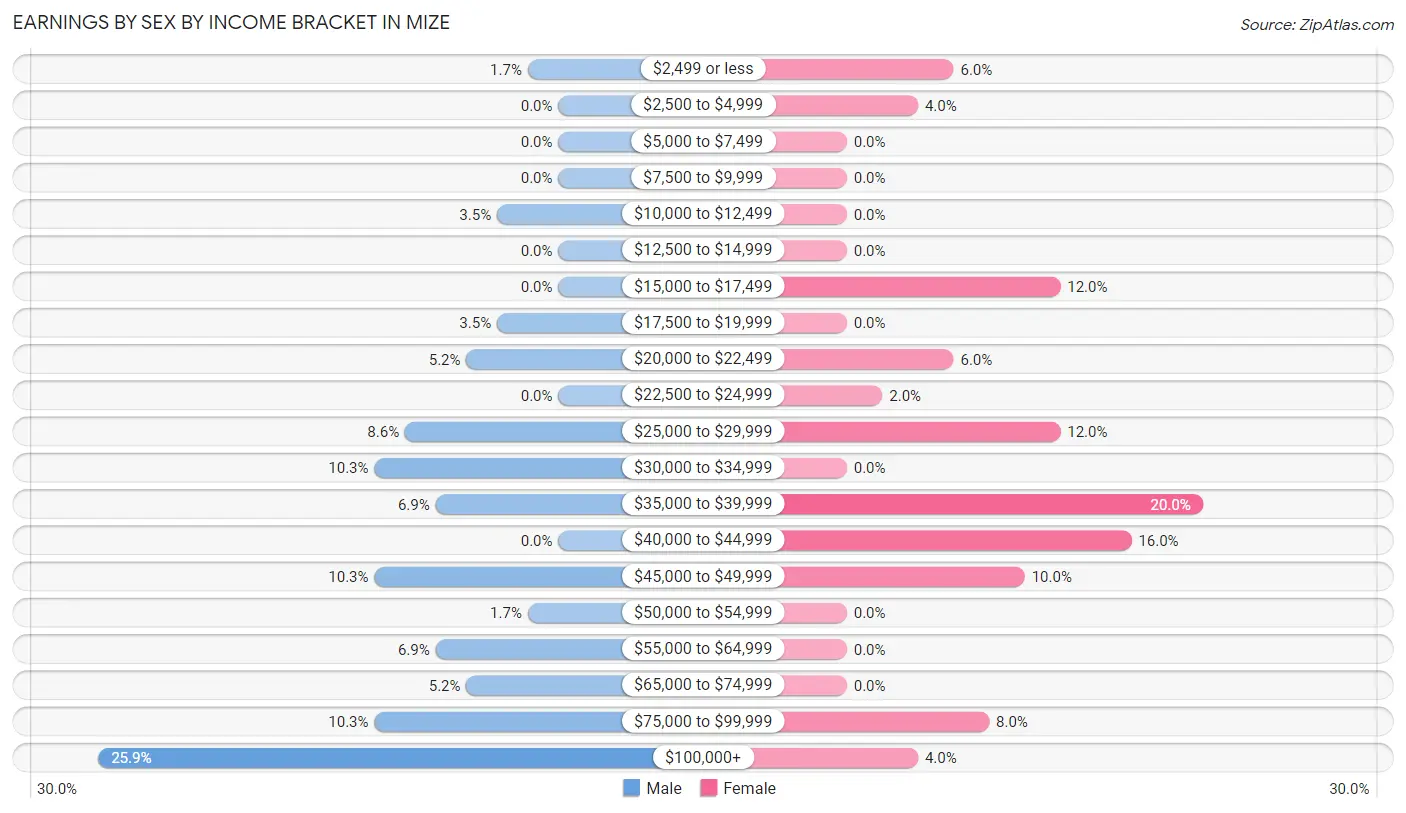
Earnings by Sex by Income Bracket in Mize
The most common earnings brackets in Mize are $100,000+ for men (15 | 25.9%) and $35,000 to $39,999 for women (10 | 20.0%).
| Income | Male | Female |
| $2,499 or less | 1 (1.7%) | 3 (6.0%) |
| $2,500 to $4,999 | 0 (0.0%) | 2 (4.0%) |
| $5,000 to $7,499 | 0 (0.0%) | 0 (0.0%) |
| $7,500 to $9,999 | 0 (0.0%) | 0 (0.0%) |
| $10,000 to $12,499 | 2 (3.5%) | 0 (0.0%) |
| $12,500 to $14,999 | 0 (0.0%) | 0 (0.0%) |
| $15,000 to $17,499 | 0 (0.0%) | 6 (12.0%) |
| $17,500 to $19,999 | 2 (3.5%) | 0 (0.0%) |
| $20,000 to $22,499 | 3 (5.2%) | 3 (6.0%) |
| $22,500 to $24,999 | 0 (0.0%) | 1 (2.0%) |
| $25,000 to $29,999 | 5 (8.6%) | 6 (12.0%) |
| $30,000 to $34,999 | 6 (10.3%) | 0 (0.0%) |
| $35,000 to $39,999 | 4 (6.9%) | 10 (20.0%) |
| $40,000 to $44,999 | 0 (0.0%) | 8 (16.0%) |
| $45,000 to $49,999 | 6 (10.3%) | 5 (10.0%) |
| $50,000 to $54,999 | 1 (1.7%) | 0 (0.0%) |
| $55,000 to $64,999 | 4 (6.9%) | 0 (0.0%) |
| $65,000 to $74,999 | 3 (5.2%) | 0 (0.0%) |
| $75,000 to $99,999 | 6 (10.3%) | 4 (8.0%) |
| $100,000+ | 15 (25.9%) | 2 (4.0%) |
| Total | 58 (100.0%) | 50 (100.0%) |
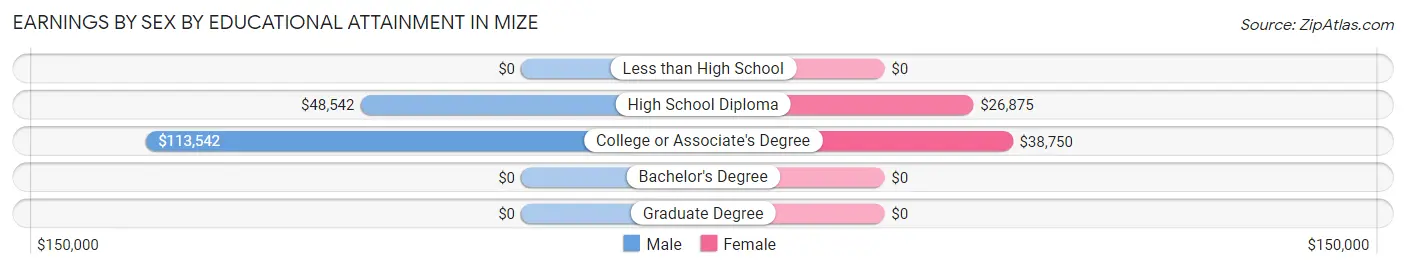
Earnings by Sex by Educational Attainment in Mize
Average earnings in Mize are $59,167 for men and $37,857 for women, a difference of 36.0%. Men with an educational attainment of college or associate's degree enjoy the highest average annual earnings of $113,542, while those with high school diploma education earn the least with $48,542. Women with an educational attainment of college or associate's degree earn the most with the average annual earnings of $38,750, while those with high school diploma education have the smallest earnings of $26,875.
| Educational Attainment | Male Income | Female Income |
| Less than High School | - | - |
| High School Diploma | $48,542 | $26,875 |
| College or Associate's Degree | $113,542 | $38,750 |
| Bachelor's Degree | - | - |
| Graduate Degree | - | - |
| Total | $59,167 | $37,857 |
Family Income in Mize
Family Income Brackets in Mize
According to the Mize family income data, there are 26 families falling into the $75,000 to $99,999 income range, which is the most common income bracket and makes up 29.2% of all families. Conversely, the $15,000 to $24,999 income bracket is the least frequent group with only 1 families (1.1%) belonging to this category.
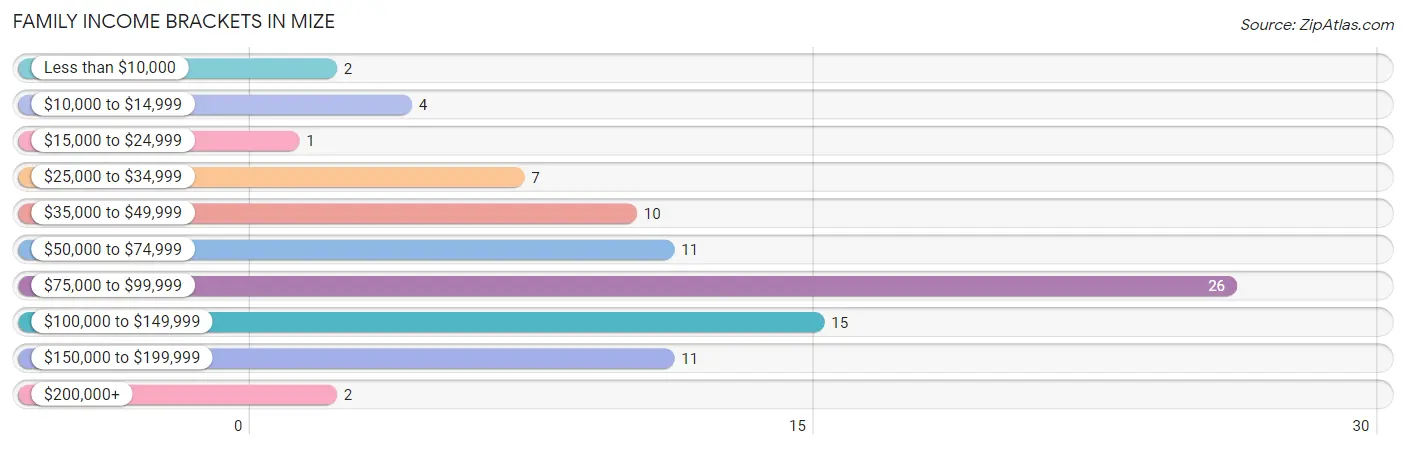
| Income Bracket | # Families | % Families |
| Less than $10,000 | 2 | 2.2% |
| $10,000 to $14,999 | 4 | 4.5% |
| $15,000 to $24,999 | 1 | 1.1% |
| $25,000 to $34,999 | 7 | 7.9% |
| $35,000 to $49,999 | 10 | 11.2% |
| $50,000 to $74,999 | 11 | 12.4% |
| $75,000 to $99,999 | 26 | 29.2% |
| $100,000 to $149,999 | 15 | 16.9% |
| $150,000 to $199,999 | 11 | 12.4% |
| $200,000+ | 2 | 2.2% |
Family Income by Famaliy Size in Mize
3-person families (20 | 22.5%) account for the highest median family income in Mize with $115,000 per family, while 2-person families (52 | 58.4%) have the highest median income of $44,038 per family member.
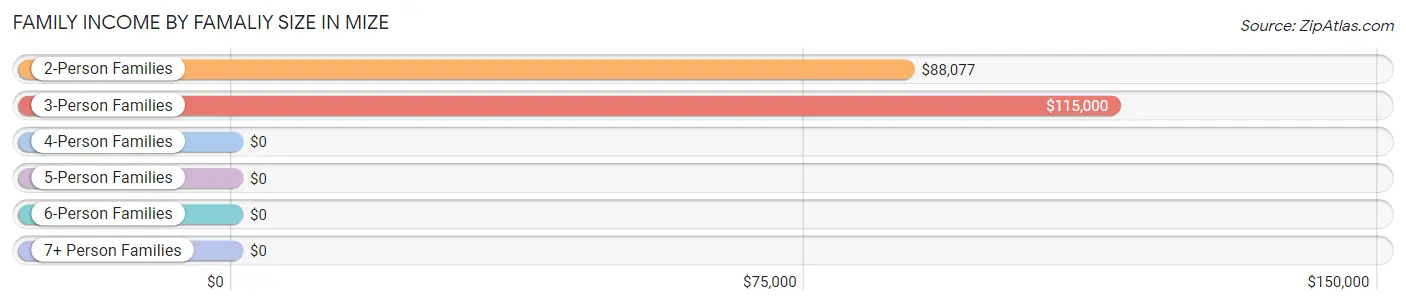
| Income Bracket | # Families | Median Income |
| 2-Person Families | 52 (58.4%) | $88,077 |
| 3-Person Families | 20 (22.5%) | $115,000 |
| 4-Person Families | 8 (9.0%) | $0 |
| 5-Person Families | 5 (5.6%) | $0 |
| 6-Person Families | 1 (1.1%) | $0 |
| 7+ Person Families | 3 (3.4%) | $0 |
| Total | 89 (100.0%) | $88,365 |
Family Income by Number of Earners in Mize
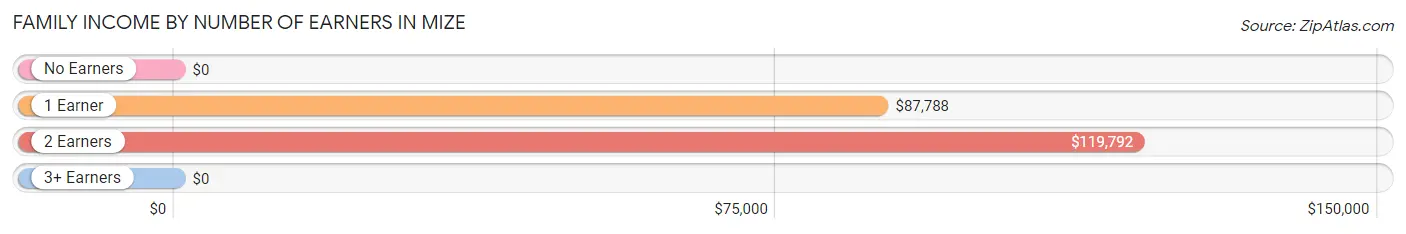
| Number of Earners | # Families | Median Income |
| No Earners | 14 (15.7%) | $0 |
| 1 Earner | 49 (55.1%) | $87,788 |
| 2 Earners | 23 (25.8%) | $119,792 |
| 3+ Earners | 3 (3.4%) | $0 |
| Total | 89 (100.0%) | $88,365 |
Household Income in Mize
Household Income Brackets in Mize
With 35 households falling in the category, the $35,000 to $49,999 income range is the most frequent in Mize, accounting for 26.5% of all households. In contrast, only 2 households (1.5%) fall into the $200,000+ income bracket, making it the least populous group.
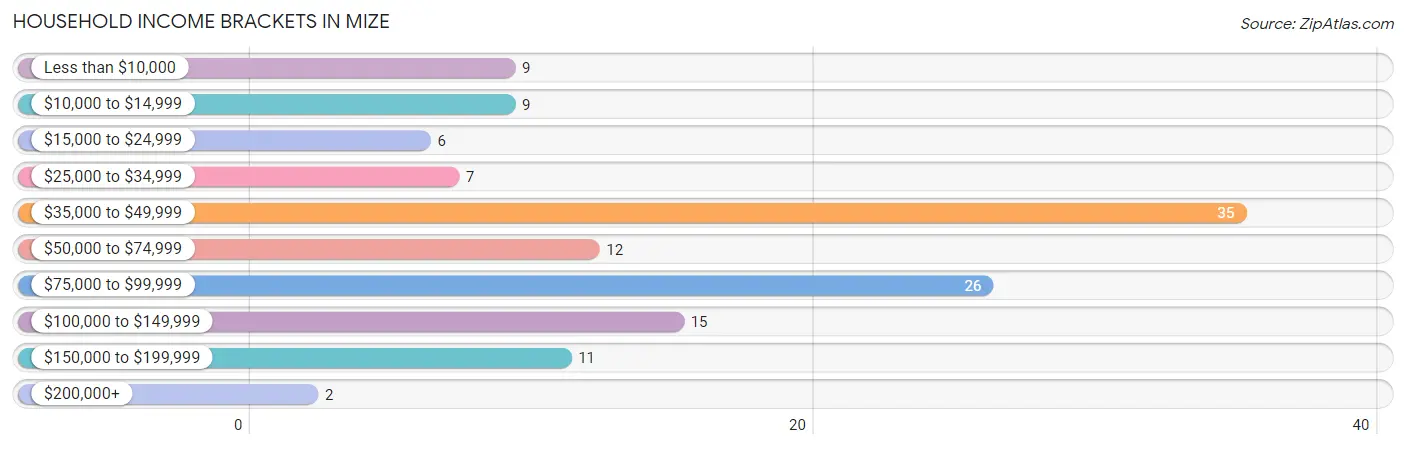
| Income Bracket | # Households | % Households |
| Less than $10,000 | 9 | 6.8% |
| $10,000 to $14,999 | 9 | 6.8% |
| $15,000 to $24,999 | 6 | 4.5% |
| $25,000 to $34,999 | 7 | 5.3% |
| $35,000 to $49,999 | 35 | 26.5% |
| $50,000 to $74,999 | 12 | 9.1% |
| $75,000 to $99,999 | 26 | 19.7% |
| $100,000 to $149,999 | 15 | 11.4% |
| $150,000 to $199,999 | 11 | 8.3% |
| $200,000+ | 2 | 1.5% |
Household Income by Householder Age in Mize
The median household income in Mize is $48,750, with the highest median household income of $78,125 found in the 45 to 64 years age bracket for the primary householder. A total of 39 households (29.5%) fall into this category. Meanwhile, the 15 to 24 years age bracket for the primary householder has the lowest median household income of $0, with 4 households (3.0%) in this group.
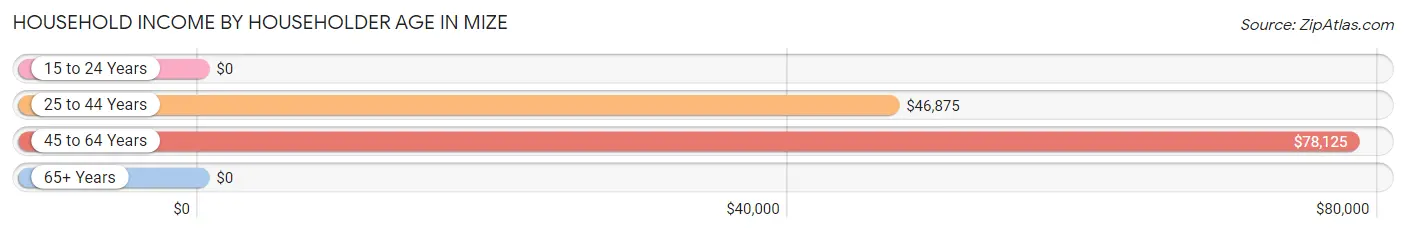
| Income Bracket | # Households | Median Income |
| 15 to 24 Years | 4 (3.0%) | $0 |
| 25 to 44 Years | 25 (18.9%) | $46,875 |
| 45 to 64 Years | 39 (29.5%) | $78,125 |
| 65+ Years | 64 (48.5%) | $0 |
| Total | 132 (100.0%) | $48,750 |
Poverty in Mize
Income Below Poverty by Sex and Age in Mize
With 19.2% poverty level for males and 12.4% for females among the residents of Mize, 15 year old males and 75 year old and over females are the most vulnerable to poverty, with 3 males (100.0%) and 13 females (26.0%) in their respective age groups living below the poverty level.
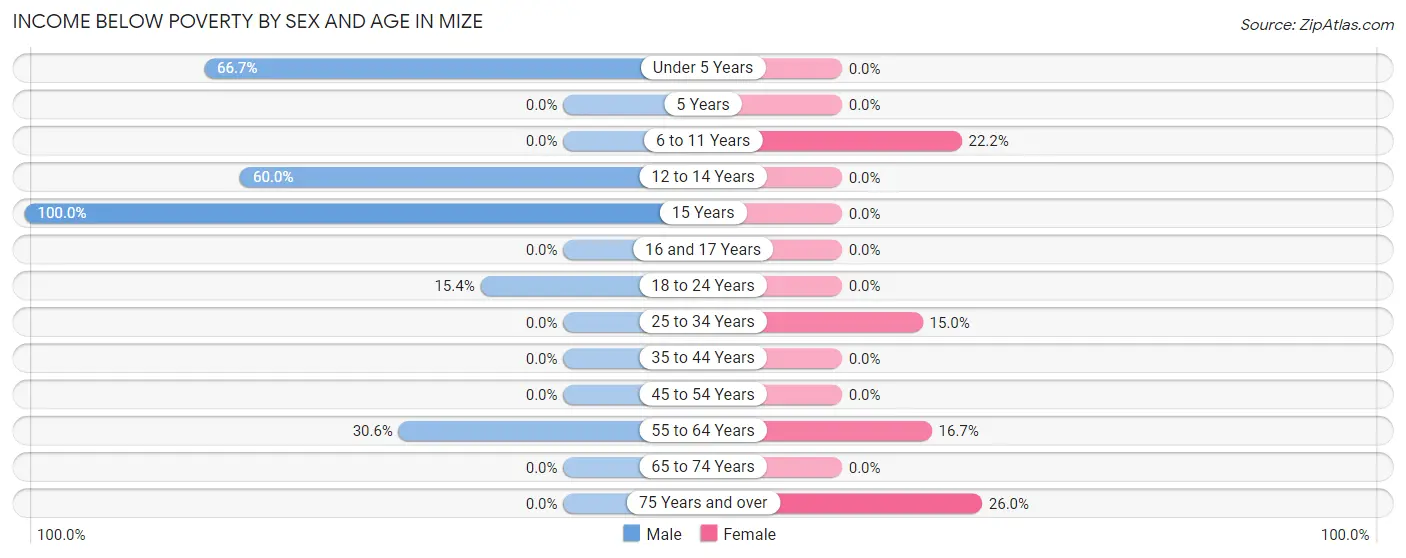
| Age Bracket | Male | Female |
| Under 5 Years | 4 (66.7%) | 0 (0.0%) |
| 5 Years | 0 (0.0%) | 0 (0.0%) |
| 6 to 11 Years | 0 (0.0%) | 6 (22.2%) |
| 12 to 14 Years | 3 (60.0%) | 0 (0.0%) |
| 15 Years | 3 (100.0%) | 0 (0.0%) |
| 16 and 17 Years | 0 (0.0%) | 0 (0.0%) |
| 18 to 24 Years | 2 (15.4%) | 0 (0.0%) |
| 25 to 34 Years | 0 (0.0%) | 3 (15.0%) |
| 35 to 44 Years | 0 (0.0%) | 0 (0.0%) |
| 45 to 54 Years | 0 (0.0%) | 0 (0.0%) |
| 55 to 64 Years | 11 (30.6%) | 3 (16.7%) |
| 65 to 74 Years | 0 (0.0%) | 0 (0.0%) |
| 75 Years and over | 0 (0.0%) | 13 (26.0%) |
| Total | 23 (19.2%) | 25 (12.4%) |
Income Above Poverty by Sex and Age in Mize
According to the poverty statistics in Mize, males aged 5 years and females aged under 5 years are the age groups that are most secure financially, with 100.0% of males and 100.0% of females in these age groups living above the poverty line.
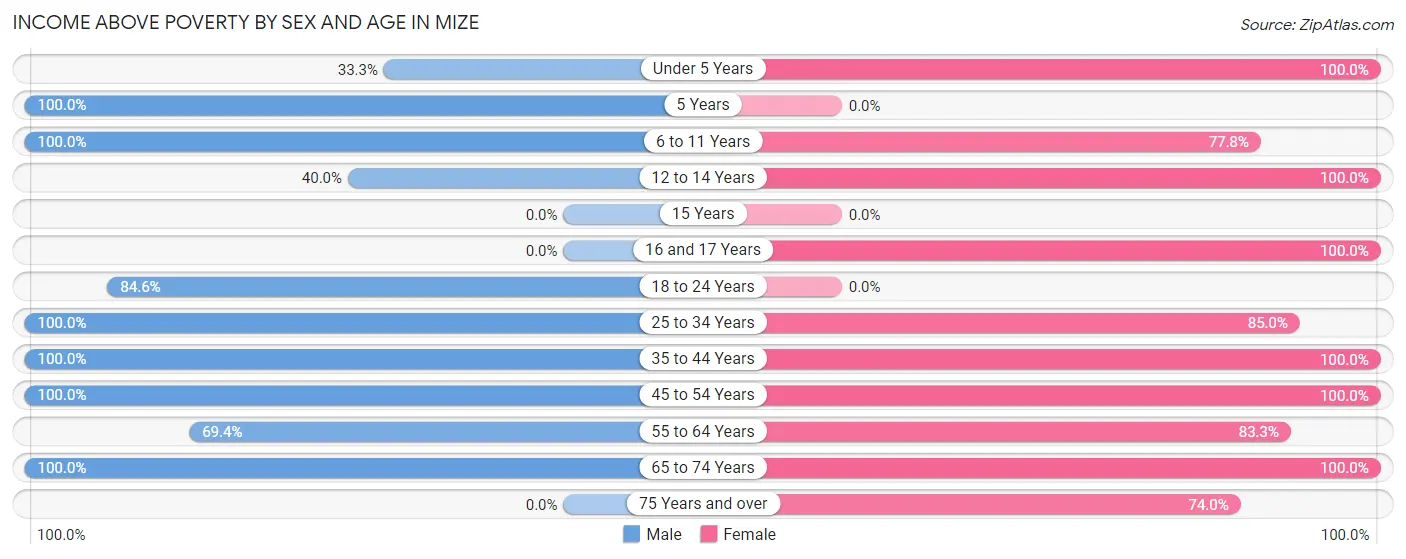
| Age Bracket | Male | Female |
| Under 5 Years | 2 (33.3%) | 8 (100.0%) |
| 5 Years | 2 (100.0%) | 0 (0.0%) |
| 6 to 11 Years | 11 (100.0%) | 21 (77.8%) |
| 12 to 14 Years | 2 (40.0%) | 12 (100.0%) |
| 15 Years | 0 (0.0%) | 0 (0.0%) |
| 16 and 17 Years | 0 (0.0%) | 6 (100.0%) |
| 18 to 24 Years | 11 (84.6%) | 0 (0.0%) |
| 25 to 34 Years | 4 (100.0%) | 17 (85.0%) |
| 35 to 44 Years | 14 (100.0%) | 2 (100.0%) |
| 45 to 54 Years | 11 (100.0%) | 27 (100.0%) |
| 55 to 64 Years | 25 (69.4%) | 15 (83.3%) |
| 65 to 74 Years | 15 (100.0%) | 31 (100.0%) |
| 75 Years and over | 0 (0.0%) | 37 (74.0%) |
| Total | 97 (80.8%) | 176 (87.6%) |
Income Below Poverty Among Married-Couple Families in Mize
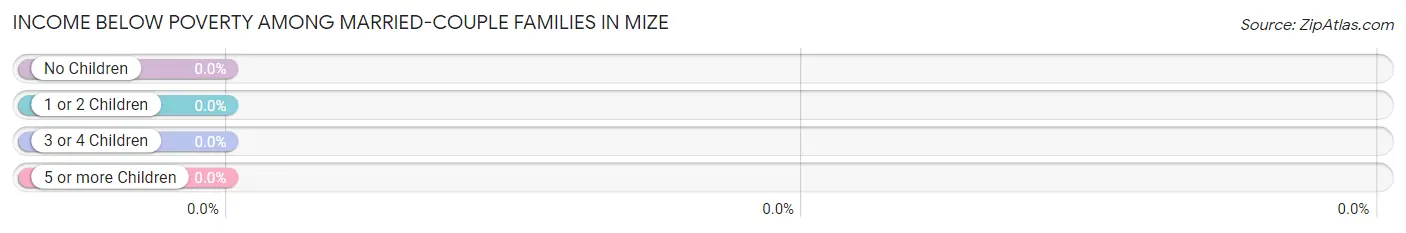
| Children | Above Poverty | Below Poverty |
| No Children | 44 (100.0%) | 0 (0.0%) |
| 1 or 2 Children | 16 (100.0%) | 0 (0.0%) |
| 3 or 4 Children | 8 (100.0%) | 0 (0.0%) |
| 5 or more Children | 0 (0.0%) | 0 (0.0%) |
| Total | 68 (100.0%) | 0 (0.0%) |
Income Below Poverty Among Single-Parent Households in Mize
According to the poverty data in Mize, 54.5% or 6 single-father households and 10.0% or 1 single-mother households are living below the poverty line. Among single-father households, those with no children have the highest poverty rate, with 4 households (57.1%) experiencing poverty. Likewise, among single-mother households, those with 3 or 4 children have the highest poverty rate, with 1 households (100.0%) falling below the poverty line.
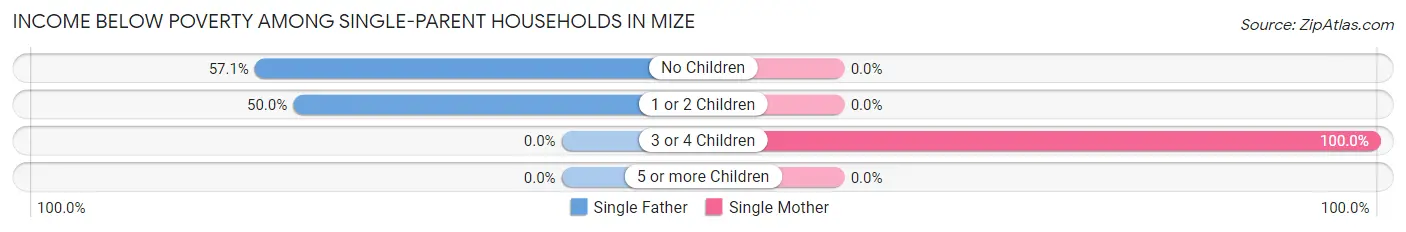
| Children | Single Father | Single Mother |
| No Children | 4 (57.1%) | 0 (0.0%) |
| 1 or 2 Children | 2 (50.0%) | 0 (0.0%) |
| 3 or 4 Children | 0 (0.0%) | 1 (100.0%) |
| 5 or more Children | 0 (0.0%) | 0 (0.0%) |
| Total | 6 (54.5%) | 1 (10.0%) |
Income Below Poverty Among Married-Couple vs Single-Parent Households in Mize
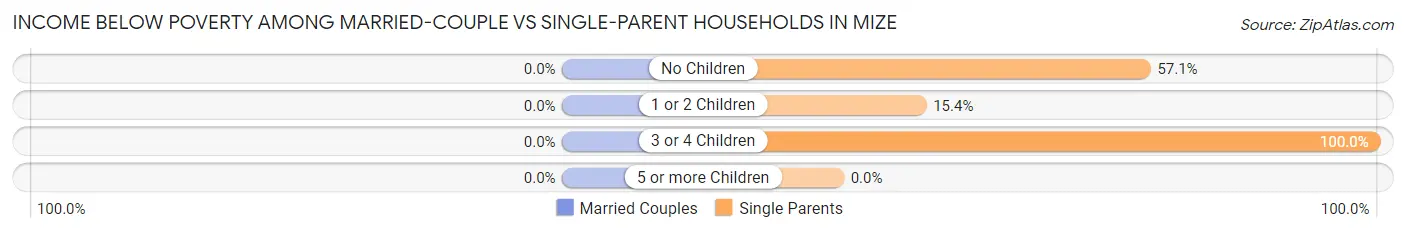
| Children | Married-Couple Families | Single-Parent Households |
| No Children | 0 (0.0%) | 4 (57.1%) |
| 1 or 2 Children | 0 (0.0%) | 2 (15.4%) |
| 3 or 4 Children | 0 (0.0%) | 1 (100.0%) |
| 5 or more Children | 0 (0.0%) | 0 (0.0%) |
| Total | 0 (0.0%) | 7 (33.3%) |
Race in Mize
The most populous races in Mize are White / Caucasian (300 | 93.5%), and Two or more Races (21 | 6.5%).
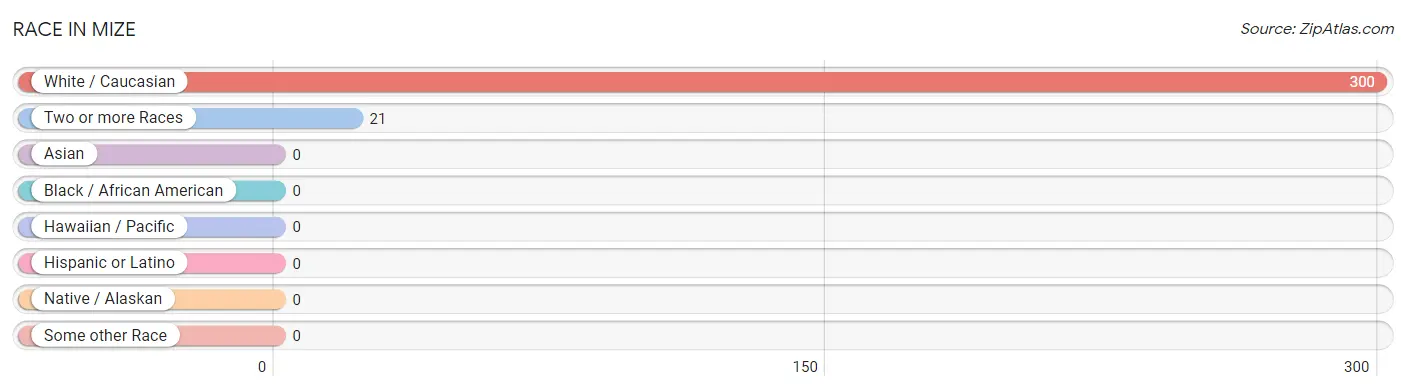
| Race | # Population | % Population |
| Asian | 0 | 0.0% |
| Black / African American | 0 | 0.0% |
| Hawaiian / Pacific | 0 | 0.0% |
| Hispanic or Latino | 0 | 0.0% |
| Native / Alaskan | 0 | 0.0% |
| White / Caucasian | 300 | 93.5% |
| Two or more Races | 21 | 6.5% |
| Some other Race | 0 | 0.0% |
| Total | 321 | 100.0% |
Ancestry in Mize
The most populous ancestries reported in Mize are American (166 | 51.7%), Irish (51 | 15.9%), English (43 | 13.4%), German (12 | 3.7%), and Subsaharan African (9 | 2.8%), together accounting for 87.5% of all Mize residents.
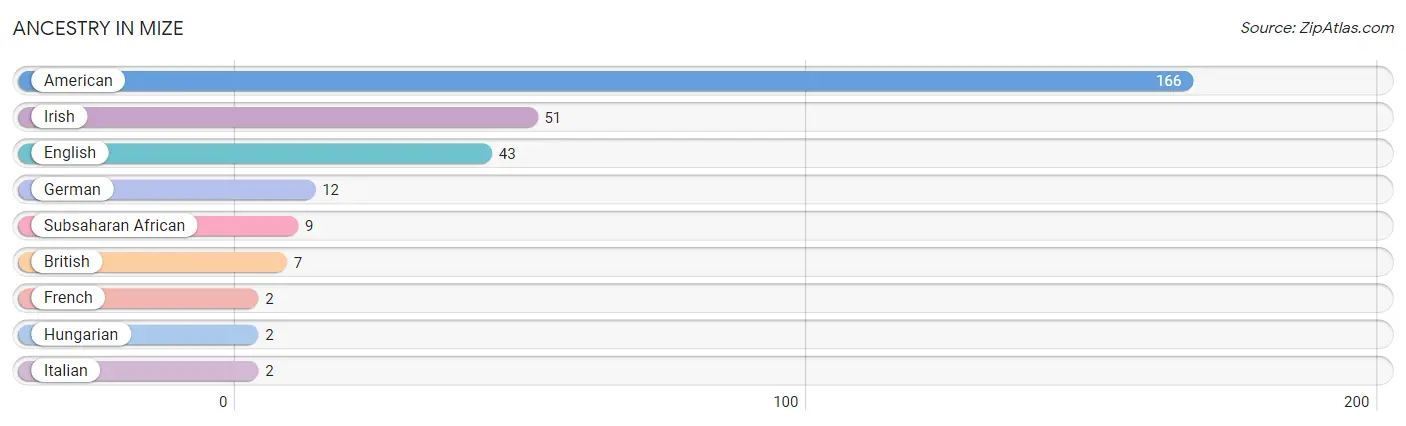
| Ancestry | # Population | % Population |
| American | 166 | 51.7% |
| British | 7 | 2.2% |
| English | 43 | 13.4% |
| French | 2 | 0.6% |
| German | 12 | 3.7% |
| Hungarian | 2 | 0.6% |
| Irish | 51 | 15.9% |
| Italian | 2 | 0.6% |
| Subsaharan African | 9 | 2.8% | View All 9 Rows |
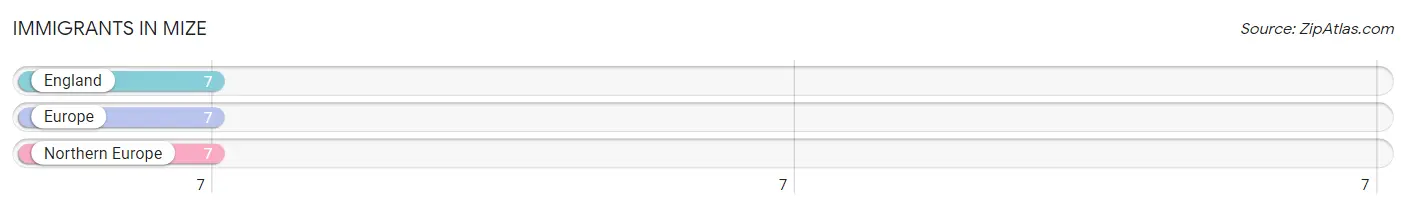
Immigrants in Mize
The most numerous immigrant groups reported in Mize came from England (7 | 2.2%), Europe (7 | 2.2%), and Northern Europe (7 | 2.2%), together accounting for 6.5% of all Mize residents.
| Immigration Origin | # Population | % Population |
| England | 7 | 2.2% |
| Europe | 7 | 2.2% |
| Northern Europe | 7 | 2.2% | View All 3 Rows |
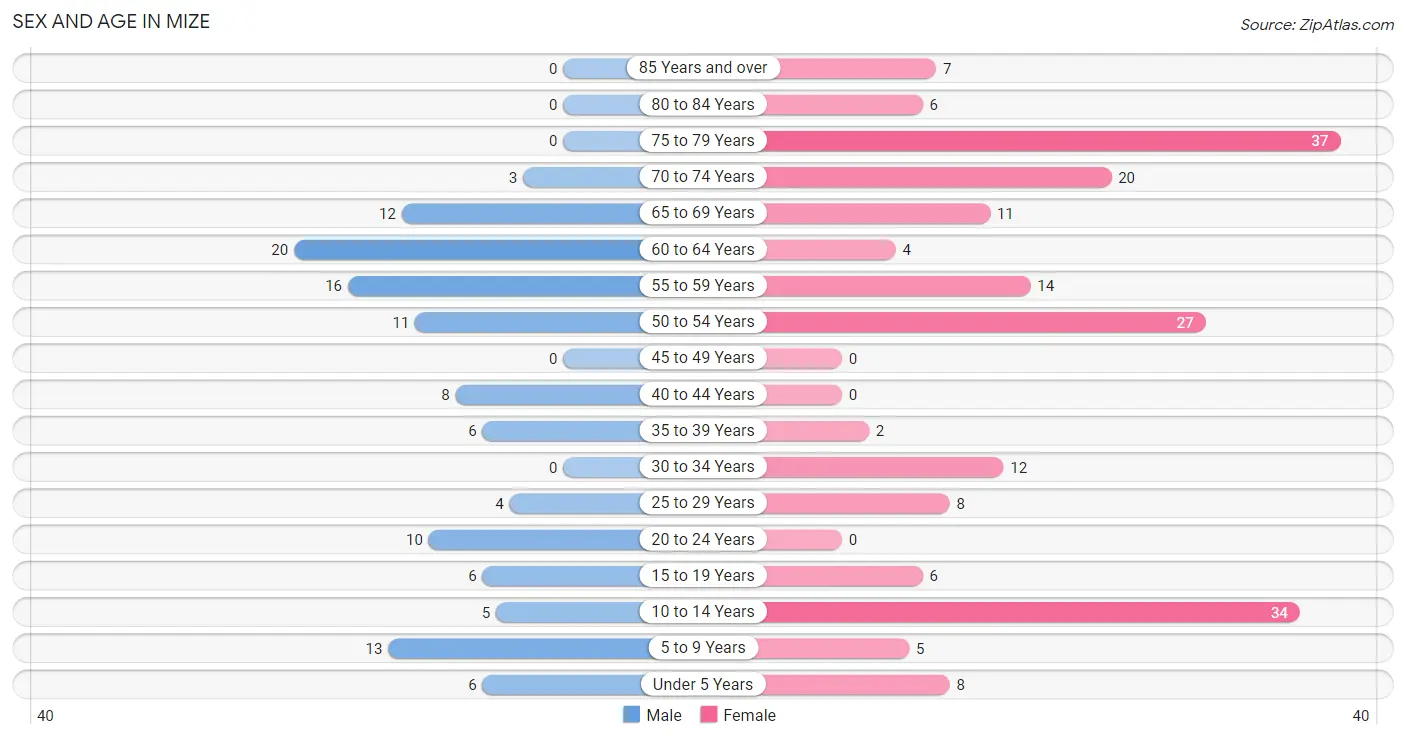
Sex and Age in Mize
Sex and Age in Mize
The most populous age groups in Mize are 60 to 64 Years (20 | 16.7%) for men and 75 to 79 Years (37 | 18.4%) for women.
| Age Bracket | Male | Female |
| Under 5 Years | 6 (5.0%) | 8 (4.0%) |
| 5 to 9 Years | 13 (10.8%) | 5 (2.5%) |
| 10 to 14 Years | 5 (4.2%) | 34 (16.9%) |
| 15 to 19 Years | 6 (5.0%) | 6 (3.0%) |
| 20 to 24 Years | 10 (8.3%) | 0 (0.0%) |
| 25 to 29 Years | 4 (3.3%) | 8 (4.0%) |
| 30 to 34 Years | 0 (0.0%) | 12 (6.0%) |
| 35 to 39 Years | 6 (5.0%) | 2 (1.0%) |
| 40 to 44 Years | 8 (6.7%) | 0 (0.0%) |
| 45 to 49 Years | 0 (0.0%) | 0 (0.0%) |
| 50 to 54 Years | 11 (9.2%) | 27 (13.4%) |
| 55 to 59 Years | 16 (13.3%) | 14 (7.0%) |
| 60 to 64 Years | 20 (16.7%) | 4 (2.0%) |
| 65 to 69 Years | 12 (10.0%) | 11 (5.5%) |
| 70 to 74 Years | 3 (2.5%) | 20 (10.0%) |
| 75 to 79 Years | 0 (0.0%) | 37 (18.4%) |
| 80 to 84 Years | 0 (0.0%) | 6 (3.0%) |
| 85 Years and over | 0 (0.0%) | 7 (3.5%) |
| Total | 120 (100.0%) | 201 (100.0%) |
Families and Households in Mize
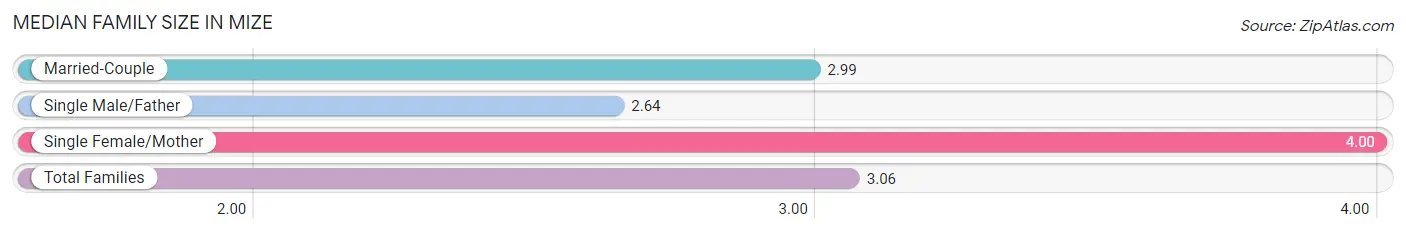
Median Family Size in Mize
The median family size in Mize is 3.06 persons per family, with single female/mother families (10 | 11.2%) accounting for the largest median family size of 4 persons per family. On the other hand, single male/father families (11 | 12.4%) represent the smallest median family size with 2.64 persons per family.
| Family Type | # Families | Family Size |
| Married-Couple | 68 (76.4%) | 2.99 |
| Single Male/Father | 11 (12.4%) | 2.64 |
| Single Female/Mother | 10 (11.2%) | 4.00 |
| Total Families | 89 (100.0%) | 3.06 |
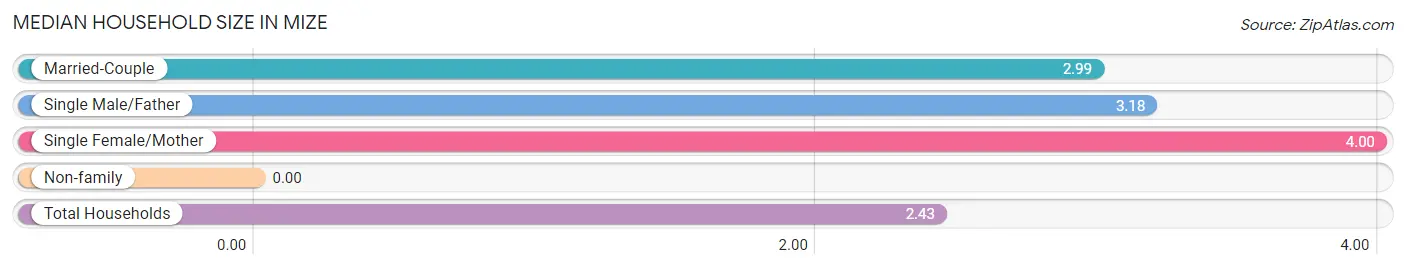
Median Household Size in Mize
| Household Type | # Households | Household Size |
| Married-Couple | 68 (51.5%) | 2.99 |
| Single Male/Father | 11 (8.3%) | 3.18 |
| Single Female/Mother | 10 (7.6%) | 4.00 |
| Non-family | 43 (32.6%) | - |
| Total Households | 132 (100.0%) | 2.43 |
Household Size by Marriage Status in Mize
Out of a total of 132 households in Mize, 89 (67.4%) are family households, while 43 (32.6%) are nonfamily households. The most numerous type of family households are 2-person households, comprising 48, and the most common type of nonfamily households are 1-person households, comprising 43.
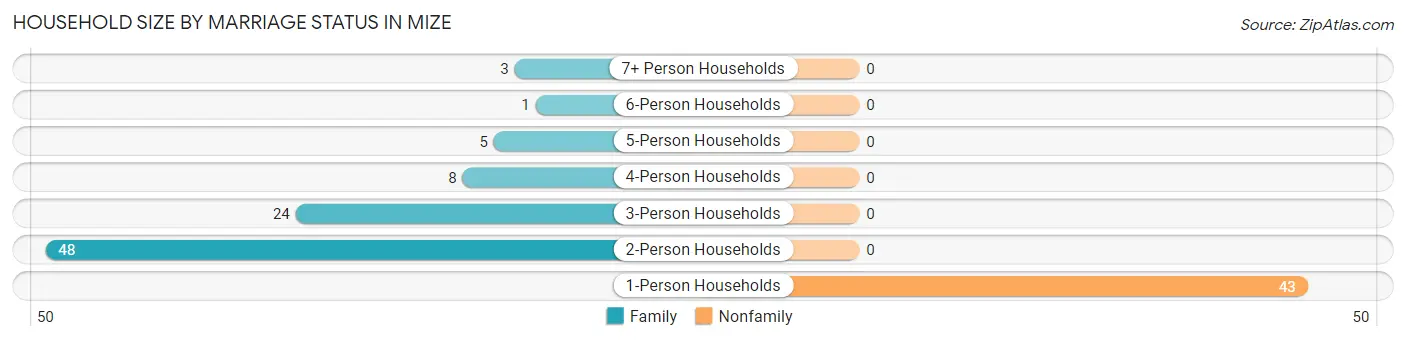
| Household Size | Family Households | Nonfamily Households |
| 1-Person Households | - | 43 (32.6%) |
| 2-Person Households | 48 (36.4%) | 0 (0.0%) |
| 3-Person Households | 24 (18.2%) | 0 (0.0%) |
| 4-Person Households | 8 (6.1%) | 0 (0.0%) |
| 5-Person Households | 5 (3.8%) | 0 (0.0%) |
| 6-Person Households | 1 (0.8%) | 0 (0.0%) |
| 7+ Person Households | 3 (2.3%) | 0 (0.0%) |
| Total | 89 (67.4%) | 43 (32.6%) |
Female Fertility in Mize
Fertility by Age in Mize
Average fertility rate in Mize is 111.0 births per 1,000 women. Women in the age bracket of 20 to 34 years have the highest fertility rate with 200.0 births per 1,000 women. Women in the age bracket of 20 to 34 years acount for 100.0% of all women with births.
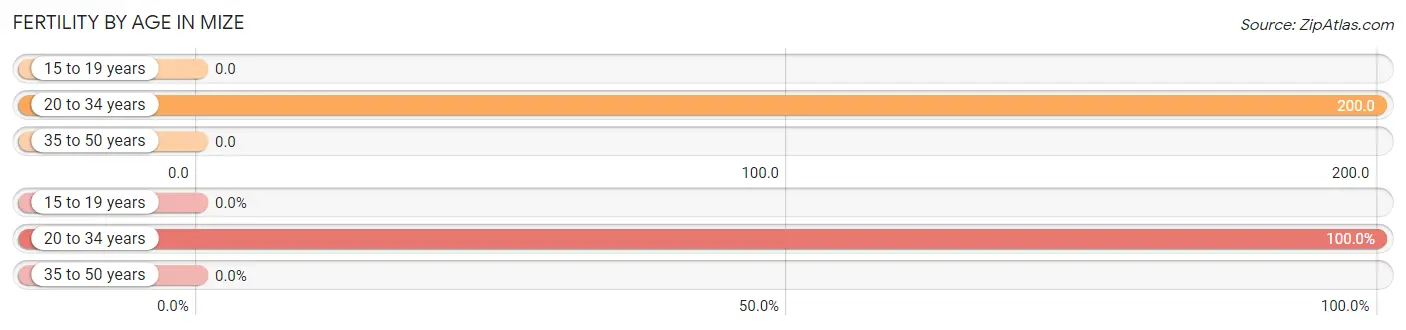
| Age Bracket | Women with Births | Births / 1,000 Women |
| 15 to 19 years | 0 (0.0%) | 0.0 |
| 20 to 34 years | 4 (100.0%) | 200.0 |
| 35 to 50 years | 0 (0.0%) | 0.0 |
| Total | 4 (100.0%) | 111.0 |
Fertility by Age by Marriage Status in Mize
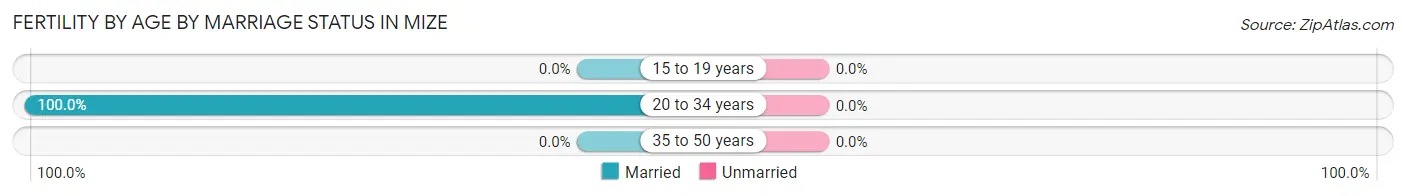
| Age Bracket | Married | Unmarried |
| 15 to 19 years | 0 (0.0%) | 0 (0.0%) |
| 20 to 34 years | 4 (100.0%) | 0 (0.0%) |
| 35 to 50 years | 0 (0.0%) | 0 (0.0%) |
| Total | 4 (100.0%) | 0 (0.0%) |
Fertility by Education in Mize
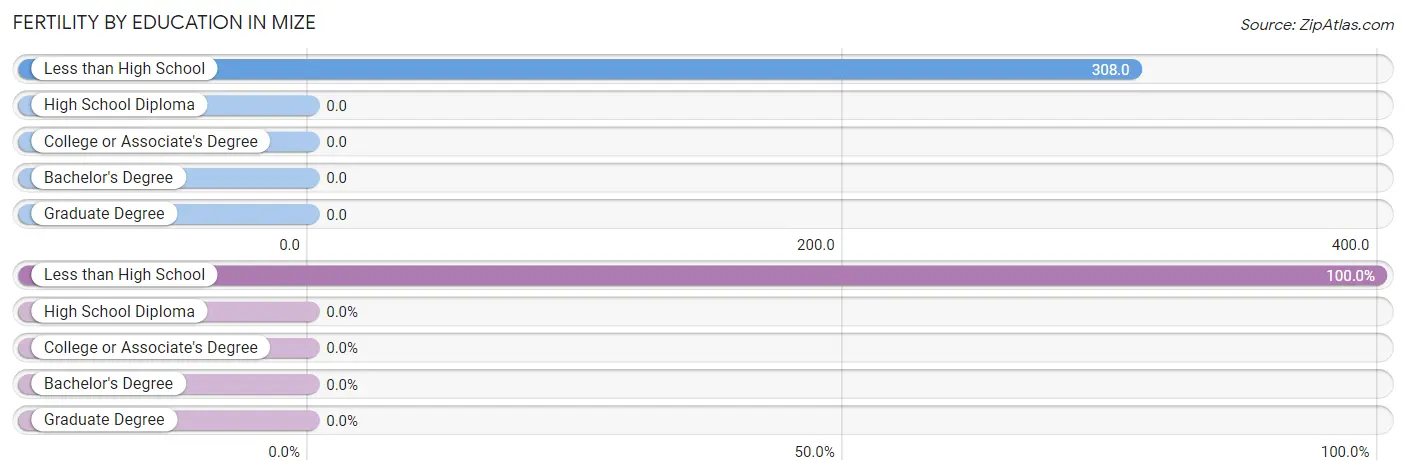
| Educational Attainment | Women with Births | Births / 1,000 Women |
| Less than High School | 4 (100.0%) | 308.0 |
| High School Diploma | 0 (0.0%) | 0.0 |
| College or Associate's Degree | 0 (0.0%) | 0.0 |
| Bachelor's Degree | 0 (0.0%) | 0.0 |
| Graduate Degree | 0 (0.0%) | 0.0 |
| Total | 4 (100.0%) | 111.0 |
Fertility by Education by Marriage Status in Mize
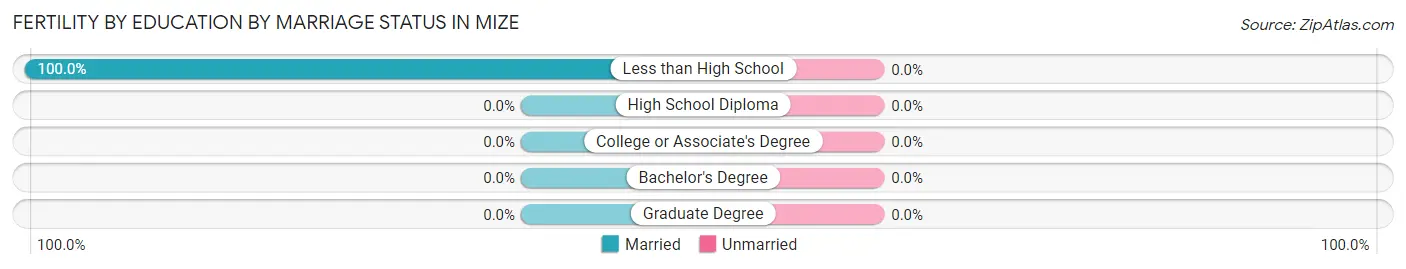
| Educational Attainment | Married | Unmarried |
| Less than High School | 4 (100.0%) | 0 (0.0%) |
| High School Diploma | 0 (0.0%) | 0 (0.0%) |
| College or Associate's Degree | 0 (0.0%) | 0 (0.0%) |
| Bachelor's Degree | 0 (0.0%) | 0 (0.0%) |
| Graduate Degree | 0 (0.0%) | 0 (0.0%) |
| Total | 4 (100.0%) | 0 (0.0%) |
Employment Characteristics in Mize
Employment by Class of Employer in Mize
Among the 101 employed individuals in Mize, private company employees (67 | 66.3%), local government employees (11 | 10.9%), and state government employees (7 | 6.9%) make up the most common classes of employment.
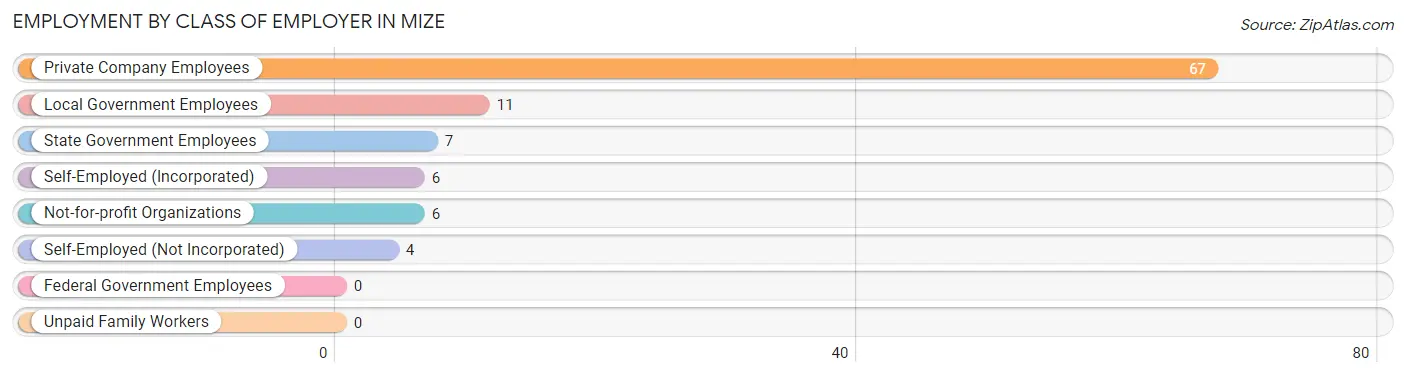
| Employer Class | # Employees | % Employees |
| Private Company Employees | 67 | 66.3% |
| Self-Employed (Incorporated) | 6 | 5.9% |
| Self-Employed (Not Incorporated) | 4 | 4.0% |
| Not-for-profit Organizations | 6 | 5.9% |
| Local Government Employees | 11 | 10.9% |
| State Government Employees | 7 | 6.9% |
| Federal Government Employees | 0 | 0.0% |
| Unpaid Family Workers | 0 | 0.0% |
| Total | 101 | 100.0% |
Employment Status by Age in Mize
According to the labor force statistics for Mize, out of the total population over 16 years of age (247), 43.7% or 108 individuals are in the labor force, with 4.6% or 5 of them unemployed. The age group with the highest labor force participation rate is 20 to 24 years, with 100.0% or 10 individuals in the labor force. Within the labor force, the 30 to 34 years age range has the highest percentage of unemployed individuals, with 42.9% or 3 of them being unemployed.
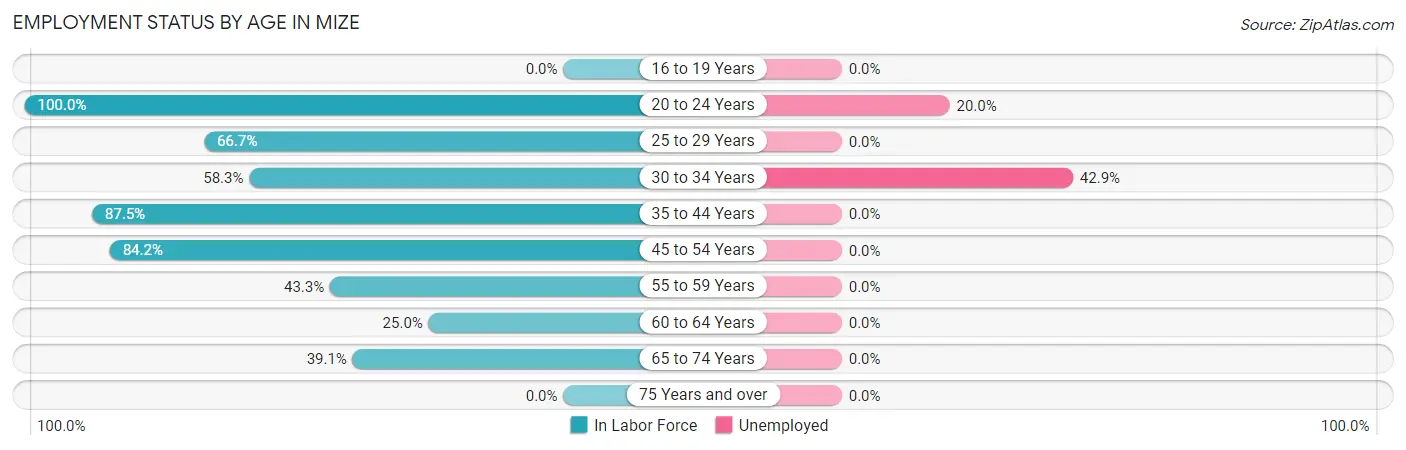
| Age Bracket | In Labor Force | Unemployed |
| 16 to 19 Years | 0 (0.0%) | 0 (0.0%) |
| 20 to 24 Years | 10 (100.0%) | 2 (20.0%) |
| 25 to 29 Years | 8 (66.7%) | 0 (0.0%) |
| 30 to 34 Years | 7 (58.3%) | 3 (42.9%) |
| 35 to 44 Years | 14 (87.5%) | 0 (0.0%) |
| 45 to 54 Years | 32 (84.2%) | 0 (0.0%) |
| 55 to 59 Years | 13 (43.3%) | 0 (0.0%) |
| 60 to 64 Years | 6 (25.0%) | 0 (0.0%) |
| 65 to 74 Years | 18 (39.1%) | 0 (0.0%) |
| 75 Years and over | 0 (0.0%) | 0 (0.0%) |
| Total | 108 (43.7%) | 5 (4.6%) |
Employment Status by Educational Attainment in Mize
According to labor force statistics for Mize, 60.6% of individuals (80) out of the total population between 25 and 64 years of age (132) are in the labor force, with 3.8% or 3 of them being unemployed. The group with the highest labor force participation rate are those with the educational attainment of bachelor's degree or higher, with 100.0% or 17 individuals in the labor force. Within the labor force, individuals with less than high school education have the highest percentage of unemployment, with 37.5% or 3 of them being unemployed.
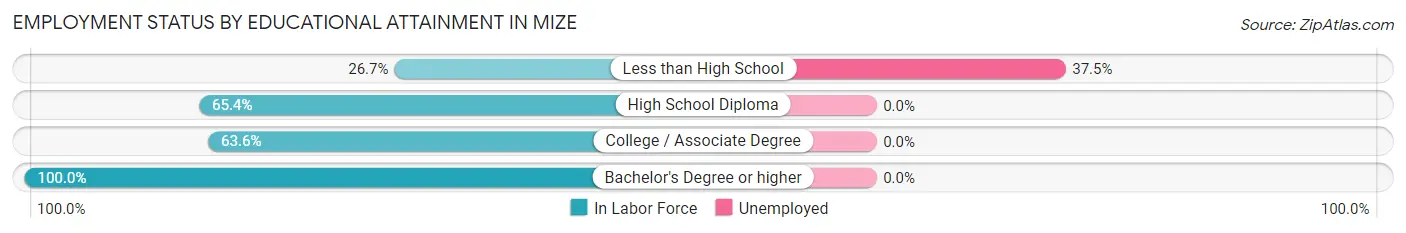
| Educational Attainment | In Labor Force | Unemployed |
| Less than High School | 8 (26.7%) | 11 (37.5%) |
| High School Diploma | 34 (65.4%) | 0 (0.0%) |
| College / Associate Degree | 21 (63.6%) | 0 (0.0%) |
| Bachelor's Degree or higher | 17 (100.0%) | 0 (0.0%) |
| Total | 80 (60.6%) | 5 (3.8%) |
Employment Occupations by Sex in Mize
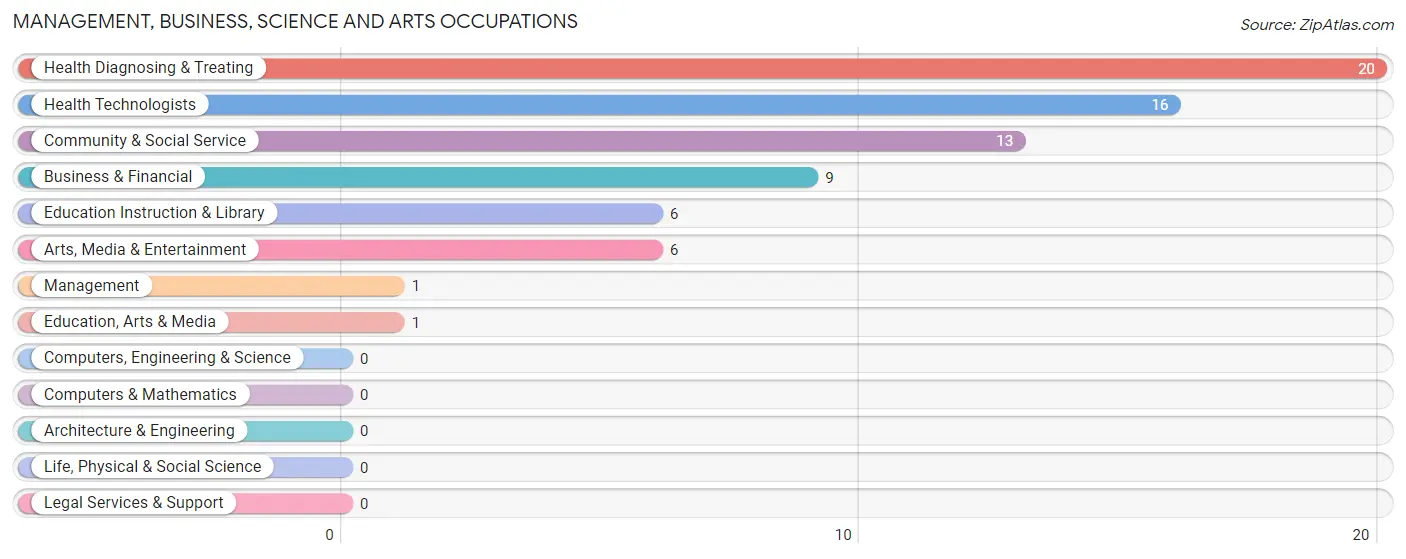
Management, Business, Science and Arts Occupations
The most common Management, Business, Science and Arts occupations in Mize are Health Diagnosing & Treating (20 | 19.4%), Health Technologists (16 | 15.5%), Community & Social Service (13 | 12.6%), Business & Financial (9 | 8.7%), and Education Instruction & Library (6 | 5.8%).
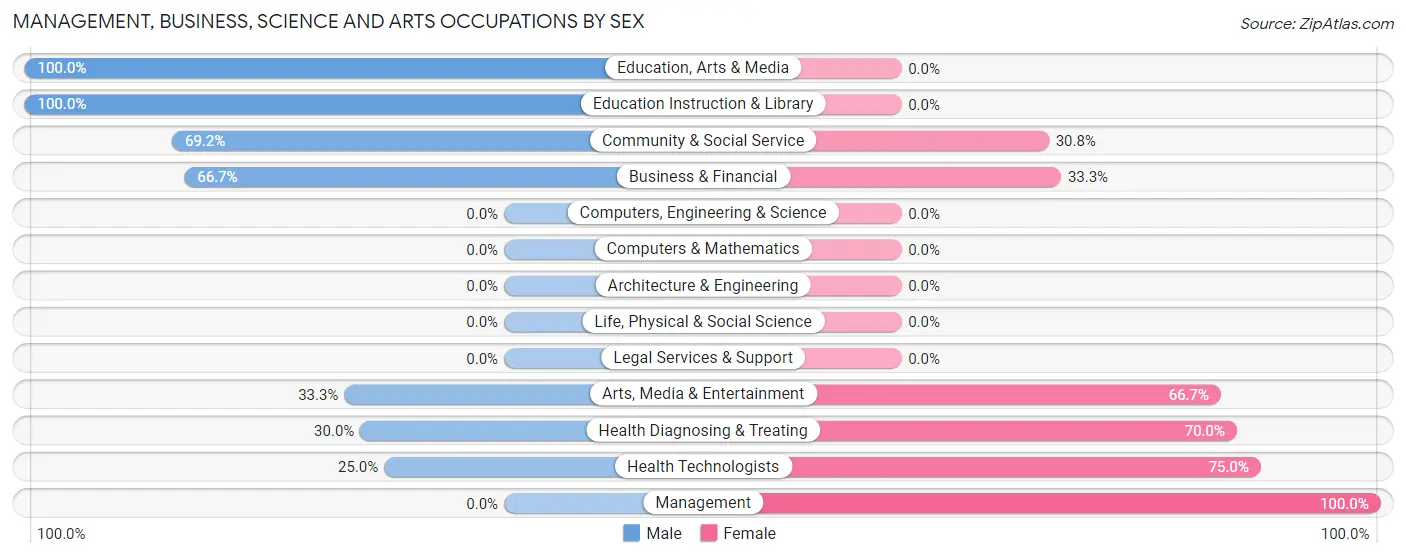
Management, Business, Science and Arts Occupations by Sex
Within the Management, Business, Science and Arts occupations in Mize, the most male-oriented occupations are Education, Arts & Media (100.0%), Education Instruction & Library (100.0%), and Community & Social Service (69.2%), while the most female-oriented occupations are Management (100.0%), Health Technologists (75.0%), and Health Diagnosing & Treating (70.0%).
| Occupation | Male | Female |
| Management | 0 (0.0%) | 1 (100.0%) |
| Business & Financial | 6 (66.7%) | 3 (33.3%) |
| Computers, Engineering & Science | 0 (0.0%) | 0 (0.0%) |
| Computers & Mathematics | 0 (0.0%) | 0 (0.0%) |
| Architecture & Engineering | 0 (0.0%) | 0 (0.0%) |
| Life, Physical & Social Science | 0 (0.0%) | 0 (0.0%) |
| Community & Social Service | 9 (69.2%) | 4 (30.8%) |
| Education, Arts & Media | 1 (100.0%) | 0 (0.0%) |
| Legal Services & Support | 0 (0.0%) | 0 (0.0%) |
| Education Instruction & Library | 6 (100.0%) | 0 (0.0%) |
| Arts, Media & Entertainment | 2 (33.3%) | 4 (66.7%) |
| Health Diagnosing & Treating | 6 (30.0%) | 14 (70.0%) |
| Health Technologists | 4 (25.0%) | 12 (75.0%) |
| Total (Category) | 21 (48.8%) | 22 (51.2%) |
| Total (Overall) | 58 (56.3%) | 45 (43.7%) |
Services Occupations
Services Occupations by Sex
| Occupation | Male | Female |
| Healthcare Support | 0 (0.0%) | 0 (0.0%) |
| Security & Protection | 0 (0.0%) | 0 (0.0%) |
| Firefighting & Prevention | 0 (0.0%) | 0 (0.0%) |
| Law Enforcement | 0 (0.0%) | 0 (0.0%) |
| Food Preparation & Serving | 0 (0.0%) | 0 (0.0%) |
| Cleaning & Maintenance | 0 (0.0%) | 0 (0.0%) |
| Personal Care & Service | 0 (0.0%) | 0 (0.0%) |
| Total (Category) | 0 (0.0%) | 0 (0.0%) |
| Total (Overall) | 58 (56.3%) | 45 (43.7%) |
Sales and Office Occupations
The most common Sales and Office occupations in Mize are Office & Administration (10 | 9.7%), and Sales & Related (7 | 6.8%).
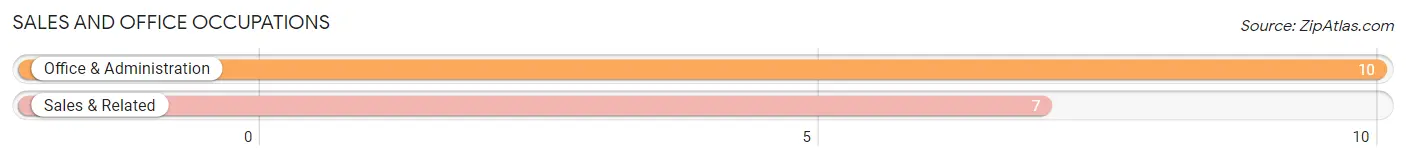
Sales and Office Occupations by Sex

| Occupation | Male | Female |
| Sales & Related | 3 (42.9%) | 4 (57.1%) |
| Office & Administration | 0 (0.0%) | 10 (100.0%) |
| Total (Category) | 3 (17.6%) | 14 (82.4%) |
| Total (Overall) | 58 (56.3%) | 45 (43.7%) |
Natural Resources, Construction and Maintenance Occupations
The most common Natural Resources, Construction and Maintenance occupations in Mize are Construction & Extraction (9 | 8.7%), and Installation, Maintenance & Repair (6 | 5.8%).
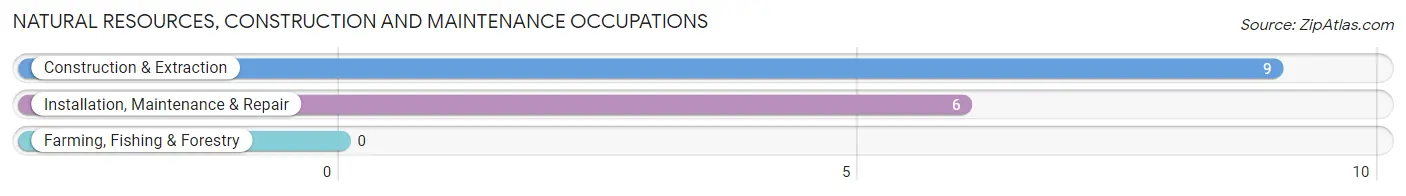
Natural Resources, Construction and Maintenance Occupations by Sex
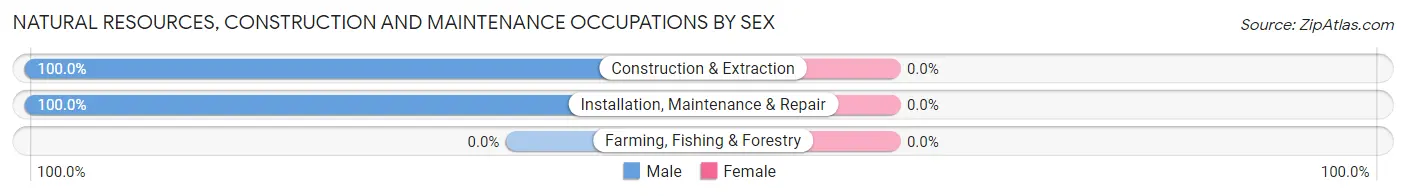
| Occupation | Male | Female |
| Farming, Fishing & Forestry | 0 (0.0%) | 0 (0.0%) |
| Construction & Extraction | 9 (100.0%) | 0 (0.0%) |
| Installation, Maintenance & Repair | 6 (100.0%) | 0 (0.0%) |
| Total (Category) | 15 (100.0%) | 0 (0.0%) |
| Total (Overall) | 58 (56.3%) | 45 (43.7%) |
Production, Transportation and Moving Occupations
The most common Production, Transportation and Moving occupations in Mize are Transportation (20 | 19.4%), Production (7 | 6.8%), and Material Moving (1 | 1.0%).
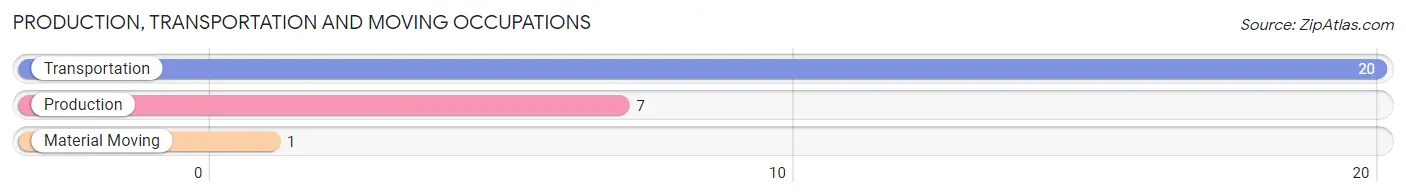
Production, Transportation and Moving Occupations by Sex
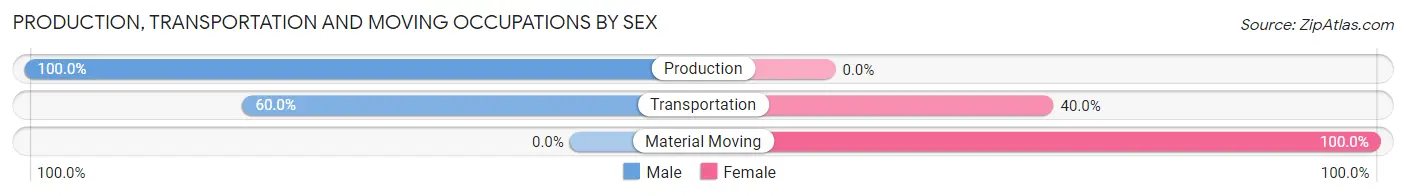
| Occupation | Male | Female |
| Production | 7 (100.0%) | 0 (0.0%) |
| Transportation | 12 (60.0%) | 8 (40.0%) |
| Material Moving | 0 (0.0%) | 1 (100.0%) |
| Total (Category) | 19 (67.9%) | 9 (32.1%) |
| Total (Overall) | 58 (56.3%) | 45 (43.7%) |
Employment Industries by Sex in Mize
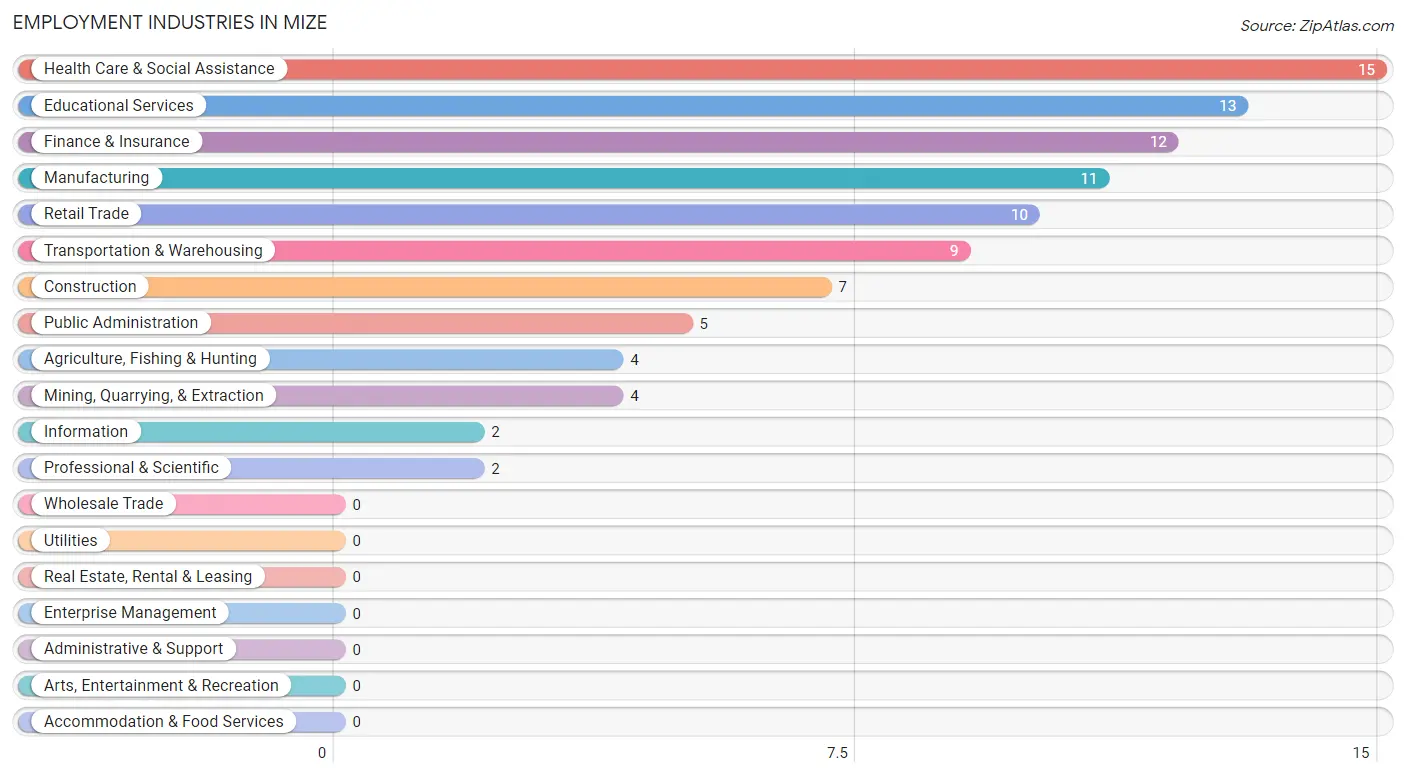
Employment Industries in Mize
The major employment industries in Mize include Health Care & Social Assistance (15 | 14.6%), Educational Services (13 | 12.6%), Finance & Insurance (12 | 11.7%), Manufacturing (11 | 10.7%), and Retail Trade (10 | 9.7%).
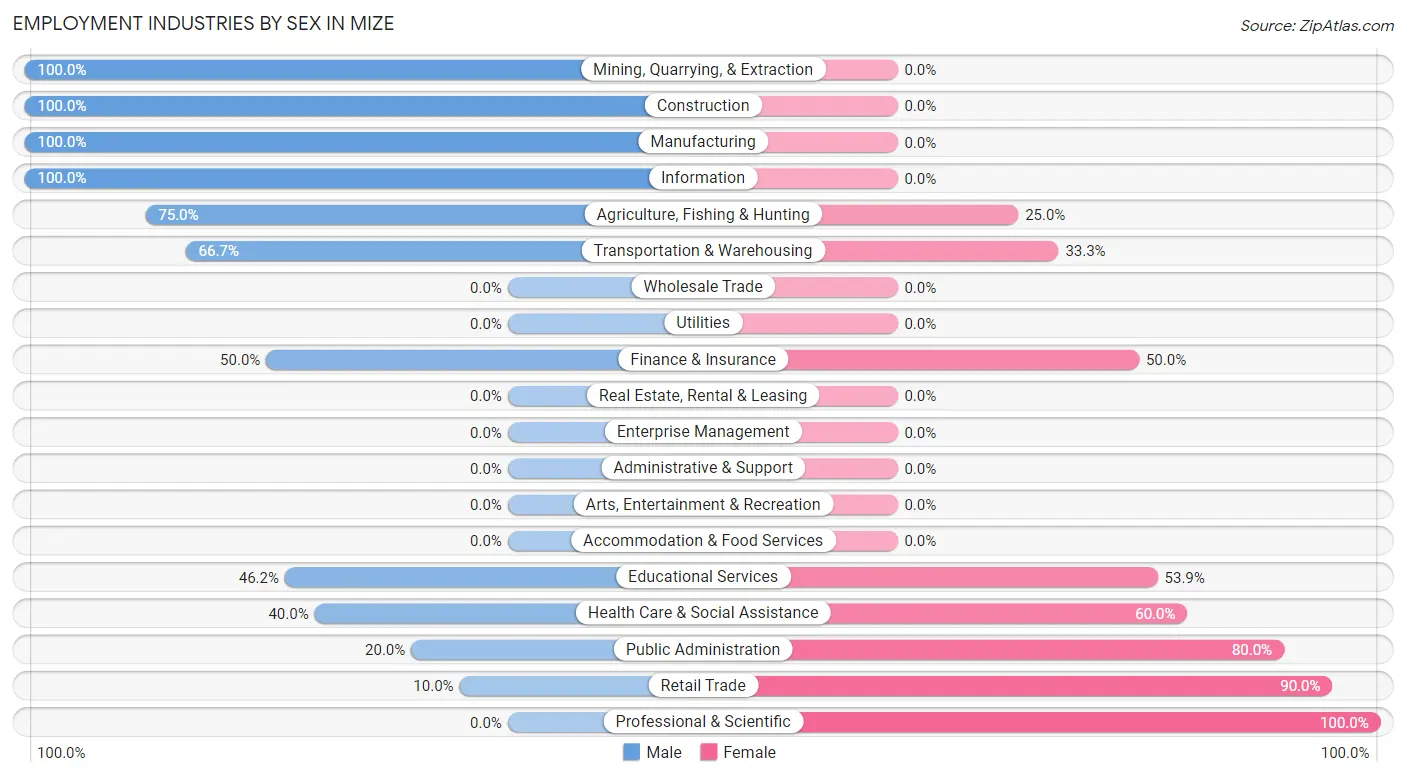
Employment Industries by Sex in Mize
The Mize industries that see more men than women are Mining, Quarrying, & Extraction (100.0%), Construction (100.0%), and Manufacturing (100.0%), whereas the industries that tend to have a higher number of women are Professional & Scientific (100.0%), Retail Trade (90.0%), and Public Administration (80.0%).
| Industry | Male | Female |
| Agriculture, Fishing & Hunting | 3 (75.0%) | 1 (25.0%) |
| Mining, Quarrying, & Extraction | 4 (100.0%) | 0 (0.0%) |
| Construction | 7 (100.0%) | 0 (0.0%) |
| Manufacturing | 11 (100.0%) | 0 (0.0%) |
| Wholesale Trade | 0 (0.0%) | 0 (0.0%) |
| Retail Trade | 1 (10.0%) | 9 (90.0%) |
| Transportation & Warehousing | 6 (66.7%) | 3 (33.3%) |
| Utilities | 0 (0.0%) | 0 (0.0%) |
| Information | 2 (100.0%) | 0 (0.0%) |
| Finance & Insurance | 6 (50.0%) | 6 (50.0%) |
| Real Estate, Rental & Leasing | 0 (0.0%) | 0 (0.0%) |
| Professional & Scientific | 0 (0.0%) | 2 (100.0%) |
| Enterprise Management | 0 (0.0%) | 0 (0.0%) |
| Administrative & Support | 0 (0.0%) | 0 (0.0%) |
| Educational Services | 6 (46.2%) | 7 (53.8%) |
| Health Care & Social Assistance | 6 (40.0%) | 9 (60.0%) |
| Arts, Entertainment & Recreation | 0 (0.0%) | 0 (0.0%) |
| Accommodation & Food Services | 0 (0.0%) | 0 (0.0%) |
| Public Administration | 1 (20.0%) | 4 (80.0%) |
| Total | 58 (56.3%) | 45 (43.7%) |
Education in Mize
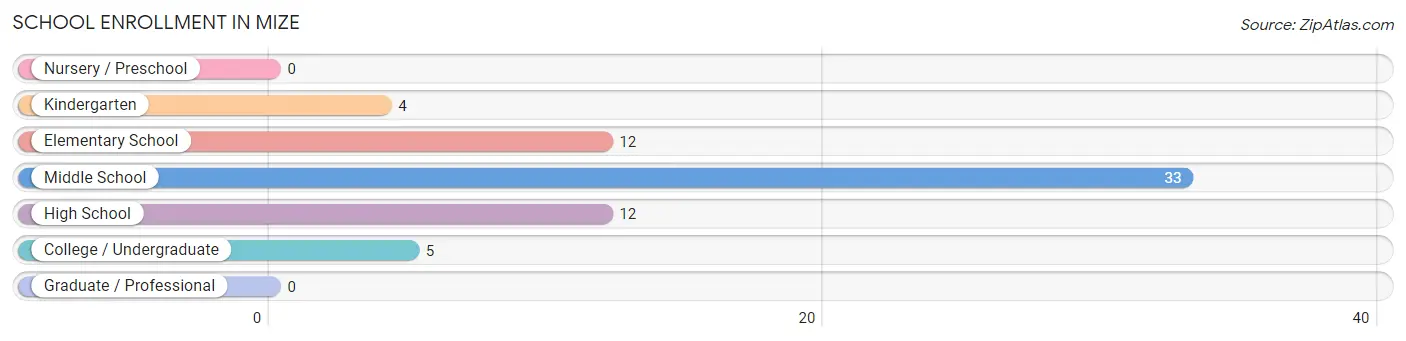
School Enrollment in Mize
The most common levels of schooling among the 66 students in Mize are middle school (33 | 50.0%), elementary school (12 | 18.2%), and high school (12 | 18.2%).
| School Level | # Students | % Students |
| Nursery / Preschool | 0 | 0.0% |
| Kindergarten | 4 | 6.1% |
| Elementary School | 12 | 18.2% |
| Middle School | 33 | 50.0% |
| High School | 12 | 18.2% |
| College / Undergraduate | 5 | 7.6% |
| Graduate / Professional | 0 | 0.0% |
| Total | 66 | 100.0% |
School Enrollment by Age by Funding Source in Mize
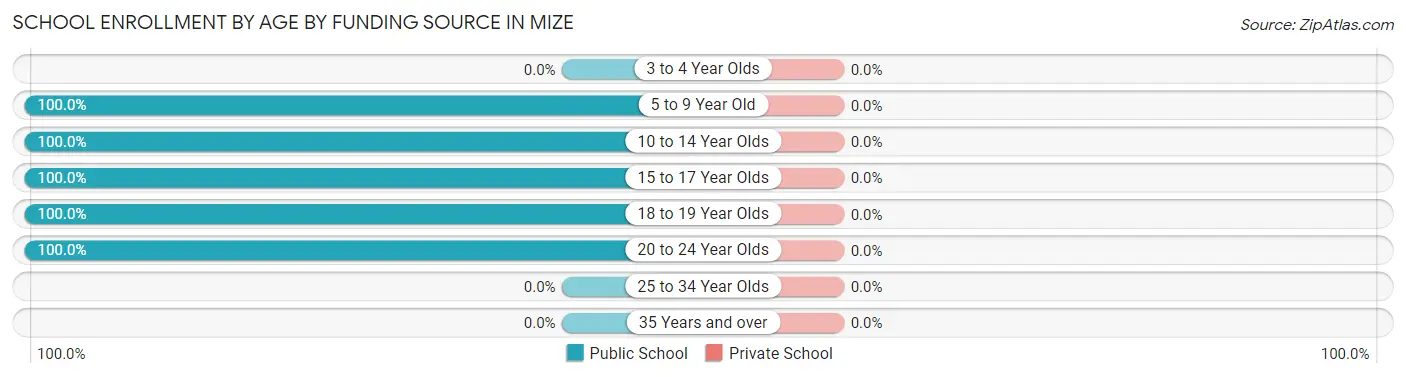
| Age Bracket | Public School | Private School |
| 3 to 4 Year Olds | 0 (0.0%) | 0 (0.0%) |
| 5 to 9 Year Old | 13 (100.0%) | 0 (0.0%) |
| 10 to 14 Year Olds | 39 (100.0%) | 0 (0.0%) |
| 15 to 17 Year Olds | 9 (100.0%) | 0 (0.0%) |
| 18 to 19 Year Olds | 3 (100.0%) | 0 (0.0%) |
| 20 to 24 Year Olds | 2 (100.0%) | 0 (0.0%) |
| 25 to 34 Year Olds | 0 (0.0%) | 0 (0.0%) |
| 35 Years and over | 0 (0.0%) | 0 (0.0%) |
| Total | 66 (100.0%) | 0 (0.0%) |
Educational Attainment by Field of Study in Mize
Science & technology (12 | 37.5%), education (8 | 25.0%), arts & humanities (6 | 18.8%), business (4 | 12.5%), and bio, nature & agricultural (1 | 3.1%) are the most common fields of study among 32 individuals in Mize who have obtained a bachelor's degree or higher.
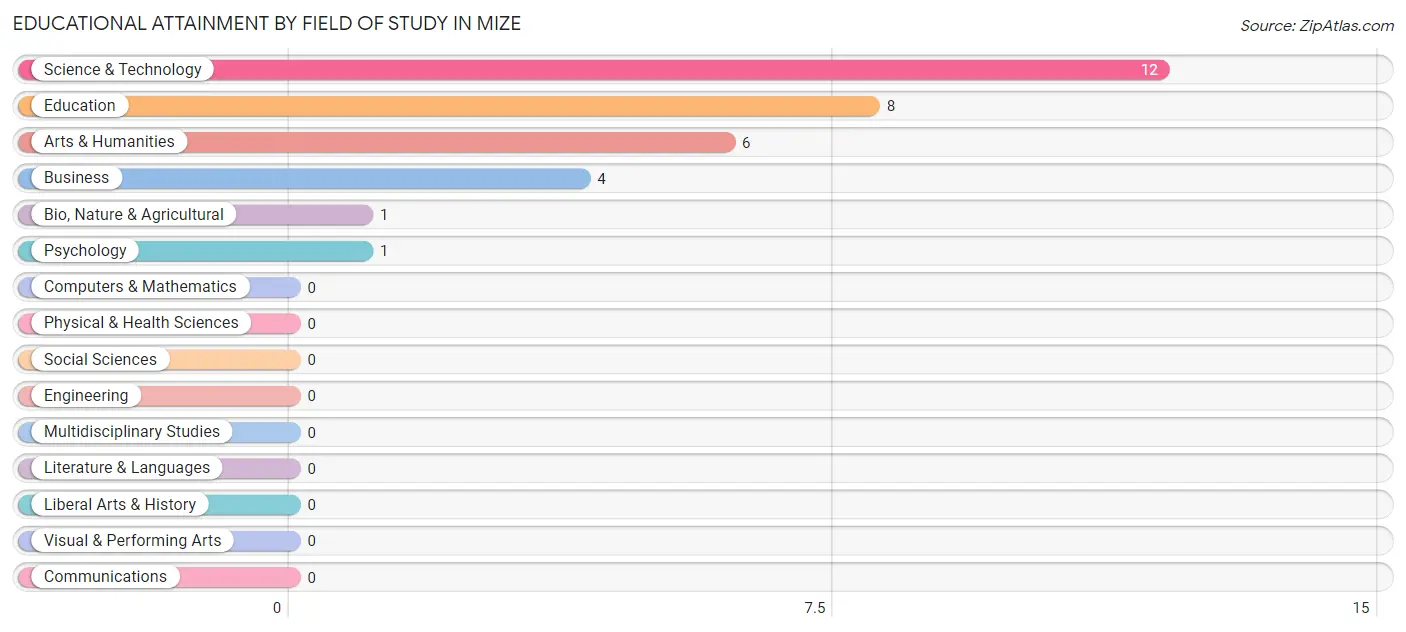
| Field of Study | # Graduates | % Graduates |
| Computers & Mathematics | 0 | 0.0% |
| Bio, Nature & Agricultural | 1 | 3.1% |
| Physical & Health Sciences | 0 | 0.0% |
| Psychology | 1 | 3.1% |
| Social Sciences | 0 | 0.0% |
| Engineering | 0 | 0.0% |
| Multidisciplinary Studies | 0 | 0.0% |
| Science & Technology | 12 | 37.5% |
| Business | 4 | 12.5% |
| Education | 8 | 25.0% |
| Literature & Languages | 0 | 0.0% |
| Liberal Arts & History | 0 | 0.0% |
| Visual & Performing Arts | 0 | 0.0% |
| Communications | 0 | 0.0% |
| Arts & Humanities | 6 | 18.8% |
| Total | 32 | 100.0% |
Transportation & Commute in Mize
Vehicle Availability by Sex in Mize
The most prevalent vehicle ownership categories in Mize are males with 2 vehicles (35, accounting for 62.5%) and females with 2 vehicles (14, making up 77.8%).
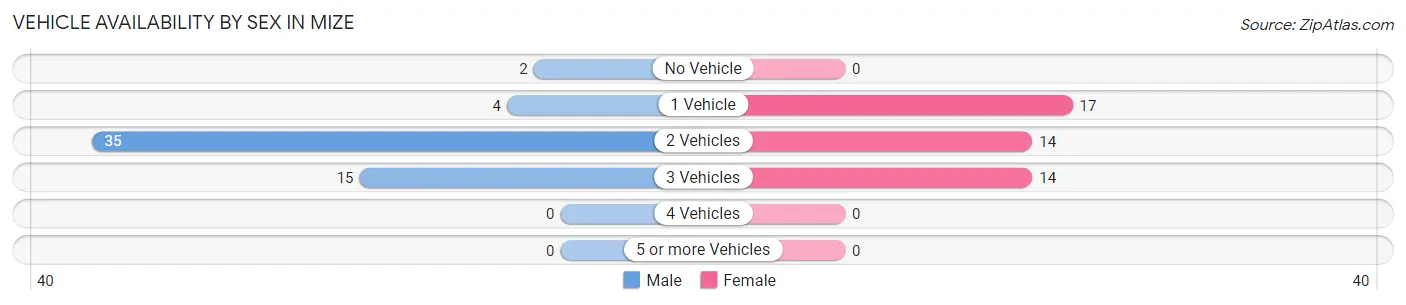
| Vehicles Available | Male | Female |
| No Vehicle | 2 (3.6%) | 0 (0.0%) |
| 1 Vehicle | 4 (7.1%) | 17 (37.8%) |
| 2 Vehicles | 35 (62.5%) | 14 (31.1%) |
| 3 Vehicles | 15 (26.8%) | 14 (31.1%) |
| 4 Vehicles | 0 (0.0%) | 0 (0.0%) |
| 5 or more Vehicles | 0 (0.0%) | 0 (0.0%) |
| Total | 56 (100.0%) | 45 (100.0%) |
Commute Time in Mize
The most frequently occuring commute durations in Mize are 5 to 9 minutes (29 commuters, 28.7%), 60 to 89 minutes (17 commuters, 16.8%), and 20 to 24 minutes (11 commuters, 10.9%).
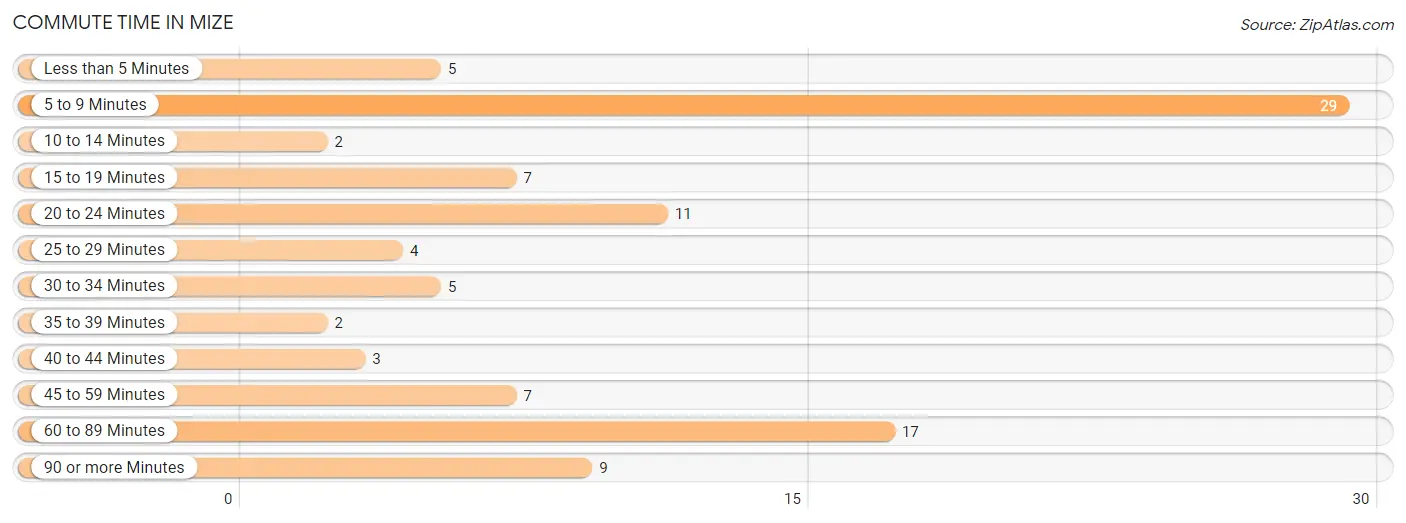
| Commute Time | # Commuters | % Commuters |
| Less than 5 Minutes | 5 | 5.0% |
| 5 to 9 Minutes | 29 | 28.7% |
| 10 to 14 Minutes | 2 | 2.0% |
| 15 to 19 Minutes | 7 | 6.9% |
| 20 to 24 Minutes | 11 | 10.9% |
| 25 to 29 Minutes | 4 | 4.0% |
| 30 to 34 Minutes | 5 | 5.0% |
| 35 to 39 Minutes | 2 | 2.0% |
| 40 to 44 Minutes | 3 | 3.0% |
| 45 to 59 Minutes | 7 | 6.9% |
| 60 to 89 Minutes | 17 | 16.8% |
| 90 or more Minutes | 9 | 8.9% |
Commute Time by Sex in Mize
The most common commute times in Mize are 5 to 9 minutes (16 commuters, 28.6%) for males and 5 to 9 minutes (13 commuters, 28.9%) for females.
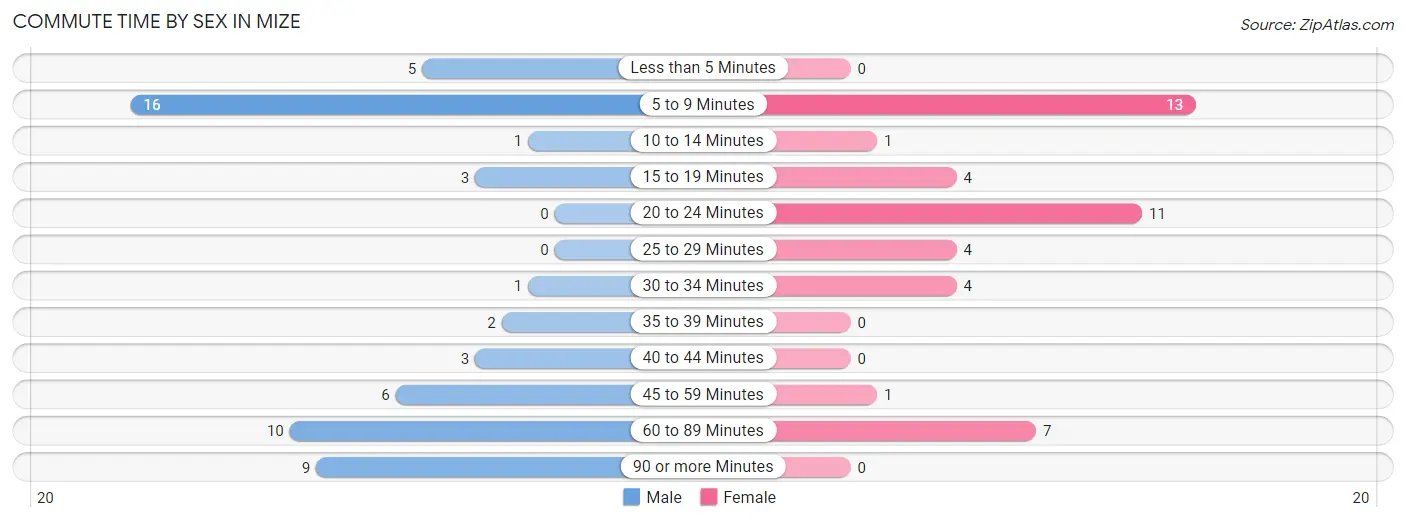
| Commute Time | Male | Female |
| Less than 5 Minutes | 5 (8.9%) | 0 (0.0%) |
| 5 to 9 Minutes | 16 (28.6%) | 13 (28.9%) |
| 10 to 14 Minutes | 1 (1.8%) | 1 (2.2%) |
| 15 to 19 Minutes | 3 (5.4%) | 4 (8.9%) |
| 20 to 24 Minutes | 0 (0.0%) | 11 (24.4%) |
| 25 to 29 Minutes | 0 (0.0%) | 4 (8.9%) |
| 30 to 34 Minutes | 1 (1.8%) | 4 (8.9%) |
| 35 to 39 Minutes | 2 (3.6%) | 0 (0.0%) |
| 40 to 44 Minutes | 3 (5.4%) | 0 (0.0%) |
| 45 to 59 Minutes | 6 (10.7%) | 1 (2.2%) |
| 60 to 89 Minutes | 10 (17.9%) | 7 (15.6%) |
| 90 or more Minutes | 9 (16.1%) | 0 (0.0%) |
Time of Departure to Work by Sex in Mize
The most frequent times of departure to work in Mize are 6:00 AM to 6:29 AM (14, 25.0%) for males and 7:00 AM to 7:29 AM (19, 42.2%) for females.
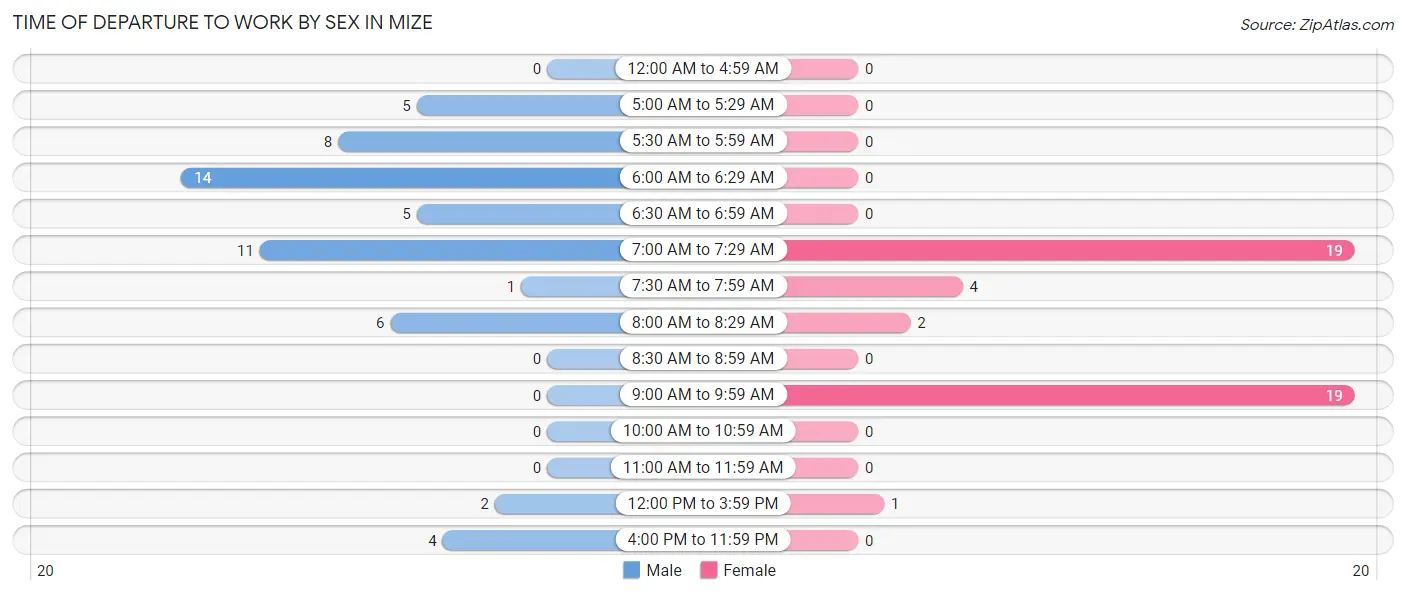
| Time of Departure | Male | Female |
| 12:00 AM to 4:59 AM | 0 (0.0%) | 0 (0.0%) |
| 5:00 AM to 5:29 AM | 5 (8.9%) | 0 (0.0%) |
| 5:30 AM to 5:59 AM | 8 (14.3%) | 0 (0.0%) |
| 6:00 AM to 6:29 AM | 14 (25.0%) | 0 (0.0%) |
| 6:30 AM to 6:59 AM | 5 (8.9%) | 0 (0.0%) |
| 7:00 AM to 7:29 AM | 11 (19.6%) | 19 (42.2%) |
| 7:30 AM to 7:59 AM | 1 (1.8%) | 4 (8.9%) |
| 8:00 AM to 8:29 AM | 6 (10.7%) | 2 (4.4%) |
| 8:30 AM to 8:59 AM | 0 (0.0%) | 0 (0.0%) |
| 9:00 AM to 9:59 AM | 0 (0.0%) | 19 (42.2%) |
| 10:00 AM to 10:59 AM | 0 (0.0%) | 0 (0.0%) |
| 11:00 AM to 11:59 AM | 0 (0.0%) | 0 (0.0%) |
| 12:00 PM to 3:59 PM | 2 (3.6%) | 1 (2.2%) |
| 4:00 PM to 11:59 PM | 4 (7.1%) | 0 (0.0%) |
| Total | 56 (100.0%) | 45 (100.0%) |
Housing Occupancy in Mize
Occupancy by Ownership in Mize
Of the total 132 dwellings in Mize, owner-occupied units account for 112 (84.9%), while renter-occupied units make up 20 (15.1%).
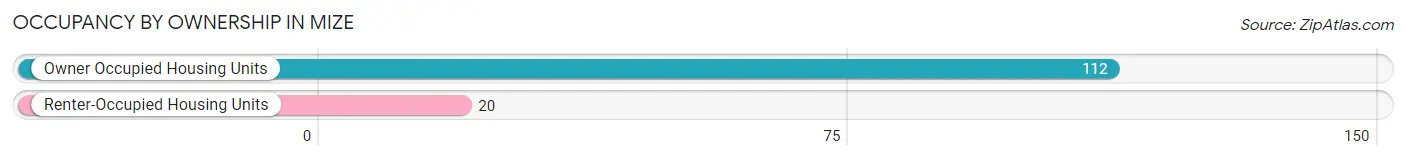
| Occupancy | # Housing Units | % Housing Units |
| Owner Occupied Housing Units | 112 | 84.9% |
| Renter-Occupied Housing Units | 20 | 15.1% |
| Total Occupied Housing Units | 132 | 100.0% |
Occupancy by Household Size in Mize
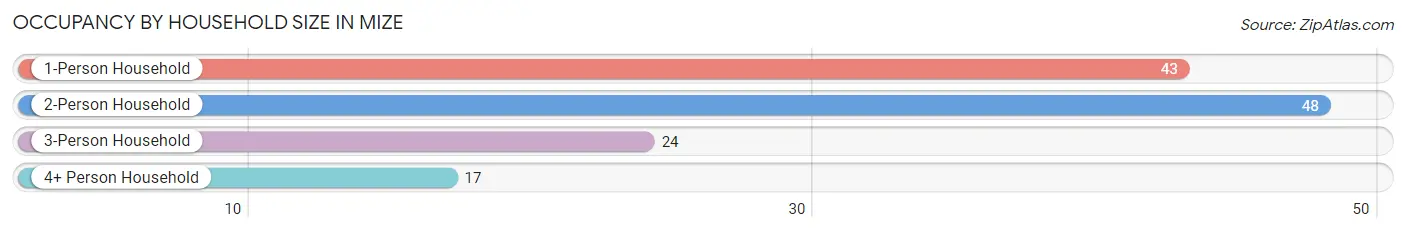
| Household Size | # Housing Units | % Housing Units |
| 1-Person Household | 43 | 32.6% |
| 2-Person Household | 48 | 36.4% |
| 3-Person Household | 24 | 18.2% |
| 4+ Person Household | 17 | 12.9% |
| Total Housing Units | 132 | 100.0% |
Occupancy by Ownership by Household Size in Mize
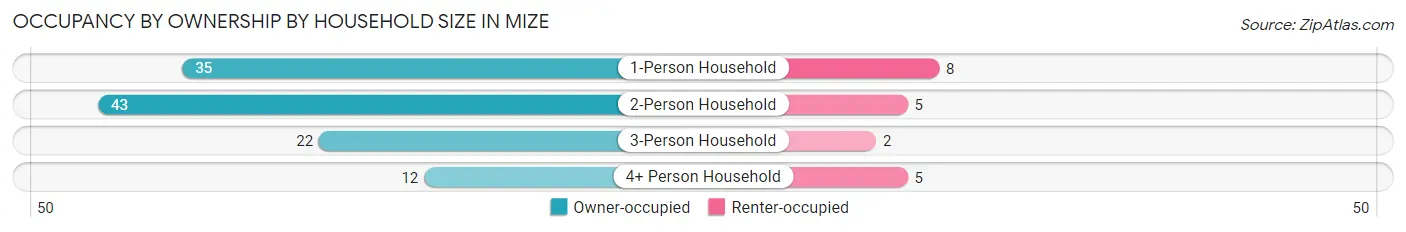
| Household Size | Owner-occupied | Renter-occupied |
| 1-Person Household | 35 (81.4%) | 8 (18.6%) |
| 2-Person Household | 43 (89.6%) | 5 (10.4%) |
| 3-Person Household | 22 (91.7%) | 2 (8.3%) |
| 4+ Person Household | 12 (70.6%) | 5 (29.4%) |
| Total Housing Units | 112 (84.9%) | 20 (15.1%) |
Occupancy by Educational Attainment in Mize
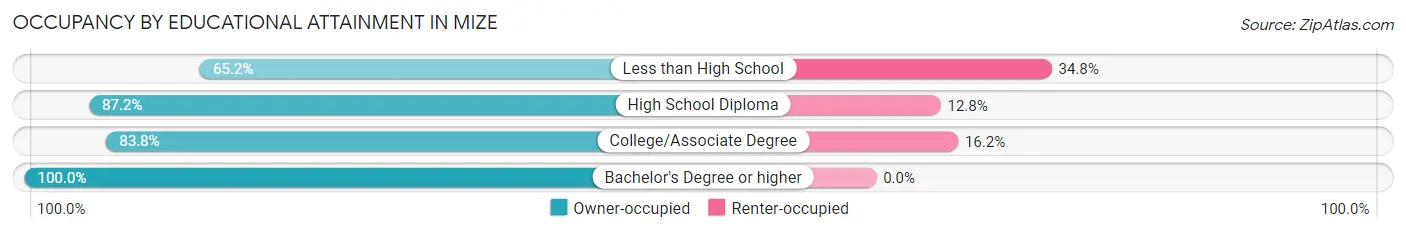
| Household Size | Owner-occupied | Renter-occupied |
| Less than High School | 15 (65.2%) | 8 (34.8%) |
| High School Diploma | 41 (87.2%) | 6 (12.8%) |
| College/Associate Degree | 31 (83.8%) | 6 (16.2%) |
| Bachelor's Degree or higher | 25 (100.0%) | 0 (0.0%) |
Occupancy by Age of Householder in Mize
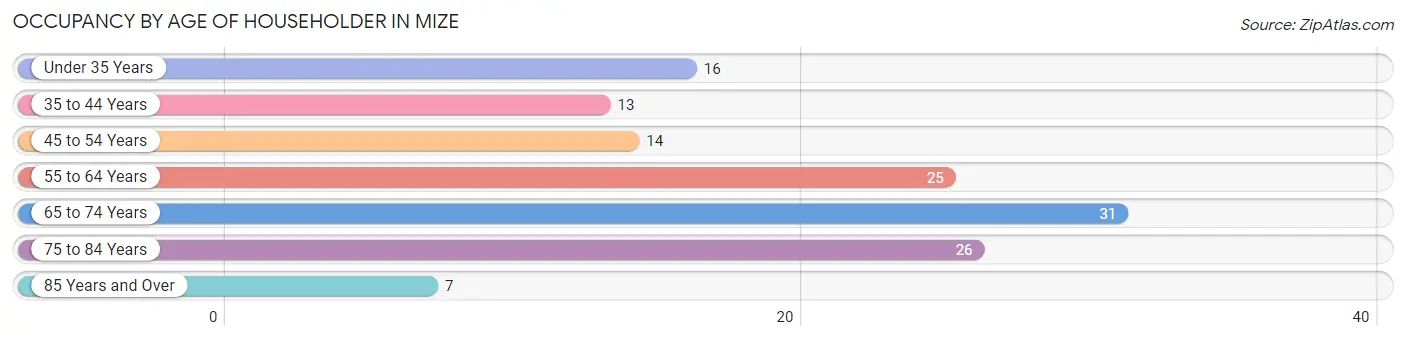
| Age Bracket | # Households | % Households |
| Under 35 Years | 16 | 12.1% |
| 35 to 44 Years | 13 | 9.9% |
| 45 to 54 Years | 14 | 10.6% |
| 55 to 64 Years | 25 | 18.9% |
| 65 to 74 Years | 31 | 23.5% |
| 75 to 84 Years | 26 | 19.7% |
| 85 Years and Over | 7 | 5.3% |
| Total | 132 | 100.0% |
Housing Finances in Mize
Median Income by Occupancy in Mize
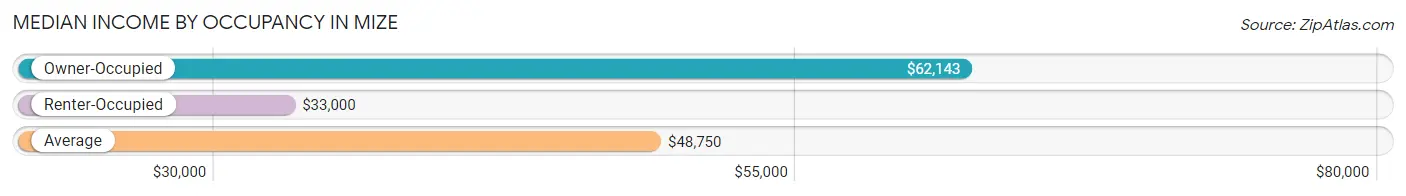
| Occupancy Type | # Households | Median Income |
| Owner-Occupied | 112 (84.9%) | $62,143 |
| Renter-Occupied | 20 (15.1%) | $33,000 |
| Average | 132 (100.0%) | $48,750 |
Occupancy by Householder Income Bracket in Mize
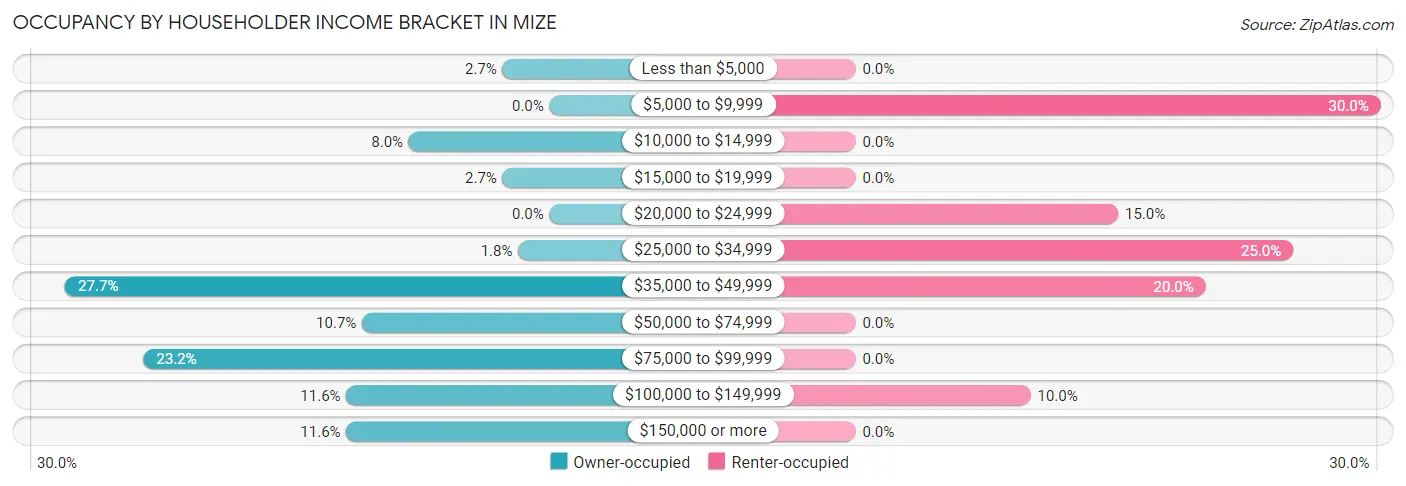
| Income Bracket | Owner-occupied | Renter-occupied |
| Less than $5,000 | 3 (2.7%) | 0 (0.0%) |
| $5,000 to $9,999 | 0 (0.0%) | 6 (30.0%) |
| $10,000 to $14,999 | 9 (8.0%) | 0 (0.0%) |
| $15,000 to $19,999 | 3 (2.7%) | 0 (0.0%) |
| $20,000 to $24,999 | 0 (0.0%) | 3 (15.0%) |
| $25,000 to $34,999 | 2 (1.8%) | 5 (25.0%) |
| $35,000 to $49,999 | 31 (27.7%) | 4 (20.0%) |
| $50,000 to $74,999 | 12 (10.7%) | 0 (0.0%) |
| $75,000 to $99,999 | 26 (23.2%) | 0 (0.0%) |
| $100,000 to $149,999 | 13 (11.6%) | 2 (10.0%) |
| $150,000 or more | 13 (11.6%) | 0 (0.0%) |
| Total | 112 (100.0%) | 20 (100.0%) |
Monthly Housing Cost Tiers in Mize
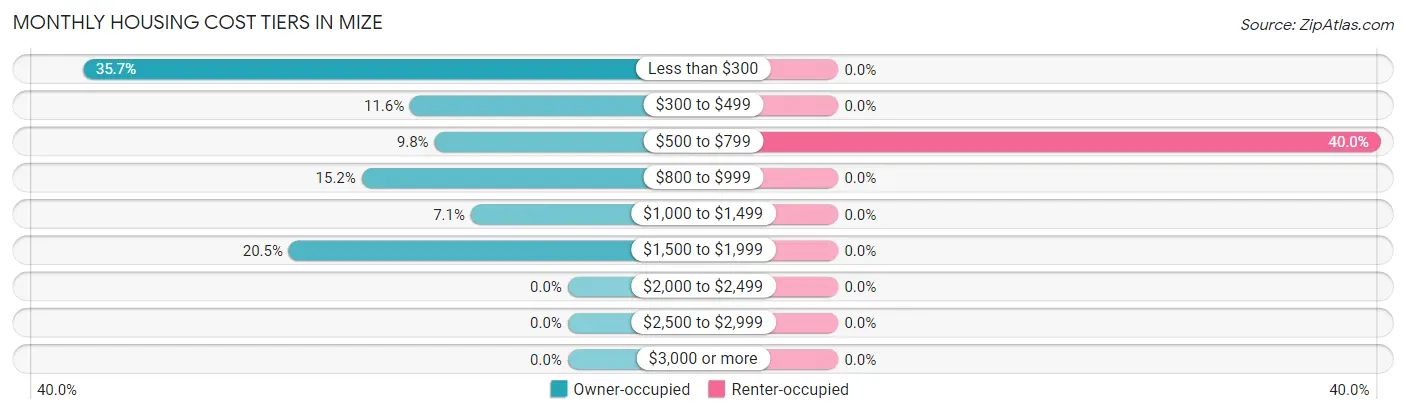
| Monthly Cost | Owner-occupied | Renter-occupied |
| Less than $300 | 40 (35.7%) | 0 (0.0%) |
| $300 to $499 | 13 (11.6%) | 0 (0.0%) |
| $500 to $799 | 11 (9.8%) | 8 (40.0%) |
| $800 to $999 | 17 (15.2%) | 0 (0.0%) |
| $1,000 to $1,499 | 8 (7.1%) | 0 (0.0%) |
| $1,500 to $1,999 | 23 (20.5%) | 0 (0.0%) |
| $2,000 to $2,499 | 0 (0.0%) | 0 (0.0%) |
| $2,500 to $2,999 | 0 (0.0%) | 0 (0.0%) |
| $3,000 or more | 0 (0.0%) | 0 (0.0%) |
| Total | 112 (100.0%) | 20 (100.0%) |
Physical Housing Characteristics in Mize
Housing Structures in Mize
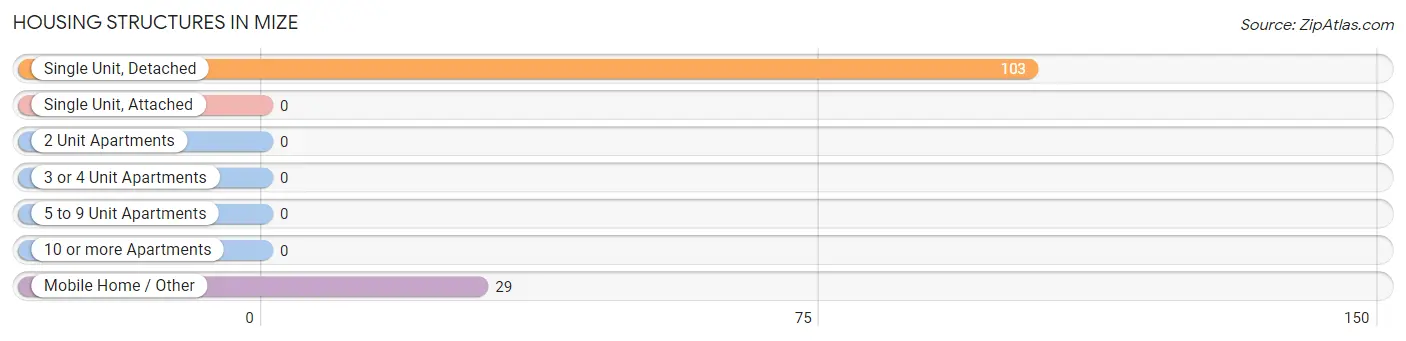
| Structure Type | # Housing Units | % Housing Units |
| Single Unit, Detached | 103 | 78.0% |
| Single Unit, Attached | 0 | 0.0% |
| 2 Unit Apartments | 0 | 0.0% |
| 3 or 4 Unit Apartments | 0 | 0.0% |
| 5 to 9 Unit Apartments | 0 | 0.0% |
| 10 or more Apartments | 0 | 0.0% |
| Mobile Home / Other | 29 | 22.0% |
| Total | 132 | 100.0% |
Housing Structures by Occupancy in Mize
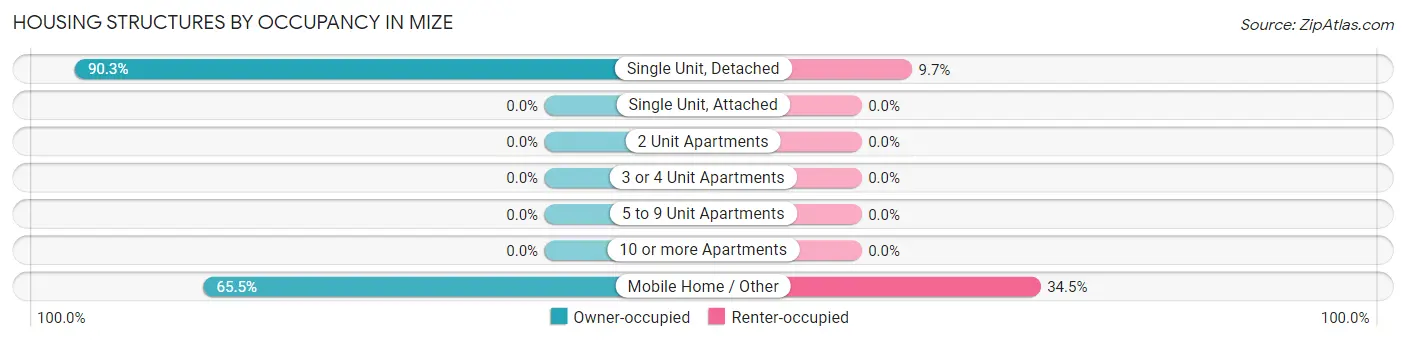
| Structure Type | Owner-occupied | Renter-occupied |
| Single Unit, Detached | 93 (90.3%) | 10 (9.7%) |
| Single Unit, Attached | 0 (0.0%) | 0 (0.0%) |
| 2 Unit Apartments | 0 (0.0%) | 0 (0.0%) |
| 3 or 4 Unit Apartments | 0 (0.0%) | 0 (0.0%) |
| 5 to 9 Unit Apartments | 0 (0.0%) | 0 (0.0%) |
| 10 or more Apartments | 0 (0.0%) | 0 (0.0%) |
| Mobile Home / Other | 19 (65.5%) | 10 (34.5%) |
| Total | 112 (84.9%) | 20 (15.1%) |
Housing Structures by Number of Rooms in Mize
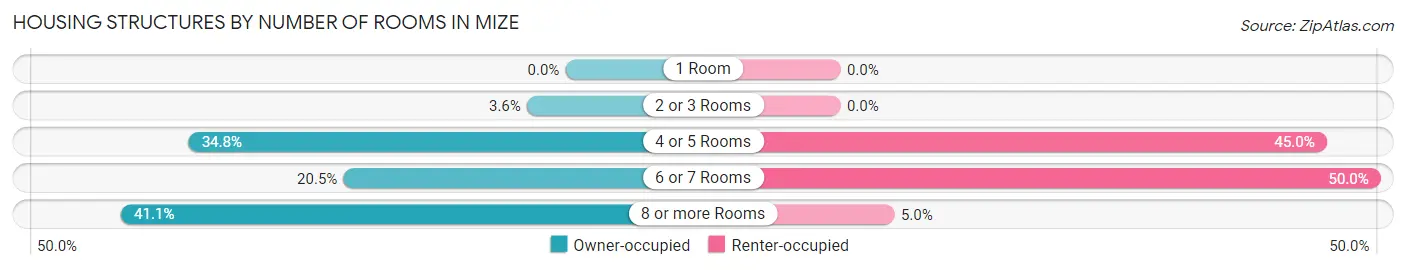
| Number of Rooms | Owner-occupied | Renter-occupied |
| 1 Room | 0 (0.0%) | 0 (0.0%) |
| 2 or 3 Rooms | 4 (3.6%) | 0 (0.0%) |
| 4 or 5 Rooms | 39 (34.8%) | 9 (45.0%) |
| 6 or 7 Rooms | 23 (20.5%) | 10 (50.0%) |
| 8 or more Rooms | 46 (41.1%) | 1 (5.0%) |
| Total | 112 (100.0%) | 20 (100.0%) |
Housing Structure by Heating Type in Mize
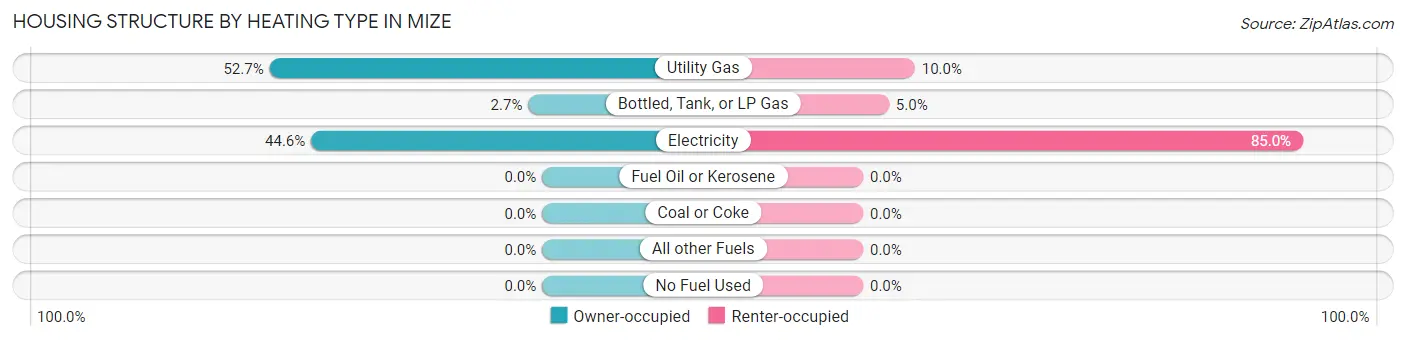
| Heating Type | Owner-occupied | Renter-occupied |
| Utility Gas | 59 (52.7%) | 2 (10.0%) |
| Bottled, Tank, or LP Gas | 3 (2.7%) | 1 (5.0%) |
| Electricity | 50 (44.6%) | 17 (85.0%) |
| Fuel Oil or Kerosene | 0 (0.0%) | 0 (0.0%) |
| Coal or Coke | 0 (0.0%) | 0 (0.0%) |
| All other Fuels | 0 (0.0%) | 0 (0.0%) |
| No Fuel Used | 0 (0.0%) | 0 (0.0%) |
| Total | 112 (100.0%) | 20 (100.0%) |
Household Vehicle Usage in Mize
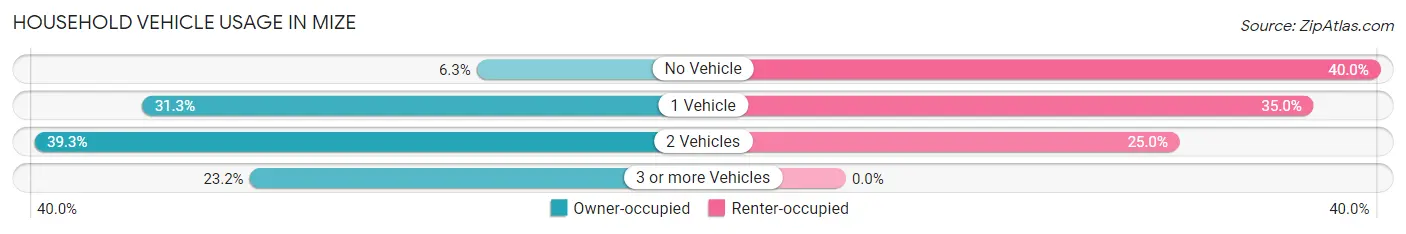
| Vehicles per Household | Owner-occupied | Renter-occupied |
| No Vehicle | 7 (6.2%) | 8 (40.0%) |
| 1 Vehicle | 35 (31.2%) | 7 (35.0%) |
| 2 Vehicles | 44 (39.3%) | 5 (25.0%) |
| 3 or more Vehicles | 26 (23.2%) | 0 (0.0%) |
| Total | 112 (100.0%) | 20 (100.0%) |
Real Estate & Mortgages in Mize
Real Estate and Mortgage Overview in Mize
| Characteristic | Without Mortgage | With Mortgage |
| Housing Units | 61 | 51 |
| Median Property Value | $107,000 | $144,100 |
| Median Household Income | $41,563 | $11 |
| Monthly Housing Costs | $277 | $0 |
| Real Estate Taxes | $810 | $11 |
Property Value by Mortgage Status in Mize
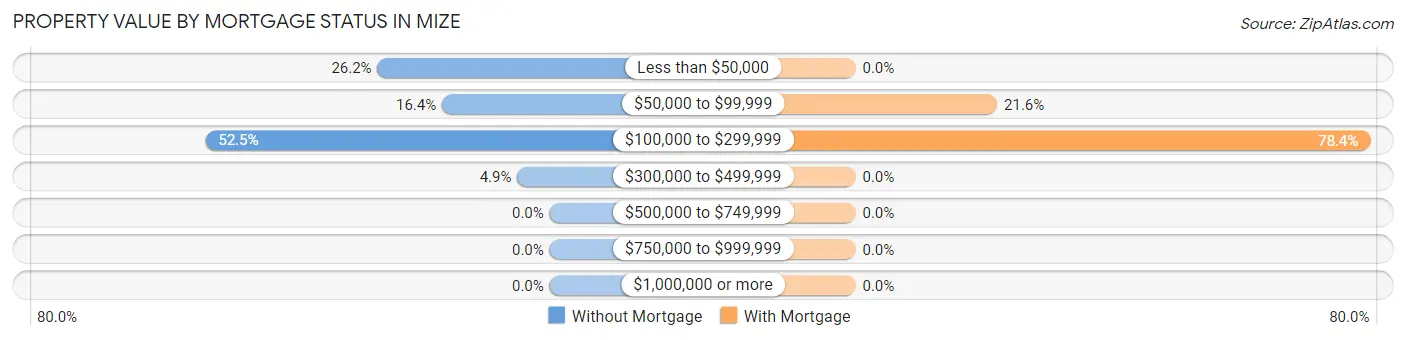
| Property Value | Without Mortgage | With Mortgage |
| Less than $50,000 | 16 (26.2%) | 0 (0.0%) |
| $50,000 to $99,999 | 10 (16.4%) | 11 (21.6%) |
| $100,000 to $299,999 | 32 (52.5%) | 40 (78.4%) |
| $300,000 to $499,999 | 3 (4.9%) | 0 (0.0%) |
| $500,000 to $749,999 | 0 (0.0%) | 0 (0.0%) |
| $750,000 to $999,999 | 0 (0.0%) | 0 (0.0%) |
| $1,000,000 or more | 0 (0.0%) | 0 (0.0%) |
| Total | 61 (100.0%) | 51 (100.0%) |
Household Income by Mortgage Status in Mize
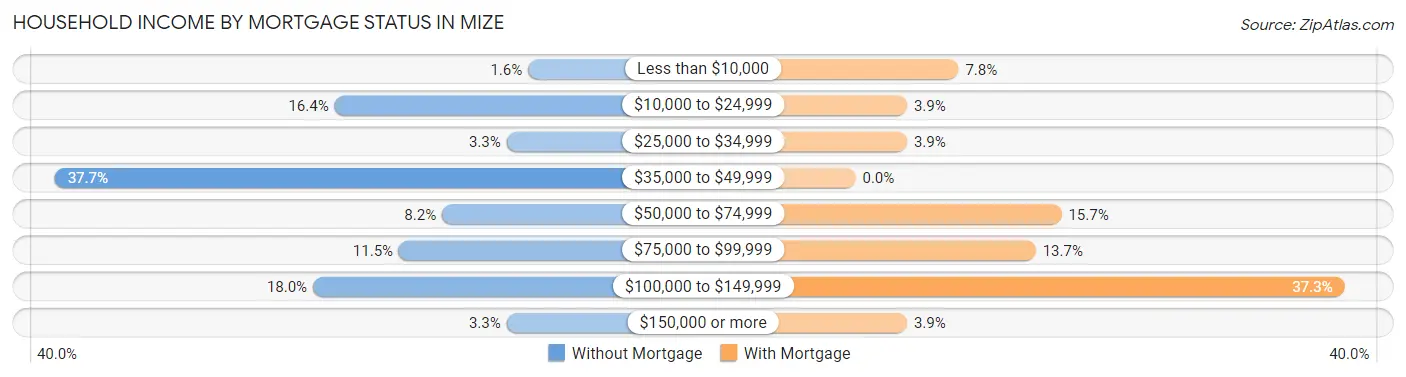
| Household Income | Without Mortgage | With Mortgage |
| Less than $10,000 | 1 (1.6%) | 4 (7.8%) |
| $10,000 to $24,999 | 10 (16.4%) | 2 (3.9%) |
| $25,000 to $34,999 | 2 (3.3%) | 2 (3.9%) |
| $35,000 to $49,999 | 23 (37.7%) | 0 (0.0%) |
| $50,000 to $74,999 | 5 (8.2%) | 8 (15.7%) |
| $75,000 to $99,999 | 7 (11.5%) | 7 (13.7%) |
| $100,000 to $149,999 | 11 (18.0%) | 19 (37.2%) |
| $150,000 or more | 2 (3.3%) | 2 (3.9%) |
| Total | 61 (100.0%) | 51 (100.0%) |
Property Value to Household Income Ratio in Mize
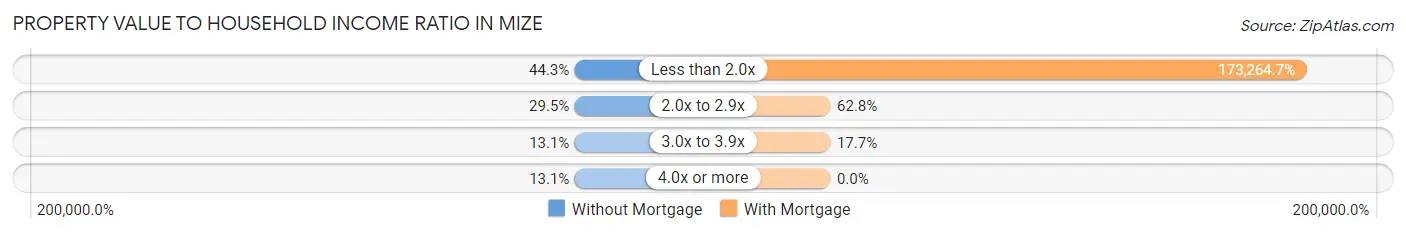
| Value-to-Income Ratio | Without Mortgage | With Mortgage |
| Less than 2.0x | 27 (44.3%) | 88,365 (173,264.7%) |
| 2.0x to 2.9x | 18 (29.5%) | 32 (62.7%) |
| 3.0x to 3.9x | 8 (13.1%) | 9 (17.6%) |
| 4.0x or more | 8 (13.1%) | 0 (0.0%) |
| Total | 61 (100.0%) | 51 (100.0%) |
Real Estate Taxes by Mortgage Status in Mize
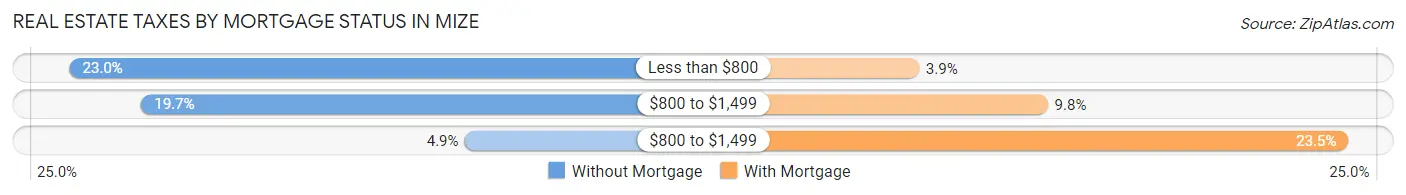
| Property Taxes | Without Mortgage | With Mortgage |
| Less than $800 | 14 (23.0%) | 2 (3.9%) |
| $800 to $1,499 | 12 (19.7%) | 5 (9.8%) |
| $800 to $1,499 | 3 (4.9%) | 12 (23.5%) |
| Total | 61 (100.0%) | 51 (100.0%) |
Health & Disability in Mize
Health Insurance Coverage by Age in Mize
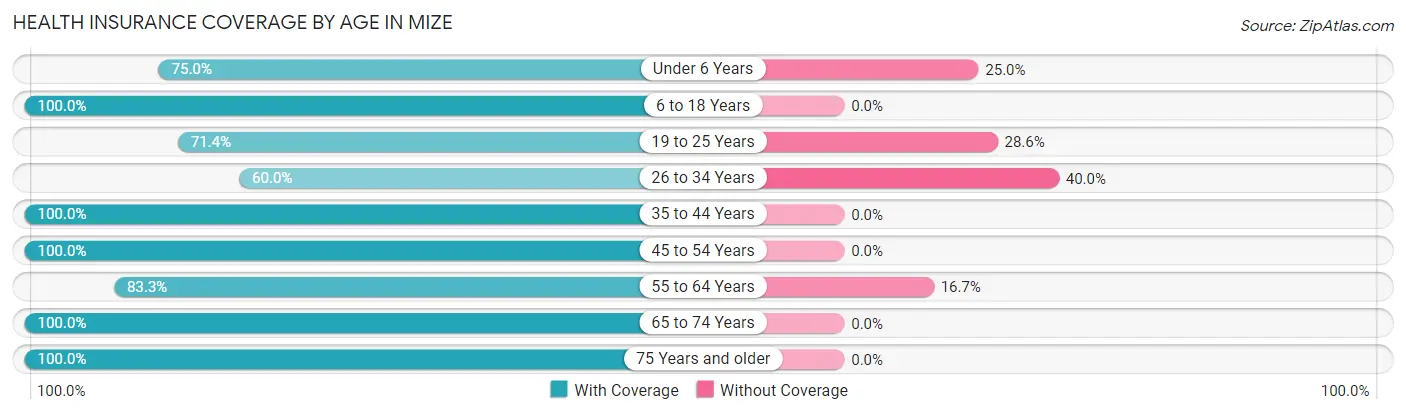
| Age Bracket | With Coverage | Without Coverage |
| Under 6 Years | 12 (75.0%) | 4 (25.0%) |
| 6 to 18 Years | 67 (100.0%) | 0 (0.0%) |
| 19 to 25 Years | 10 (71.4%) | 4 (28.6%) |
| 26 to 34 Years | 12 (60.0%) | 8 (40.0%) |
| 35 to 44 Years | 16 (100.0%) | 0 (0.0%) |
| 45 to 54 Years | 38 (100.0%) | 0 (0.0%) |
| 55 to 64 Years | 45 (83.3%) | 9 (16.7%) |
| 65 to 74 Years | 46 (100.0%) | 0 (0.0%) |
| 75 Years and older | 50 (100.0%) | 0 (0.0%) |
| Total | 296 (92.2%) | 25 (7.8%) |
Health Insurance Coverage by Citizenship Status in Mize
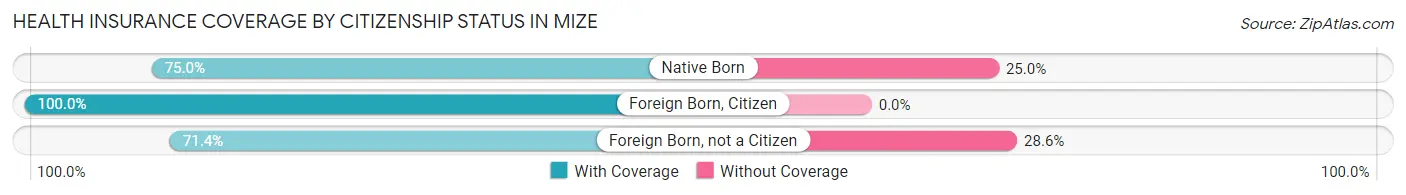
| Citizenship Status | With Coverage | Without Coverage |
| Native Born | 12 (75.0%) | 4 (25.0%) |
| Foreign Born, Citizen | 67 (100.0%) | 0 (0.0%) |
| Foreign Born, not a Citizen | 10 (71.4%) | 4 (28.6%) |
Health Insurance Coverage by Household Income in Mize
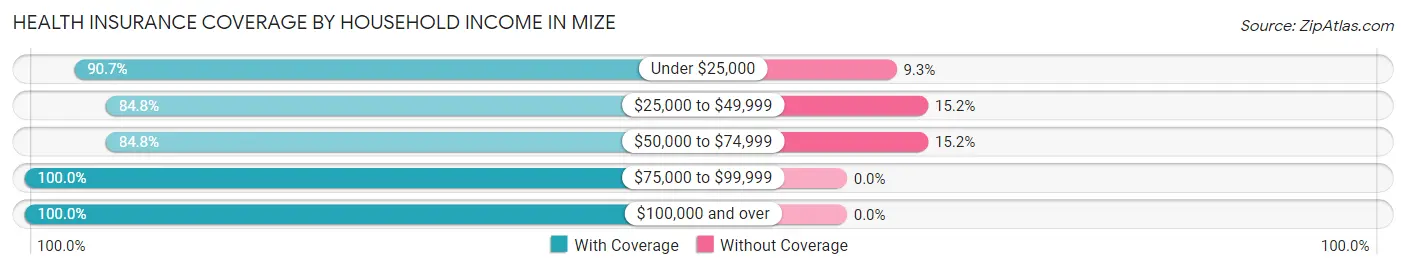
| Household Income | With Coverage | Without Coverage |
| Under $25,000 | 39 (90.7%) | 4 (9.3%) |
| $25,000 to $49,999 | 78 (84.8%) | 14 (15.2%) |
| $50,000 to $74,999 | 39 (84.8%) | 7 (15.2%) |
| $75,000 to $99,999 | 56 (100.0%) | 0 (0.0%) |
| $100,000 and over | 84 (100.0%) | 0 (0.0%) |
Public vs Private Health Insurance Coverage by Age in Mize
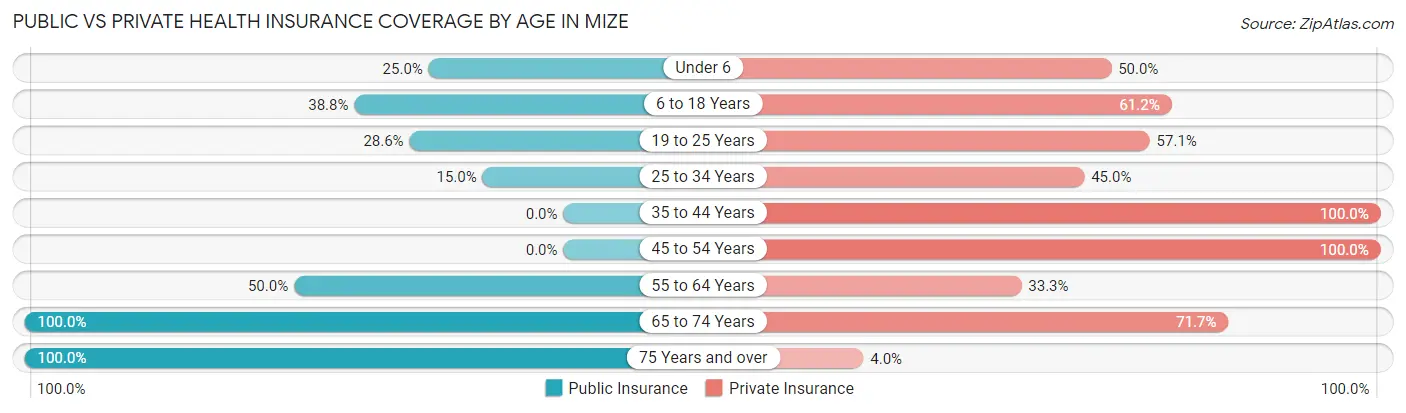
| Age Bracket | Public Insurance | Private Insurance |
| Under 6 | 4 (25.0%) | 8 (50.0%) |
| 6 to 18 Years | 26 (38.8%) | 41 (61.2%) |
| 19 to 25 Years | 4 (28.6%) | 8 (57.1%) |
| 25 to 34 Years | 3 (15.0%) | 9 (45.0%) |
| 35 to 44 Years | 0 (0.0%) | 16 (100.0%) |
| 45 to 54 Years | 0 (0.0%) | 38 (100.0%) |
| 55 to 64 Years | 27 (50.0%) | 18 (33.3%) |
| 65 to 74 Years | 46 (100.0%) | 33 (71.7%) |
| 75 Years and over | 50 (100.0%) | 2 (4.0%) |
| Total | 160 (49.8%) | 173 (53.9%) |
Disability Status by Sex by Age in Mize
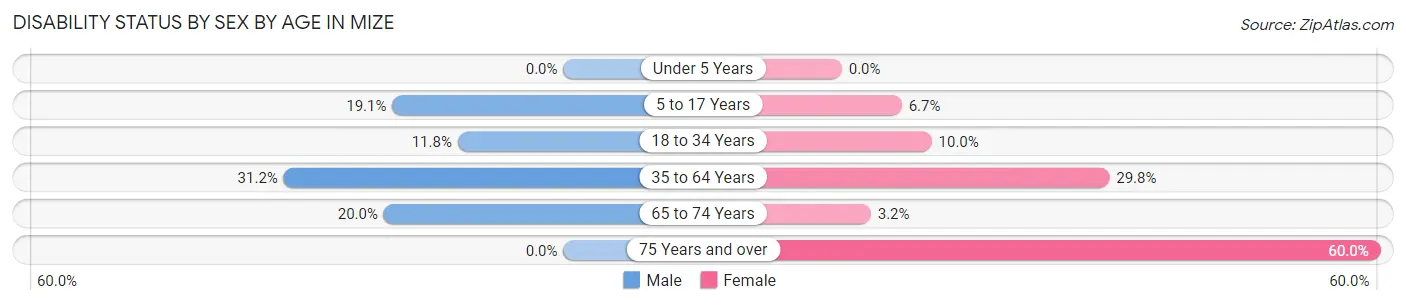
| Age Bracket | Male | Female |
| Under 5 Years | 0 (0.0%) | 0 (0.0%) |
| 5 to 17 Years | 4 (19.1%) | 3 (6.7%) |
| 18 to 34 Years | 2 (11.8%) | 2 (10.0%) |
| 35 to 64 Years | 19 (31.1%) | 14 (29.8%) |
| 65 to 74 Years | 3 (20.0%) | 1 (3.2%) |
| 75 Years and over | 0 (0.0%) | 30 (60.0%) |
Disability Class by Sex by Age in Mize
Disability Class: Hearing Difficulty
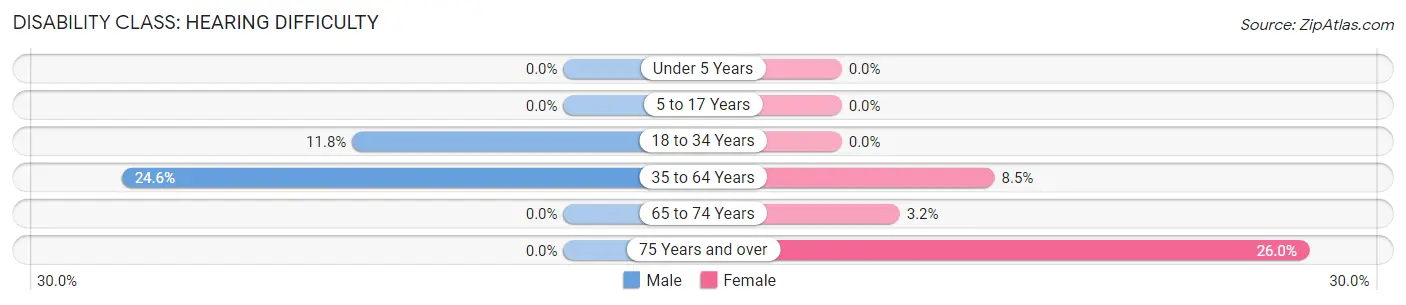
| Age Bracket | Male | Female |
| Under 5 Years | 0 (0.0%) | 0 (0.0%) |
| 5 to 17 Years | 0 (0.0%) | 0 (0.0%) |
| 18 to 34 Years | 2 (11.8%) | 0 (0.0%) |
| 35 to 64 Years | 15 (24.6%) | 4 (8.5%) |
| 65 to 74 Years | 0 (0.0%) | 1 (3.2%) |
| 75 Years and over | 0 (0.0%) | 13 (26.0%) |
Disability Class: Vision Difficulty
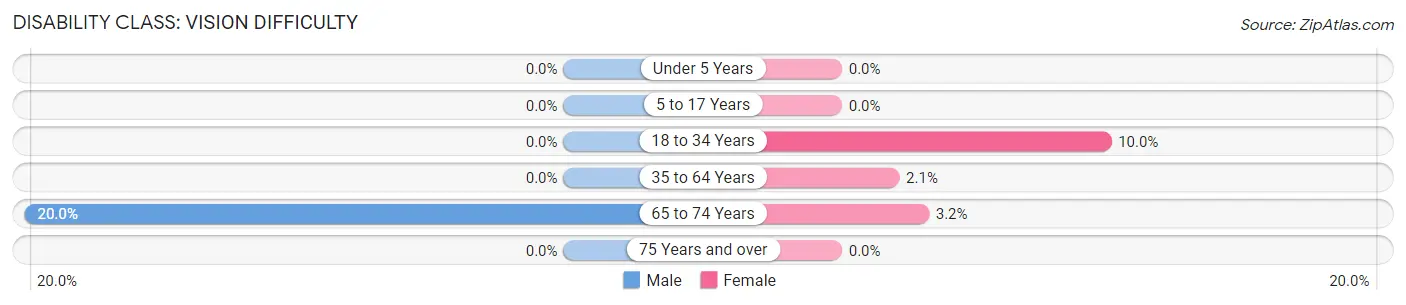
| Age Bracket | Male | Female |
| Under 5 Years | 0 (0.0%) | 0 (0.0%) |
| 5 to 17 Years | 0 (0.0%) | 0 (0.0%) |
| 18 to 34 Years | 0 (0.0%) | 2 (10.0%) |
| 35 to 64 Years | 0 (0.0%) | 1 (2.1%) |
| 65 to 74 Years | 3 (20.0%) | 1 (3.2%) |
| 75 Years and over | 0 (0.0%) | 0 (0.0%) |
Disability Class: Cognitive Difficulty
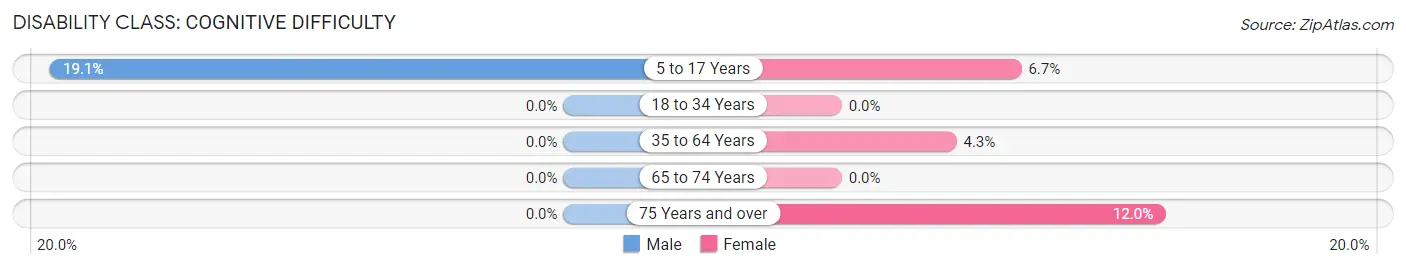
| Age Bracket | Male | Female |
| 5 to 17 Years | 4 (19.1%) | 3 (6.7%) |
| 18 to 34 Years | 0 (0.0%) | 0 (0.0%) |
| 35 to 64 Years | 0 (0.0%) | 2 (4.3%) |
| 65 to 74 Years | 0 (0.0%) | 0 (0.0%) |
| 75 Years and over | 0 (0.0%) | 6 (12.0%) |
Disability Class: Ambulatory Difficulty
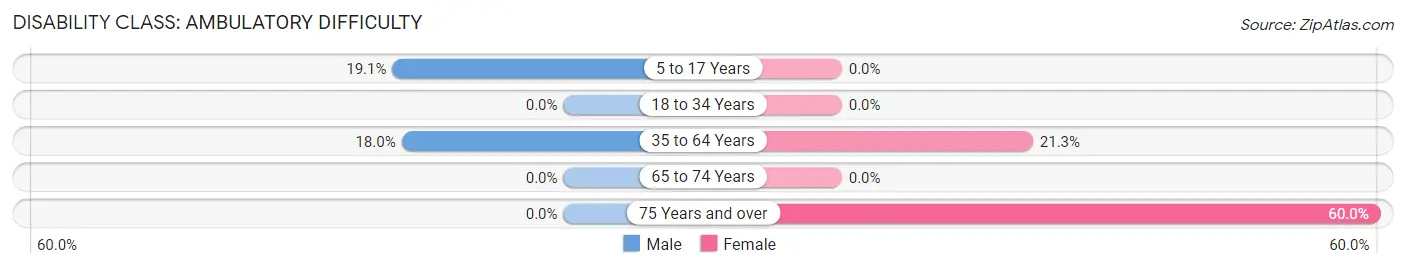
| Age Bracket | Male | Female |
| 5 to 17 Years | 4 (19.1%) | 0 (0.0%) |
| 18 to 34 Years | 0 (0.0%) | 0 (0.0%) |
| 35 to 64 Years | 11 (18.0%) | 10 (21.3%) |
| 65 to 74 Years | 0 (0.0%) | 0 (0.0%) |
| 75 Years and over | 0 (0.0%) | 30 (60.0%) |
Disability Class: Self-Care Difficulty
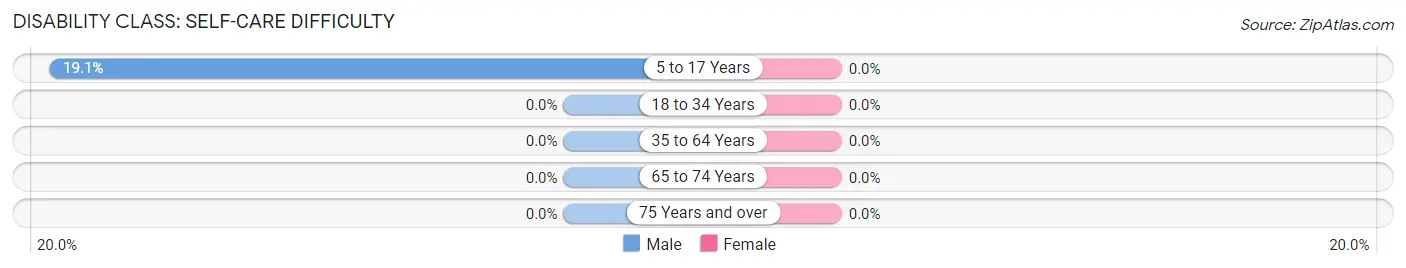
| Age Bracket | Male | Female |
| 5 to 17 Years | 4 (19.1%) | 0 (0.0%) |
| 18 to 34 Years | 0 (0.0%) | 0 (0.0%) |
| 35 to 64 Years | 0 (0.0%) | 0 (0.0%) |
| 65 to 74 Years | 0 (0.0%) | 0 (0.0%) |
| 75 Years and over | 0 (0.0%) | 0 (0.0%) |
Technology Access in Mize
Computing Device Access in Mize
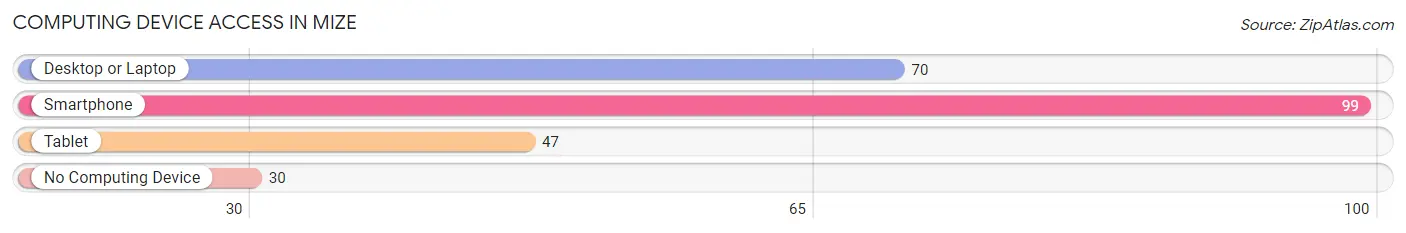
| Device Type | # Households | % Households |
| Desktop or Laptop | 70 | 53.0% |
| Smartphone | 99 | 75.0% |
| Tablet | 47 | 35.6% |
| No Computing Device | 30 | 22.7% |
| Total | 132 | 100.0% |
Internet Access in Mize
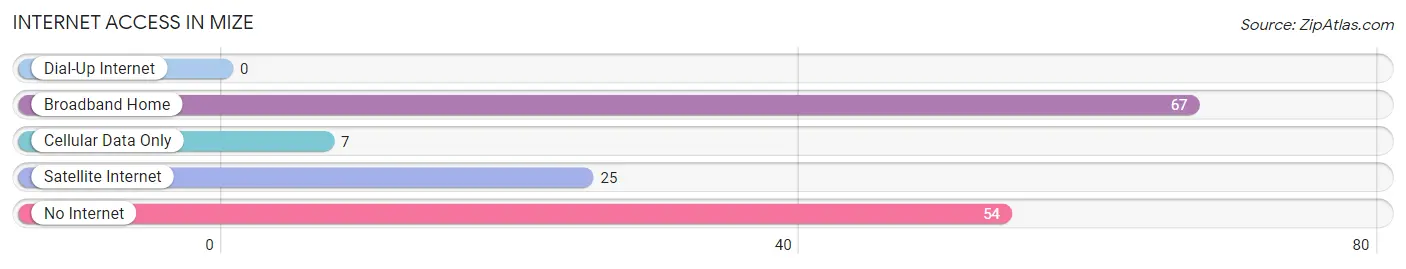
| Internet Type | # Households | % Households |
| Dial-Up Internet | 0 | 0.0% |
| Broadband Home | 67 | 50.8% |
| Cellular Data Only | 7 | 5.3% |
| Satellite Internet | 25 | 18.9% |
| No Internet | 54 | 40.9% |
| Total | 132 | 100.0% |
Mize Summary
Mize is a small town located in Smith County, Mississippi. It is situated in the southeastern part of the state, about 20 miles from the state capital of Jackson. The town has a population of approximately 1,000 people and is part of the larger Jackson metropolitan area.
History
Mize was founded in 1837 by a group of settlers from Georgia. The town was named after a local Native American chief, Chief Mize. The town was originally a small farming community, but it soon grew to become a major trading center for the surrounding area. The town was also home to a number of businesses, including a cotton gin, a sawmill, and a gristmill.
In the late 19th century, Mize was a major stop on the Mississippi Central Railroad. The railroad brought new economic opportunities to the town, and it soon became a hub for the timber and lumber industry. The town also became a popular destination for tourists, who came to enjoy the area’s natural beauty.
Geography
Mize is located in the southeastern part of Smith County, Mississippi. The town is situated on the banks of the Pearl River, which flows through the area. The town is surrounded by rolling hills and forests, and it is located near the Natchez Trace Parkway.
The climate in Mize is humid subtropical, with hot, humid summers and mild winters. The average annual temperature is around 70 degrees Fahrenheit, and the average annual precipitation is around 50 inches.
Economy
Mize’s economy is largely based on agriculture and timber. The town is home to a number of farms, which produce a variety of crops, including corn, soybeans, cotton, and hay. The town is also home to a number of timber companies, which harvest and process timber for use in construction and other industries.
In addition to agriculture and timber, Mize is also home to a number of small businesses, including restaurants, retail stores, and service providers. The town is also home to a number of manufacturing companies, which produce a variety of products, including furniture, clothing, and electronics.
Demographics
As of the 2010 census, Mize had a population of 1,000 people. The racial makeup of the town was 97.2% White, 0.7% African American, 0.2% Native American, 0.2% Asian, and 1.7% from other races. The median household income in Mize was $35,000, and the median family income was $41,000.
Mize is a small town with a rich history and a vibrant economy. The town is home to a diverse population, and it offers a variety of economic opportunities. The town is also home to a number of attractions, including the Natchez Trace Parkway and the Pearl River. Mize is a great place to live, work, and visit.
Common Questions
What is Per Capita Income in Mize?
Per Capita income in Mize is $26,850.
What is the Median Family Income in Mize?
Median Family Income in Mize is $88,365.
What is the Median Household income in Mize?
Median Household Income in Mize is $48,750.
What is Income or Wage Gap in Mize?
Income or Wage Gap in Mize is 24.3%.
Women in Mize earn 75.7 cents for every dollar earned by a man.
What is Inequality or Gini Index in Mize?
Inequality or Gini Index in Mize is 0.40.
What is the Total Population of Mize?
Total Population of Mize is 321.
What is the Total Male Population of Mize?
Total Male Population of Mize is 120.
What is the Total Female Population of Mize?
Total Female Population of Mize is 201.
What is the Ratio of Males per 100 Females in Mize?
There are 59.70 Males per 100 Females in Mize.
What is the Ratio of Females per 100 Males in Mize?
There are 167.50 Females per 100 Males in Mize.
What is the Median Population Age in Mize?
Median Population Age in Mize is 54.1 Years.
What is the Average Family Size in Mize
Average Family Size in Mize is 3.1 People.
What is the Average Household Size in Mize
Average Household Size in Mize is 2.4 People.
How Large is the Labor Force in Mize?
There are 108 People in the Labor Forcein in Mize.
What is the Percentage of People in the Labor Force in Mize?
43.7% of People are in the Labor Force in Mize.
What is the Unemployment Rate in Mize?
Unemployment Rate in Mize is 4.6%.