Brooksville, MS Map & Demographics
Brooksville Map
Brooksville Overview
$13,798
PER CAPITA INCOME
$43,158
AVG FAMILY INCOME
$22,692
AVG HOUSEHOLD INCOME
0.47
INEQUALITY / GINI INDEX
799
TOTAL POPULATION
357
MALE POPULATION
442
FEMALE POPULATION
80.77
MALES / 100 FEMALES
123.81
FEMALES / 100 MALES
36.8
MEDIAN AGE
3.6
AVG FAMILY SIZE
2.7
AVG HOUSEHOLD SIZE
202
LABOR FORCE [ PEOPLE ]
33.5%
PERCENT IN LABOR FORCE
13.4%
UNEMPLOYMENT RATE
Brooksville Zip Codes
Brooksville Area Codes
Income in Brooksville
Income Overview in Brooksville
Per Capita Income in Brooksville is $13,798, while median incomes of families and households are $43,158 and $22,692 respectively.
| Characteristic | Number | Measure |
| Per Capita Income | 799 | $13,798 |
| Median Family Income | 184 | $43,158 |
| Mean Family Income | 184 | $42,876 |
| Median Household Income | 298 | $22,692 |
| Mean Household Income | 298 | $35,543 |
| Income Deficit | 184 | $0 |
| Wage / Income Gap (%) | 799 | 0.00% |
| Wage / Income Gap ($) | 799 | 100.00¢ per $1 |
| Gini / Inequality Index | 799 | 0.47 |
Earnings by Sex in Brooksville
| Sex | Number | Average Earnings |
| Male | 97 (41.1%) | $0 |
| Female | 139 (58.9%) | $0 |
| Total | 236 (100.0%) | $0 |
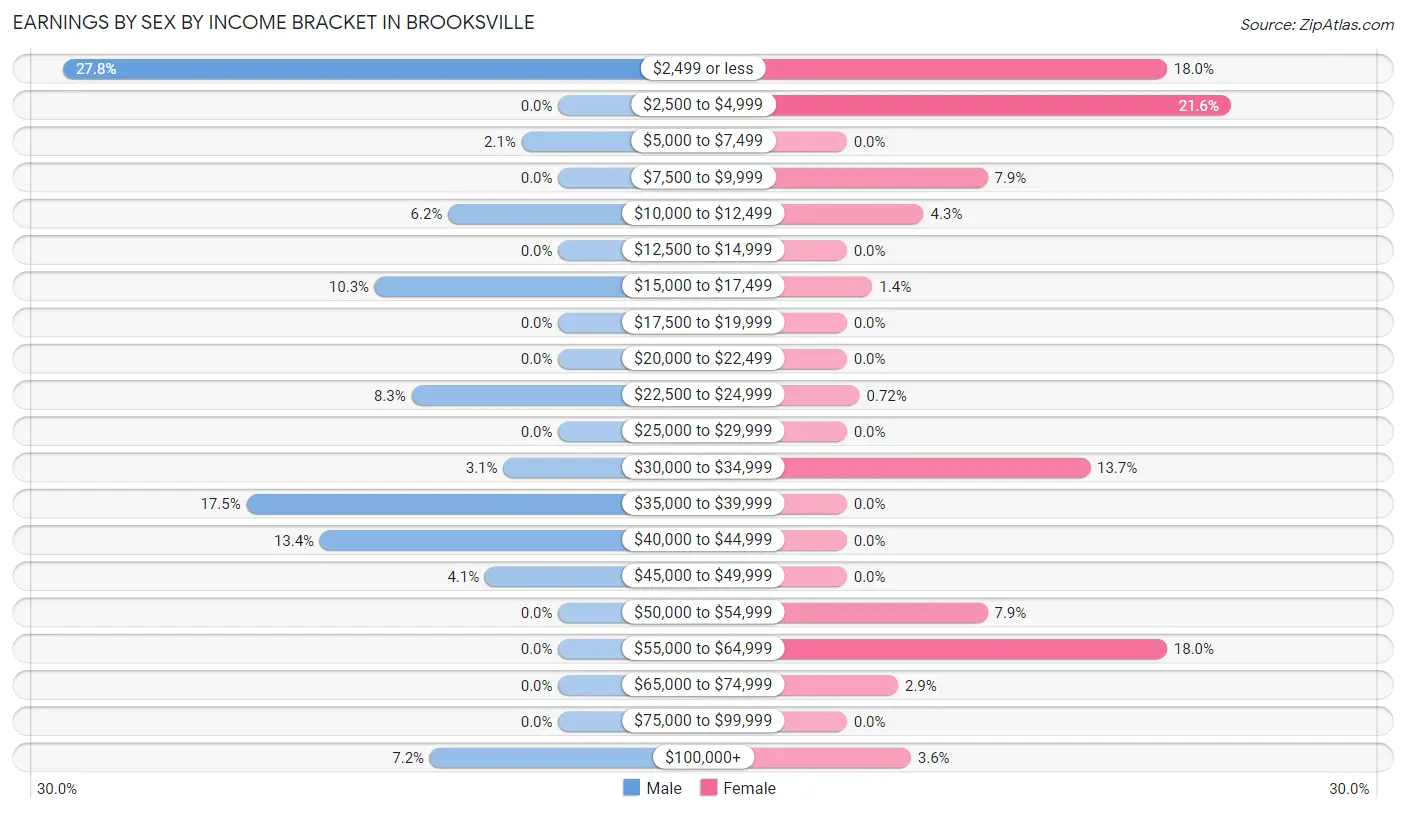
Earnings by Sex by Income Bracket in Brooksville
The most common earnings brackets in Brooksville are $2,499 or less for men (27 | 27.8%) and $2,500 to $4,999 for women (30 | 21.6%).
| Income | Male | Female |
| $2,499 or less | 27 (27.8%) | 25 (18.0%) |
| $2,500 to $4,999 | 0 (0.0%) | 30 (21.6%) |
| $5,000 to $7,499 | 2 (2.1%) | 0 (0.0%) |
| $7,500 to $9,999 | 0 (0.0%) | 11 (7.9%) |
| $10,000 to $12,499 | 6 (6.2%) | 6 (4.3%) |
| $12,500 to $14,999 | 0 (0.0%) | 0 (0.0%) |
| $15,000 to $17,499 | 10 (10.3%) | 2 (1.4%) |
| $17,500 to $19,999 | 0 (0.0%) | 0 (0.0%) |
| $20,000 to $22,499 | 0 (0.0%) | 0 (0.0%) |
| $22,500 to $24,999 | 8 (8.3%) | 1 (0.7%) |
| $25,000 to $29,999 | 0 (0.0%) | 0 (0.0%) |
| $30,000 to $34,999 | 3 (3.1%) | 19 (13.7%) |
| $35,000 to $39,999 | 17 (17.5%) | 0 (0.0%) |
| $40,000 to $44,999 | 13 (13.4%) | 0 (0.0%) |
| $45,000 to $49,999 | 4 (4.1%) | 0 (0.0%) |
| $50,000 to $54,999 | 0 (0.0%) | 11 (7.9%) |
| $55,000 to $64,999 | 0 (0.0%) | 25 (18.0%) |
| $65,000 to $74,999 | 0 (0.0%) | 4 (2.9%) |
| $75,000 to $99,999 | 0 (0.0%) | 0 (0.0%) |
| $100,000+ | 7 (7.2%) | 5 (3.6%) |
| Total | 97 (100.0%) | 139 (100.0%) |
Earnings by Sex by Educational Attainment in Brooksville
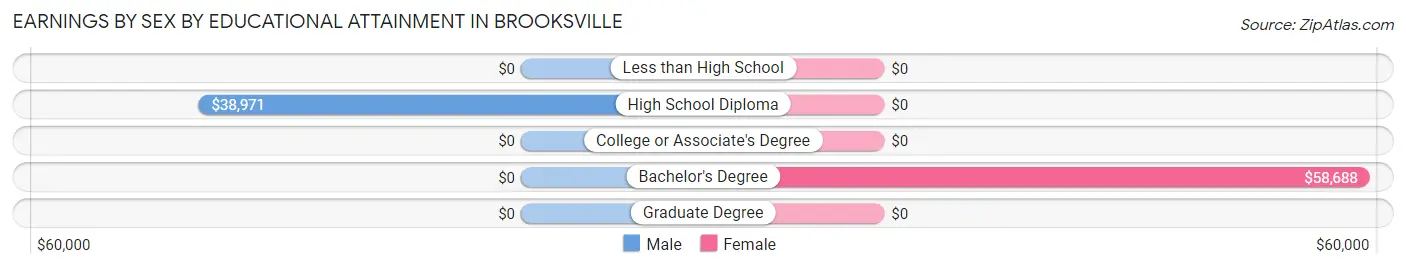
| Educational Attainment | Male Income | Female Income |
| Less than High School | - | - |
| High School Diploma | $38,971 | $0 |
| College or Associate's Degree | - | - |
| Bachelor's Degree | - | - |
| Graduate Degree | - | - |
| Total | $38,750 | $0 |
Family Income in Brooksville
Family Income Brackets in Brooksville
According to the Brooksville family income data, there are 44 families falling into the $15,000 to $24,999 income range, which is the most common income bracket and makes up 23.9% of all families.
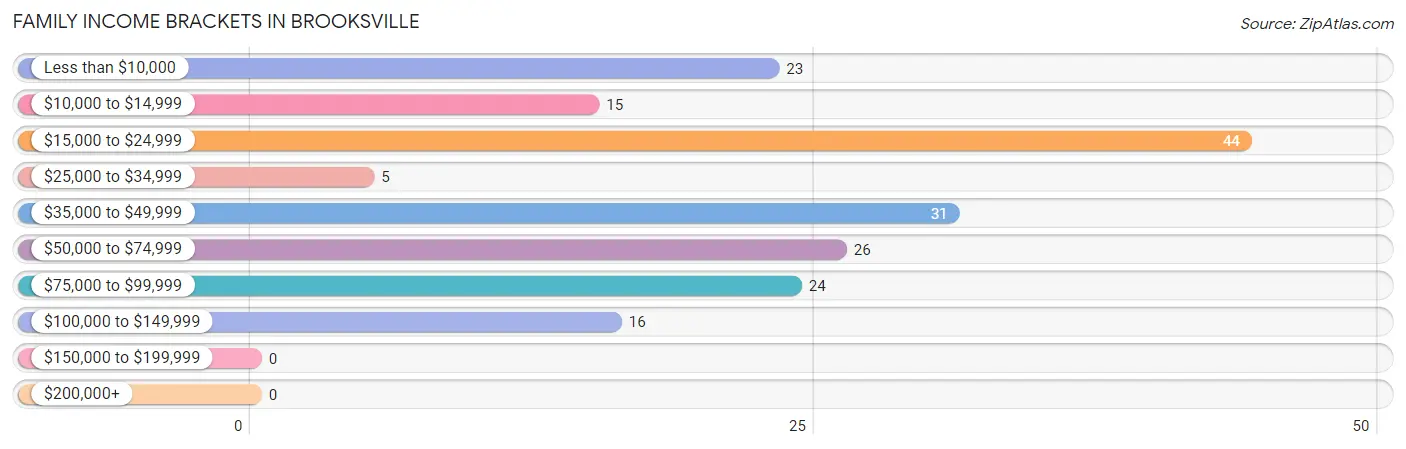
| Income Bracket | # Families | % Families |
| Less than $10,000 | 23 | 12.5% |
| $10,000 to $14,999 | 15 | 8.2% |
| $15,000 to $24,999 | 44 | 23.9% |
| $25,000 to $34,999 | 5 | 2.7% |
| $35,000 to $49,999 | 31 | 16.8% |
| $50,000 to $74,999 | 26 | 14.1% |
| $75,000 to $99,999 | 24 | 13.0% |
| $100,000 to $149,999 | 16 | 8.7% |
| $150,000 to $199,999 | 0 | 0.0% |
| $200,000+ | 0 | 0.0% |
Family Income by Famaliy Size in Brooksville
2-person families (92 | 50.0%) account for the highest median family income in Brooksville with $53,333 per family, while 2-person families (92 | 50.0%) have the highest median income of $26,666 per family member.
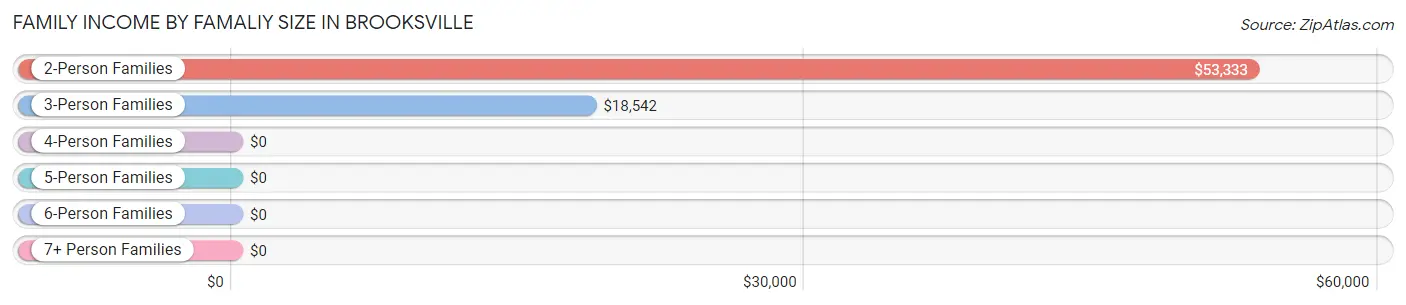
| Income Bracket | # Families | Median Income |
| 2-Person Families | 92 (50.0%) | $53,333 |
| 3-Person Families | 50 (27.2%) | $18,542 |
| 4-Person Families | 0 (0.0%) | $0 |
| 5-Person Families | 42 (22.8%) | $0 |
| 6-Person Families | 0 (0.0%) | $0 |
| 7+ Person Families | 0 (0.0%) | $0 |
| Total | 184 (100.0%) | $43,158 |
Family Income by Number of Earners in Brooksville
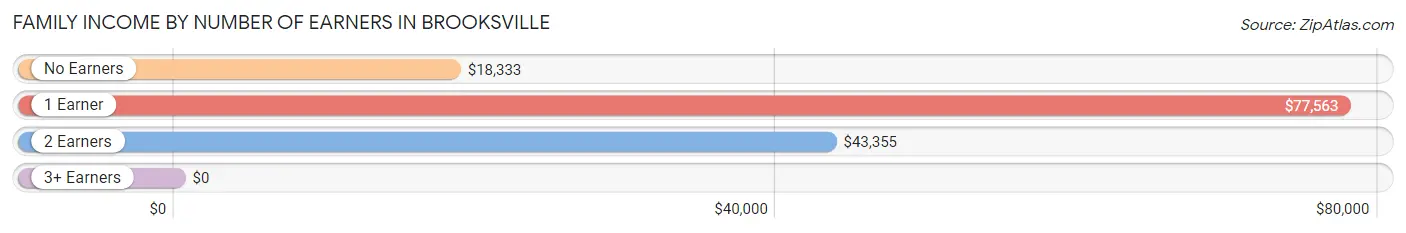
| Number of Earners | # Families | Median Income |
| No Earners | 62 (33.7%) | $18,333 |
| 1 Earner | 53 (28.8%) | $77,563 |
| 2 Earners | 69 (37.5%) | $43,355 |
| 3+ Earners | 0 (0.0%) | $0 |
| Total | 184 (100.0%) | $43,158 |
Household Income in Brooksville
Household Income Brackets in Brooksville
With 75 households falling in the category, the $15,000 to $24,999 income range is the most frequent in Brooksville, accounting for 25.2% of all households.
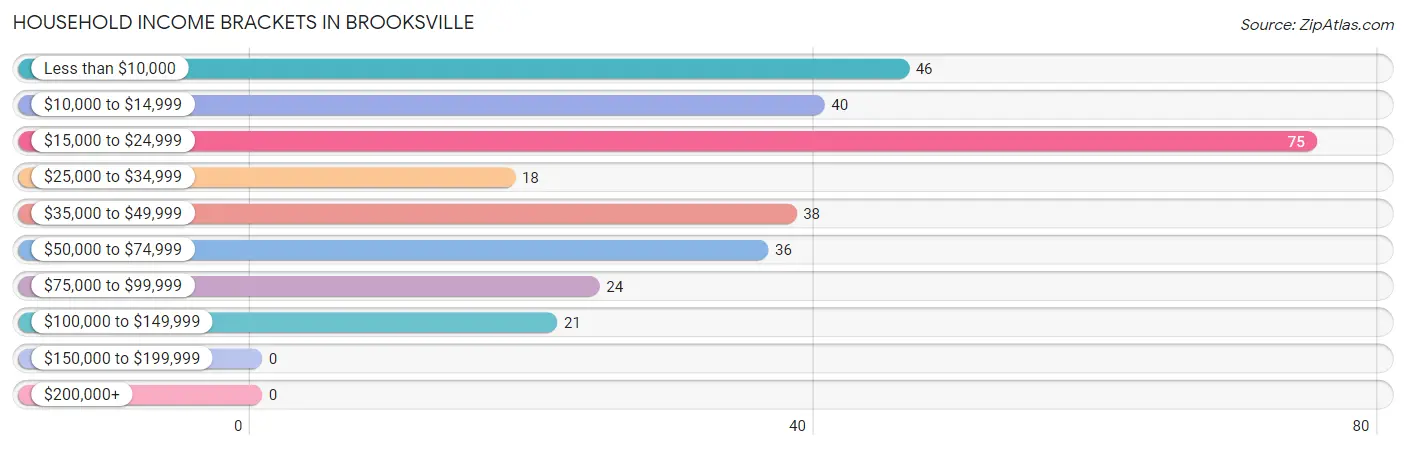
| Income Bracket | # Households | % Households |
| Less than $10,000 | 46 | 15.4% |
| $10,000 to $14,999 | 40 | 13.4% |
| $15,000 to $24,999 | 75 | 25.2% |
| $25,000 to $34,999 | 18 | 6.0% |
| $35,000 to $49,999 | 38 | 12.8% |
| $50,000 to $74,999 | 36 | 12.1% |
| $75,000 to $99,999 | 24 | 8.1% |
| $100,000 to $149,999 | 21 | 7.0% |
| $150,000 to $199,999 | 0 | 0.0% |
| $200,000+ | 0 | 0.0% |
Household Income by Householder Age in Brooksville
The median household income in Brooksville is $22,692, with the highest median household income of $48,958 found in the 45 to 64 years age bracket for the primary householder. A total of 114 households (38.3%) fall into this category. Meanwhile, the 15 to 24 years age bracket for the primary householder has the lowest median household income of $0, with 5 households (1.7%) in this group.
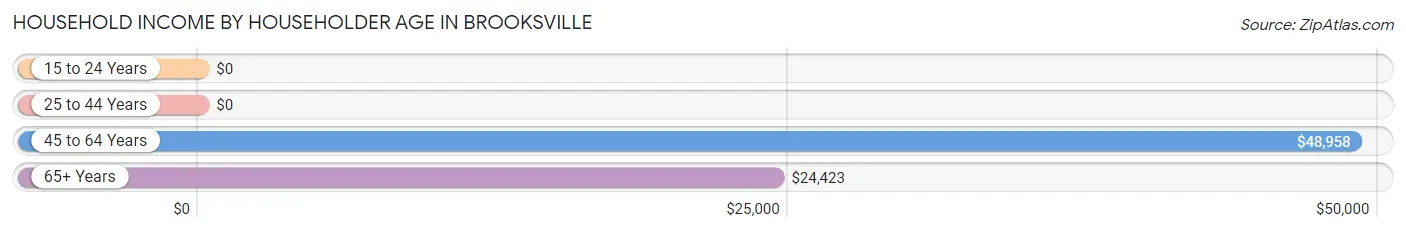
| Income Bracket | # Households | Median Income |
| 15 to 24 Years | 5 (1.7%) | $0 |
| 25 to 44 Years | 87 (29.2%) | $0 |
| 45 to 64 Years | 114 (38.3%) | $48,958 |
| 65+ Years | 92 (30.9%) | $24,423 |
| Total | 298 (100.0%) | $22,692 |
Poverty in Brooksville
Income Below Poverty by Sex and Age in Brooksville
With 49.3% poverty level for males and 44.6% for females among the residents of Brooksville, under 5 year old males and 18 to 24 year old females are the most vulnerable to poverty, with 8 males (100.0%) and 33 females (94.3%) in their respective age groups living below the poverty level.
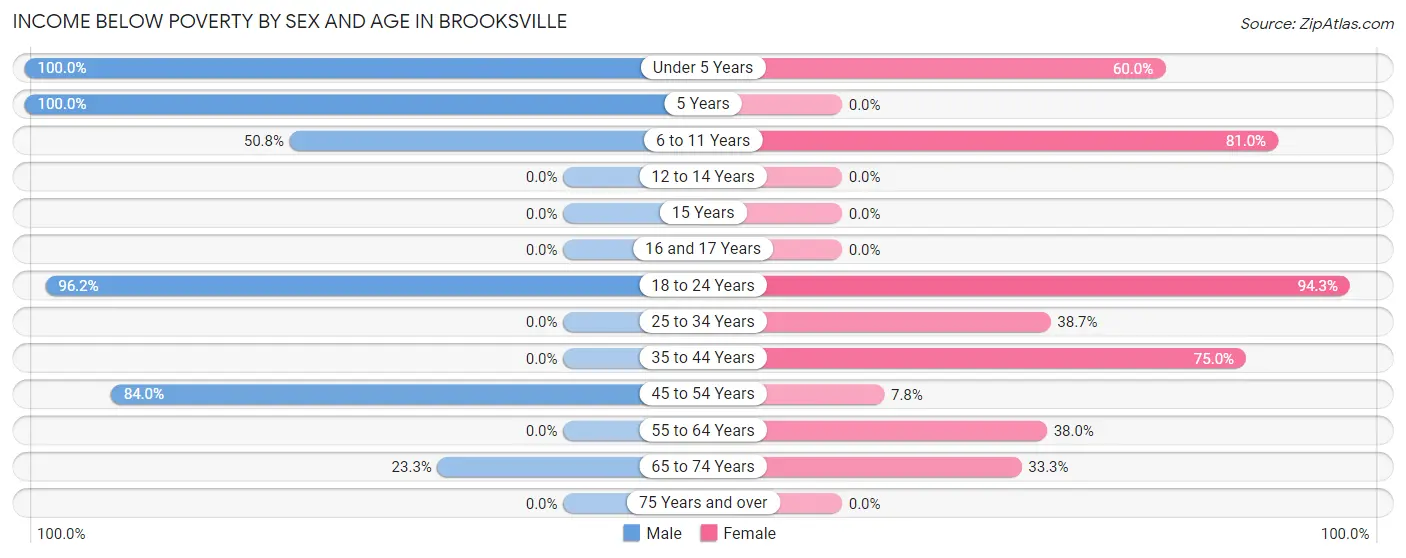
| Age Bracket | Male | Female |
| Under 5 Years | 8 (100.0%) | 18 (60.0%) |
| 5 Years | 22 (100.0%) | 0 (0.0%) |
| 6 to 11 Years | 33 (50.8%) | 17 (80.9%) |
| 12 to 14 Years | 0 (0.0%) | 0 (0.0%) |
| 15 Years | 0 (0.0%) | 0 (0.0%) |
| 16 and 17 Years | 0 (0.0%) | 0 (0.0%) |
| 18 to 24 Years | 75 (96.2%) | 33 (94.3%) |
| 25 to 34 Years | 0 (0.0%) | 12 (38.7%) |
| 35 to 44 Years | 0 (0.0%) | 78 (75.0%) |
| 45 to 54 Years | 21 (84.0%) | 4 (7.8%) |
| 55 to 64 Years | 0 (0.0%) | 27 (38.0%) |
| 65 to 74 Years | 14 (23.3%) | 8 (33.3%) |
| 75 Years and over | 0 (0.0%) | 0 (0.0%) |
| Total | 173 (49.3%) | 197 (44.6%) |
Income Above Poverty by Sex and Age in Brooksville
According to the poverty statistics in Brooksville, males aged 12 to 14 years and females aged 12 to 14 years are the age groups that are most secure financially, with 100.0% of males and 100.0% of females in these age groups living above the poverty line.
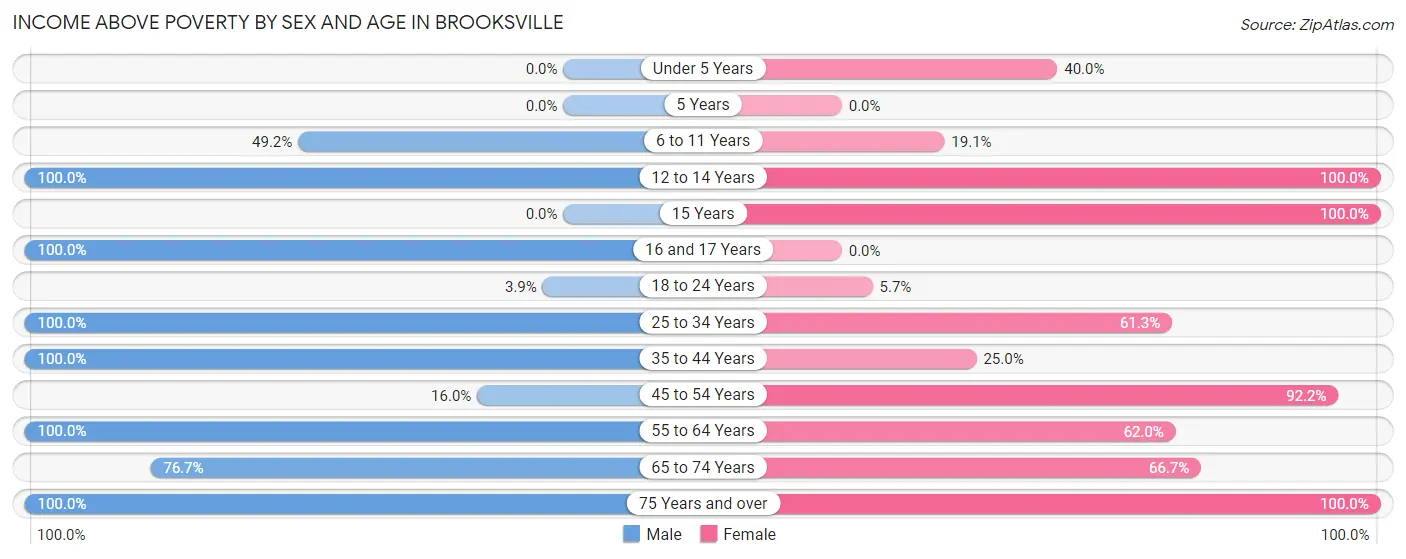
| Age Bracket | Male | Female |
| Under 5 Years | 0 (0.0%) | 12 (40.0%) |
| 5 Years | 0 (0.0%) | 0 (0.0%) |
| 6 to 11 Years | 32 (49.2%) | 4 (19.1%) |
| 12 to 14 Years | 22 (100.0%) | 21 (100.0%) |
| 15 Years | 0 (0.0%) | 7 (100.0%) |
| 16 and 17 Years | 2 (100.0%) | 0 (0.0%) |
| 18 to 24 Years | 3 (3.8%) | 2 (5.7%) |
| 25 to 34 Years | 8 (100.0%) | 19 (61.3%) |
| 35 to 44 Years | 17 (100.0%) | 26 (25.0%) |
| 45 to 54 Years | 4 (16.0%) | 47 (92.2%) |
| 55 to 64 Years | 41 (100.0%) | 44 (62.0%) |
| 65 to 74 Years | 46 (76.7%) | 16 (66.7%) |
| 75 Years and over | 3 (100.0%) | 47 (100.0%) |
| Total | 178 (50.7%) | 245 (55.4%) |
Income Below Poverty Among Married-Couple Families in Brooksville
The poverty statistics for married-couple families in Brooksville show that 21.9% or 23 of the total 105 families live below the poverty line. Families with no children have the highest poverty rate of 22.8%, comprising of 23 families. On the other hand, families with 1 or 2 children have the lowest poverty rate of 0.0%, which includes 0 families.
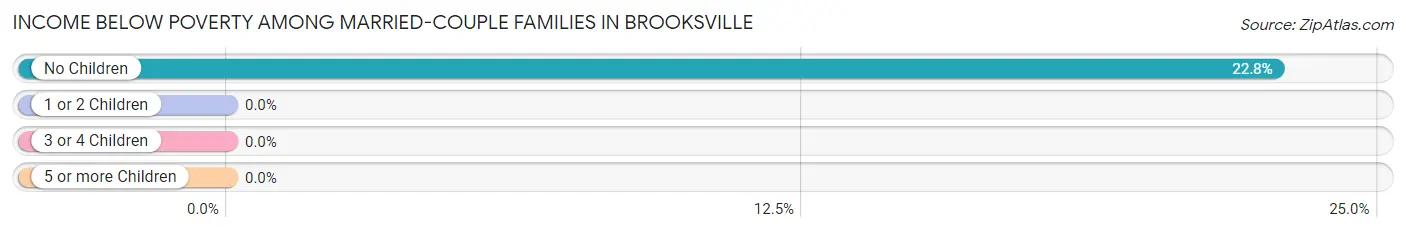
| Children | Above Poverty | Below Poverty |
| No Children | 78 (77.2%) | 23 (22.8%) |
| 1 or 2 Children | 4 (100.0%) | 0 (0.0%) |
| 3 or 4 Children | 0 (0.0%) | 0 (0.0%) |
| 5 or more Children | 0 (0.0%) | 0 (0.0%) |
| Total | 82 (78.1%) | 23 (21.9%) |
Income Below Poverty Among Single-Parent Households in Brooksville
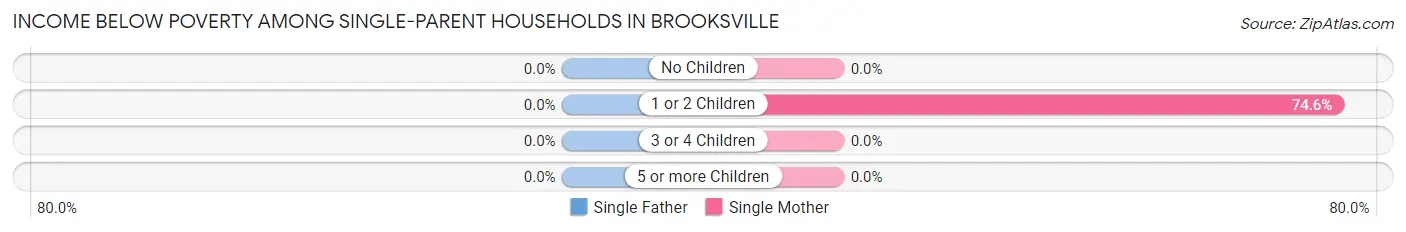
| Children | Single Father | Single Mother |
| No Children | 0 (0.0%) | 0 (0.0%) |
| 1 or 2 Children | 0 (0.0%) | 41 (74.6%) |
| 3 or 4 Children | 0 (0.0%) | 0 (0.0%) |
| 5 or more Children | 0 (0.0%) | 0 (0.0%) |
| Total | 0 (0.0%) | 41 (51.9%) |
Income Below Poverty Among Married-Couple vs Single-Parent Households in Brooksville
The poverty data for Brooksville shows that 23 of the married-couple family households (21.9%) and 41 of the single-parent households (51.9%) are living below the poverty level. Within the married-couple family households, those with no children have the highest poverty rate, with 23 households (22.8%) falling below the poverty line. Among the single-parent households, those with 1 or 2 children have the highest poverty rate, with 41 household (74.6%) living below poverty.
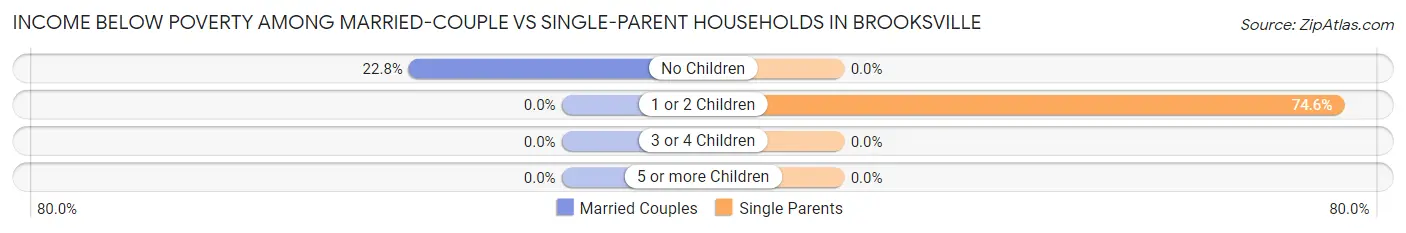
| Children | Married-Couple Families | Single-Parent Households |
| No Children | 23 (22.8%) | 0 (0.0%) |
| 1 or 2 Children | 0 (0.0%) | 41 (74.6%) |
| 3 or 4 Children | 0 (0.0%) | 0 (0.0%) |
| 5 or more Children | 0 (0.0%) | 0 (0.0%) |
| Total | 23 (21.9%) | 41 (51.9%) |
Race in Brooksville
The most populous races in Brooksville are Black / African American (651 | 81.5%), White / Caucasian (139 | 17.4%), and Two or more Races (9 | 1.1%).
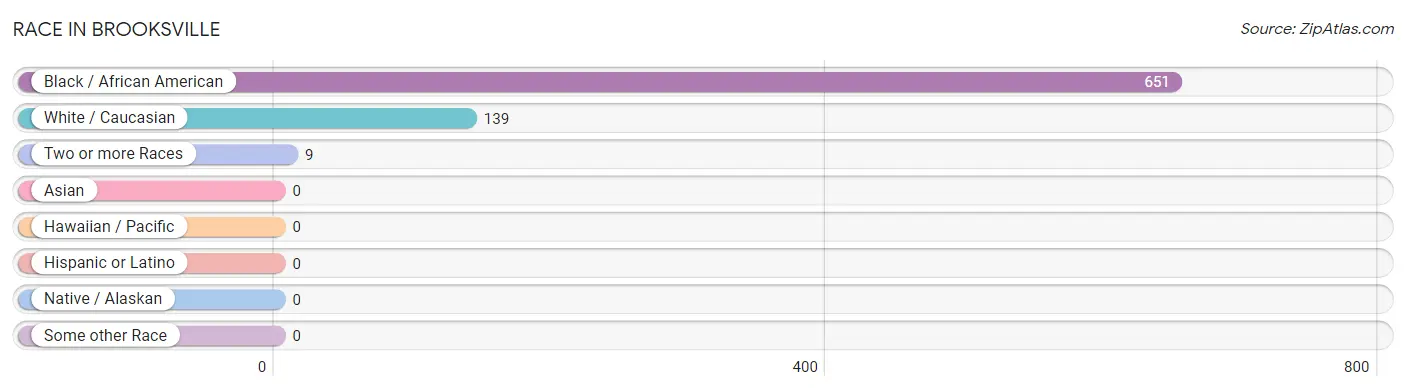
| Race | # Population | % Population |
| Asian | 0 | 0.0% |
| Black / African American | 651 | 81.5% |
| Hawaiian / Pacific | 0 | 0.0% |
| Hispanic or Latino | 0 | 0.0% |
| Native / Alaskan | 0 | 0.0% |
| White / Caucasian | 139 | 17.4% |
| Two or more Races | 9 | 1.1% |
| Some other Race | 0 | 0.0% |
| Total | 799 | 100.0% |
Ancestry in Brooksville
The most populous ancestries reported in Brooksville are English (35 | 4.4%), German (30 | 3.7%), American (25 | 3.1%), Scotch-Irish (25 | 3.1%), and Irish (20 | 2.5%), together accounting for 16.9% of all Brooksville residents.
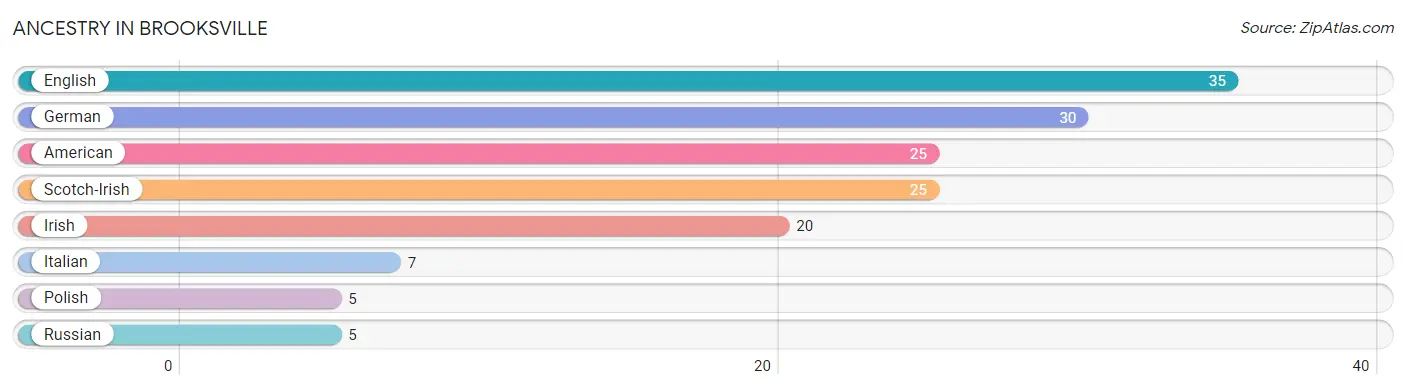
| Ancestry | # Population | % Population |
| American | 25 | 3.1% |
| English | 35 | 4.4% |
| German | 30 | 3.7% |
| Irish | 20 | 2.5% |
| Italian | 7 | 0.9% |
| Polish | 5 | 0.6% |
| Russian | 5 | 0.6% |
| Scotch-Irish | 25 | 3.1% | View All 8 Rows |
Immigrants in Brooksville
The most numerous immigrant groups reported in Brooksville came from Asia (4 | 0.5%), China (4 | 0.5%), and Eastern Asia (4 | 0.5%), together accounting for 1.5% of all Brooksville residents.
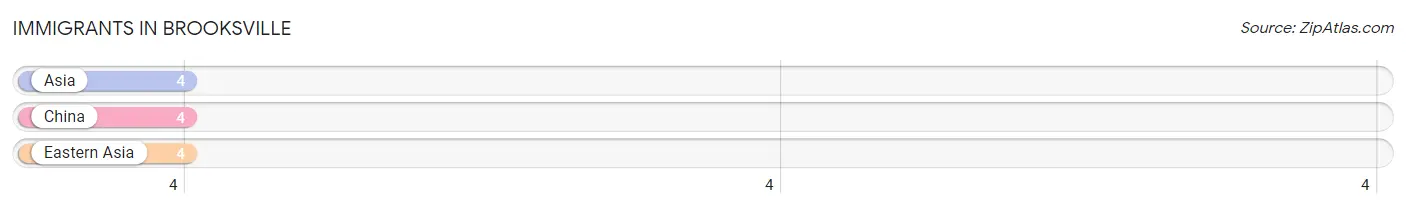
| Immigration Origin | # Population | % Population |
| Asia | 4 | 0.5% |
| China | 4 | 0.5% |
| Eastern Asia | 4 | 0.5% | View All 3 Rows |
Sex and Age in Brooksville
Sex and Age in Brooksville
The most populous age groups in Brooksville are 5 to 9 Years (55 | 15.4%) for men and 40 to 44 Years (65 | 14.7%) for women.
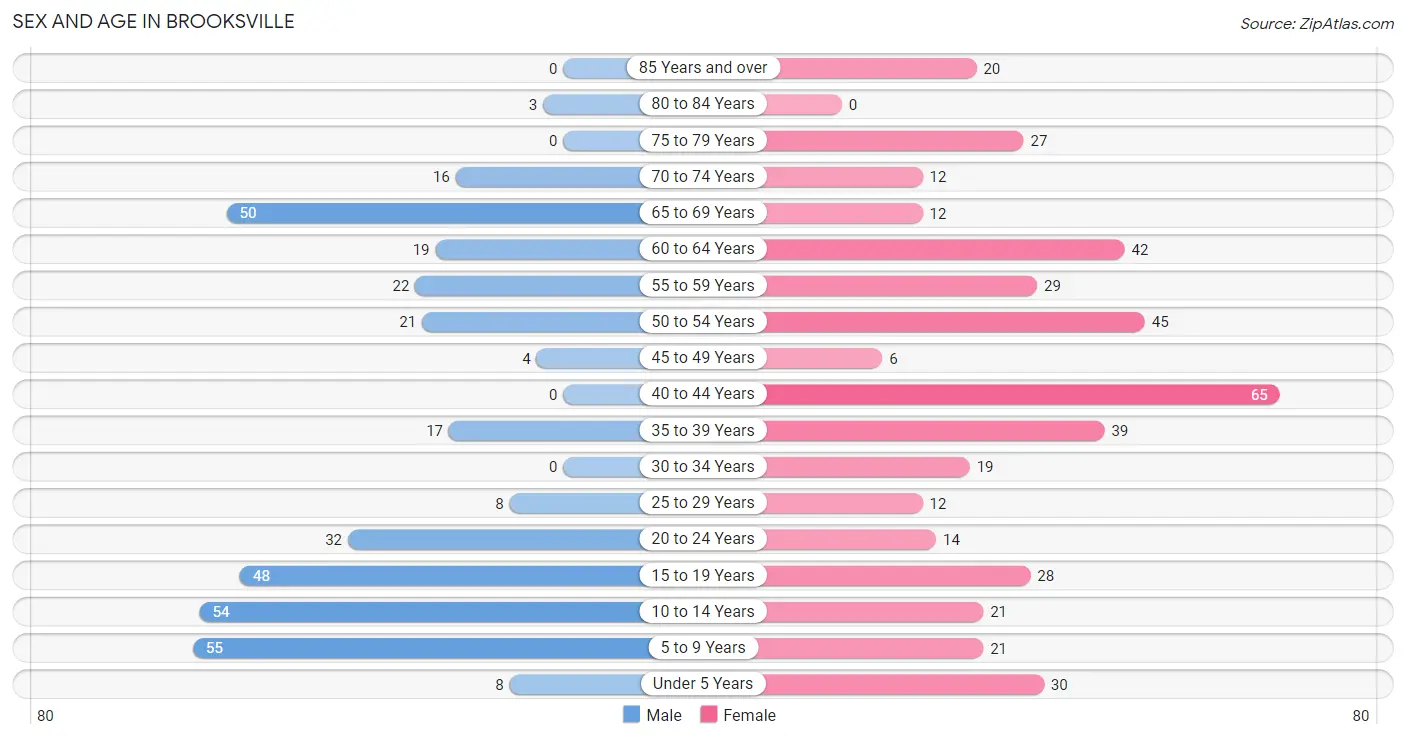
| Age Bracket | Male | Female |
| Under 5 Years | 8 (2.2%) | 30 (6.8%) |
| 5 to 9 Years | 55 (15.4%) | 21 (4.8%) |
| 10 to 14 Years | 54 (15.1%) | 21 (4.8%) |
| 15 to 19 Years | 48 (13.5%) | 28 (6.3%) |
| 20 to 24 Years | 32 (9.0%) | 14 (3.2%) |
| 25 to 29 Years | 8 (2.2%) | 12 (2.7%) |
| 30 to 34 Years | 0 (0.0%) | 19 (4.3%) |
| 35 to 39 Years | 17 (4.8%) | 39 (8.8%) |
| 40 to 44 Years | 0 (0.0%) | 65 (14.7%) |
| 45 to 49 Years | 4 (1.1%) | 6 (1.4%) |
| 50 to 54 Years | 21 (5.9%) | 45 (10.2%) |
| 55 to 59 Years | 22 (6.2%) | 29 (6.6%) |
| 60 to 64 Years | 19 (5.3%) | 42 (9.5%) |
| 65 to 69 Years | 50 (14.0%) | 12 (2.7%) |
| 70 to 74 Years | 16 (4.5%) | 12 (2.7%) |
| 75 to 79 Years | 0 (0.0%) | 27 (6.1%) |
| 80 to 84 Years | 3 (0.8%) | 0 (0.0%) |
| 85 Years and over | 0 (0.0%) | 20 (4.5%) |
| Total | 357 (100.0%) | 442 (100.0%) |
Families and Households in Brooksville
Median Family Size in Brooksville
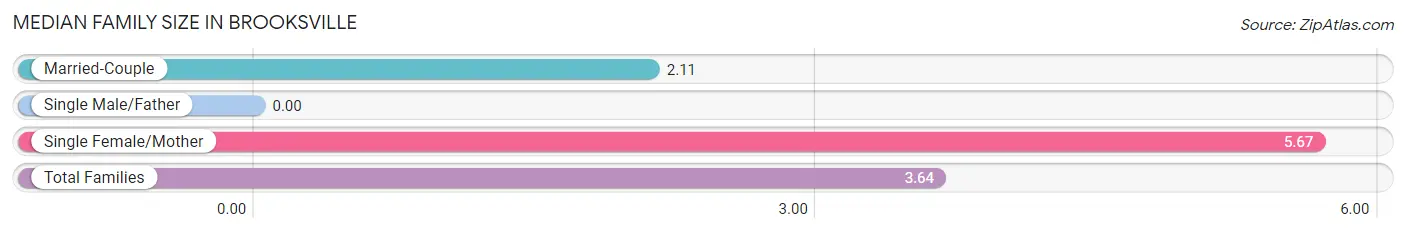
| Family Type | # Families | Family Size |
| Married-Couple | 105 (57.1%) | 2.11 |
| Single Male/Father | 0 (0.0%) | - |
| Single Female/Mother | 79 (42.9%) | 5.67 |
| Total Families | 184 (100.0%) | 3.64 |
Median Household Size in Brooksville
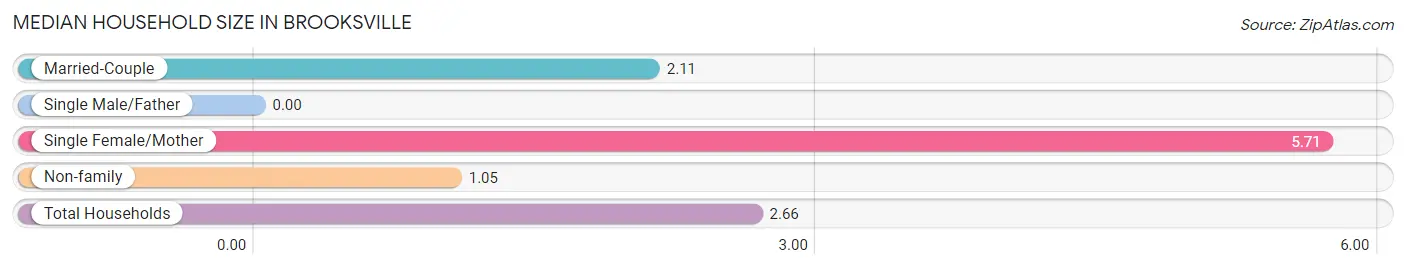
| Household Type | # Households | Household Size |
| Married-Couple | 105 (35.2%) | 2.11 |
| Single Male/Father | 0 (0.0%) | - |
| Single Female/Mother | 79 (26.5%) | 5.71 |
| Non-family | 114 (38.3%) | 1.05 |
| Total Households | 298 (100.0%) | 2.66 |
Household Size by Marriage Status in Brooksville
Out of a total of 298 households in Brooksville, 184 (61.7%) are family households, while 114 (38.3%) are nonfamily households. The most numerous type of family households are 2-person households, comprising 92, and the most common type of nonfamily households are 1-person households, comprising 109.
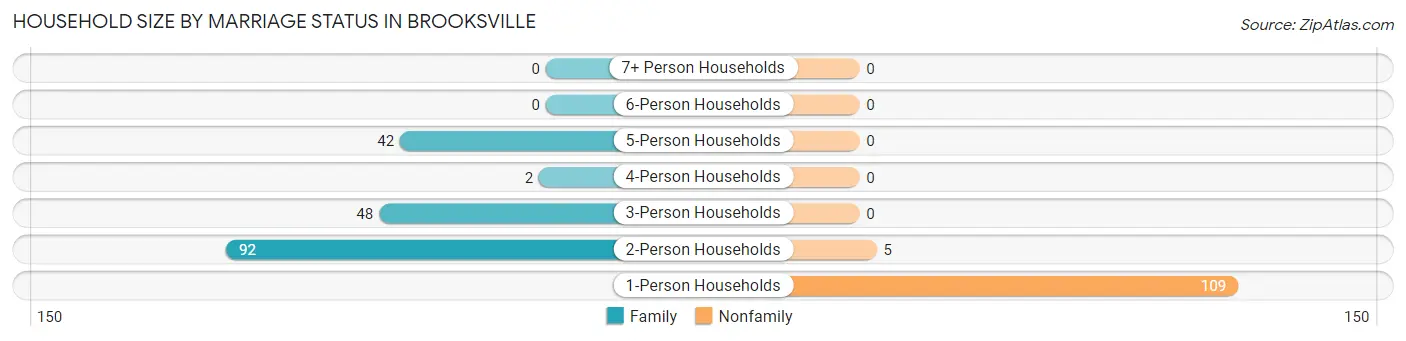
| Household Size | Family Households | Nonfamily Households |
| 1-Person Households | - | 109 (36.6%) |
| 2-Person Households | 92 (30.9%) | 5 (1.7%) |
| 3-Person Households | 48 (16.1%) | 0 (0.0%) |
| 4-Person Households | 2 (0.7%) | 0 (0.0%) |
| 5-Person Households | 42 (14.1%) | 0 (0.0%) |
| 6-Person Households | 0 (0.0%) | 0 (0.0%) |
| 7+ Person Households | 0 (0.0%) | 0 (0.0%) |
| Total | 184 (61.7%) | 114 (38.3%) |
Female Fertility in Brooksville
Fertility by Age in Brooksville
| Age Bracket | Women with Births | Births / 1,000 Women |
| 15 to 19 years | 0 (0.0%) | 0.0 |
| 20 to 34 years | 0 (0.0%) | 0.0 |
| 35 to 50 years | 0 (0.0%) | 0.0 |
| Total | 0 (0.0%) | 0.0 |
Fertility by Age by Marriage Status in Brooksville
| Age Bracket | Married | Unmarried |
| 15 to 19 years | 0 (0.0%) | 0 (0.0%) |
| 20 to 34 years | 0 (0.0%) | 0 (0.0%) |
| 35 to 50 years | 0 (0.0%) | 0 (0.0%) |
| Total | 0 (0.0%) | 0 (0.0%) |
Fertility by Education in Brooksville
| Educational Attainment | Women with Births | Births / 1,000 Women |
| Less than High School | 0 (0.0%) | 0.0 |
| High School Diploma | 0 (0.0%) | 0.0 |
| College or Associate's Degree | 0 (0.0%) | 0.0 |
| Bachelor's Degree | 0 (0.0%) | 0.0 |
| Graduate Degree | 0 (0.0%) | 0.0 |
| Total | 0 (0.0%) | 0.0 |
Fertility by Education by Marriage Status in Brooksville
| Educational Attainment | Married | Unmarried |
| Less than High School | 0 (0.0%) | 0 (0.0%) |
| High School Diploma | 0 (0.0%) | 0 (0.0%) |
| College or Associate's Degree | 0 (0.0%) | 0 (0.0%) |
| Bachelor's Degree | 0 (0.0%) | 0 (0.0%) |
| Graduate Degree | 0 (0.0%) | 0 (0.0%) |
| Total | 0 (0.0%) | 0 (0.0%) |
Employment Characteristics in Brooksville
Employment by Class of Employer in Brooksville
Among the 162 employed individuals in Brooksville, private company employees (125 | 77.2%), state government employees (22 | 13.6%), and not-for-profit organizations (8 | 4.9%) make up the most common classes of employment.
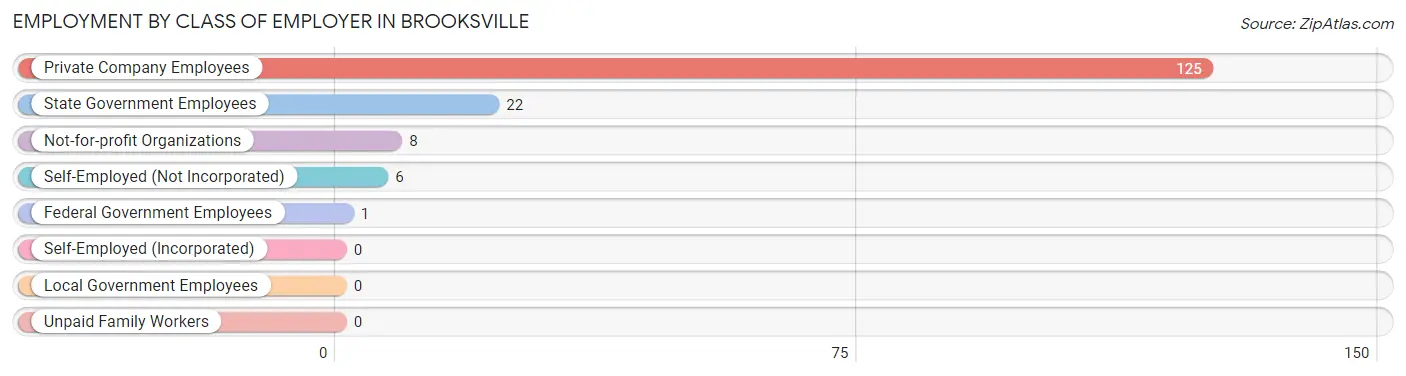
| Employer Class | # Employees | % Employees |
| Private Company Employees | 125 | 77.2% |
| Self-Employed (Incorporated) | 0 | 0.0% |
| Self-Employed (Not Incorporated) | 6 | 3.7% |
| Not-for-profit Organizations | 8 | 4.9% |
| Local Government Employees | 0 | 0.0% |
| State Government Employees | 22 | 13.6% |
| Federal Government Employees | 1 | 0.6% |
| Unpaid Family Workers | 0 | 0.0% |
| Total | 162 | 100.0% |
Employment Status by Age in Brooksville
According to the labor force statistics for Brooksville, out of the total population over 16 years of age (603), 33.5% or 202 individuals are in the labor force, with 13.4% or 27 of them unemployed. The age group with the highest labor force participation rate is 30 to 34 years, with 100.0% or 19 individuals in the labor force. Within the labor force, the 16 to 19 years age range has the highest percentage of unemployed individuals, with 100.0% or 6 of them being unemployed.
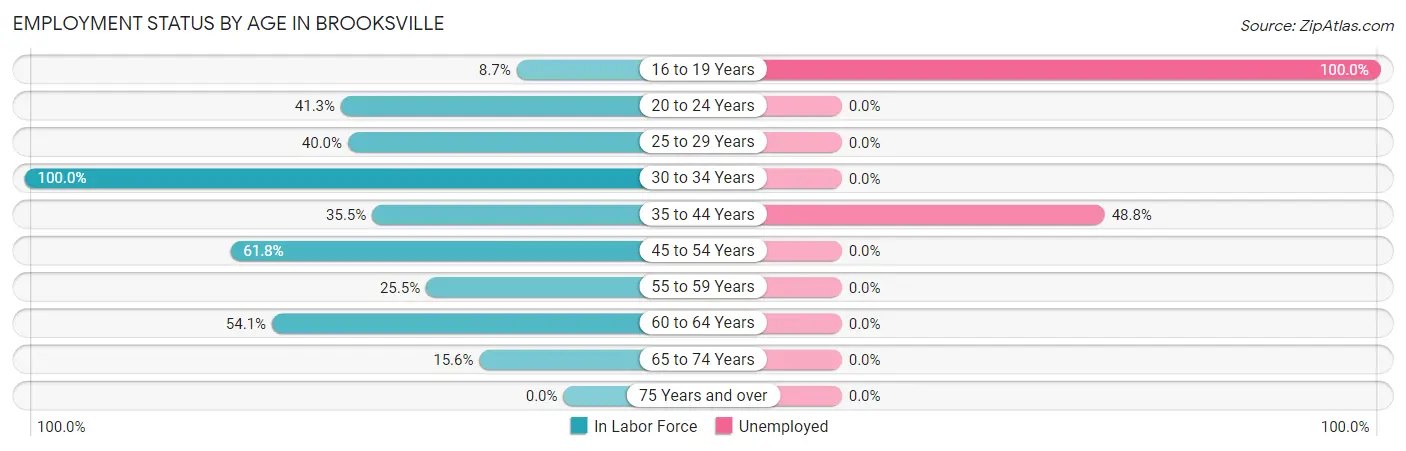
| Age Bracket | In Labor Force | Unemployed |
| 16 to 19 Years | 6 (8.7%) | 6 (100.0%) |
| 20 to 24 Years | 19 (41.3%) | 0 (0.0%) |
| 25 to 29 Years | 8 (40.0%) | 0 (0.0%) |
| 30 to 34 Years | 19 (100.0%) | 0 (0.0%) |
| 35 to 44 Years | 43 (35.5%) | 21 (48.8%) |
| 45 to 54 Years | 47 (61.8%) | 0 (0.0%) |
| 55 to 59 Years | 13 (25.5%) | 0 (0.0%) |
| 60 to 64 Years | 33 (54.1%) | 0 (0.0%) |
| 65 to 74 Years | 14 (15.6%) | 0 (0.0%) |
| 75 Years and over | 0 (0.0%) | 0 (0.0%) |
| Total | 202 (33.5%) | 27 (13.4%) |
Employment Status by Educational Attainment in Brooksville
According to labor force statistics for Brooksville, 46.8% of individuals (163) out of the total population between 25 and 64 years of age (348) are in the labor force, with 12.9% or 21 of them being unemployed. The group with the highest labor force participation rate are those with the educational attainment of bachelor's degree or higher, with 100.0% or 31 individuals in the labor force. Within the labor force, individuals with high school diploma education have the highest percentage of unemployment, with 25.0% or 21 of them being unemployed.
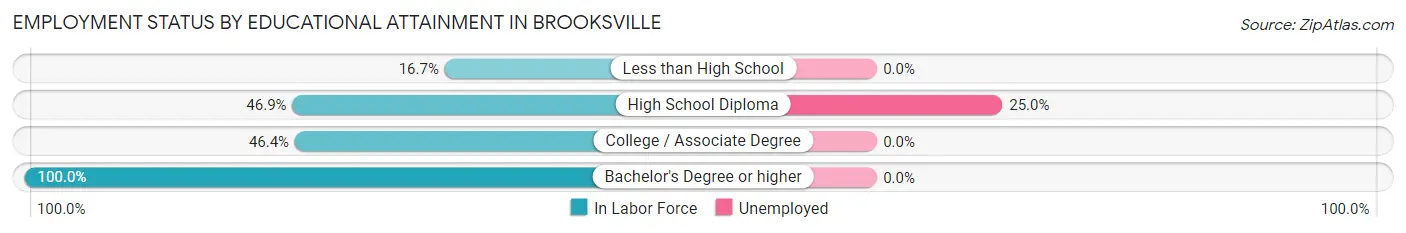
| Educational Attainment | In Labor Force | Unemployed |
| Less than High School | 9 (16.7%) | 0 (0.0%) |
| High School Diploma | 84 (46.9%) | 45 (25.0%) |
| College / Associate Degree | 39 (46.4%) | 0 (0.0%) |
| Bachelor's Degree or higher | 31 (100.0%) | 0 (0.0%) |
| Total | 163 (46.8%) | 45 (12.9%) |
Employment Occupations by Sex in Brooksville
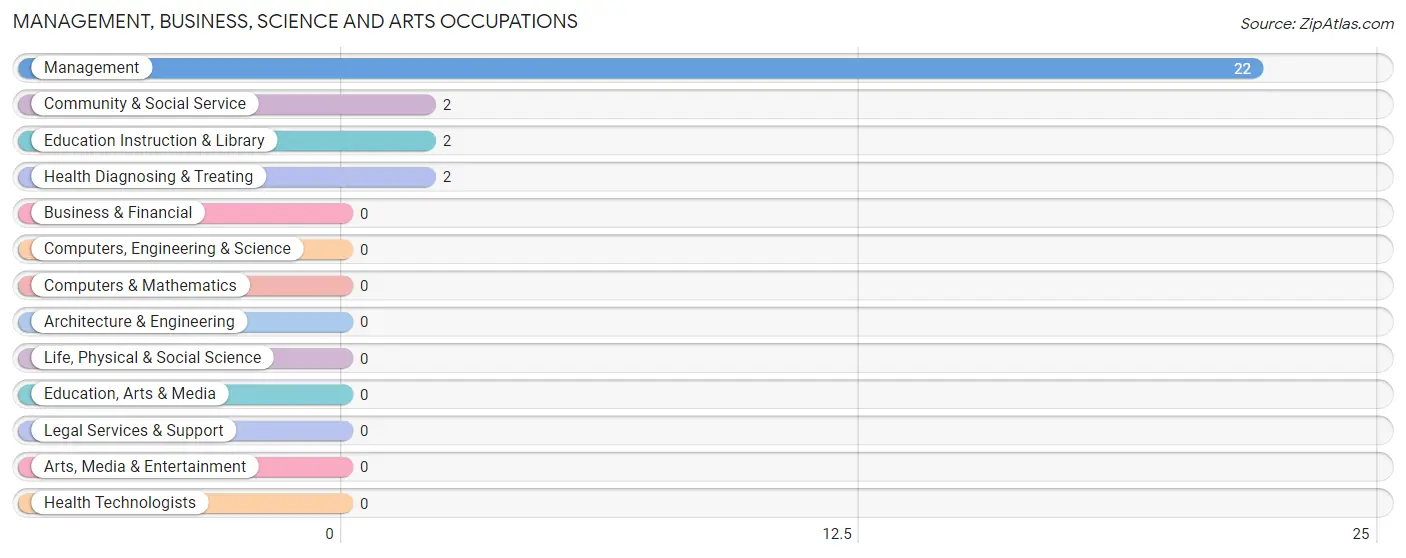
Management, Business, Science and Arts Occupations
The most common Management, Business, Science and Arts occupations in Brooksville are Management (22 | 12.6%), Community & Social Service (2 | 1.1%), Education Instruction & Library (2 | 1.1%), and Health Diagnosing & Treating (2 | 1.1%).
Management, Business, Science and Arts Occupations by Sex
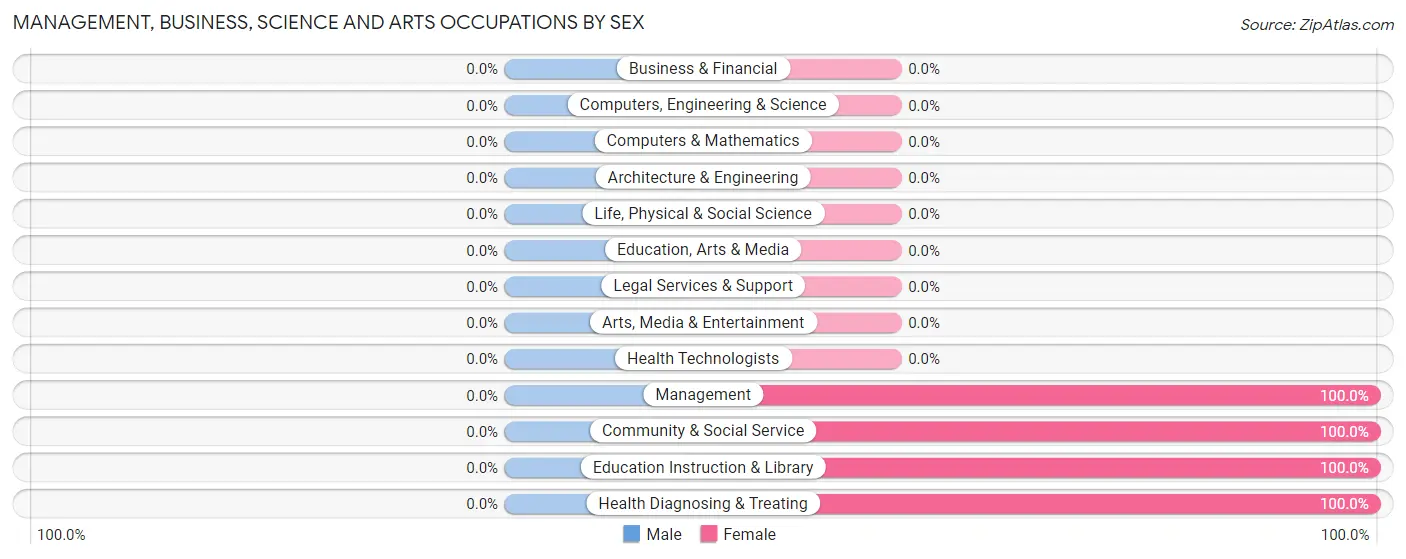
| Occupation | Male | Female |
| Management | 0 (0.0%) | 22 (100.0%) |
| Business & Financial | 0 (0.0%) | 0 (0.0%) |
| Computers, Engineering & Science | 0 (0.0%) | 0 (0.0%) |
| Computers & Mathematics | 0 (0.0%) | 0 (0.0%) |
| Architecture & Engineering | 0 (0.0%) | 0 (0.0%) |
| Life, Physical & Social Science | 0 (0.0%) | 0 (0.0%) |
| Community & Social Service | 0 (0.0%) | 2 (100.0%) |
| Education, Arts & Media | 0 (0.0%) | 0 (0.0%) |
| Legal Services & Support | 0 (0.0%) | 0 (0.0%) |
| Education Instruction & Library | 0 (0.0%) | 2 (100.0%) |
| Arts, Media & Entertainment | 0 (0.0%) | 0 (0.0%) |
| Health Diagnosing & Treating | 0 (0.0%) | 2 (100.0%) |
| Health Technologists | 0 (0.0%) | 0 (0.0%) |
| Total (Category) | 0 (0.0%) | 26 (100.0%) |
| Total (Overall) | 64 (36.6%) | 111 (63.4%) |
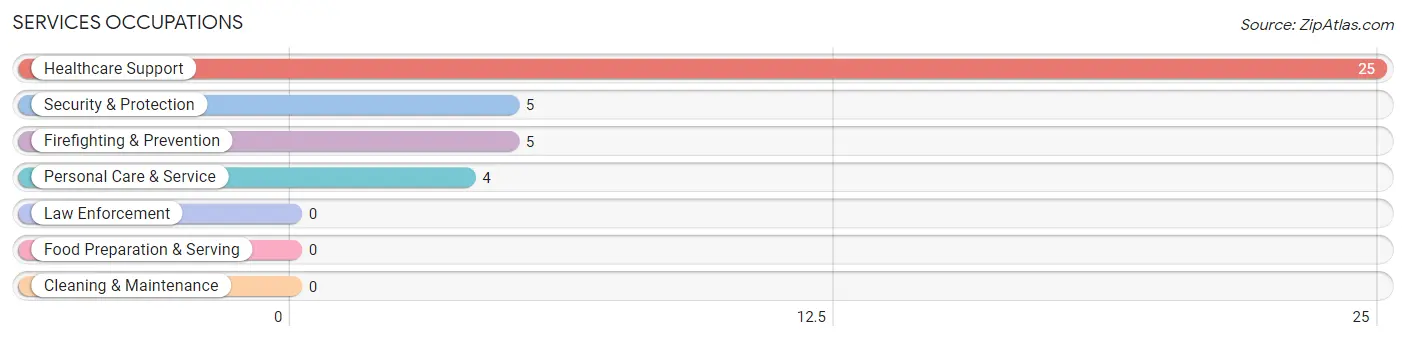
Services Occupations
The most common Services occupations in Brooksville are Healthcare Support (25 | 14.3%), Security & Protection (5 | 2.9%), Firefighting & Prevention (5 | 2.9%), and Personal Care & Service (4 | 2.3%).
Services Occupations by Sex
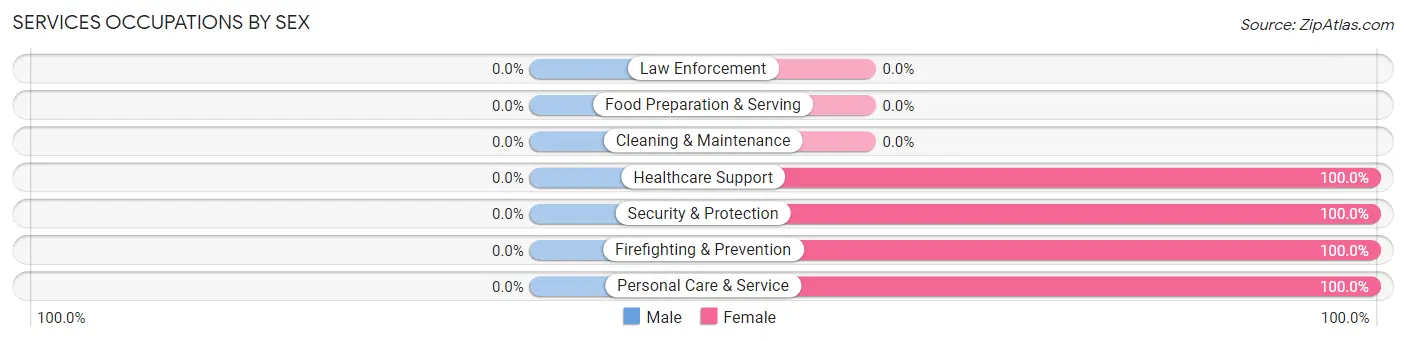
| Occupation | Male | Female |
| Healthcare Support | 0 (0.0%) | 25 (100.0%) |
| Security & Protection | 0 (0.0%) | 5 (100.0%) |
| Firefighting & Prevention | 0 (0.0%) | 5 (100.0%) |
| Law Enforcement | 0 (0.0%) | 0 (0.0%) |
| Food Preparation & Serving | 0 (0.0%) | 0 (0.0%) |
| Cleaning & Maintenance | 0 (0.0%) | 0 (0.0%) |
| Personal Care & Service | 0 (0.0%) | 4 (100.0%) |
| Total (Category) | 0 (0.0%) | 34 (100.0%) |
| Total (Overall) | 64 (36.6%) | 111 (63.4%) |
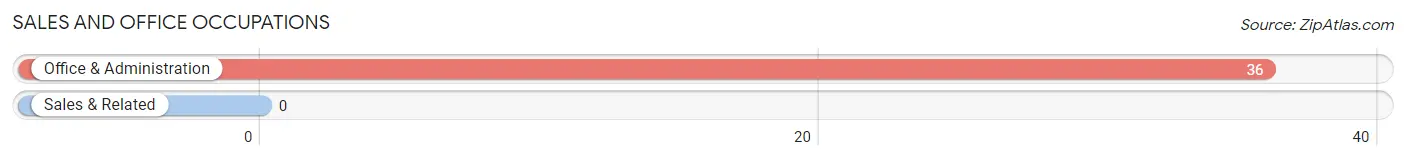
Sales and Office Occupations
The most common Sales and Office occupations in Brooksville are , and Office & Administration (36 | 20.6%).
Sales and Office Occupations by Sex
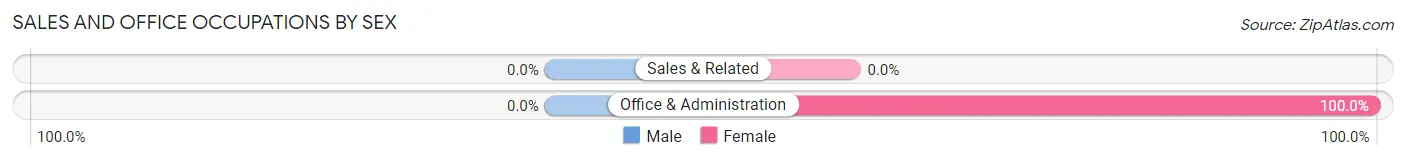
| Occupation | Male | Female |
| Sales & Related | 0 (0.0%) | 0 (0.0%) |
| Office & Administration | 0 (0.0%) | 36 (100.0%) |
| Total (Category) | 0 (0.0%) | 36 (100.0%) |
| Total (Overall) | 64 (36.6%) | 111 (63.4%) |
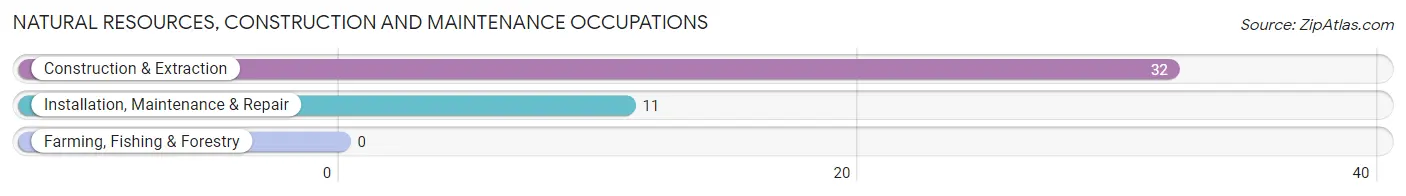
Natural Resources, Construction and Maintenance Occupations
The most common Natural Resources, Construction and Maintenance occupations in Brooksville are Construction & Extraction (32 | 18.3%), and Installation, Maintenance & Repair (11 | 6.3%).
Natural Resources, Construction and Maintenance Occupations by Sex
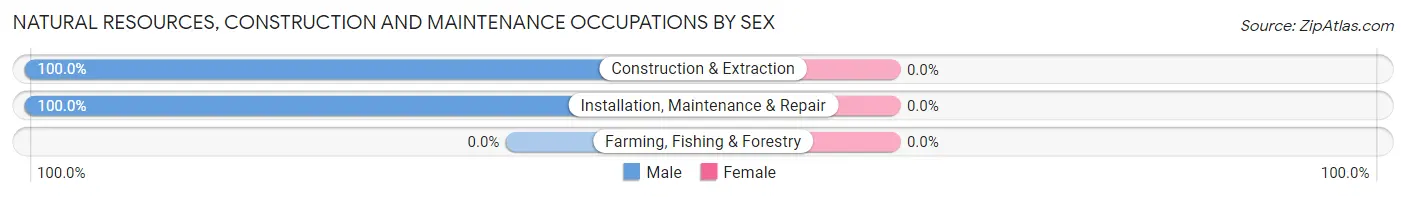
| Occupation | Male | Female |
| Farming, Fishing & Forestry | 0 (0.0%) | 0 (0.0%) |
| Construction & Extraction | 32 (100.0%) | 0 (0.0%) |
| Installation, Maintenance & Repair | 11 (100.0%) | 0 (0.0%) |
| Total (Category) | 43 (100.0%) | 0 (0.0%) |
| Total (Overall) | 64 (36.6%) | 111 (63.4%) |
Production, Transportation and Moving Occupations
The most common Production, Transportation and Moving occupations in Brooksville are Production (29 | 16.6%), and Transportation (7 | 4.0%).
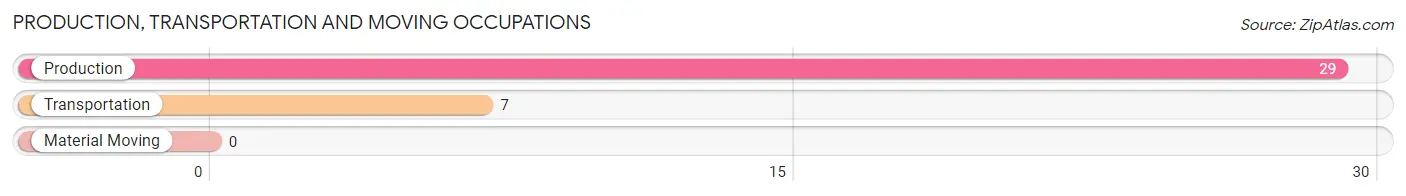
Production, Transportation and Moving Occupations by Sex
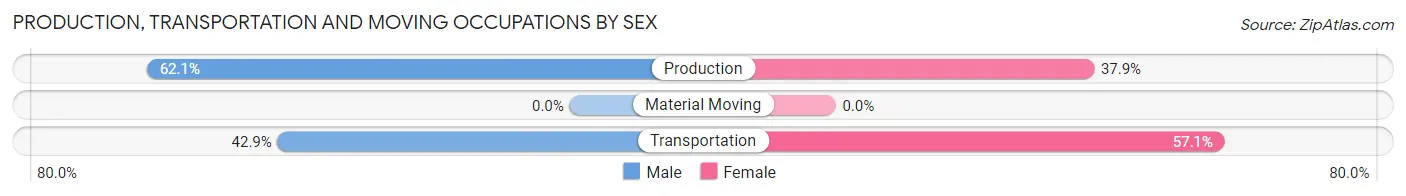
| Occupation | Male | Female |
| Production | 18 (62.1%) | 11 (37.9%) |
| Transportation | 3 (42.9%) | 4 (57.1%) |
| Material Moving | 0 (0.0%) | 0 (0.0%) |
| Total (Category) | 21 (58.3%) | 15 (41.7%) |
| Total (Overall) | 64 (36.6%) | 111 (63.4%) |
Employment Industries by Sex in Brooksville
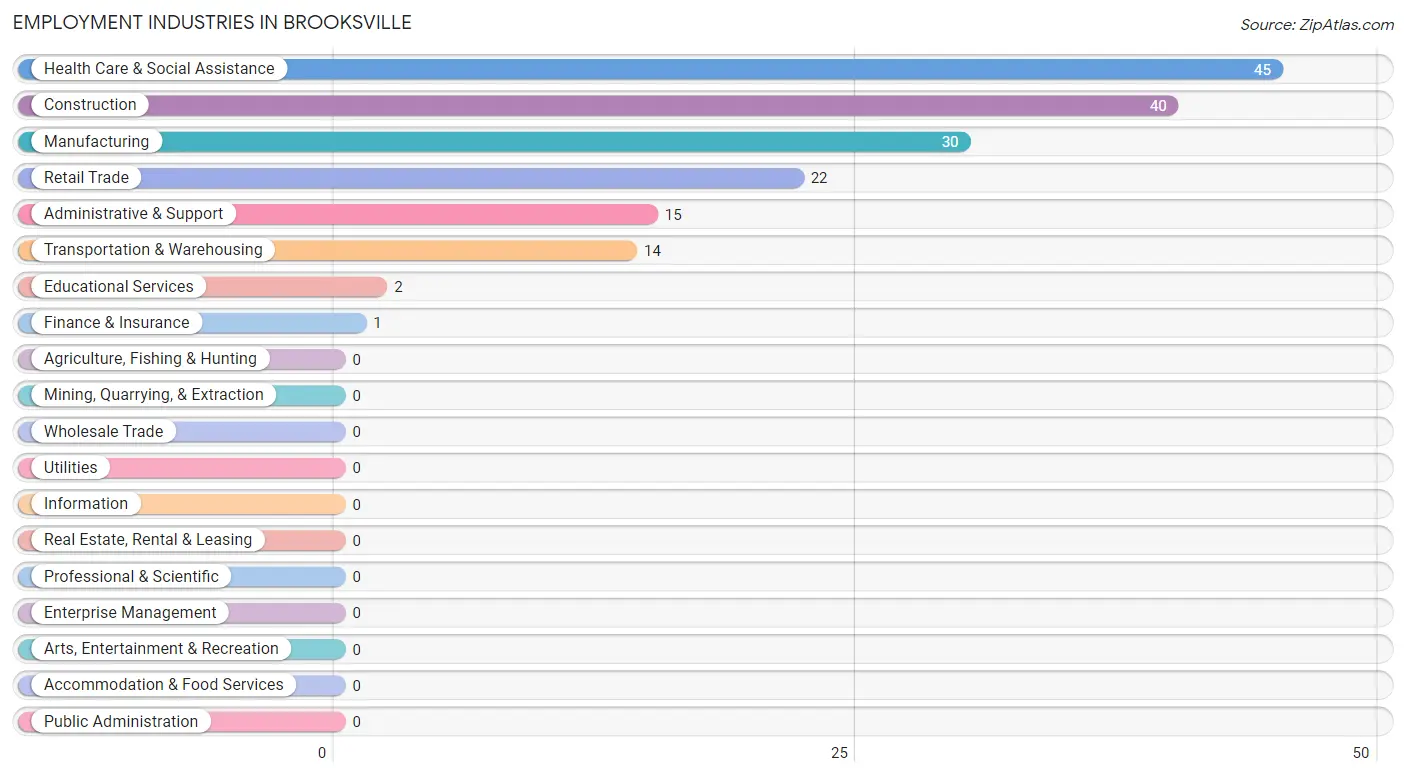
Employment Industries in Brooksville
The major employment industries in Brooksville include Health Care & Social Assistance (45 | 25.7%), Construction (40 | 22.9%), Manufacturing (30 | 17.1%), Retail Trade (22 | 12.6%), and Administrative & Support (15 | 8.6%).
Employment Industries by Sex in Brooksville
The Brooksville industries that see more men than women are Construction (100.0%), Transportation & Warehousing (71.4%), and Manufacturing (46.7%), whereas the industries that tend to have a higher number of women are Retail Trade (100.0%), Finance & Insurance (100.0%), and Administrative & Support (100.0%).
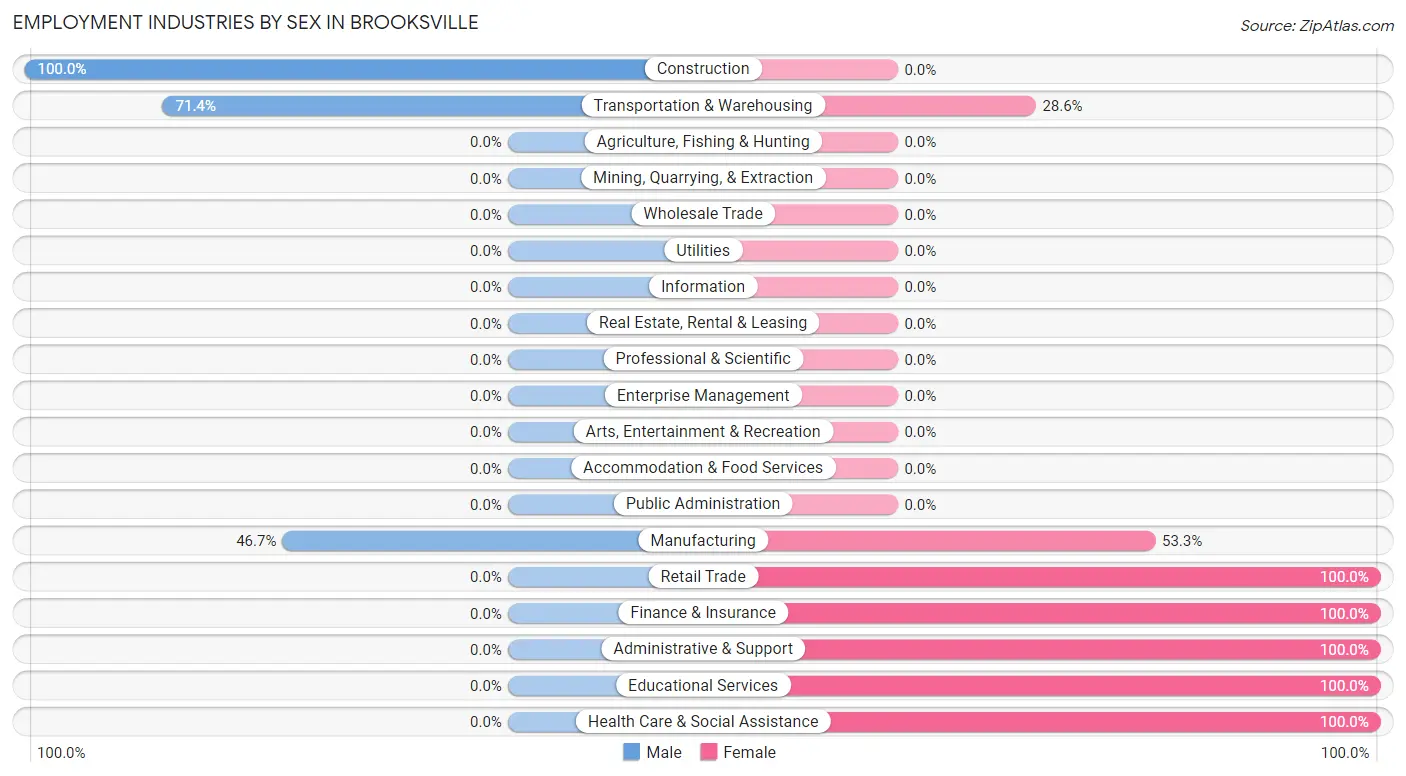
| Industry | Male | Female |
| Agriculture, Fishing & Hunting | 0 (0.0%) | 0 (0.0%) |
| Mining, Quarrying, & Extraction | 0 (0.0%) | 0 (0.0%) |
| Construction | 40 (100.0%) | 0 (0.0%) |
| Manufacturing | 14 (46.7%) | 16 (53.3%) |
| Wholesale Trade | 0 (0.0%) | 0 (0.0%) |
| Retail Trade | 0 (0.0%) | 22 (100.0%) |
| Transportation & Warehousing | 10 (71.4%) | 4 (28.6%) |
| Utilities | 0 (0.0%) | 0 (0.0%) |
| Information | 0 (0.0%) | 0 (0.0%) |
| Finance & Insurance | 0 (0.0%) | 1 (100.0%) |
| Real Estate, Rental & Leasing | 0 (0.0%) | 0 (0.0%) |
| Professional & Scientific | 0 (0.0%) | 0 (0.0%) |
| Enterprise Management | 0 (0.0%) | 0 (0.0%) |
| Administrative & Support | 0 (0.0%) | 15 (100.0%) |
| Educational Services | 0 (0.0%) | 2 (100.0%) |
| Health Care & Social Assistance | 0 (0.0%) | 45 (100.0%) |
| Arts, Entertainment & Recreation | 0 (0.0%) | 0 (0.0%) |
| Accommodation & Food Services | 0 (0.0%) | 0 (0.0%) |
| Public Administration | 0 (0.0%) | 0 (0.0%) |
| Total | 64 (36.6%) | 111 (63.4%) |
Education in Brooksville
School Enrollment in Brooksville
The most common levels of schooling among the 264 students in Brooksville are elementary school (86 | 32.6%), college / undergraduate (67 | 25.4%), and middle school (43 | 16.3%).
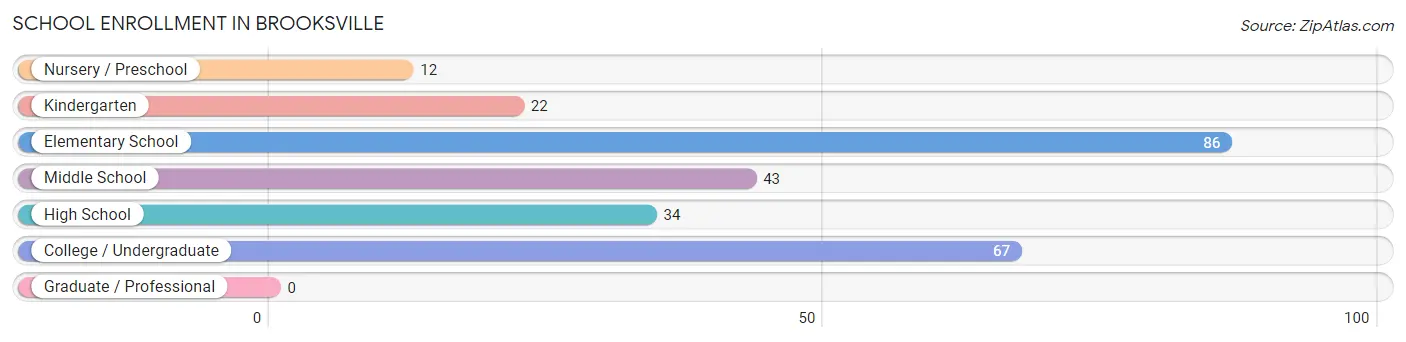
| School Level | # Students | % Students |
| Nursery / Preschool | 12 | 4.5% |
| Kindergarten | 22 | 8.3% |
| Elementary School | 86 | 32.6% |
| Middle School | 43 | 16.3% |
| High School | 34 | 12.9% |
| College / Undergraduate | 67 | 25.4% |
| Graduate / Professional | 0 | 0.0% |
| Total | 264 | 100.0% |
School Enrollment by Age by Funding Source in Brooksville
Out of a total of 264 students who are enrolled in schools in Brooksville, 4 (1.5%) attend a private institution, while the remaining 260 (98.5%) are enrolled in public schools. The age group of 5 to 9 year old has the highest likelihood of being enrolled in private schools, with 4 (5.3% in the age bracket) enrolled. Conversely, the age group of 3 to 4 year olds has the lowest likelihood of being enrolled in a private school, with 12 (100.0% in the age bracket) attending a public institution.
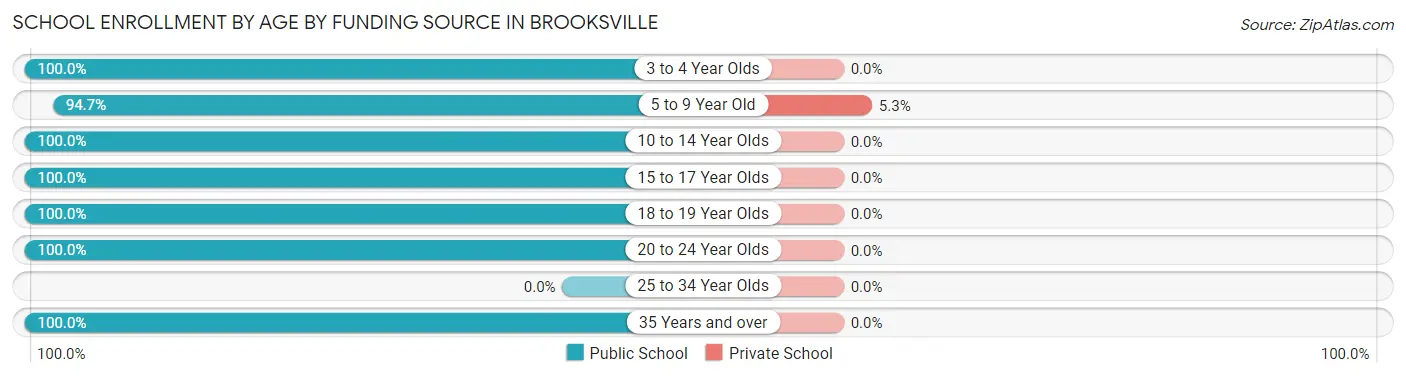
| Age Bracket | Public School | Private School |
| 3 to 4 Year Olds | 12 (100.0%) | 0 (0.0%) |
| 5 to 9 Year Old | 72 (94.7%) | 4 (5.3%) |
| 10 to 14 Year Olds | 75 (100.0%) | 0 (0.0%) |
| 15 to 17 Year Olds | 9 (100.0%) | 0 (0.0%) |
| 18 to 19 Year Olds | 67 (100.0%) | 0 (0.0%) |
| 20 to 24 Year Olds | 12 (100.0%) | 0 (0.0%) |
| 25 to 34 Year Olds | 0 (0.0%) | 0 (0.0%) |
| 35 Years and over | 13 (100.0%) | 0 (0.0%) |
| Total | 260 (98.5%) | 4 (1.5%) |
Educational Attainment by Field of Study in Brooksville
Business (32 | 76.2%), education (5 | 11.9%), and arts & humanities (5 | 11.9%) are the most common fields of study among 42 individuals in Brooksville who have obtained a bachelor's degree or higher.
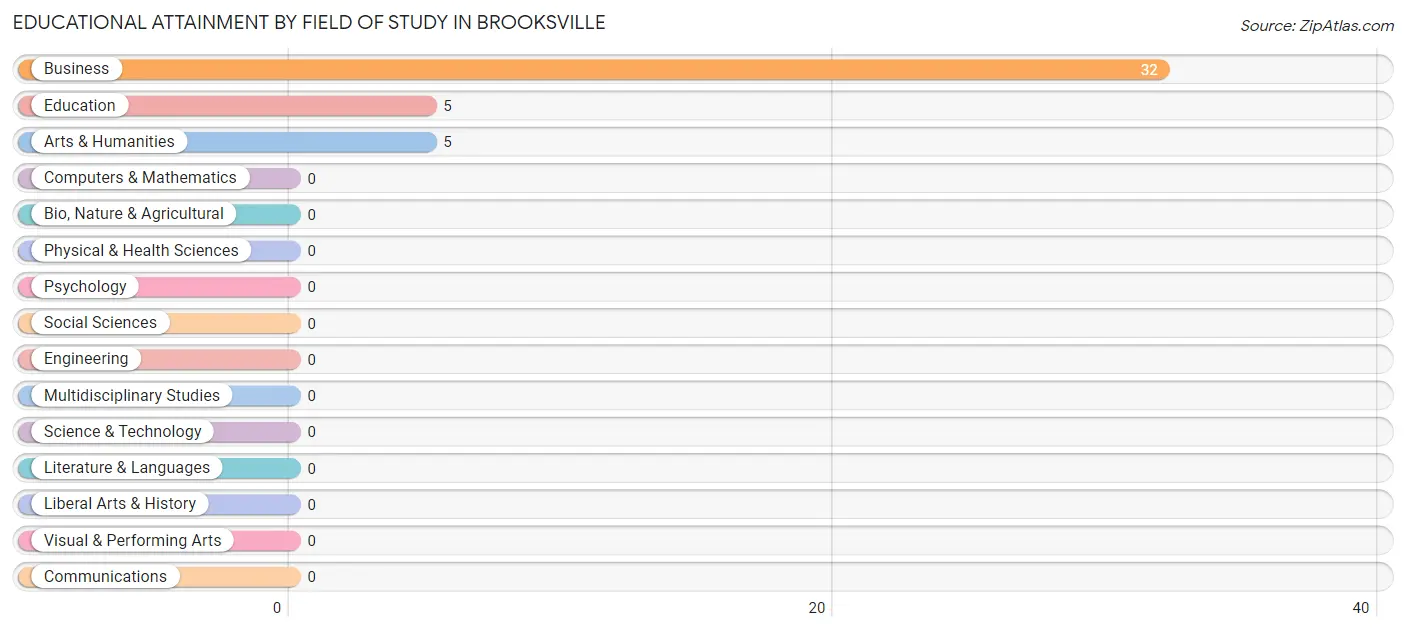
| Field of Study | # Graduates | % Graduates |
| Computers & Mathematics | 0 | 0.0% |
| Bio, Nature & Agricultural | 0 | 0.0% |
| Physical & Health Sciences | 0 | 0.0% |
| Psychology | 0 | 0.0% |
| Social Sciences | 0 | 0.0% |
| Engineering | 0 | 0.0% |
| Multidisciplinary Studies | 0 | 0.0% |
| Science & Technology | 0 | 0.0% |
| Business | 32 | 76.2% |
| Education | 5 | 11.9% |
| Literature & Languages | 0 | 0.0% |
| Liberal Arts & History | 0 | 0.0% |
| Visual & Performing Arts | 0 | 0.0% |
| Communications | 0 | 0.0% |
| Arts & Humanities | 5 | 11.9% |
| Total | 42 | 100.0% |
Transportation & Commute in Brooksville
Vehicle Availability by Sex in Brooksville
The most prevalent vehicle ownership categories in Brooksville are males with 3 vehicles (26, accounting for 51.0%) and females with 3 vehicles (47, making up 23.4%).
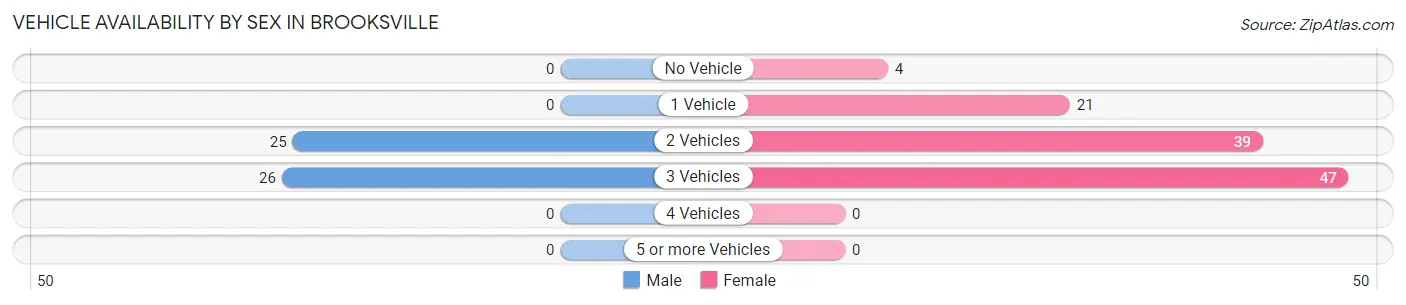
| Vehicles Available | Male | Female |
| No Vehicle | 0 (0.0%) | 4 (3.6%) |
| 1 Vehicle | 0 (0.0%) | 21 (18.9%) |
| 2 Vehicles | 25 (49.0%) | 39 (35.1%) |
| 3 Vehicles | 26 (51.0%) | 47 (42.3%) |
| 4 Vehicles | 0 (0.0%) | 0 (0.0%) |
| 5 or more Vehicles | 0 (0.0%) | 0 (0.0%) |
| Total | 51 (100.0%) | 111 (100.0%) |
Commute Time in Brooksville
The most frequently occuring commute durations in Brooksville are 30 to 34 minutes (48 commuters, 29.6%), 5 to 9 minutes (41 commuters, 25.3%), and 10 to 14 minutes (25 commuters, 15.4%).
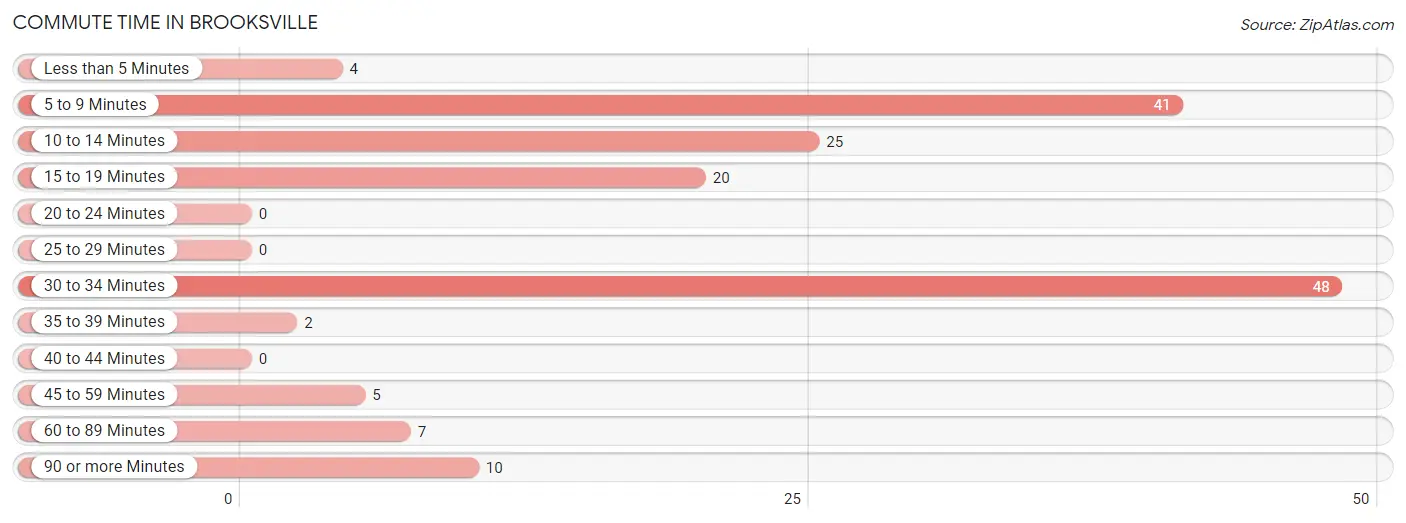
| Commute Time | # Commuters | % Commuters |
| Less than 5 Minutes | 4 | 2.5% |
| 5 to 9 Minutes | 41 | 25.3% |
| 10 to 14 Minutes | 25 | 15.4% |
| 15 to 19 Minutes | 20 | 12.3% |
| 20 to 24 Minutes | 0 | 0.0% |
| 25 to 29 Minutes | 0 | 0.0% |
| 30 to 34 Minutes | 48 | 29.6% |
| 35 to 39 Minutes | 2 | 1.2% |
| 40 to 44 Minutes | 0 | 0.0% |
| 45 to 59 Minutes | 5 | 3.1% |
| 60 to 89 Minutes | 7 | 4.3% |
| 90 or more Minutes | 10 | 6.2% |
Commute Time by Sex in Brooksville
The most common commute times in Brooksville are 30 to 34 minutes (17 commuters, 33.3%) for males and 30 to 34 minutes (31 commuters, 27.9%) for females.
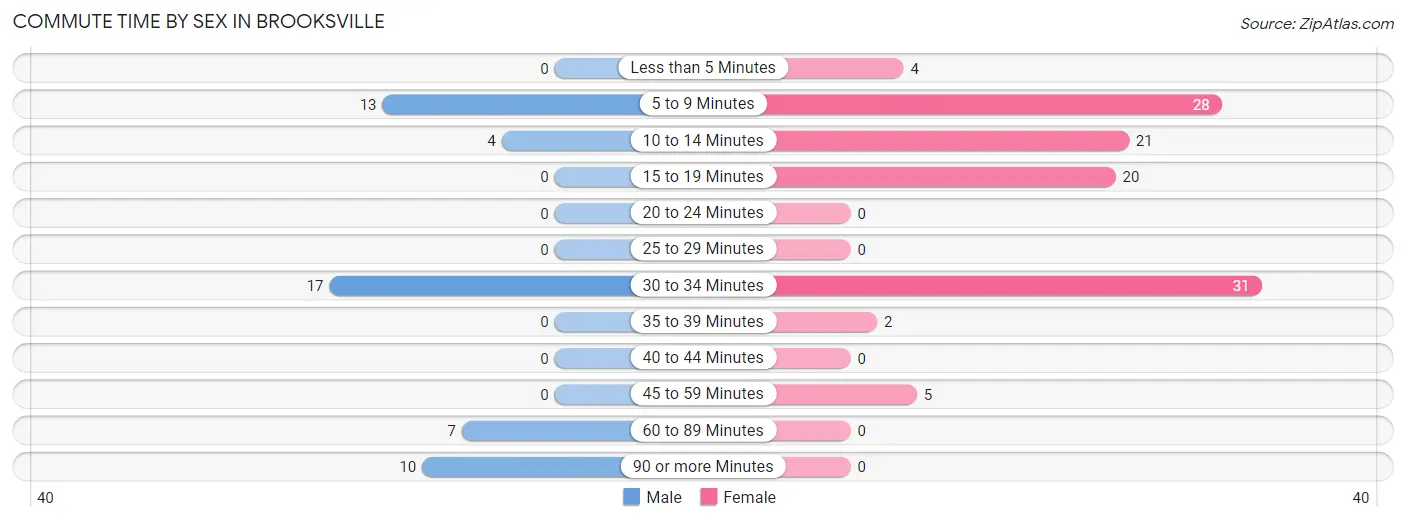
| Commute Time | Male | Female |
| Less than 5 Minutes | 0 (0.0%) | 4 (3.6%) |
| 5 to 9 Minutes | 13 (25.5%) | 28 (25.2%) |
| 10 to 14 Minutes | 4 (7.8%) | 21 (18.9%) |
| 15 to 19 Minutes | 0 (0.0%) | 20 (18.0%) |
| 20 to 24 Minutes | 0 (0.0%) | 0 (0.0%) |
| 25 to 29 Minutes | 0 (0.0%) | 0 (0.0%) |
| 30 to 34 Minutes | 17 (33.3%) | 31 (27.9%) |
| 35 to 39 Minutes | 0 (0.0%) | 2 (1.8%) |
| 40 to 44 Minutes | 0 (0.0%) | 0 (0.0%) |
| 45 to 59 Minutes | 0 (0.0%) | 5 (4.5%) |
| 60 to 89 Minutes | 7 (13.7%) | 0 (0.0%) |
| 90 or more Minutes | 10 (19.6%) | 0 (0.0%) |
Time of Departure to Work by Sex in Brooksville
The most frequent times of departure to work in Brooksville are 12:00 AM to 4:59 AM (18, 35.3%) for males and 7:00 AM to 7:29 AM (41, 36.9%) for females.
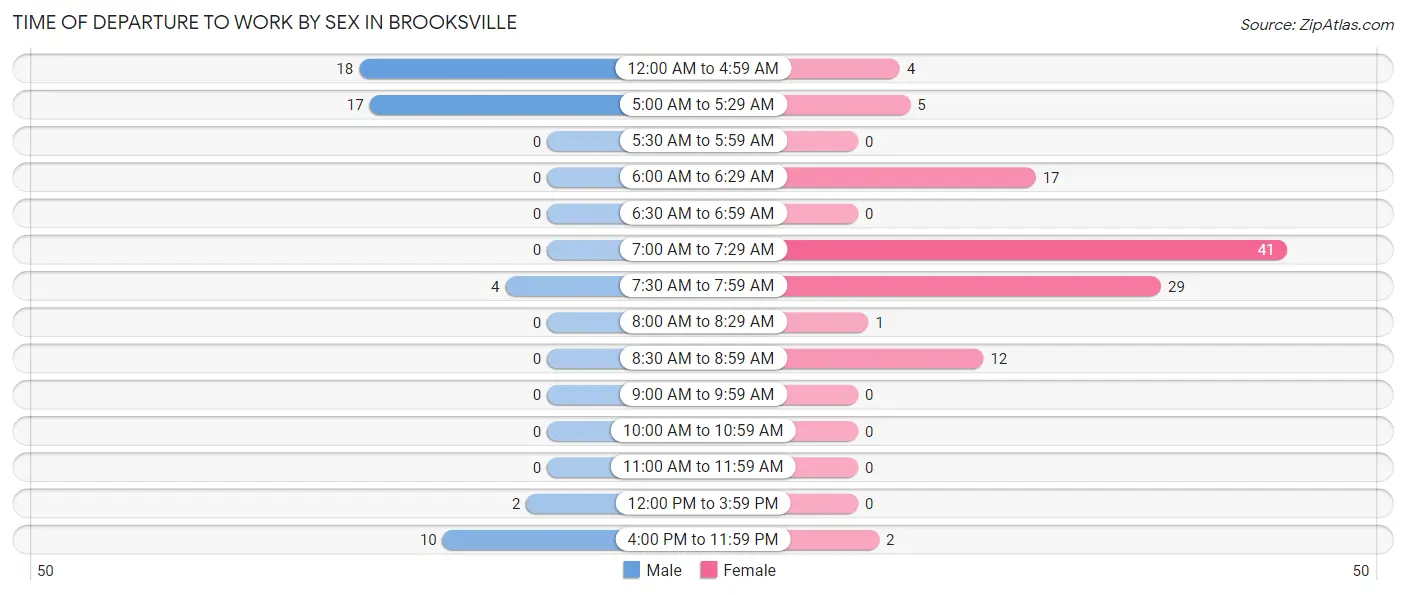
| Time of Departure | Male | Female |
| 12:00 AM to 4:59 AM | 18 (35.3%) | 4 (3.6%) |
| 5:00 AM to 5:29 AM | 17 (33.3%) | 5 (4.5%) |
| 5:30 AM to 5:59 AM | 0 (0.0%) | 0 (0.0%) |
| 6:00 AM to 6:29 AM | 0 (0.0%) | 17 (15.3%) |
| 6:30 AM to 6:59 AM | 0 (0.0%) | 0 (0.0%) |
| 7:00 AM to 7:29 AM | 0 (0.0%) | 41 (36.9%) |
| 7:30 AM to 7:59 AM | 4 (7.8%) | 29 (26.1%) |
| 8:00 AM to 8:29 AM | 0 (0.0%) | 1 (0.9%) |
| 8:30 AM to 8:59 AM | 0 (0.0%) | 12 (10.8%) |
| 9:00 AM to 9:59 AM | 0 (0.0%) | 0 (0.0%) |
| 10:00 AM to 10:59 AM | 0 (0.0%) | 0 (0.0%) |
| 11:00 AM to 11:59 AM | 0 (0.0%) | 0 (0.0%) |
| 12:00 PM to 3:59 PM | 2 (3.9%) | 0 (0.0%) |
| 4:00 PM to 11:59 PM | 10 (19.6%) | 2 (1.8%) |
| Total | 51 (100.0%) | 111 (100.0%) |
Housing Occupancy in Brooksville
Occupancy by Ownership in Brooksville
Of the total 298 dwellings in Brooksville, owner-occupied units account for 198 (66.4%), while renter-occupied units make up 100 (33.6%).
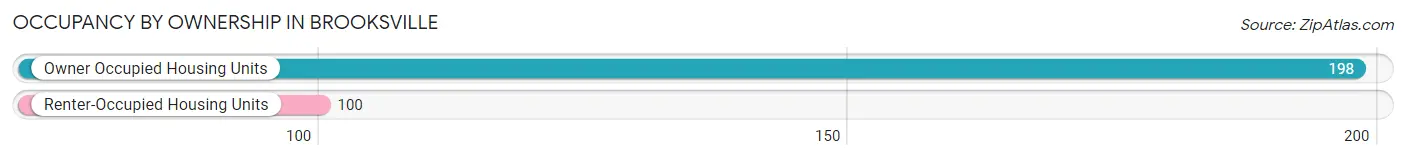
| Occupancy | # Housing Units | % Housing Units |
| Owner Occupied Housing Units | 198 | 66.4% |
| Renter-Occupied Housing Units | 100 | 33.6% |
| Total Occupied Housing Units | 298 | 100.0% |
Occupancy by Household Size in Brooksville
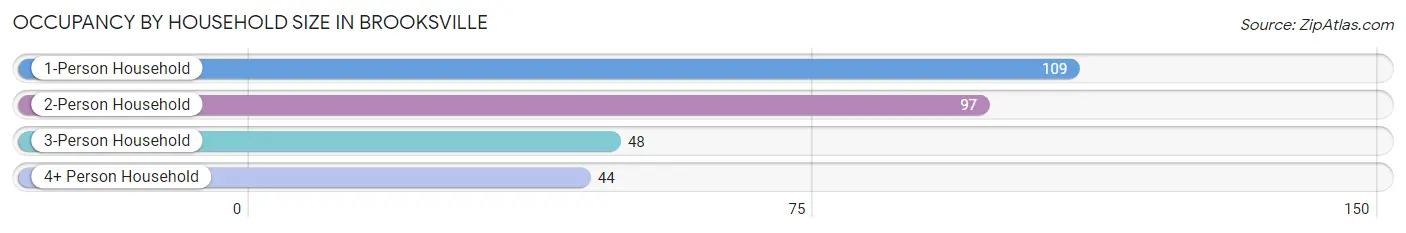
| Household Size | # Housing Units | % Housing Units |
| 1-Person Household | 109 | 36.6% |
| 2-Person Household | 97 | 32.6% |
| 3-Person Household | 48 | 16.1% |
| 4+ Person Household | 44 | 14.8% |
| Total Housing Units | 298 | 100.0% |
Occupancy by Ownership by Household Size in Brooksville
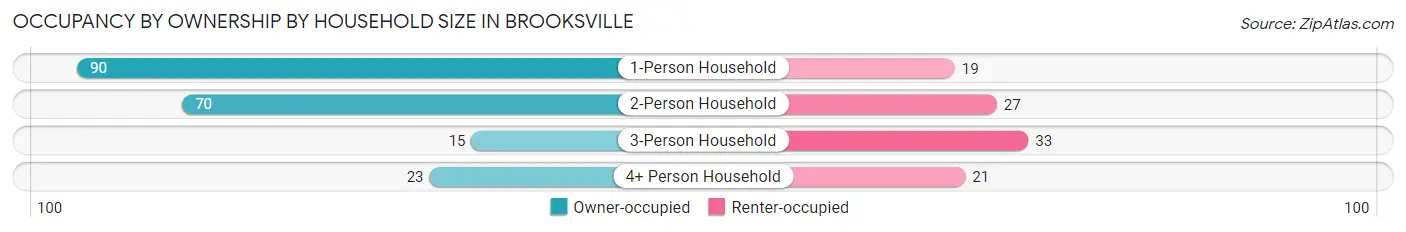
| Household Size | Owner-occupied | Renter-occupied |
| 1-Person Household | 90 (82.6%) | 19 (17.4%) |
| 2-Person Household | 70 (72.2%) | 27 (27.8%) |
| 3-Person Household | 15 (31.2%) | 33 (68.8%) |
| 4+ Person Household | 23 (52.3%) | 21 (47.7%) |
| Total Housing Units | 198 (66.4%) | 100 (33.6%) |
Occupancy by Educational Attainment in Brooksville
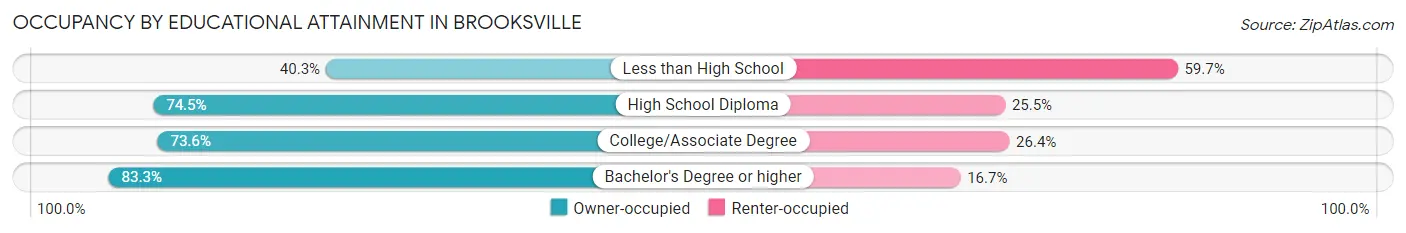
| Household Size | Owner-occupied | Renter-occupied |
| Less than High School | 31 (40.3%) | 46 (59.7%) |
| High School Diploma | 70 (74.5%) | 24 (25.5%) |
| College/Associate Degree | 67 (73.6%) | 24 (26.4%) |
| Bachelor's Degree or higher | 30 (83.3%) | 6 (16.7%) |
Occupancy by Age of Householder in Brooksville
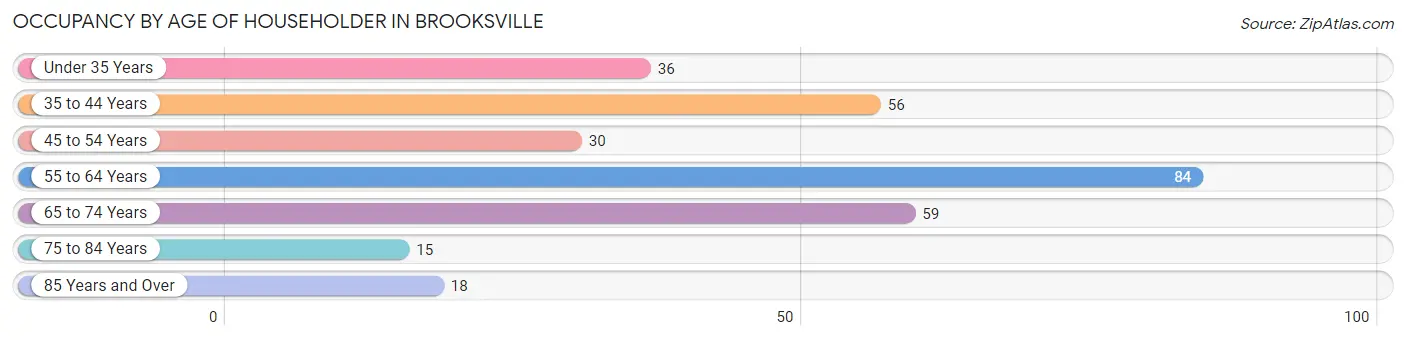
| Age Bracket | # Households | % Households |
| Under 35 Years | 36 | 12.1% |
| 35 to 44 Years | 56 | 18.8% |
| 45 to 54 Years | 30 | 10.1% |
| 55 to 64 Years | 84 | 28.2% |
| 65 to 74 Years | 59 | 19.8% |
| 75 to 84 Years | 15 | 5.0% |
| 85 Years and Over | 18 | 6.0% |
| Total | 298 | 100.0% |
Housing Finances in Brooksville
Median Income by Occupancy in Brooksville
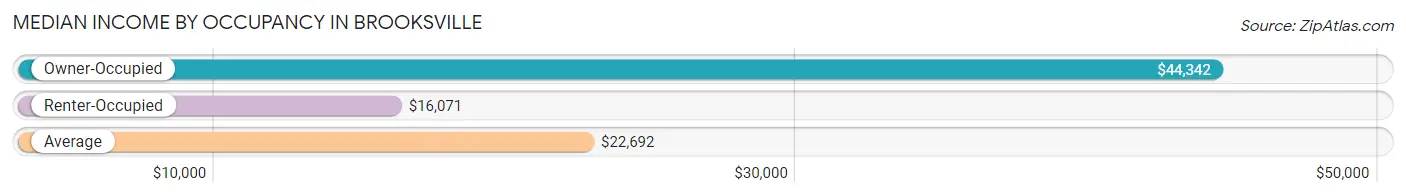
| Occupancy Type | # Households | Median Income |
| Owner-Occupied | 198 (66.4%) | $44,342 |
| Renter-Occupied | 100 (33.6%) | $16,071 |
| Average | 298 (100.0%) | $22,692 |
Occupancy by Householder Income Bracket in Brooksville
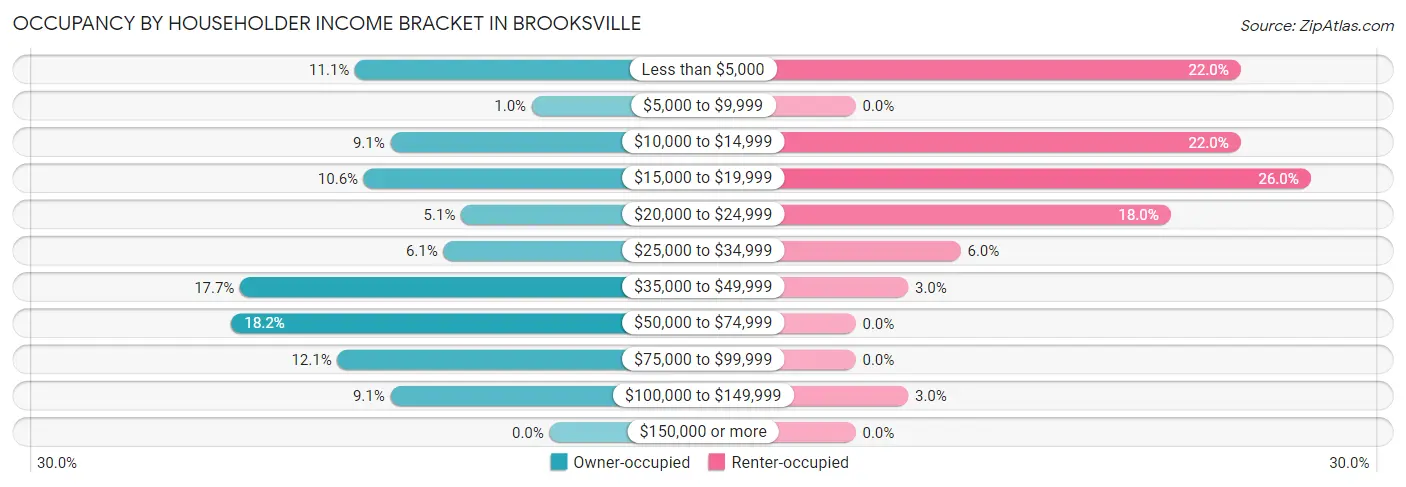
| Income Bracket | Owner-occupied | Renter-occupied |
| Less than $5,000 | 22 (11.1%) | 22 (22.0%) |
| $5,000 to $9,999 | 2 (1.0%) | 0 (0.0%) |
| $10,000 to $14,999 | 18 (9.1%) | 22 (22.0%) |
| $15,000 to $19,999 | 21 (10.6%) | 26 (26.0%) |
| $20,000 to $24,999 | 10 (5.1%) | 18 (18.0%) |
| $25,000 to $34,999 | 12 (6.1%) | 6 (6.0%) |
| $35,000 to $49,999 | 35 (17.7%) | 3 (3.0%) |
| $50,000 to $74,999 | 36 (18.2%) | 0 (0.0%) |
| $75,000 to $99,999 | 24 (12.1%) | 0 (0.0%) |
| $100,000 to $149,999 | 18 (9.1%) | 3 (3.0%) |
| $150,000 or more | 0 (0.0%) | 0 (0.0%) |
| Total | 198 (100.0%) | 100 (100.0%) |
Monthly Housing Cost Tiers in Brooksville
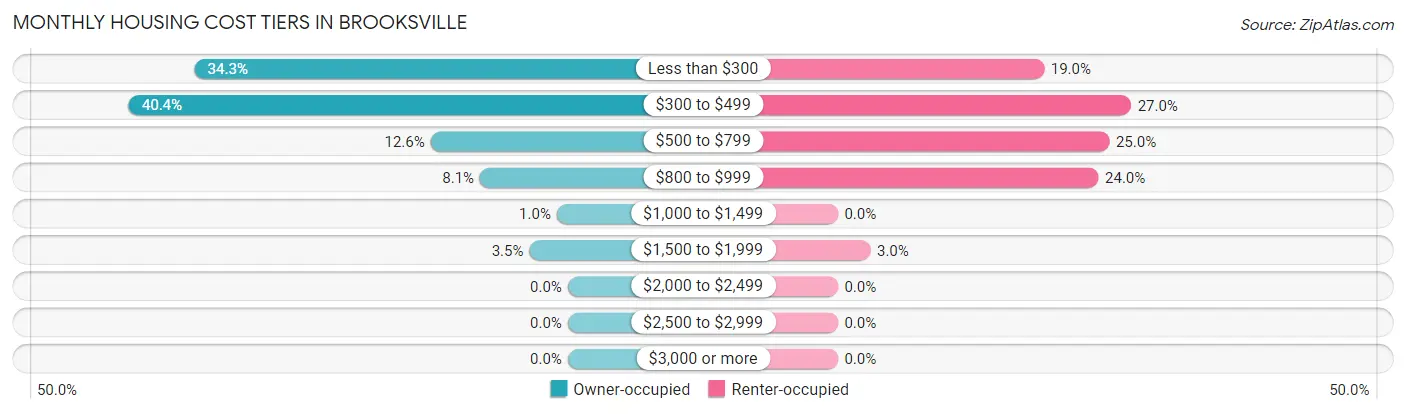
| Monthly Cost | Owner-occupied | Renter-occupied |
| Less than $300 | 68 (34.3%) | 19 (19.0%) |
| $300 to $499 | 80 (40.4%) | 27 (27.0%) |
| $500 to $799 | 25 (12.6%) | 25 (25.0%) |
| $800 to $999 | 16 (8.1%) | 24 (24.0%) |
| $1,000 to $1,499 | 2 (1.0%) | 0 (0.0%) |
| $1,500 to $1,999 | 7 (3.5%) | 3 (3.0%) |
| $2,000 to $2,499 | 0 (0.0%) | 0 (0.0%) |
| $2,500 to $2,999 | 0 (0.0%) | 0 (0.0%) |
| $3,000 or more | 0 (0.0%) | 0 (0.0%) |
| Total | 198 (100.0%) | 100 (100.0%) |
Physical Housing Characteristics in Brooksville
Housing Structures in Brooksville
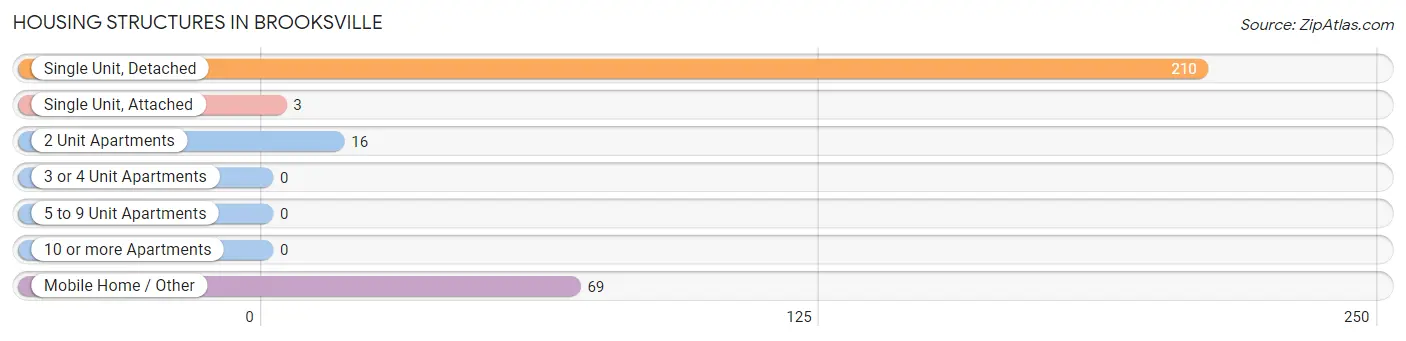
| Structure Type | # Housing Units | % Housing Units |
| Single Unit, Detached | 210 | 70.5% |
| Single Unit, Attached | 3 | 1.0% |
| 2 Unit Apartments | 16 | 5.4% |
| 3 or 4 Unit Apartments | 0 | 0.0% |
| 5 to 9 Unit Apartments | 0 | 0.0% |
| 10 or more Apartments | 0 | 0.0% |
| Mobile Home / Other | 69 | 23.2% |
| Total | 298 | 100.0% |
Housing Structures by Occupancy in Brooksville
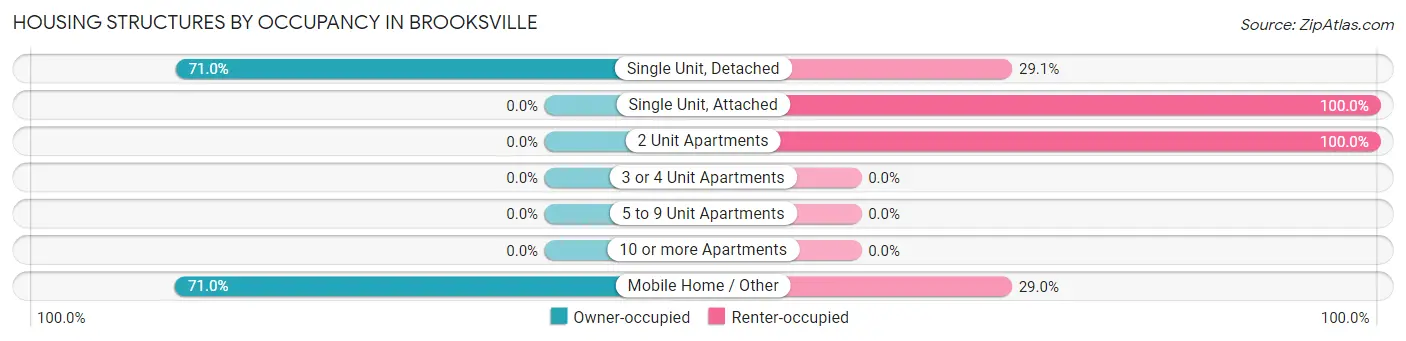
| Structure Type | Owner-occupied | Renter-occupied |
| Single Unit, Detached | 149 (71.0%) | 61 (29.0%) |
| Single Unit, Attached | 0 (0.0%) | 3 (100.0%) |
| 2 Unit Apartments | 0 (0.0%) | 16 (100.0%) |
| 3 or 4 Unit Apartments | 0 (0.0%) | 0 (0.0%) |
| 5 to 9 Unit Apartments | 0 (0.0%) | 0 (0.0%) |
| 10 or more Apartments | 0 (0.0%) | 0 (0.0%) |
| Mobile Home / Other | 49 (71.0%) | 20 (29.0%) |
| Total | 198 (66.4%) | 100 (33.6%) |
Housing Structures by Number of Rooms in Brooksville
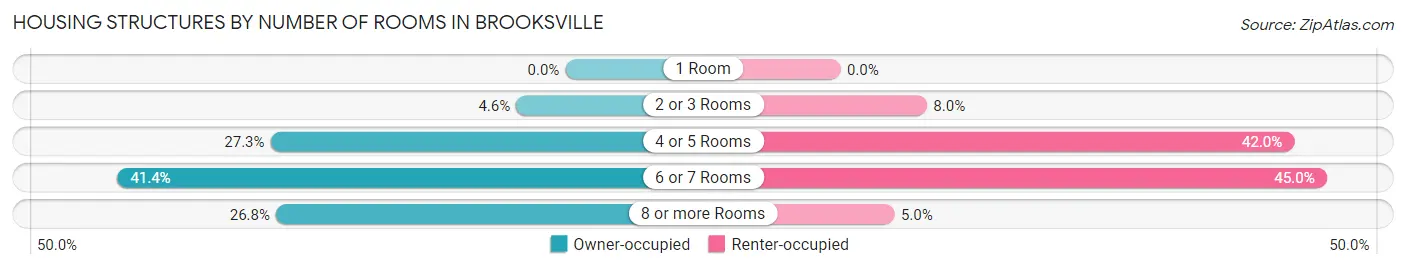
| Number of Rooms | Owner-occupied | Renter-occupied |
| 1 Room | 0 (0.0%) | 0 (0.0%) |
| 2 or 3 Rooms | 9 (4.5%) | 8 (8.0%) |
| 4 or 5 Rooms | 54 (27.3%) | 42 (42.0%) |
| 6 or 7 Rooms | 82 (41.4%) | 45 (45.0%) |
| 8 or more Rooms | 53 (26.8%) | 5 (5.0%) |
| Total | 198 (100.0%) | 100 (100.0%) |
Housing Structure by Heating Type in Brooksville
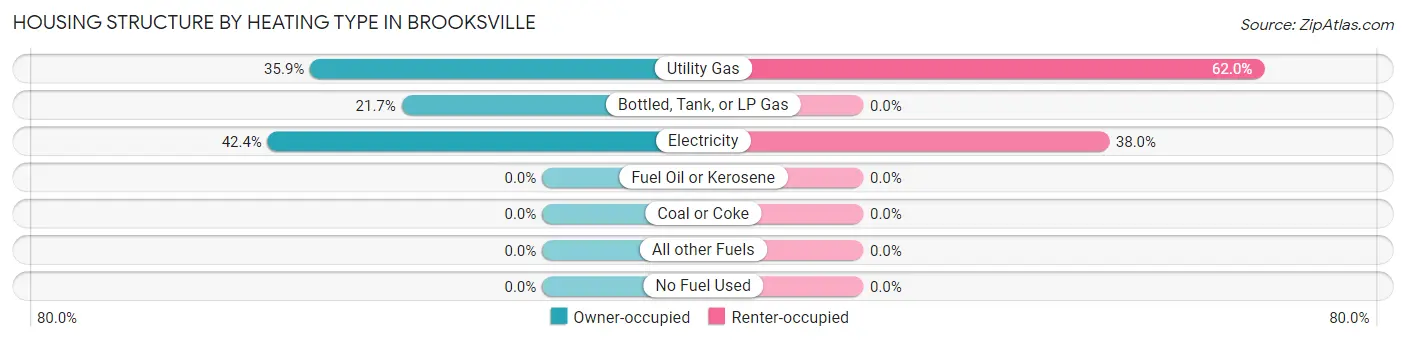
| Heating Type | Owner-occupied | Renter-occupied |
| Utility Gas | 71 (35.9%) | 62 (62.0%) |
| Bottled, Tank, or LP Gas | 43 (21.7%) | 0 (0.0%) |
| Electricity | 84 (42.4%) | 38 (38.0%) |
| Fuel Oil or Kerosene | 0 (0.0%) | 0 (0.0%) |
| Coal or Coke | 0 (0.0%) | 0 (0.0%) |
| All other Fuels | 0 (0.0%) | 0 (0.0%) |
| No Fuel Used | 0 (0.0%) | 0 (0.0%) |
| Total | 198 (100.0%) | 100 (100.0%) |
Household Vehicle Usage in Brooksville
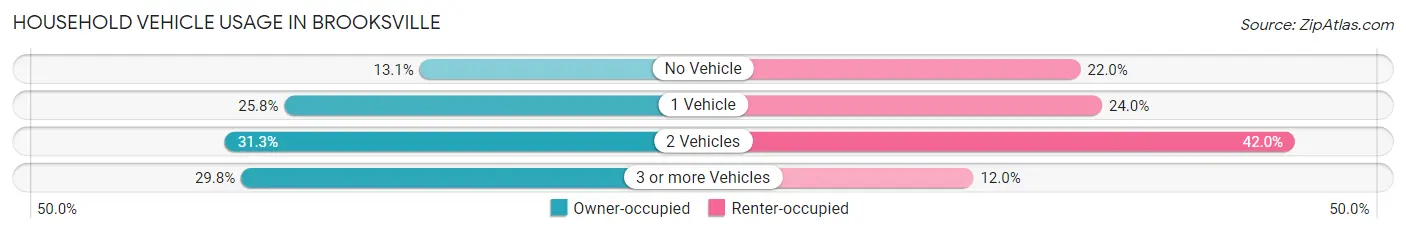
| Vehicles per Household | Owner-occupied | Renter-occupied |
| No Vehicle | 26 (13.1%) | 22 (22.0%) |
| 1 Vehicle | 51 (25.8%) | 24 (24.0%) |
| 2 Vehicles | 62 (31.3%) | 42 (42.0%) |
| 3 or more Vehicles | 59 (29.8%) | 12 (12.0%) |
| Total | 198 (100.0%) | 100 (100.0%) |
Real Estate & Mortgages in Brooksville
Real Estate and Mortgage Overview in Brooksville
| Characteristic | Without Mortgage | With Mortgage |
| Housing Units | 168 | 30 |
| Median Property Value | $57,100 | $89,100 |
| Median Household Income | $42,632 | $0 |
| Monthly Housing Costs | $329 | $0 |
| Real Estate Taxes | $872 | $11 |
Property Value by Mortgage Status in Brooksville
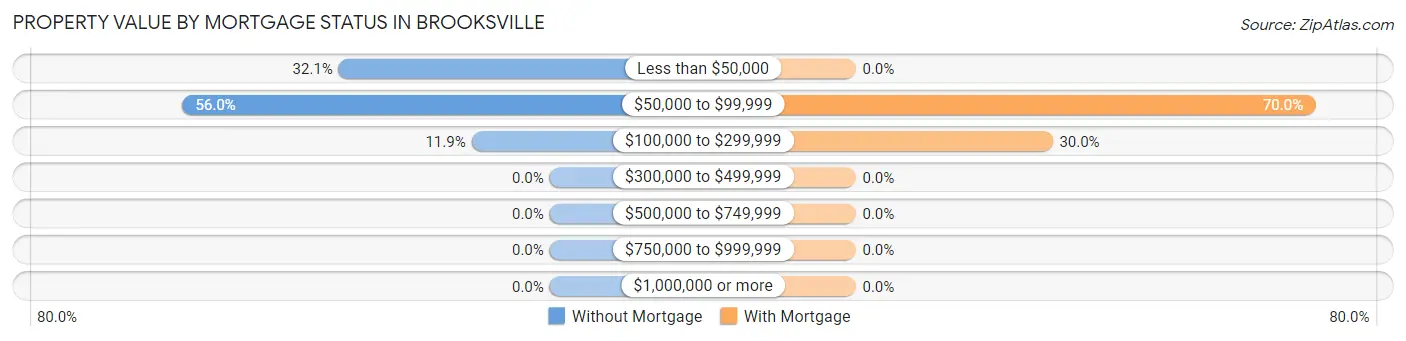
| Property Value | Without Mortgage | With Mortgage |
| Less than $50,000 | 54 (32.1%) | 0 (0.0%) |
| $50,000 to $99,999 | 94 (55.9%) | 21 (70.0%) |
| $100,000 to $299,999 | 20 (11.9%) | 9 (30.0%) |
| $300,000 to $499,999 | 0 (0.0%) | 0 (0.0%) |
| $500,000 to $749,999 | 0 (0.0%) | 0 (0.0%) |
| $750,000 to $999,999 | 0 (0.0%) | 0 (0.0%) |
| $1,000,000 or more | 0 (0.0%) | 0 (0.0%) |
| Total | 168 (100.0%) | 30 (100.0%) |
Household Income by Mortgage Status in Brooksville
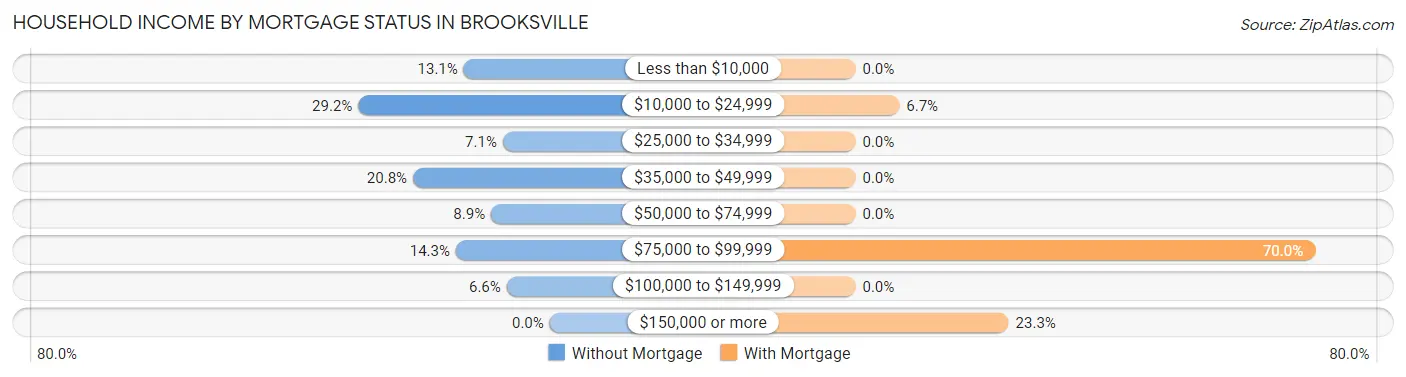
| Household Income | Without Mortgage | With Mortgage |
| Less than $10,000 | 22 (13.1%) | 0 (0.0%) |
| $10,000 to $24,999 | 49 (29.2%) | 2 (6.7%) |
| $25,000 to $34,999 | 12 (7.1%) | 0 (0.0%) |
| $35,000 to $49,999 | 35 (20.8%) | 0 (0.0%) |
| $50,000 to $74,999 | 15 (8.9%) | 0 (0.0%) |
| $75,000 to $99,999 | 24 (14.3%) | 21 (70.0%) |
| $100,000 to $149,999 | 11 (6.6%) | 0 (0.0%) |
| $150,000 or more | 0 (0.0%) | 7 (23.3%) |
| Total | 168 (100.0%) | 30 (100.0%) |
Property Value to Household Income Ratio in Brooksville
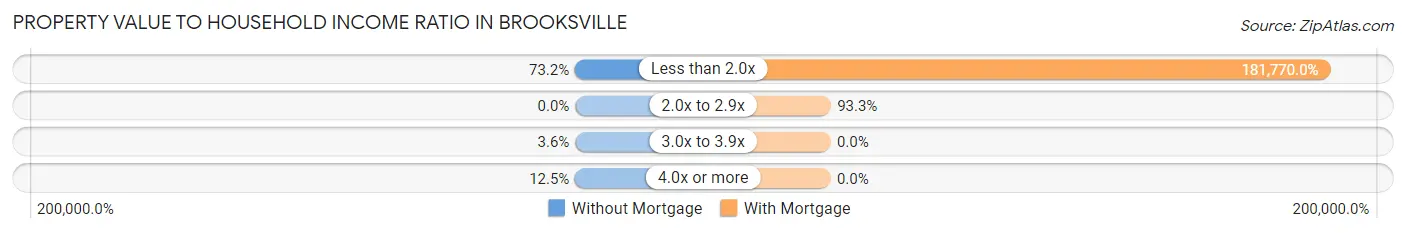
| Value-to-Income Ratio | Without Mortgage | With Mortgage |
| Less than 2.0x | 123 (73.2%) | 54,531 (181,770.0%) |
| 2.0x to 2.9x | 0 (0.0%) | 28 (93.3%) |
| 3.0x to 3.9x | 6 (3.6%) | 0 (0.0%) |
| 4.0x or more | 21 (12.5%) | 0 (0.0%) |
| Total | 168 (100.0%) | 30 (100.0%) |
Real Estate Taxes by Mortgage Status in Brooksville
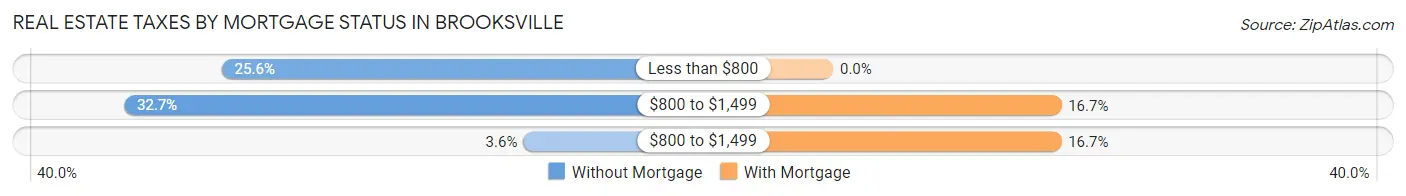
| Property Taxes | Without Mortgage | With Mortgage |
| Less than $800 | 43 (25.6%) | 0 (0.0%) |
| $800 to $1,499 | 55 (32.7%) | 5 (16.7%) |
| $800 to $1,499 | 6 (3.6%) | 5 (16.7%) |
| Total | 168 (100.0%) | 30 (100.0%) |
Health & Disability in Brooksville
Health Insurance Coverage by Age in Brooksville
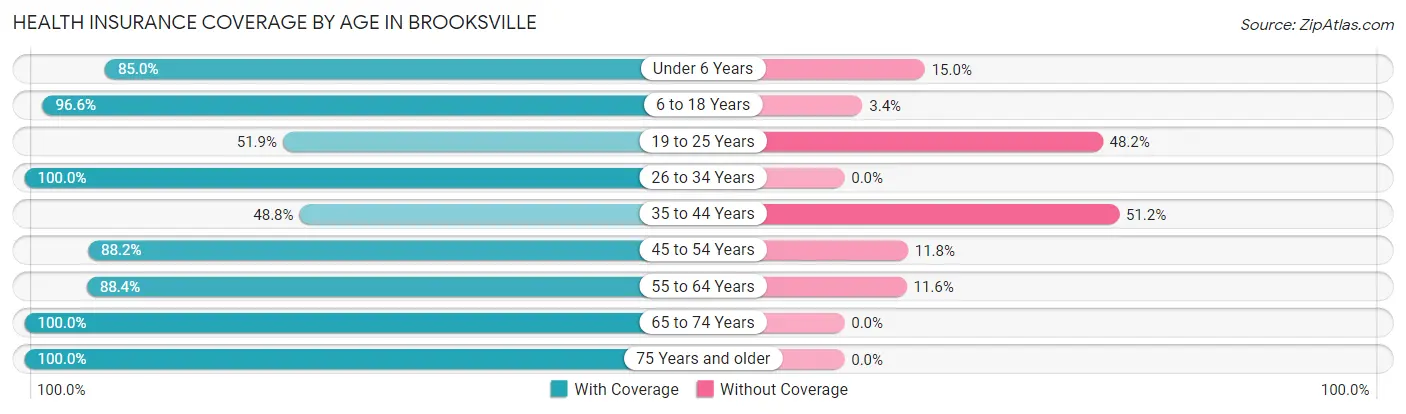
| Age Bracket | With Coverage | Without Coverage |
| Under 6 Years | 51 (85.0%) | 9 (15.0%) |
| 6 to 18 Years | 172 (96.6%) | 6 (3.4%) |
| 19 to 25 Years | 42 (51.8%) | 39 (48.1%) |
| 26 to 34 Years | 31 (100.0%) | 0 (0.0%) |
| 35 to 44 Years | 59 (48.8%) | 62 (51.2%) |
| 45 to 54 Years | 67 (88.2%) | 9 (11.8%) |
| 55 to 64 Years | 99 (88.4%) | 13 (11.6%) |
| 65 to 74 Years | 84 (100.0%) | 0 (0.0%) |
| 75 Years and older | 50 (100.0%) | 0 (0.0%) |
| Total | 655 (82.6%) | 138 (17.4%) |
Health Insurance Coverage by Citizenship Status in Brooksville
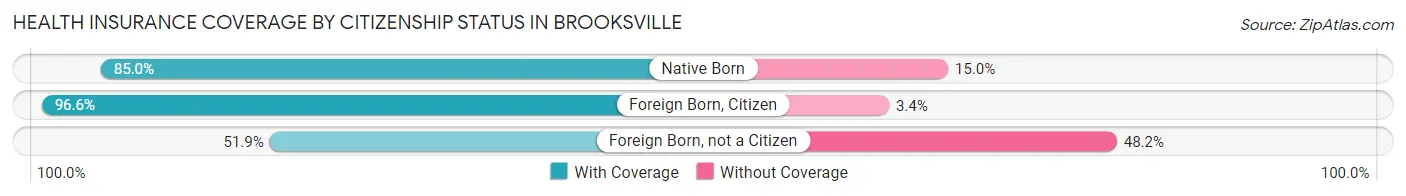
| Citizenship Status | With Coverage | Without Coverage |
| Native Born | 51 (85.0%) | 9 (15.0%) |
| Foreign Born, Citizen | 172 (96.6%) | 6 (3.4%) |
| Foreign Born, not a Citizen | 42 (51.8%) | 39 (48.1%) |
Health Insurance Coverage by Household Income in Brooksville
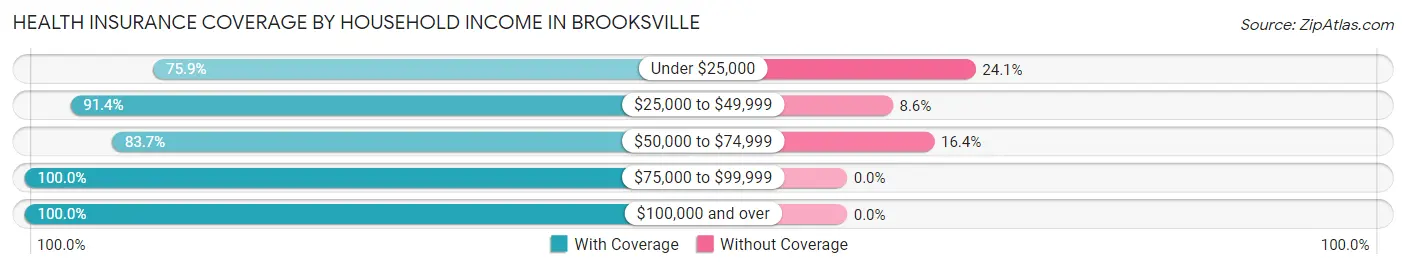
| Household Income | With Coverage | Without Coverage |
| Under $25,000 | 334 (75.9%) | 106 (24.1%) |
| $25,000 to $49,999 | 160 (91.4%) | 15 (8.6%) |
| $50,000 to $74,999 | 87 (83.7%) | 17 (16.4%) |
| $75,000 to $99,999 | 39 (100.0%) | 0 (0.0%) |
| $100,000 and over | 35 (100.0%) | 0 (0.0%) |
Public vs Private Health Insurance Coverage by Age in Brooksville
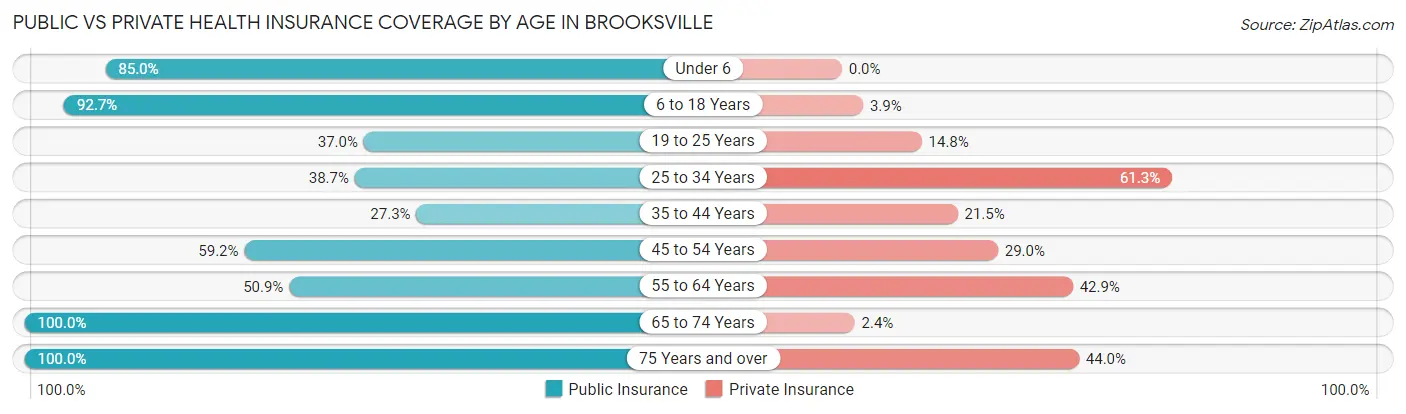
| Age Bracket | Public Insurance | Private Insurance |
| Under 6 | 51 (85.0%) | 0 (0.0%) |
| 6 to 18 Years | 165 (92.7%) | 7 (3.9%) |
| 19 to 25 Years | 30 (37.0%) | 12 (14.8%) |
| 25 to 34 Years | 12 (38.7%) | 19 (61.3%) |
| 35 to 44 Years | 33 (27.3%) | 26 (21.5%) |
| 45 to 54 Years | 45 (59.2%) | 22 (28.9%) |
| 55 to 64 Years | 57 (50.9%) | 48 (42.9%) |
| 65 to 74 Years | 84 (100.0%) | 2 (2.4%) |
| 75 Years and over | 50 (100.0%) | 22 (44.0%) |
| Total | 527 (66.5%) | 158 (19.9%) |
Disability Status by Sex by Age in Brooksville
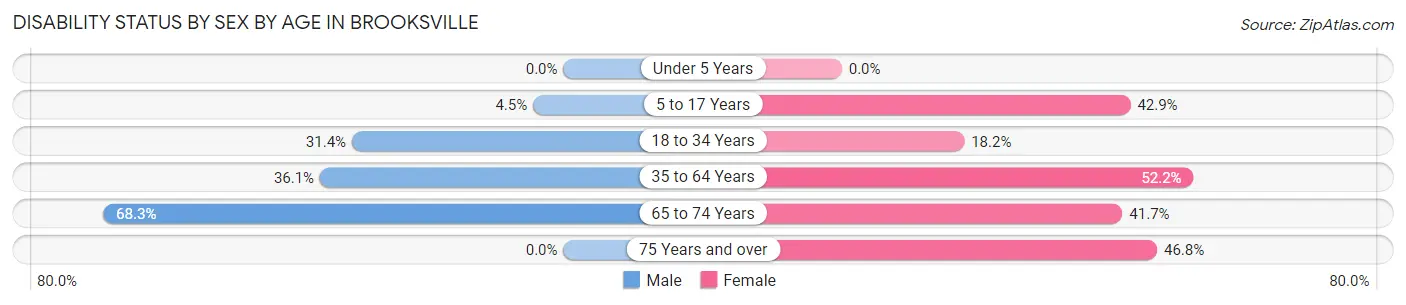
| Age Bracket | Male | Female |
| Under 5 Years | 0 (0.0%) | 0 (0.0%) |
| 5 to 17 Years | 5 (4.5%) | 21 (42.9%) |
| 18 to 34 Years | 27 (31.4%) | 12 (18.2%) |
| 35 to 64 Years | 30 (36.1%) | 118 (52.2%) |
| 65 to 74 Years | 41 (68.3%) | 10 (41.7%) |
| 75 Years and over | 0 (0.0%) | 22 (46.8%) |
Disability Class by Sex by Age in Brooksville
Disability Class: Hearing Difficulty
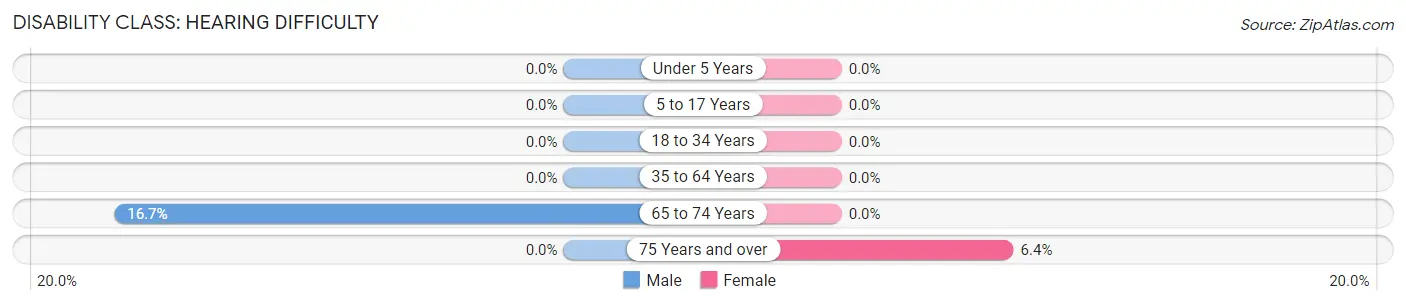
| Age Bracket | Male | Female |
| Under 5 Years | 0 (0.0%) | 0 (0.0%) |
| 5 to 17 Years | 0 (0.0%) | 0 (0.0%) |
| 18 to 34 Years | 0 (0.0%) | 0 (0.0%) |
| 35 to 64 Years | 0 (0.0%) | 0 (0.0%) |
| 65 to 74 Years | 10 (16.7%) | 0 (0.0%) |
| 75 Years and over | 0 (0.0%) | 3 (6.4%) |
Disability Class: Vision Difficulty
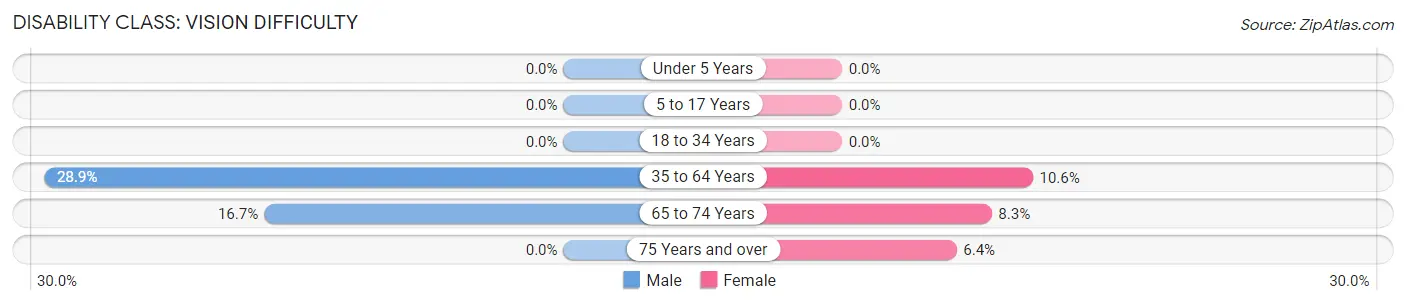
| Age Bracket | Male | Female |
| Under 5 Years | 0 (0.0%) | 0 (0.0%) |
| 5 to 17 Years | 0 (0.0%) | 0 (0.0%) |
| 18 to 34 Years | 0 (0.0%) | 0 (0.0%) |
| 35 to 64 Years | 24 (28.9%) | 24 (10.6%) |
| 65 to 74 Years | 10 (16.7%) | 2 (8.3%) |
| 75 Years and over | 0 (0.0%) | 3 (6.4%) |
Disability Class: Cognitive Difficulty
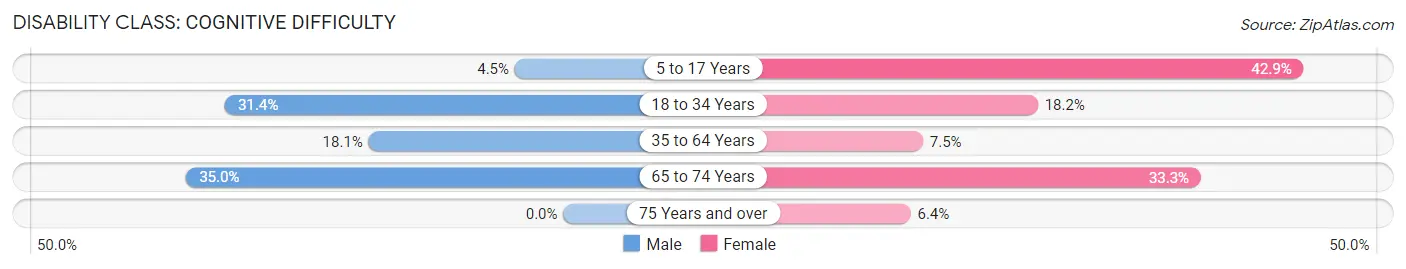
| Age Bracket | Male | Female |
| 5 to 17 Years | 5 (4.5%) | 21 (42.9%) |
| 18 to 34 Years | 27 (31.4%) | 12 (18.2%) |
| 35 to 64 Years | 15 (18.1%) | 17 (7.5%) |
| 65 to 74 Years | 21 (35.0%) | 8 (33.3%) |
| 75 Years and over | 0 (0.0%) | 3 (6.4%) |
Disability Class: Ambulatory Difficulty
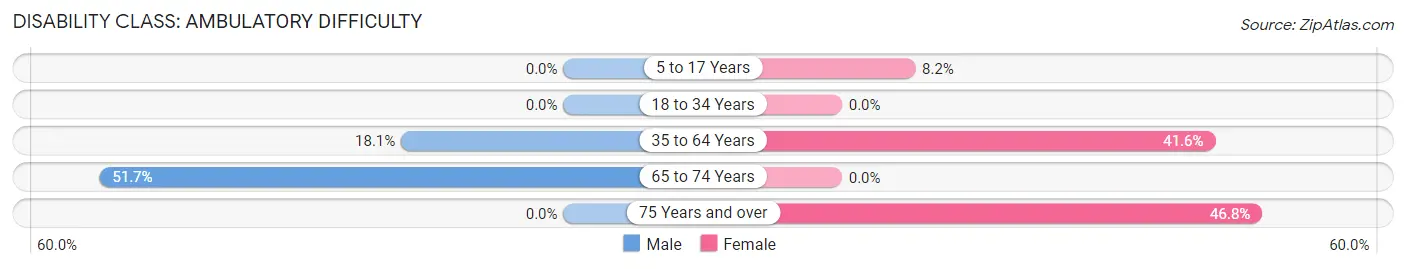
| Age Bracket | Male | Female |
| 5 to 17 Years | 0 (0.0%) | 4 (8.2%) |
| 18 to 34 Years | 0 (0.0%) | 0 (0.0%) |
| 35 to 64 Years | 15 (18.1%) | 94 (41.6%) |
| 65 to 74 Years | 31 (51.7%) | 0 (0.0%) |
| 75 Years and over | 0 (0.0%) | 22 (46.8%) |
Disability Class: Self-Care Difficulty
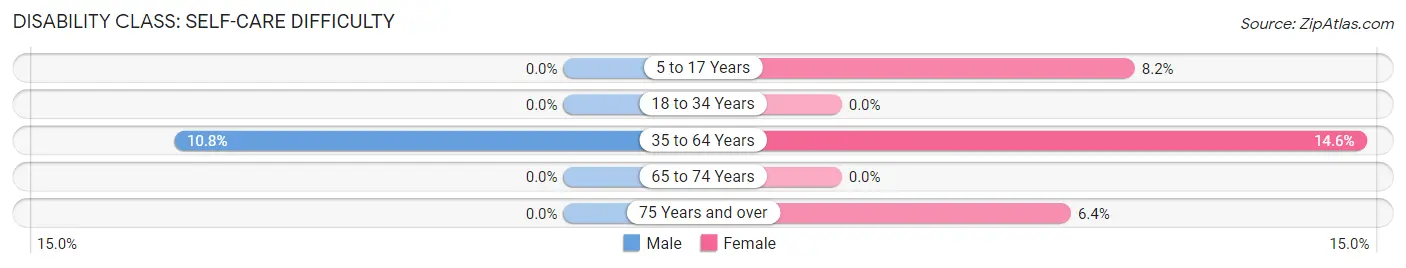
| Age Bracket | Male | Female |
| 5 to 17 Years | 0 (0.0%) | 4 (8.2%) |
| 18 to 34 Years | 0 (0.0%) | 0 (0.0%) |
| 35 to 64 Years | 9 (10.8%) | 33 (14.6%) |
| 65 to 74 Years | 0 (0.0%) | 0 (0.0%) |
| 75 Years and over | 0 (0.0%) | 3 (6.4%) |
Technology Access in Brooksville
Computing Device Access in Brooksville
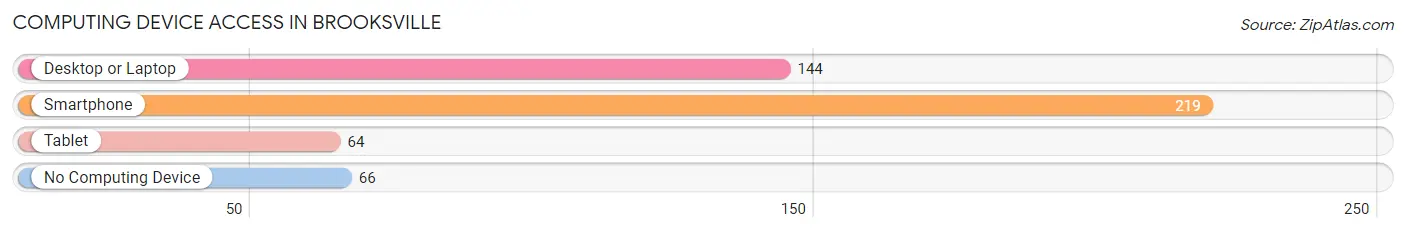
| Device Type | # Households | % Households |
| Desktop or Laptop | 144 | 48.3% |
| Smartphone | 219 | 73.5% |
| Tablet | 64 | 21.5% |
| No Computing Device | 66 | 22.2% |
| Total | 298 | 100.0% |
Internet Access in Brooksville
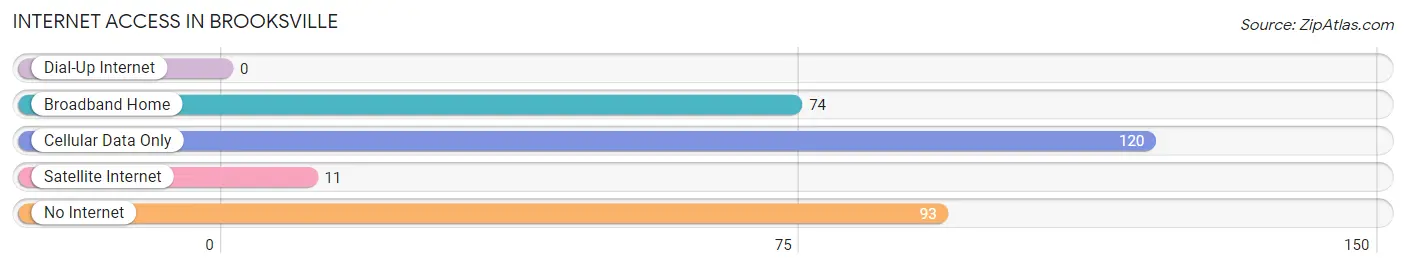
| Internet Type | # Households | % Households |
| Dial-Up Internet | 0 | 0.0% |
| Broadband Home | 74 | 24.8% |
| Cellular Data Only | 120 | 40.3% |
| Satellite Internet | 11 | 3.7% |
| No Internet | 93 | 31.2% |
| Total | 298 | 100.0% |
Brooksville Summary
Brooksville, Mississippi is a small town located in the northern part of the state, in the county of Noxubee. It is situated on the banks of the Tombigbee River, and is part of the Golden Triangle region of Mississippi. The town has a population of approximately 1,000 people, and is known for its rural charm and friendly atmosphere.
History
The area that is now Brooksville was first settled in the early 1800s by a group of settlers from Georgia. The town was originally known as “Brooks’ Settlement”, after the family that founded it. In 1837, the town was officially incorporated as Brooksville.
During the Civil War, Brooksville was a major supply center for the Confederate Army. The town was also the site of a major battle in 1864, when Union forces attempted to capture the town. The battle was unsuccessful, and the town remained in Confederate hands.
After the war, the town began to grow and prosper. The railroad arrived in 1872, and the town became a major shipping center for cotton and other agricultural products. The town also became a popular tourist destination, with many visitors coming to enjoy the natural beauty of the area.
Geography
Brooksville is located in the northern part of Mississippi, in the county of Noxubee. It is situated on the banks of the Tombigbee River, and is part of the Golden Triangle region of Mississippi. The town is surrounded by rolling hills and forests, and is known for its rural charm and friendly atmosphere.
The climate in Brooksville is humid subtropical, with hot, humid summers and mild winters. The average annual temperature is around 70 degrees Fahrenheit, and the average annual precipitation is around 50 inches.
Economy
The economy of Brooksville is largely based on agriculture. The town is home to several large farms, which produce cotton, soybeans, corn, and other crops. The town is also home to several small businesses, including restaurants, retail stores, and service providers.
The town is also home to several manufacturing companies, which produce a variety of products, including furniture, clothing, and automotive parts. The town is also home to several educational institutions, including a community college and a vocational school.
Demographics
As of the 2010 census, the population of Brooksville was 1,000 people. The racial makeup of the town was 79.2% White, 18.2% African American, 0.7% Native American, 0.3% Asian, and 1.6% from other races. The median household income was $30,000, and the median family income was $35,000.
The town is home to several churches, including Baptist, Methodist, and Presbyterian. The town is also home to several schools, including a public elementary school, a middle school, and a high school.
Conclusion
Brooksville, Mississippi is a small town located in the northern part of the state, in the county of Noxubee. It is situated on the banks of the Tombigbee River, and is part of the Golden Triangle region of Mississippi. The town has a population of approximately 1,000 people, and is known for its rural charm and friendly atmosphere. The economy of Brooksville is largely based on agriculture, and the town is home to several small businesses, manufacturing companies, and educational institutions. The racial makeup of the town is 79.2% White, 18.2% African American, 0.7% Native American, 0.3% Asian, and 1.6% from other races. The median household income was $30,000, and the median family income was $35,000.
Common Questions
What is Per Capita Income in Brooksville?
Per Capita income in Brooksville is $13,798.
What is the Median Family Income in Brooksville?
Median Family Income in Brooksville is $43,158.
What is the Median Household income in Brooksville?
Median Household Income in Brooksville is $22,692.
What is Inequality or Gini Index in Brooksville?
Inequality or Gini Index in Brooksville is 0.47.
What is the Total Population of Brooksville?
Total Population of Brooksville is 799.
What is the Total Male Population of Brooksville?
Total Male Population of Brooksville is 357.
What is the Total Female Population of Brooksville?
Total Female Population of Brooksville is 442.
What is the Ratio of Males per 100 Females in Brooksville?
There are 80.77 Males per 100 Females in Brooksville.
What is the Ratio of Females per 100 Males in Brooksville?
There are 123.81 Females per 100 Males in Brooksville.
What is the Median Population Age in Brooksville?
Median Population Age in Brooksville is 36.8 Years.
What is the Average Family Size in Brooksville
Average Family Size in Brooksville is 3.6 People.
What is the Average Household Size in Brooksville
Average Household Size in Brooksville is 2.7 People.
How Large is the Labor Force in Brooksville?
There are 202 People in the Labor Forcein in Brooksville.
What is the Percentage of People in the Labor Force in Brooksville?
33.5% of People are in the Labor Force in Brooksville.
What is the Unemployment Rate in Brooksville?
Unemployment Rate in Brooksville is 13.4%.